Article

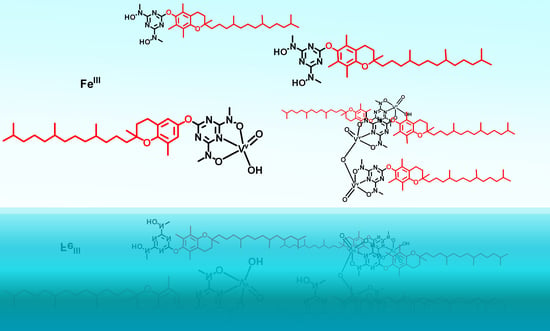
Vanadium(V) Complexes with Siderophore Vitamin E-Hydroxylamino-Triazine Ligands

by
Maria Loizou
1,
Ioanna Hadjiadamou
1,
Chryssoula Drouza
2,*,
Anastasios D. Keramidas
1,*,
Yannis V. Simos
3,* and
Dimitrios Peschos
3
1
Department of Chemistry, University of Cyprus, Nicosia 2901, Cyprus
2
Department of Agricultural Production, Biotechnology and Food Science, Cyprus University of Technology, Limassol 3036, Cyprus
3
Department of Physiology, Faculty of Medicine, School of Health Sciences, University of Ioannina, 45110 Ioannina, Greece
*
Authors to whom correspondence should be addressed.
Submission received: 21 July 2021 / Revised: 25 September 2021 / Accepted: 27 September 2021 / Published: 29 September 2021

Abstract

:
Novel vitamin E chelate siderophore derivatives and their VV and FeIII complexes have been synthesised and the chemical and biological properties have been evaluated. In particular, the α- and δ-tocopherol derivatives with bis-methyldroxylamino triazine (α-tocTHMA) and (δ-tocDPA) as well their VV complexes, [V2VO3(α-tocTHMA)2] and [V2IVO3(δ-tocTHMA)2], have been synthesised and characterised by infrared (IR), nuclear magnetic resonance (NMR), electron paramagnetic resonance (EPR) and ultra violet-visible (UV-Vis) spectroscopies. The dimeric vanadium complexes in solution are in equilibrium with their respefrctive monomers, H2O + [V2VO2(μ-O)]4+ = 2 [VVO(OH)]2+. The two amphiphilic vanadium complexes exhibit enhanced hydrolytic stability. EPR shows that the complexes in lipophilic matrix are mild radical initiators. Evaluation of their biological activity shows that the compounds do not exhibit any significant cytotoxicity to cells.

Graphical Abstract

1. Introduction

The understanding of the physiological role of vanadium ions in biological systems as well as the biological activity of vanadium compounds have stimulated the interest of the scientific community towards the vanadium chemistry [1,2,3,4,5,6,7,8]. Pharmaceuticals based on vanadium complexes have attracted the interest of scientists due to the biological activity of vanadium molecules and their low toxicity [4,5,9,10,11,12,13,14,15,16,17,18,19]. In addition, vanadium compounds exert antitumor effects through activation of apoptotic pathways, cell cycle arrest and the generation of Reactive Oxygen Species (ROS), inducing lower toxicity than anticancer platinum-based molecules [4,20,21,22,23,24,25].
α-Tocopherol acts in biological organisms as a strong lipophilic antioxidant, without any other biological activity. However, the vitamin E (tocopheryl and tocotrienyl) derivatives, such as α-tocopheryl succinate, have anticancer properties [26,27,28,29,30,31,32,33,34]. The hydrophobic domain of the vitamers of vitamin E is responsible for docking the agents in circulating lipoproteins and biological membranes [35]. Conjugate molecules of vitamin E vitamers with pharmaceuticals, such as metal complexes, can be used to transfer the drug in the active site of vitamin E vitamers, inducing biological responses.
Recently, we reported the first study of the synthesis of complexes comprising tocopherol ligating to metals [36]. The ligands in this study are β-tocopherol molecules substituted with chelate groups in o-position derivatives (Scheme 1, H3β-tocDEA), thus, enabling coordination of the metal ion from the phenolic oxygen. The [VVO(β-tocDEA)] has been found to be cytotoxic to cancer cells. Some of the features of these amphiphilic vanadium complexes have been their ability to induce the formation of free radicals [37], and their higher stability in aqueous solutions than the respective counterparts deprived of their lipophilic part. The hydrolytic stability of the vanadium complexes is enhanced in amphiphilic media [36,38,39], therefore, the high hydrolytic stability of the amphiphilic vanadium complexes has been attributed to their amphiphilic nature; presumably through a more favourable solvation [40].
Herein, we have attached a siderophore moiety on the phenoxy oxygen of the chromanol (Scheme 1), forming two new ligands, the 2,4-dichloro-6-(((R)-2,5,7,8-tetramethyl-2-((4R,8R)-4,8,12-trimethyltridecyl)chroman-6-yl)oxy)-1,3,5-triazine (H2α-tocTHMA) and 2,4-dichloro-6-(((R)-2,8-dimethyl-2-((4R,8R)-4,8,12-trimethyltridecyl)chroman-6-yl)oxy)-1,3,5-triazine(H2δ-tocTHMA). The labile hydrogen atom of the hydroxy group has been replaced with the triazine moiety forming an inert ether bond and, thus, the new organic molecules will act as ligand owing lower antioxidant activity than free tocopherols; the formation of the tocopheryl radical requires deprotonation of chromanol group. In addition, the high lipophilicity of both the tocopherol derivatives and their complexes assures easy penetration in cell membranes [38]. As chelate group for VV we have chosen the siderophore hydroxylamino-triazine (Scheme 1), targeting to enhance the hydrolytic stability of the VV complexes as much as possible. This chelate group, for example in the ligand H2bihyat (Scheme 1) forms very strong complexes with hard acids such as FeIII, VV, MoVI and UVI [41,42,43,44], with FeIII and UVI to exert the higher affinity for this chelate coordination. The VV complexes of this study exhibiting a chromanol hydroxy group unavailable for coordination, present no significant toxicity to cells. These results are in contrast to the high toxicity of the previous reported vanadium complexes, in which the vanadium ion was coordinated directly with the hydroxy group of the chromanol [36].

2. Experimental Section

2.1. Reagents

All reagents were purchased from Aldrich and Merck, (Kenilworth, NJ, USA). Vanadium complexes used for cell viability studies were dissolved in dimethyl sulfoxide (DMSO). DMSO was also used as vehicle control. Microanalyses for C, H and N were performed using a Euro-Vector EA3000 CHN elemental analyser (Milan, Italy). Infrared (IR) spectra were recorder on a Shimadzu Prestige 21, 7102 Riverwood Drive, Columbia, Maryland 21046, U.S.A. MALDI-TOF mass spectra were recorded on a Bruker Autoflex III Smartbeam (Billerica, MA, USA) instrument using α-Cyano-4-hydroxycinnamic acid (HCCA) as matrix.
2,2′-((2-hydroxyoctadecyl)azanediyl)bis(ethan-1-ol) (C18DEA), [VVO(C18DEA)] were prepared according to reference [37].

2.2. Synthesis

2,4-dichloro-6-(((R)-2,5,7,8-tetramethyl-2-((4R,8R)-4,8,12-trimethyltridecyl)chroman-6-yl)oxy)-1,3,5-triazine (H2α-tocTCL). Cyanuric chloride (1.86 g, 10.0 mmol) and N,N-diisopropylethylamine (1.45 g, 11.2 mmol) were dissolved in 40 mL of THF. The resulting colourless solution cooled at 0 °C. A THF solution (5 mL) of α-tocopherol (4.31 g, 10.0 mmol) was added to the above solution. The yellow solution was stirred for 24 h at room temperature. Then, the solution was evaporated, and the residue was extracted with chloroform/water. The organic phase was evaporated to give a yellow-orange oil as the product (3.50 g, 61%). 1H-NMR, (300 MHz, CDCl3) δ ppm: 0.85–0.88 (m, 12H, -CH3 methyl groups of the tocopherol), 1.12–1.15 (m, 6H), 1.26 (br s, 10H), 1.35–1.46 (m, 5H), 1.50–1.58 (m, 3H), 1.80–1.85 (m, C16-H), 1.95–1.99 (d, C8-H, C14-H), 2.12 (s, C10-H), 2.60–2.64 (t, C15-H). Elemental Analysis for C32H49Cl2N3O2: Found: C, 66.20; H, 8.88; Ν, 7.13, Calcd.: C, 66.42; H, 8.54; N, 7.26.
2,4-dichloro-6-(((R)-2,8-dimethyl-2-((4R,8R)-4,8,12-trimethyltridecyl)chroman-6-yl)oxy)-1,3,5-triazine (H2δ-tocTCL). Cyanuric chloride (1.95 g, 10.6 mmol) was dissolved in 40 mL of THF with the dropwise addition of N,N-diisopropylethylamine (1.50 g, 11.6 mmol) and the solution cooled at 0 °C. To the resulting solution, equivalent quantity of δ-tocopherol (4.26 g, 10.6 mmol) dissolved in 5 mL of THF was added. The solution was left to stir for 24 h at room temperature and the colour of the solution changed to yellow. The next day the solution was evaporated and extracted with chloroform/water. The chloroform extract was evaporated to give a yellow-orange oil as the product (3.00 g, 52%). 1H-NMR, (300MHz, CDCl3) δ ppm: 0.87–0.90 (m, 12H, -CH3 methyl groups of the tocopherol), 1.10–1.16 (m, 6H), 1.31 (br s, 10H), 1.36–1.45 (m, 5H), 1.52–1.61 (m, 3H), 1.80–1.87 (m, C16-H), 2.16 (s, C10-H), 2.72–2.83 (t, C15-H). Elemental analysis for C30H45Cl2N3O2: Found: C, 65.31; H, 8.33; Ν, 7.28, Calcd.: C, 65.44; H, 8.24; N, 7.63.
Synthesis of N,N′-(6-(((R)-2,5,7,8-tetramethyl-2-((4R,8R)-4,8,12-trimethyltridecyl)chroman-6-yl)oxy)-1,3,5-triazine-2,4-diyl)bis(N-methylhydroxylamine) (H2α-tocTHMA). 1st method: α-tocTCL (3.00 g, 5.18 mmol) was dissolved in THF (120 mL) at 0 °C. A cooled (0 °C) solution of N-Methylhydroxylamine hydrochloride (1.80 g, 21.5 mmol) and sodium hydroxide (0.86 g, 2.2 mmol) in water (10 mL) was added dropwise in the above solution. The reaction mixture was refluxed for 24 h. Then, the solution was evaporated under vacuum to dry, and the residue was extracted with chloroform/water. The organic phase was evaporated under vacuum to dry resulting in H2α-tocTHMA as an orange-brown oil. The yield was 2.1 g, 68%.
2nd method: α-tocTCL (3.00 g, 5.18 mmol) was dissolved in THF (120 mL) at 0 °C. A cooled (0 °C) solution of N-Methylhydroxylamine hydrochloride (1.80 g, 21.5 mmol) and sodium hydroxide (0.86 g, 2.2 mmol) in water (10 mL) was added dropwise to the above solution. The reaction mixture was kept under stirring at room temperature for 4 days. Then, it was evaporated under vacuum to dry, and the residue was dissolved in chloroform and filtrated to remove the insoluble in chloroform NaCl. The solution was evaporated under vacuum to dry yielding H2α-tocTHMA, 2.0 g, 66% as an orange-brown oil. 1H-NMR, (300 MHz, CDCl3) δ ppm: 0.85–0.90 (m, 12H methyl groups of tocopherol), 1.14–1.17 (m, 6H), 1.25–1.27 (br s, 10H), 1.35–1.46 (m, 5H), 1.50–1.57 (m, 3H), 1.79–1.84 (m, C16-H), 1.96–2.00 (d, C8-H, C14-H), 2.11–2.13 (s, C10-H), 2.59–2.62 (t, C15-H), 3.3–2.5 (s, 6H methyl groups of N-methylhydroxylamine). Elemental Analysis for C34H57N5O4: Found: C, 68.29; H, 9.31; Ν, 11.59, Calcd.: C, 68.08; H, 9.58; N, 11.68. [MALDI-TOF(+)-MS]: calcd for (C34H57N5O4Na) {[M + Na]+} m/z 622.43, found 623.13 (100%).
Synthesis of N,N′-(6-(((R)-2,8-dimethyl-2-((4R,8R)-4,8,12-trimethyltridecyl)chroman-6-yl)oxy)-1,3,5-triazine-2,4-diyl)bis(N-methylhydroxylamine) (H2α-tocTHMA). H2δ-tocTHMA was synthesised following the same methodology as for the synthesis of H2α-tocTHMA. The yields were 82% and 53% for the 1st and the 2nd synthetic methods respectively. 1H-NMR, (300 MHz, CDCl3) δ ppm: 0.87–0.90 (m, 12H methyl groups of tocopherol), 1.08–1.19 (m, 6H), 1.26–1.29 (br s, 10H), 1.36–1.48 (m, 5H), 1.52–1.57 (m, 3H), 1.79–1.81 (t, C16-H), 2.14–2.17 (d, C10-H), 2.70–2.75 (t, C15-H), 3.3–2.5 (s, 6H methyl groups of N-methylhydroxylamine), 6.40–6.75 (2 dd, H-aromatic C7, C13). Elemental analysis for C32H53N5O4: Found: C, 67.11; H, 9.18; Ν, 12.07, Calcd.: C, 67.22; H, 9.34; N, 12.25. [MALDI-TOF(+)-MS]: calcd for (C32H53N5O4Na) {[M + Na]+} m/z 594.37, found 595.18 (100%).
Synthesis of [VV2 O2(μ-O)(α-tocTHMA)2], 1. 1st Method: VIVOSO4·5H2O (0.13 g, 0.49 mmol) was stirred in 35 mL MeOH at 35 °C, under nitrogen. Then, H2α-tocTHMA (0.29 g, 0.49 mmol) dissolved in the minimum amount of methanol, was added to the above methanolic solution resulting in a deep brown solution. The solution was stirred for 24 h at room temperature. Then, it was filtered to remove any precipitation, and the filtrate was kept at room temperature for 5 days. During that time a black solid of 1 was formed, which was filtered and dried under vacuum. The yield was 65 mg, 20%.
2nd Method: α-tocTHMA (1.2 g, 2.0 mmol) dissolved in the minimum amount of methanol was added to a stirring methanol solution (40 mL) of [VIVO(acac)2] (0.53 g, 2.0 mmol) under nitrogen. The dark brown solution was stirring at room temperature for 10 min. Then, the solution was filtered, and the filtrate was left unstirred for 5 days, under air, at room temperature. During that time a black solid of 1 was formed which was filtered and dried under vacuum. The yield was 0.35 g, 26%. FTIR (ATR, cm−1): 2924 (C-H), 1580 (C = Ntriazine), 1524 (ar C–C), 1094 (N–O), 966 (V=O), 798 (V-O-V). Elemental analysis for C68H110N10O11V2: Found: C, 60.47.11; H, 8.32; Ν, 10.10, Calcd.: C, 60.70; H, 8.24; N, 10.41. [MALDI-TOF(+)-MS]: calcd for (C34H55N5Na2O6V) {[M-O-M (−M+2Na)]+} m/z 726.34, found 727.19 (100%).
Synthesis of [VV2 O2(μ-O)(δ-tocTHMA)2], 2. Similar with 1 synthetic methodologies were used for the synthesis of 2. The yields were 24% and 19% for the 1st and the 2nd synthetic methods respectively. FTIR (ATR, cm−1): 2928 (C-H), 1578 (C = Ntriazine), 1526 (ar C–C), 1070 (N–O), 964 (V=O), 798 (V-O-V). Elemental analysis for C64H102N10O11V2: Found: C, 59.45; H, 7.83; Ν, 10.47, Calcd.: C, 59.61; H, 7.97; N, 10.86. [MALDI-TOF(+)-MS]: calcd for (C32H52N5Na2O6V) {[M-O-M (−M + 2Na)]+} m/z 698.31, found 699.30 (100%).
Synthesis of [FeIII(α-tocTHMA)(Hα-tocTHMA)], 3. Ferric chloride (0.03 g, 0.20 mmol) was dissolved under Ar in 20 mL MeOH forming a yellow solution. H2α-tocTHMA (0.24 g, 0.40 mmol) dissolved in the minimum amount of methanol was added in the above yellow solution, resulting in a deep blue solution. The solution was filtered, and the filtrate cooled at −18 °C resulting in a black precipitate of 3 which was filtered and dried under vacuum. The yield was 120 mg, 24%. Elemental analysis for C68H111FeN10O8: Found: C, 65.11; H, 8.89; Ν, 10.95, Calcd.: C, 65.21; H, 8.93; N, 11.18. [MALDI-TOF(+)-MS]: calcd for (C34H55N5O4Fe) {[M−L]+} m/z 653.36, found 654.31 (100%).
Synthesis of [FeIII(δ-tocTHMA)(Hδ-tocTHMA)], 4. Complex 4 was synthesised using the same methodology as the one used for 3. The yield was 105 mg, 22%. Elemental analysis for C64H103FeN10O8: Found: C, 64.09; H, 8.81; Ν, 11.69, Calcd.: C, 64.25; H, 8.68; N, 11.71. [MALDI-TOF(+)-MS]: calcd for (C32H51N5O4Fe) {[M−L]+} m/z 625.33, found 626.19 (100%).

2.3. Spectroscopic Studies

All NMR samples were prepared from the dissolution of the solids in CDCl3 or 10% DMSO-d6:90% D2O at room temperature immediately before NMR spectrometric determinations. NMR spectra were recorded on a Bruker Avance 300 spectrometer at 300 MHz for 1H, 75.4 MHz for 13C and 78.9 MHz for 51V NMR. A 30°-pulse width was applied for both the 1H and 51V NMR measurements, and the spectra were acquired with 3000 and 30,000 Hz spectral window, using 1 and 0.1 s relaxation delay respectively. The spectra were analysed using Topspin 4.0 and MultispecNMR 5.0 (https://sourceforge.net/projects/multispecnmr/, accessed on 1 March 2021). 2D [45] grNOESY spectra were obtained by using standard pulse sequences of Bruker Topspin 3.0 software. These spectra were acquired using 256 increments (with 56 scans each) and mixing time 0.43 s.
UV-Vis measurements were recorded on a Photonics UV-Vis spectrophotometer Model 400, equipped with a CCD array, operating in the range 250 to 1000 nm. The spectra were analysed using MultispecUVVIS 5.0 (https://sourceforge.net/projects/multispecuvvis/, accessed on 1 March 2021).

2.4. Reactivity with DPPH

The rate of DPPH consumption was measured by UV-vis spectroscopy at 520 nm for 30 min. Stock solutions of each compound (12 mM) were prepared in dry toluene at room temperature. The final concentrations of the compounds were 80–300 μM, while the concentration of DPPH was 100 μM. The samples were incubated at 25 °C for 4 min. The reaction was initiated by the addition of the DPPH solution. The samples were measured in triplicate. Second-order rate constants were calculated to determine the radical scavenging activity (RSC) of antioxidants. The decay of DPPH from the medium has been assumed to follow pseudo-first-order kinetics, under the conditions of the reaction [DPPH]0, [AH]0. One of the reactants is in large excess compared to the other, so the concentration of the minor component decreased exponentially [46]. The [DPPH] concentration is calculated from Equation (1):
[DPPH] = [DPPH]0 ekobsd t
where [DPPH] is the radical concentration at time t, and [DPPH]0 is the radical concentration at time zero, and kobsd is the pseudo-first-order rate constant. The pseudo-first-order rate constant kobsd was linearly dependent on the concentration of antioxidants [AH], and from the slope of their plot, second-order rate constants (k2) were calculated to evaluate the radical scavenging capacity of each compound.

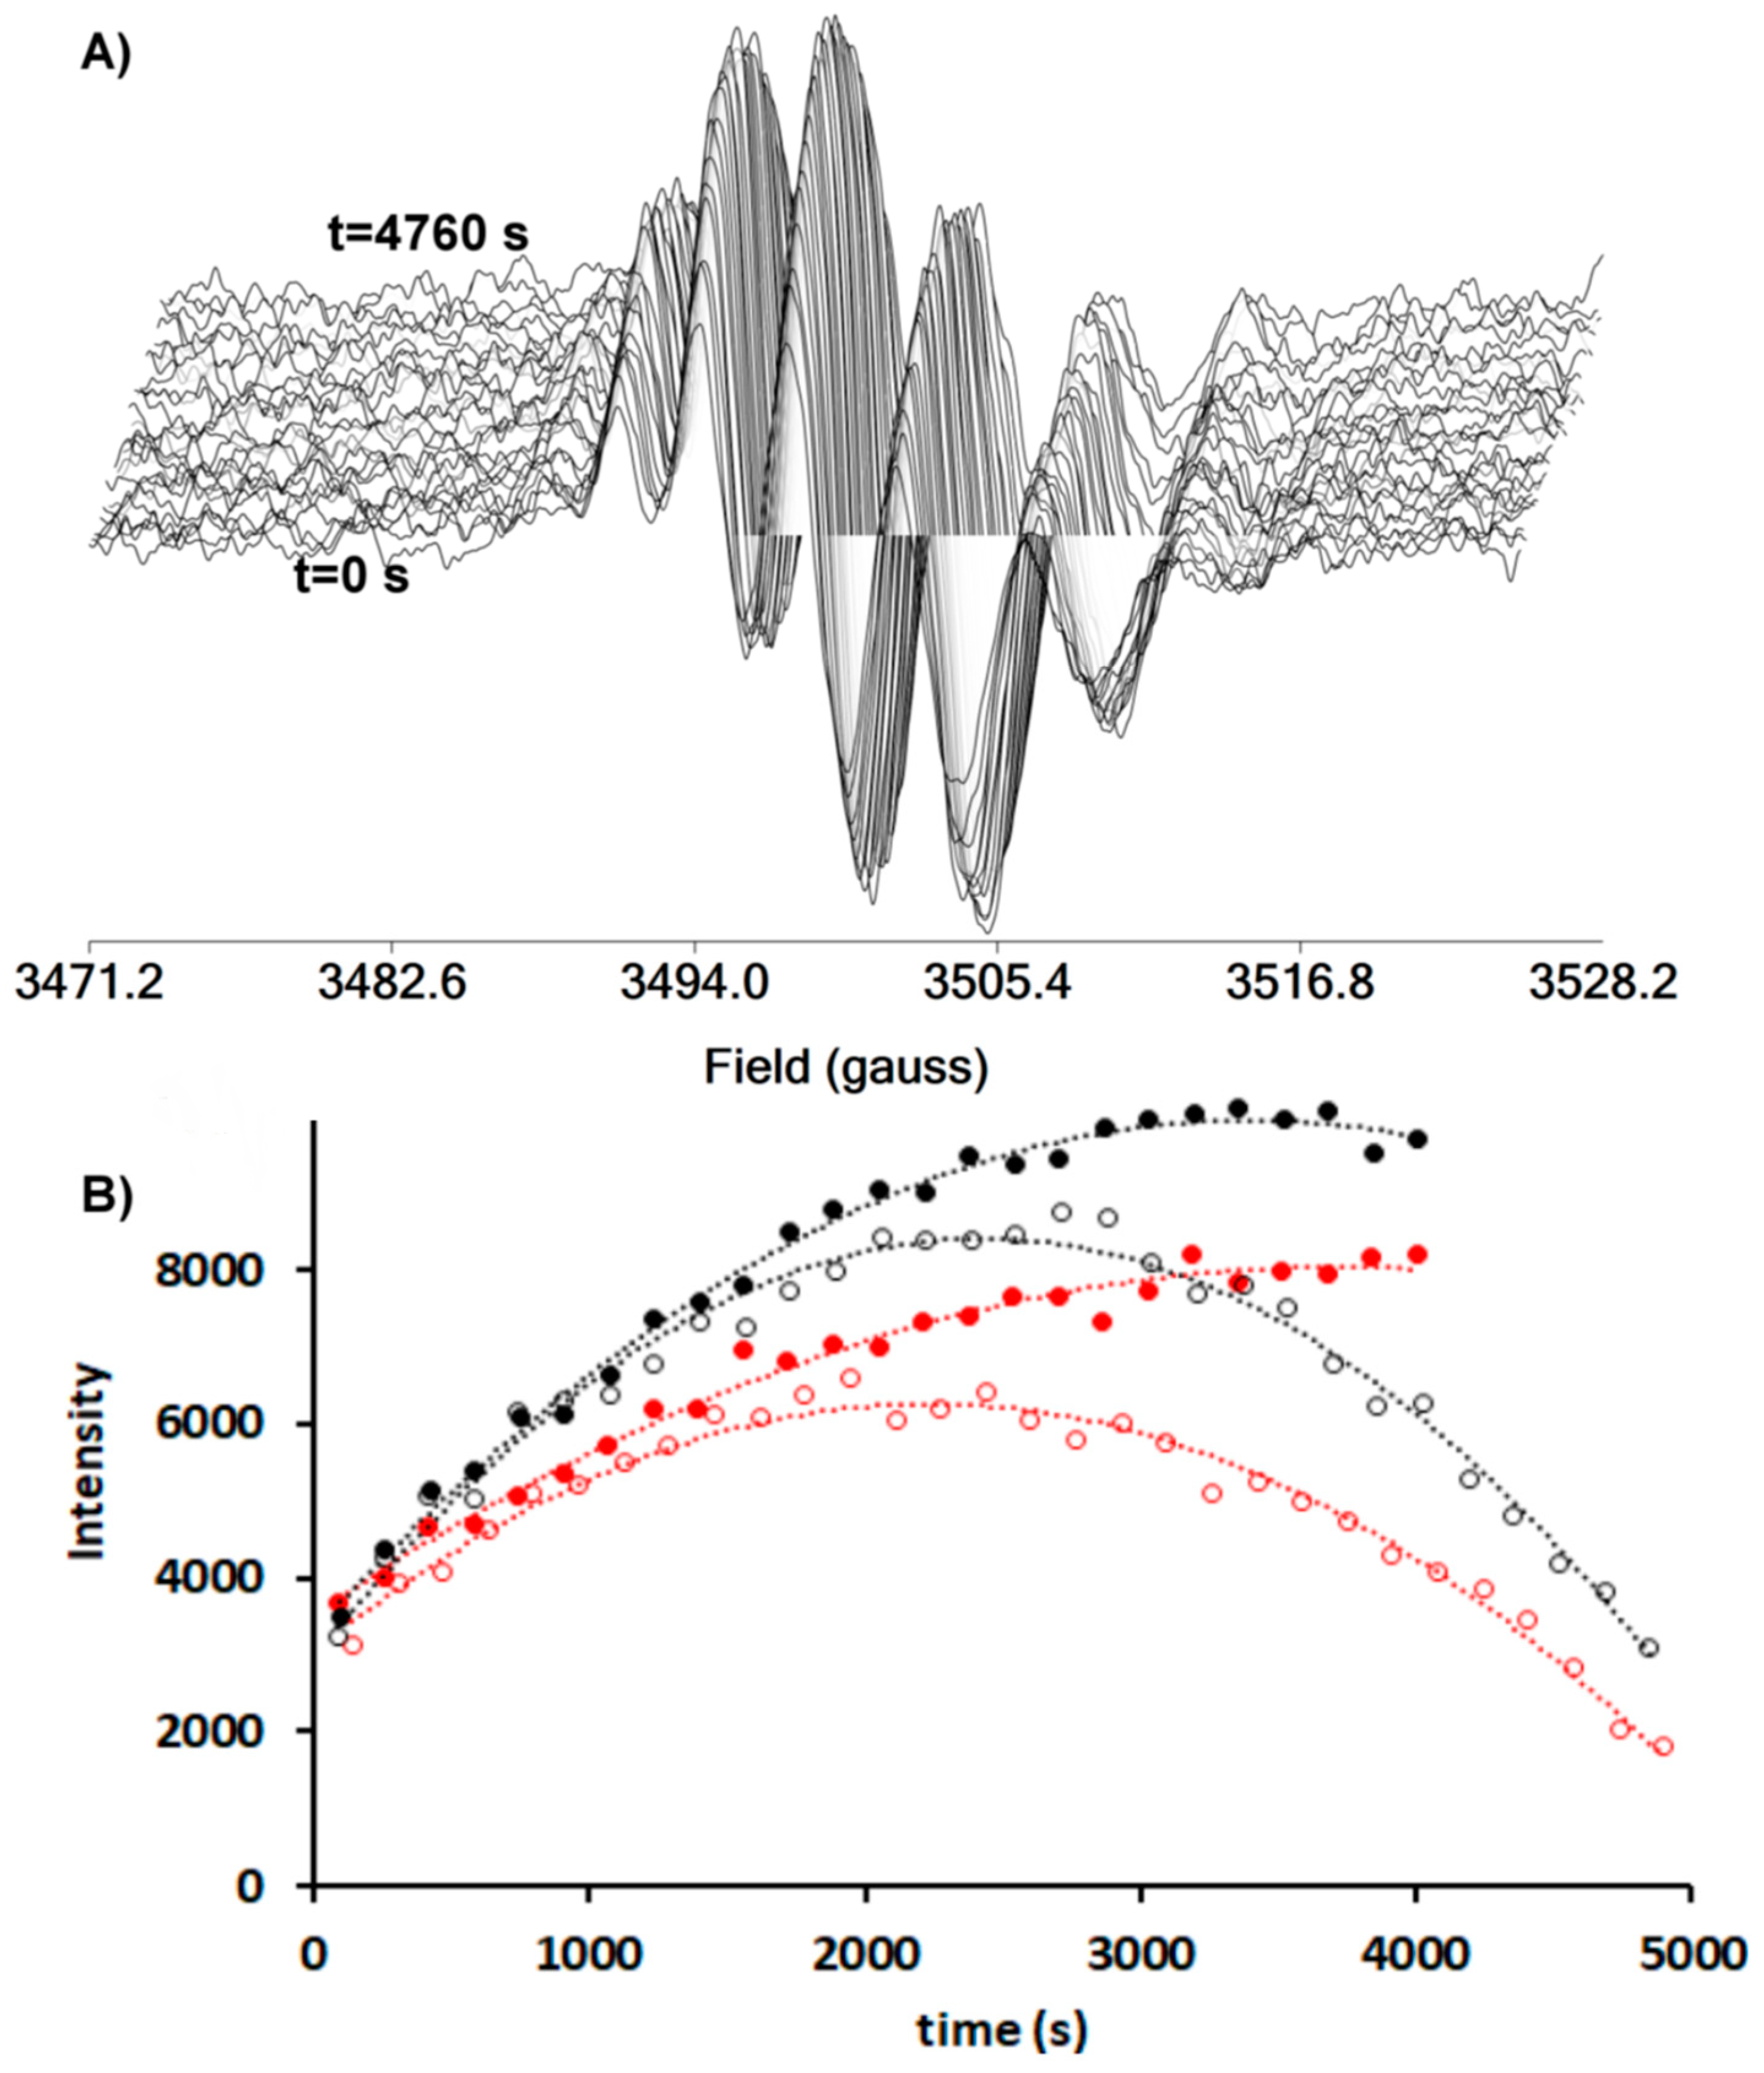
2.5. Measurement of Oxidative Inducing Effect of Vanadium Compounds by EPR Spectroscopy

An ELEXSYS E500 Bruker EPR spectrometer operating at cw X-band, resonance frequency ~9.5 GHz and modulation frequency 100 MHz was used. The resonance frequency was accurately measured with solid DPPH (g = 2.0036). The EPR oxidative inducing effect experiments were conducted by monitoring the evolution of α-tocopheryl radicals versus time [37] at room temperature. The assays were prepared in a 5 mm quartz tube by adding 100 μL or 150 μL of a CHCl3 stock solution (4.95 mM) of complex to 0.500 g of a commercial extra virgin olive oil. Radical initiators are the 1, 2 and [VO(C18DEA)] whereas the addition step consists of the initial time of the reaction, time = 0 min. EPR spectra were recorded for 25- or 30-time domains, each one consisting of 50 scans. The spectra were processed using appropriate software, MultispecEPR 5.0 (https://sourceforge.net/projects/multispecepr/, accessed on 1 March 2021).

2.6. Cell Culture

The human tongue squamous cell carcinoma (Cal33, DSMZ®ACC 447), the human cell line derived from cervical cancer (HeLa, ATCC®CCL-2) and the embryonic mouse fibroblasts (NIH/3T3, CRL-1658™) were used in this study [47]. Cells were grown in monolayer cultures in high glucose Dulbecco’s modified eagle medium (DMEM) supplemented with 10% (v/v) foetal bovine serum, 2 mM l-glutamine and 1% (v/v) penicillin-streptomycin (100×: 10,000 units/mL of penicillin and 10,000 μg/mL streptomycin) in a humidified incubator (5% CO2, 95% air) at 37 °C.

2.7. Measurement of Cell Viability

Cells were plated in 96-well plates at density 5 × 10³ cells/well and treated with the ligands or the complexes for 24 and 48 h. Cell viability was measured after incubation of each well with 50 μL of MTT (stock solution of 3 mg/mL) for 3 h and absorbance was determined at 570 nm (background absorbance measured at 690 nm) using a microplate spectrophotometer (Multiskan Spectrum, Therno Fisher Scientific, Waltham, MA, USA). All experiments were performed in triplicate.
Stock solutions of H2α-tocTHMA and H2δ-tocTHMA and 14 prepared in pure DMSO were diluted into the culture medium so that the final concentration of DMSO was less than 1%. The same amount of DMSO was added to the control sample. Stock solutions were kept at 4 °C.

3. Results and Discussion

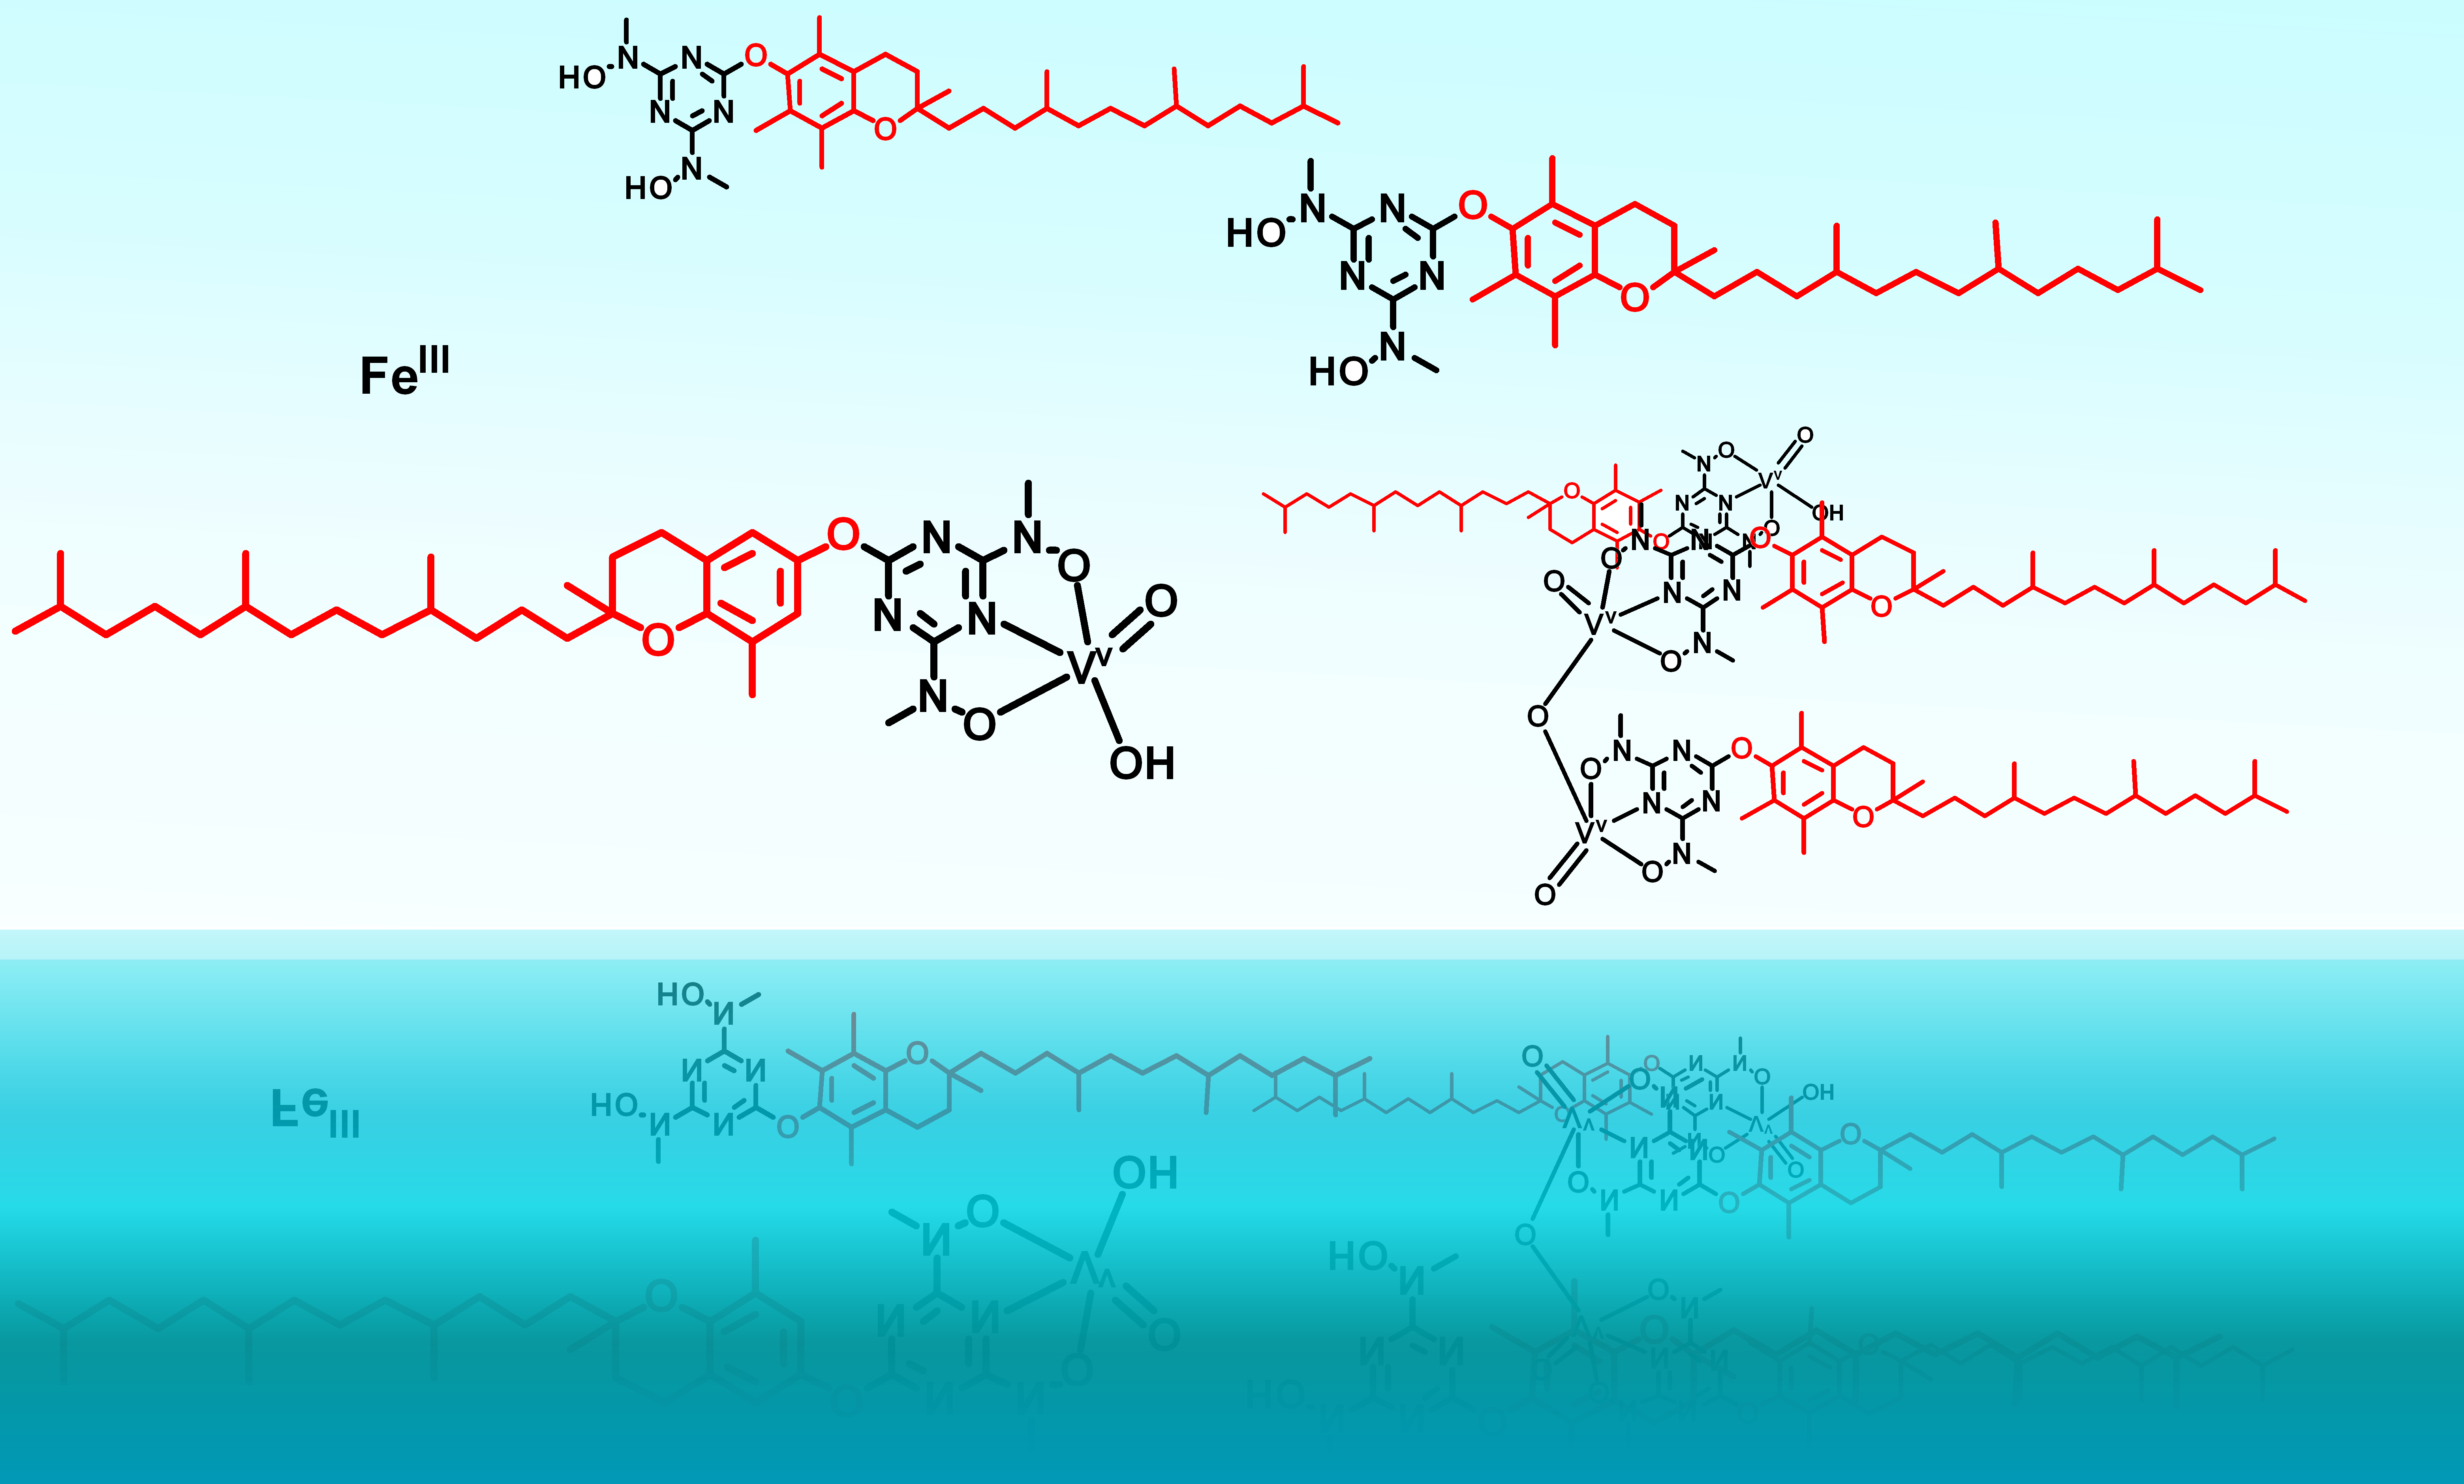
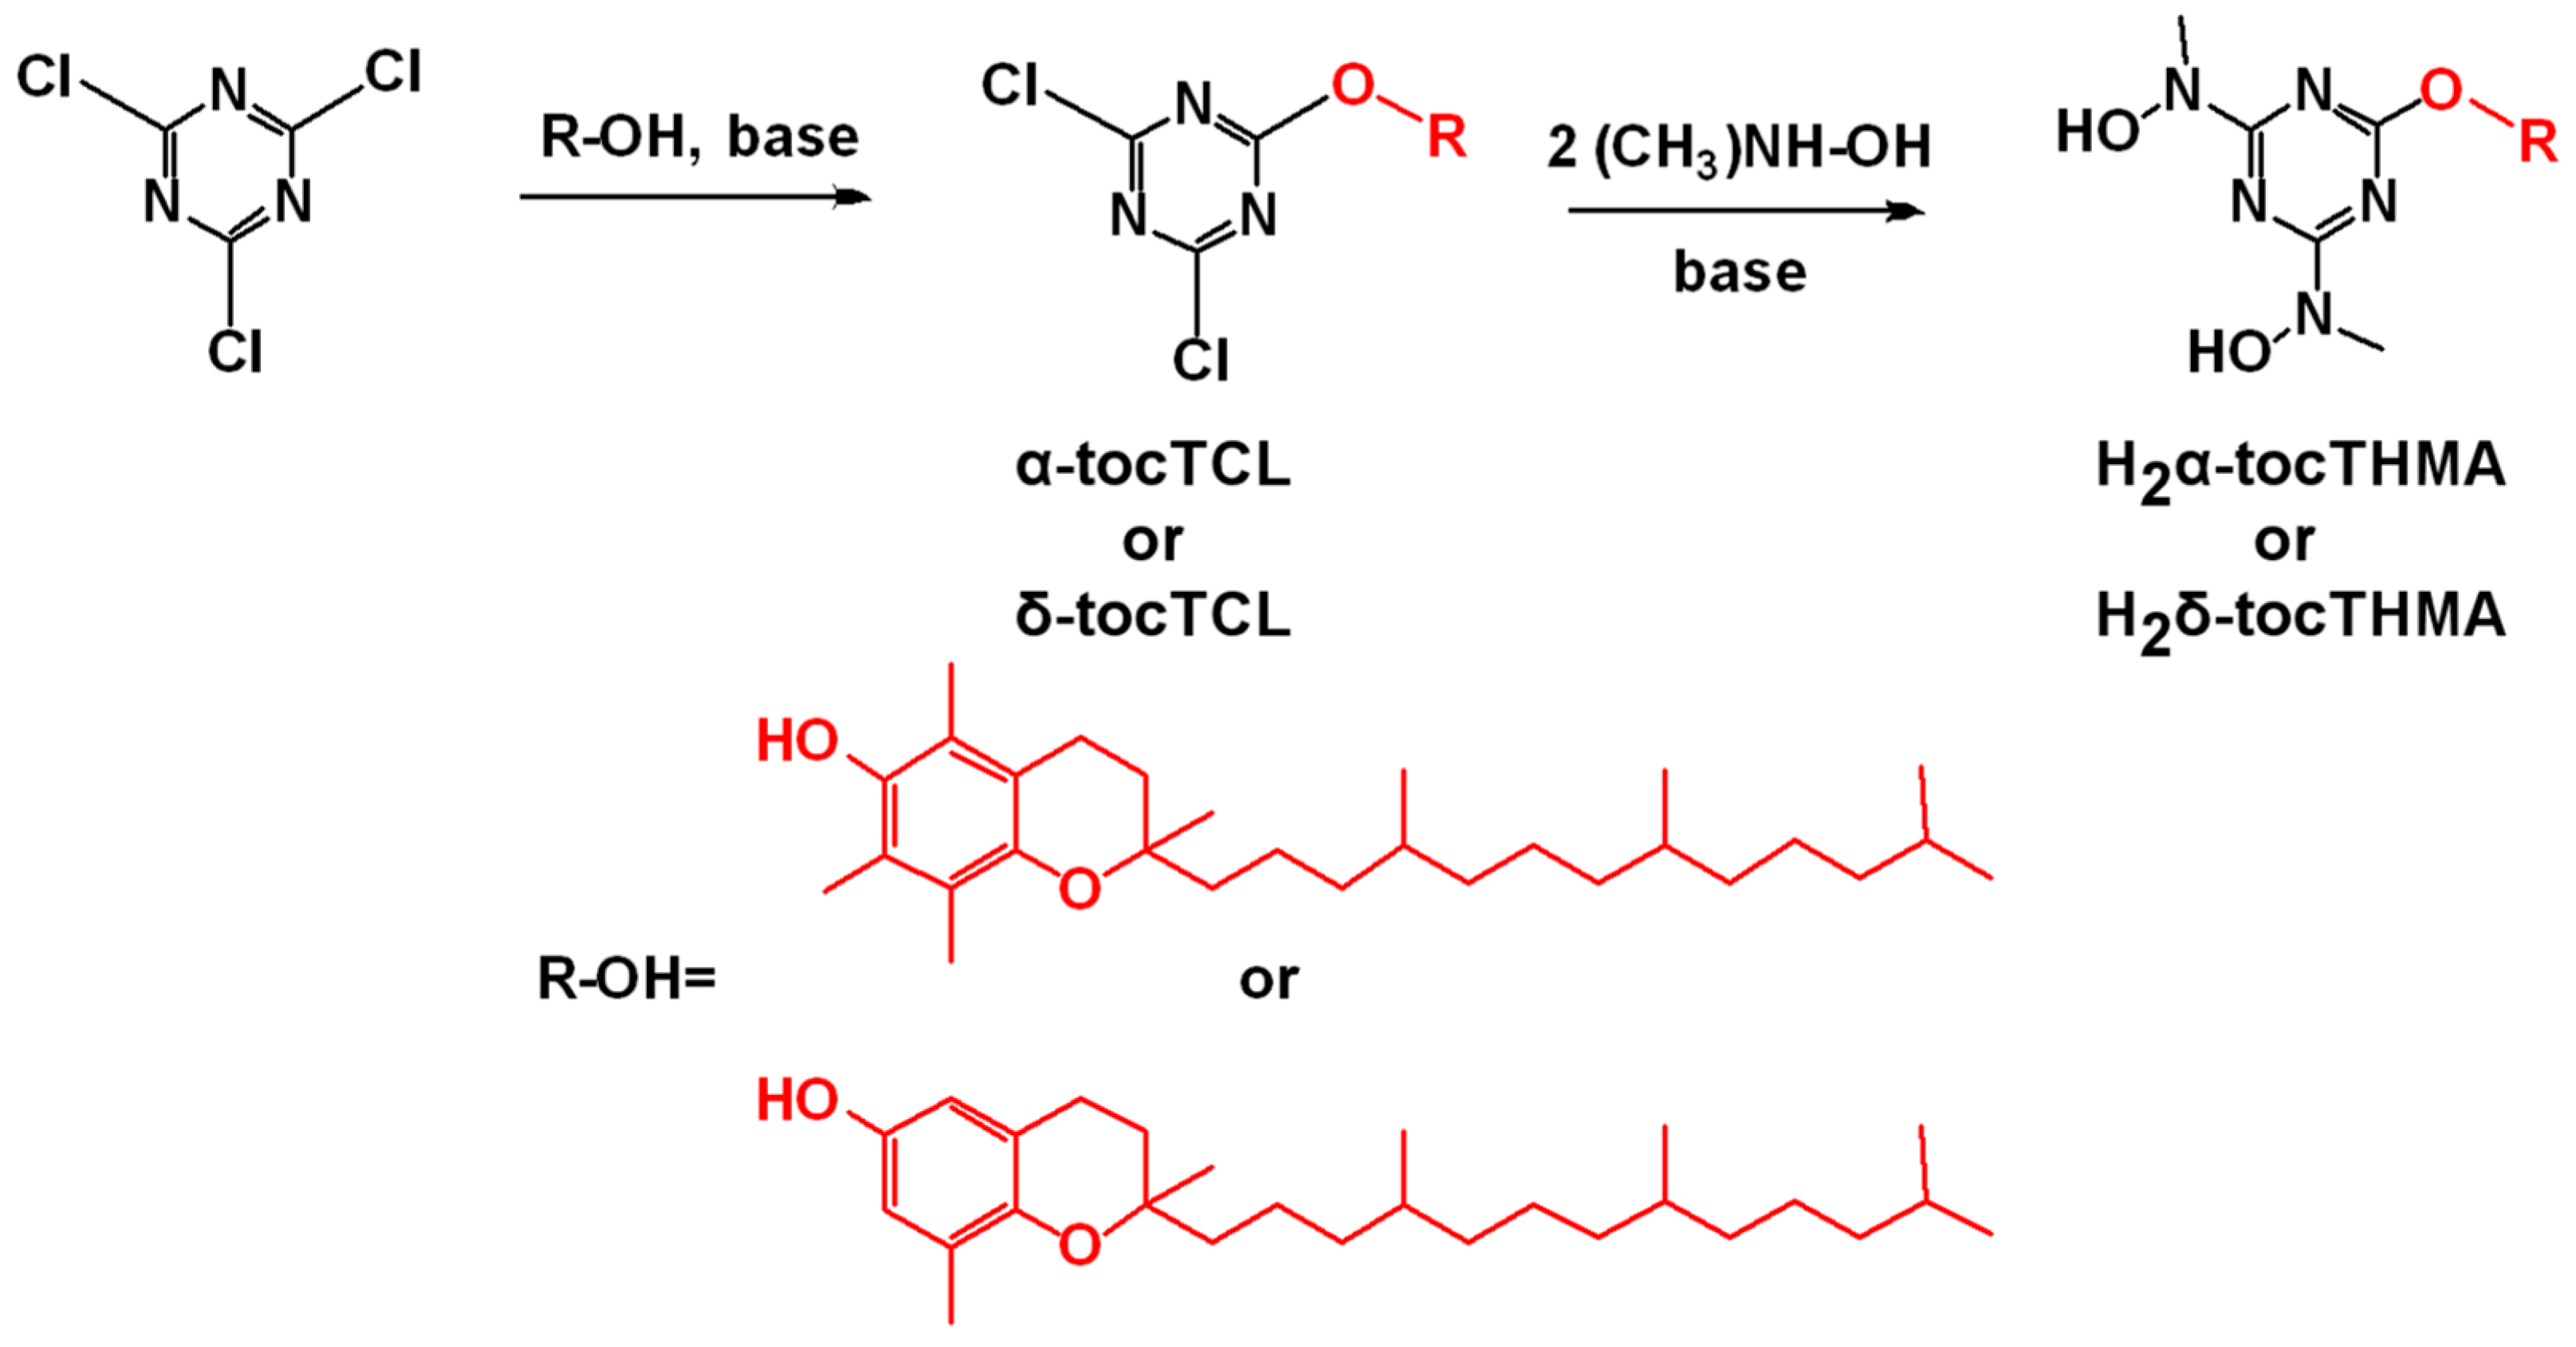
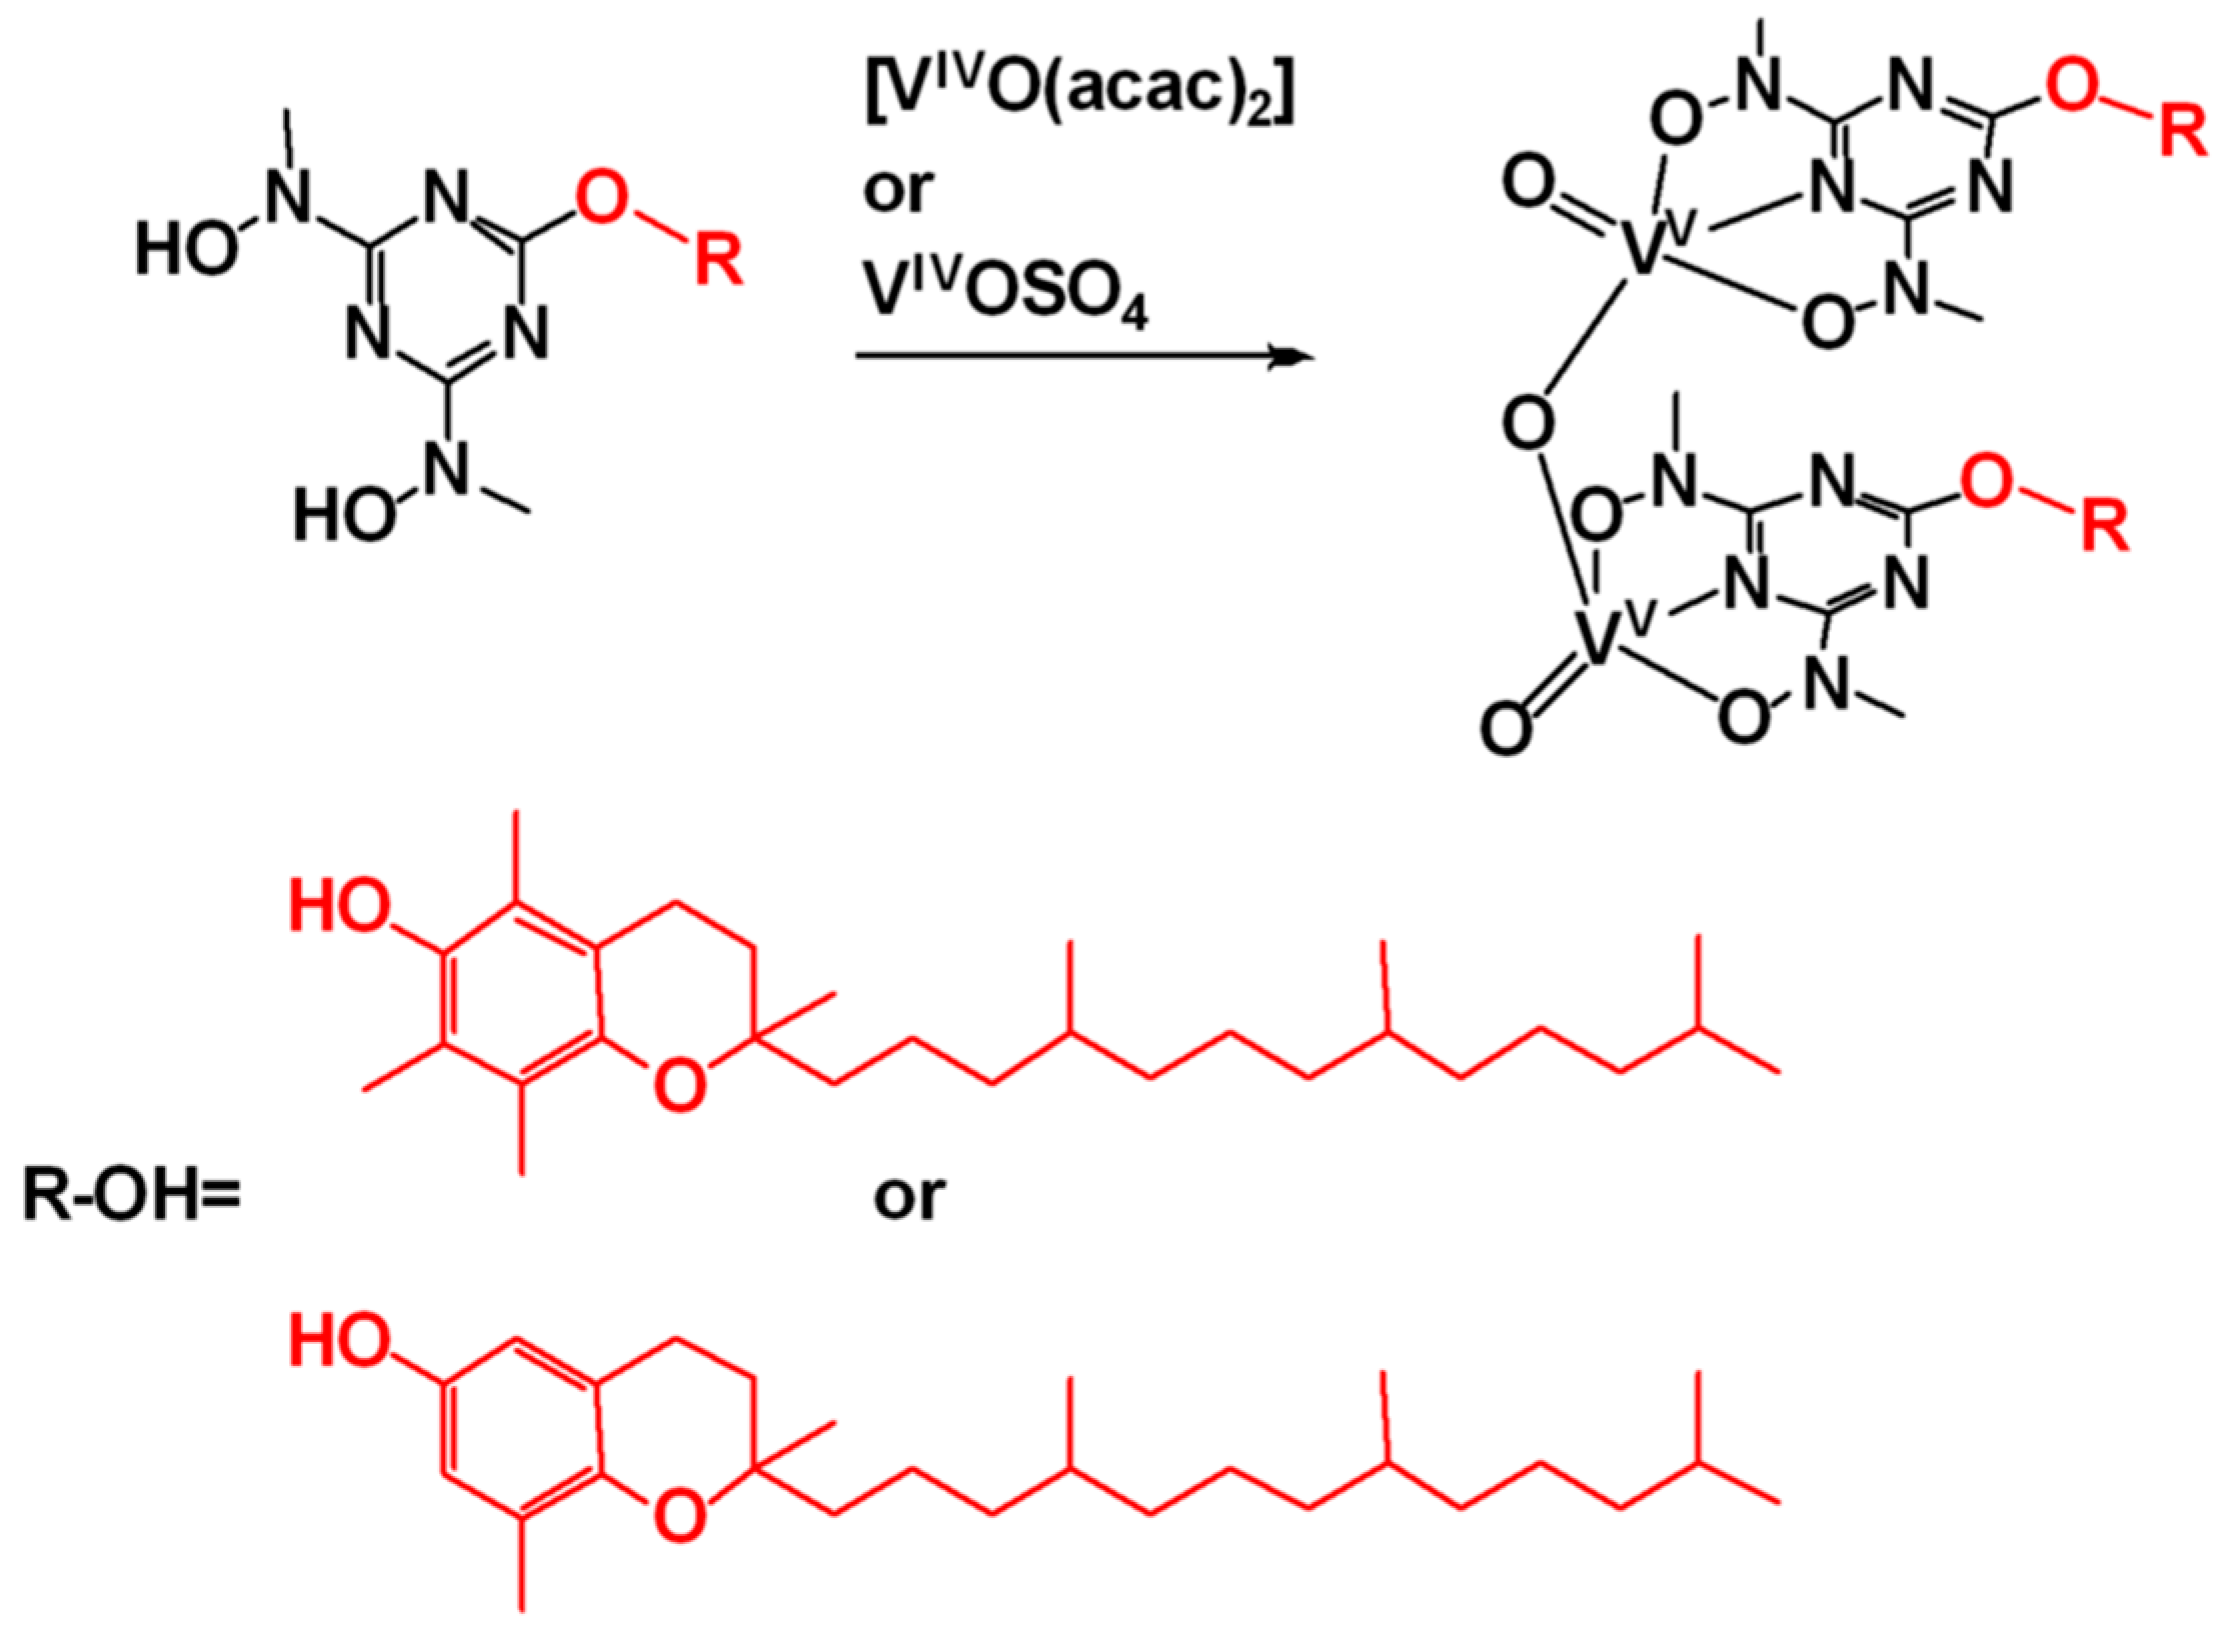
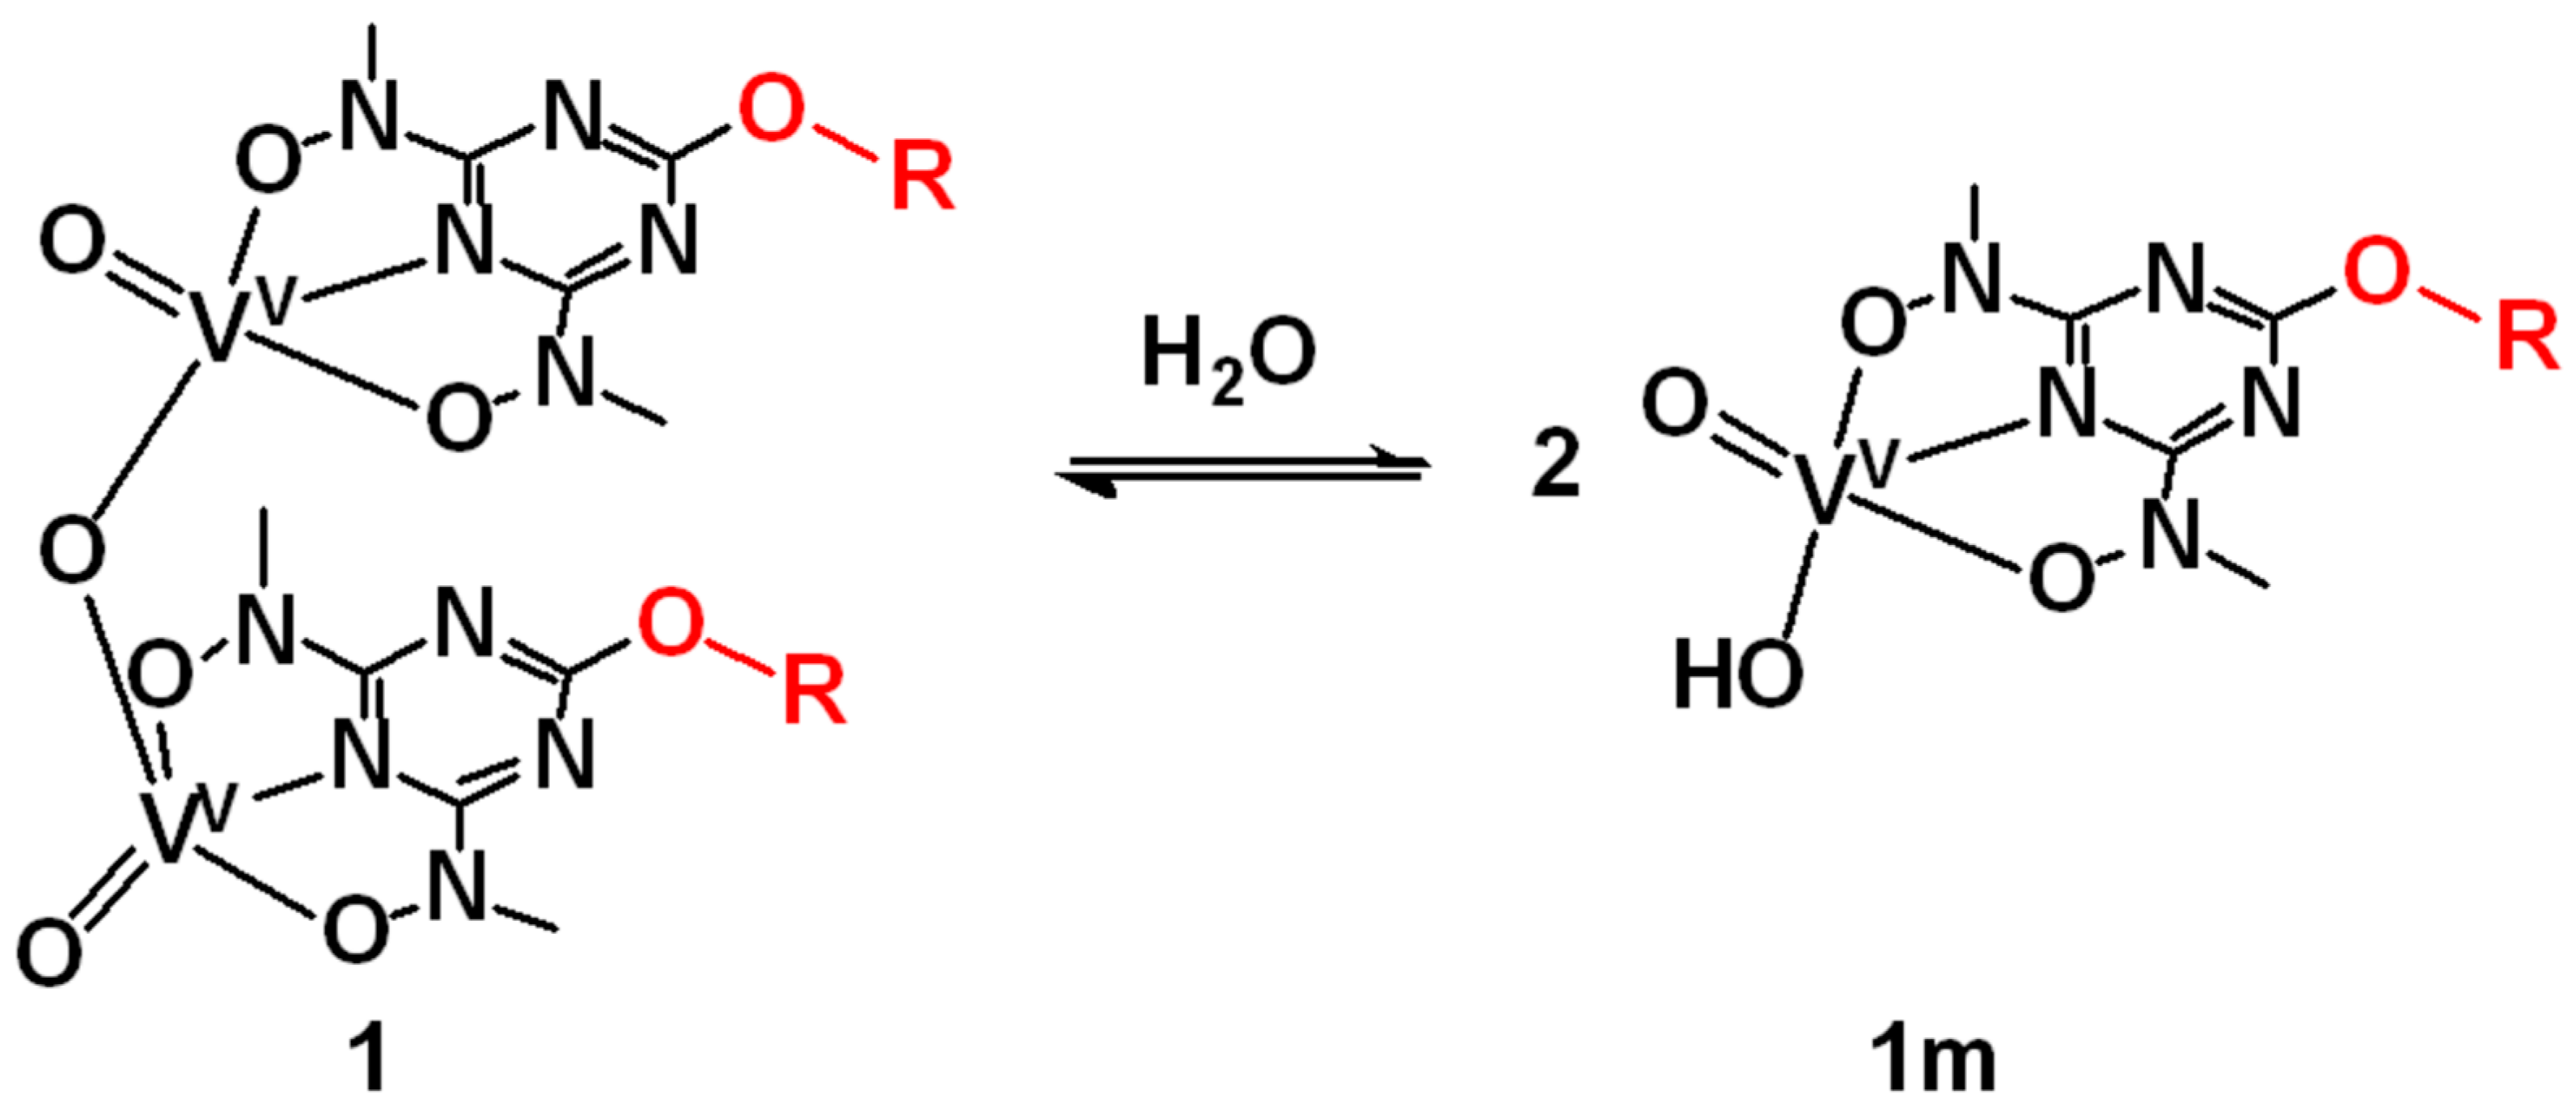
3.1. Synthesis and Characterisation

The triazine tocopherol molecules H2α-tocTHMA and H2δ-tocTHMA were synthesized by two-step substitution reactions of cyanuric chloride. The synthetic process is summarised in Scheme 2.
Reaction of equimolar quantities of H2α-tocTHMA or H2δ-tocTHMA with [VIVO(acac)2] or VIVOSO4 results in the formation of VV complexes 1 and 2 (Scheme 3). The VIV is oxidised to VV by the atmospheric O2. X-band EPR spectroscopy of frozen CHCl3 solutions of either 1 or 2 did not exhibit any signal supporting that all VIV has been oxidised to VV.
The complexes were characterised by elemental analysis, UV-vis, IR and NMR spectroscopies. The structures of the vanadium complexes are based on the data of the experimental analysis and the X-ray structures of the respective VV-bihyat2− complexes [42].

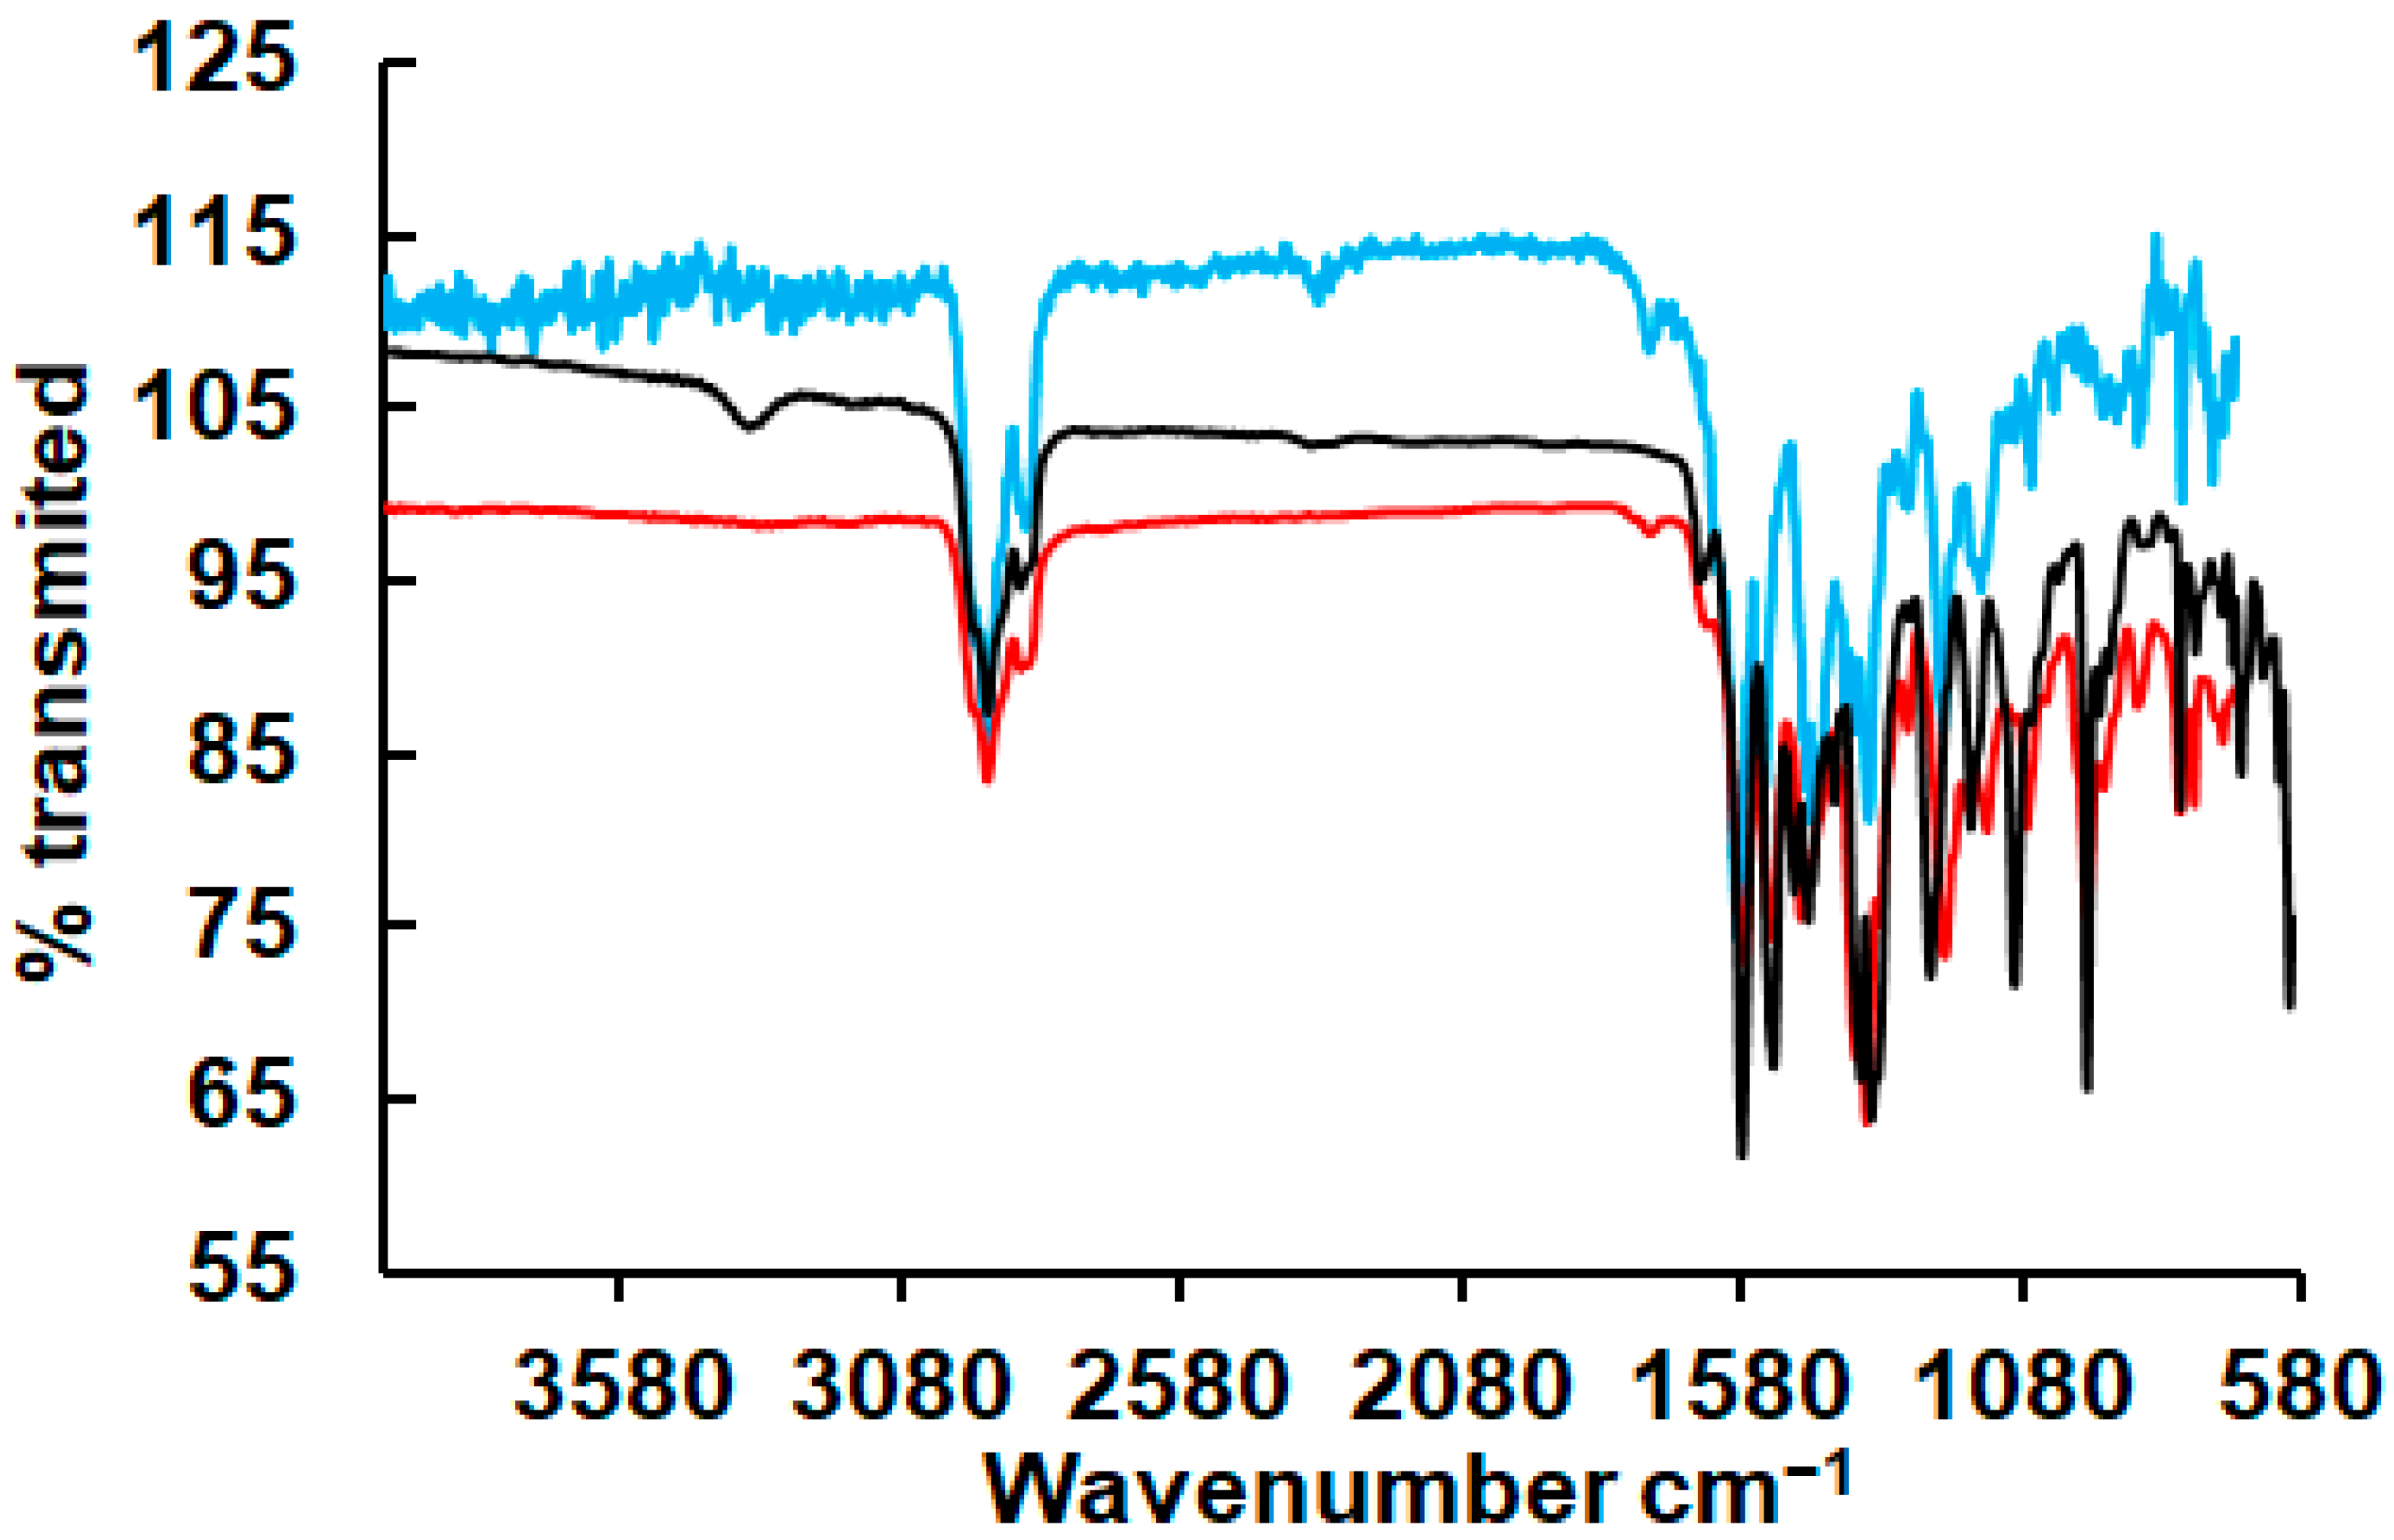
3.2. Complexes Characterisation by IR

The IR spectra of 1 and 2 are shown in Figure 1. Both 1 and 2 gave a strong peak at 966 cm−1 attributed to the stretching of the V=O bond. The peaks at 798 cm−1 are characteristic to V-O-V stretching vibrations [48,49], thus, confirming the dinuclear structure of the complex. The complexes also show two strong stretching N-O vibrations shifted around 80 cm−1 at higher energy compared to the free ligand suggesting coordination of the metal ion from the hydroxylamine-triazine chelating group.
The IR spectra of the complexes 3 and 4 gave peaks at 2952, 2924 and 2896 cm−1 assigned to the C-H stretching of lipid chains. The C=N ring vibrations show peaks at 1569 and 1525 cm−1 whereas Ph-O and N-O stretching vibrations were detected at 1244 and 1093 cm−1 respectively. The N-O peaks are significantly shifted compared to the free ligand (~70 cm−1) due to the ligation of the ligand to FeIII.

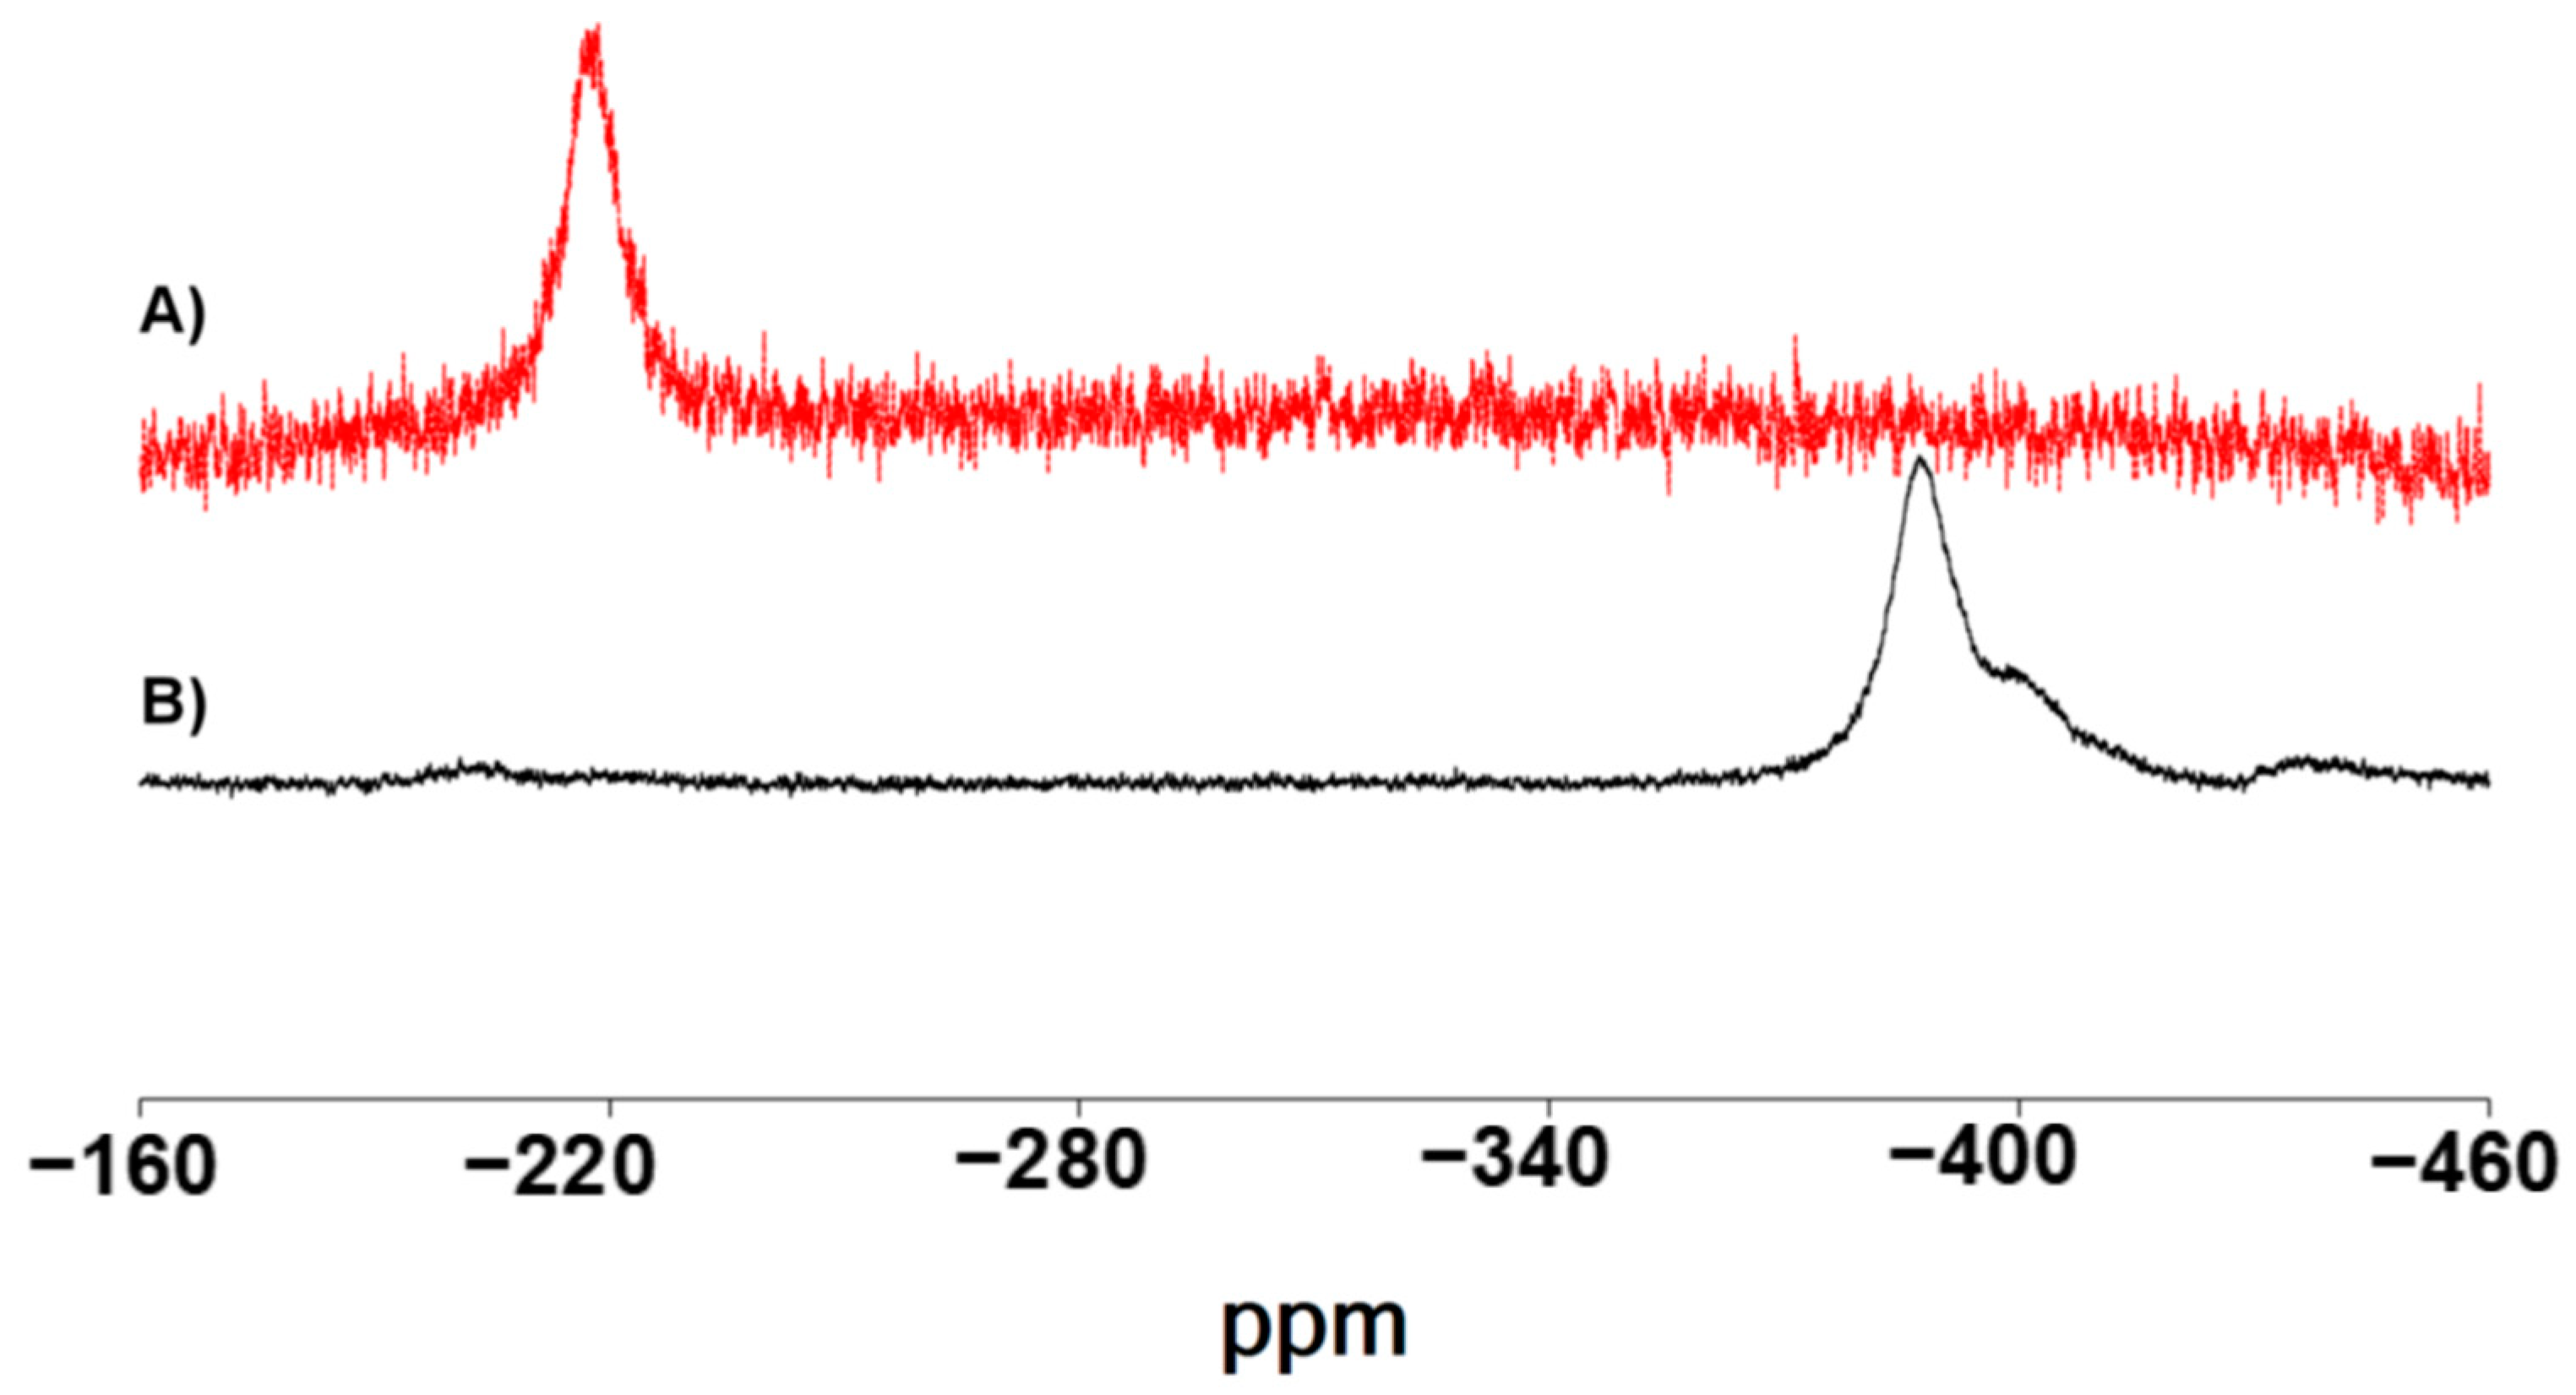
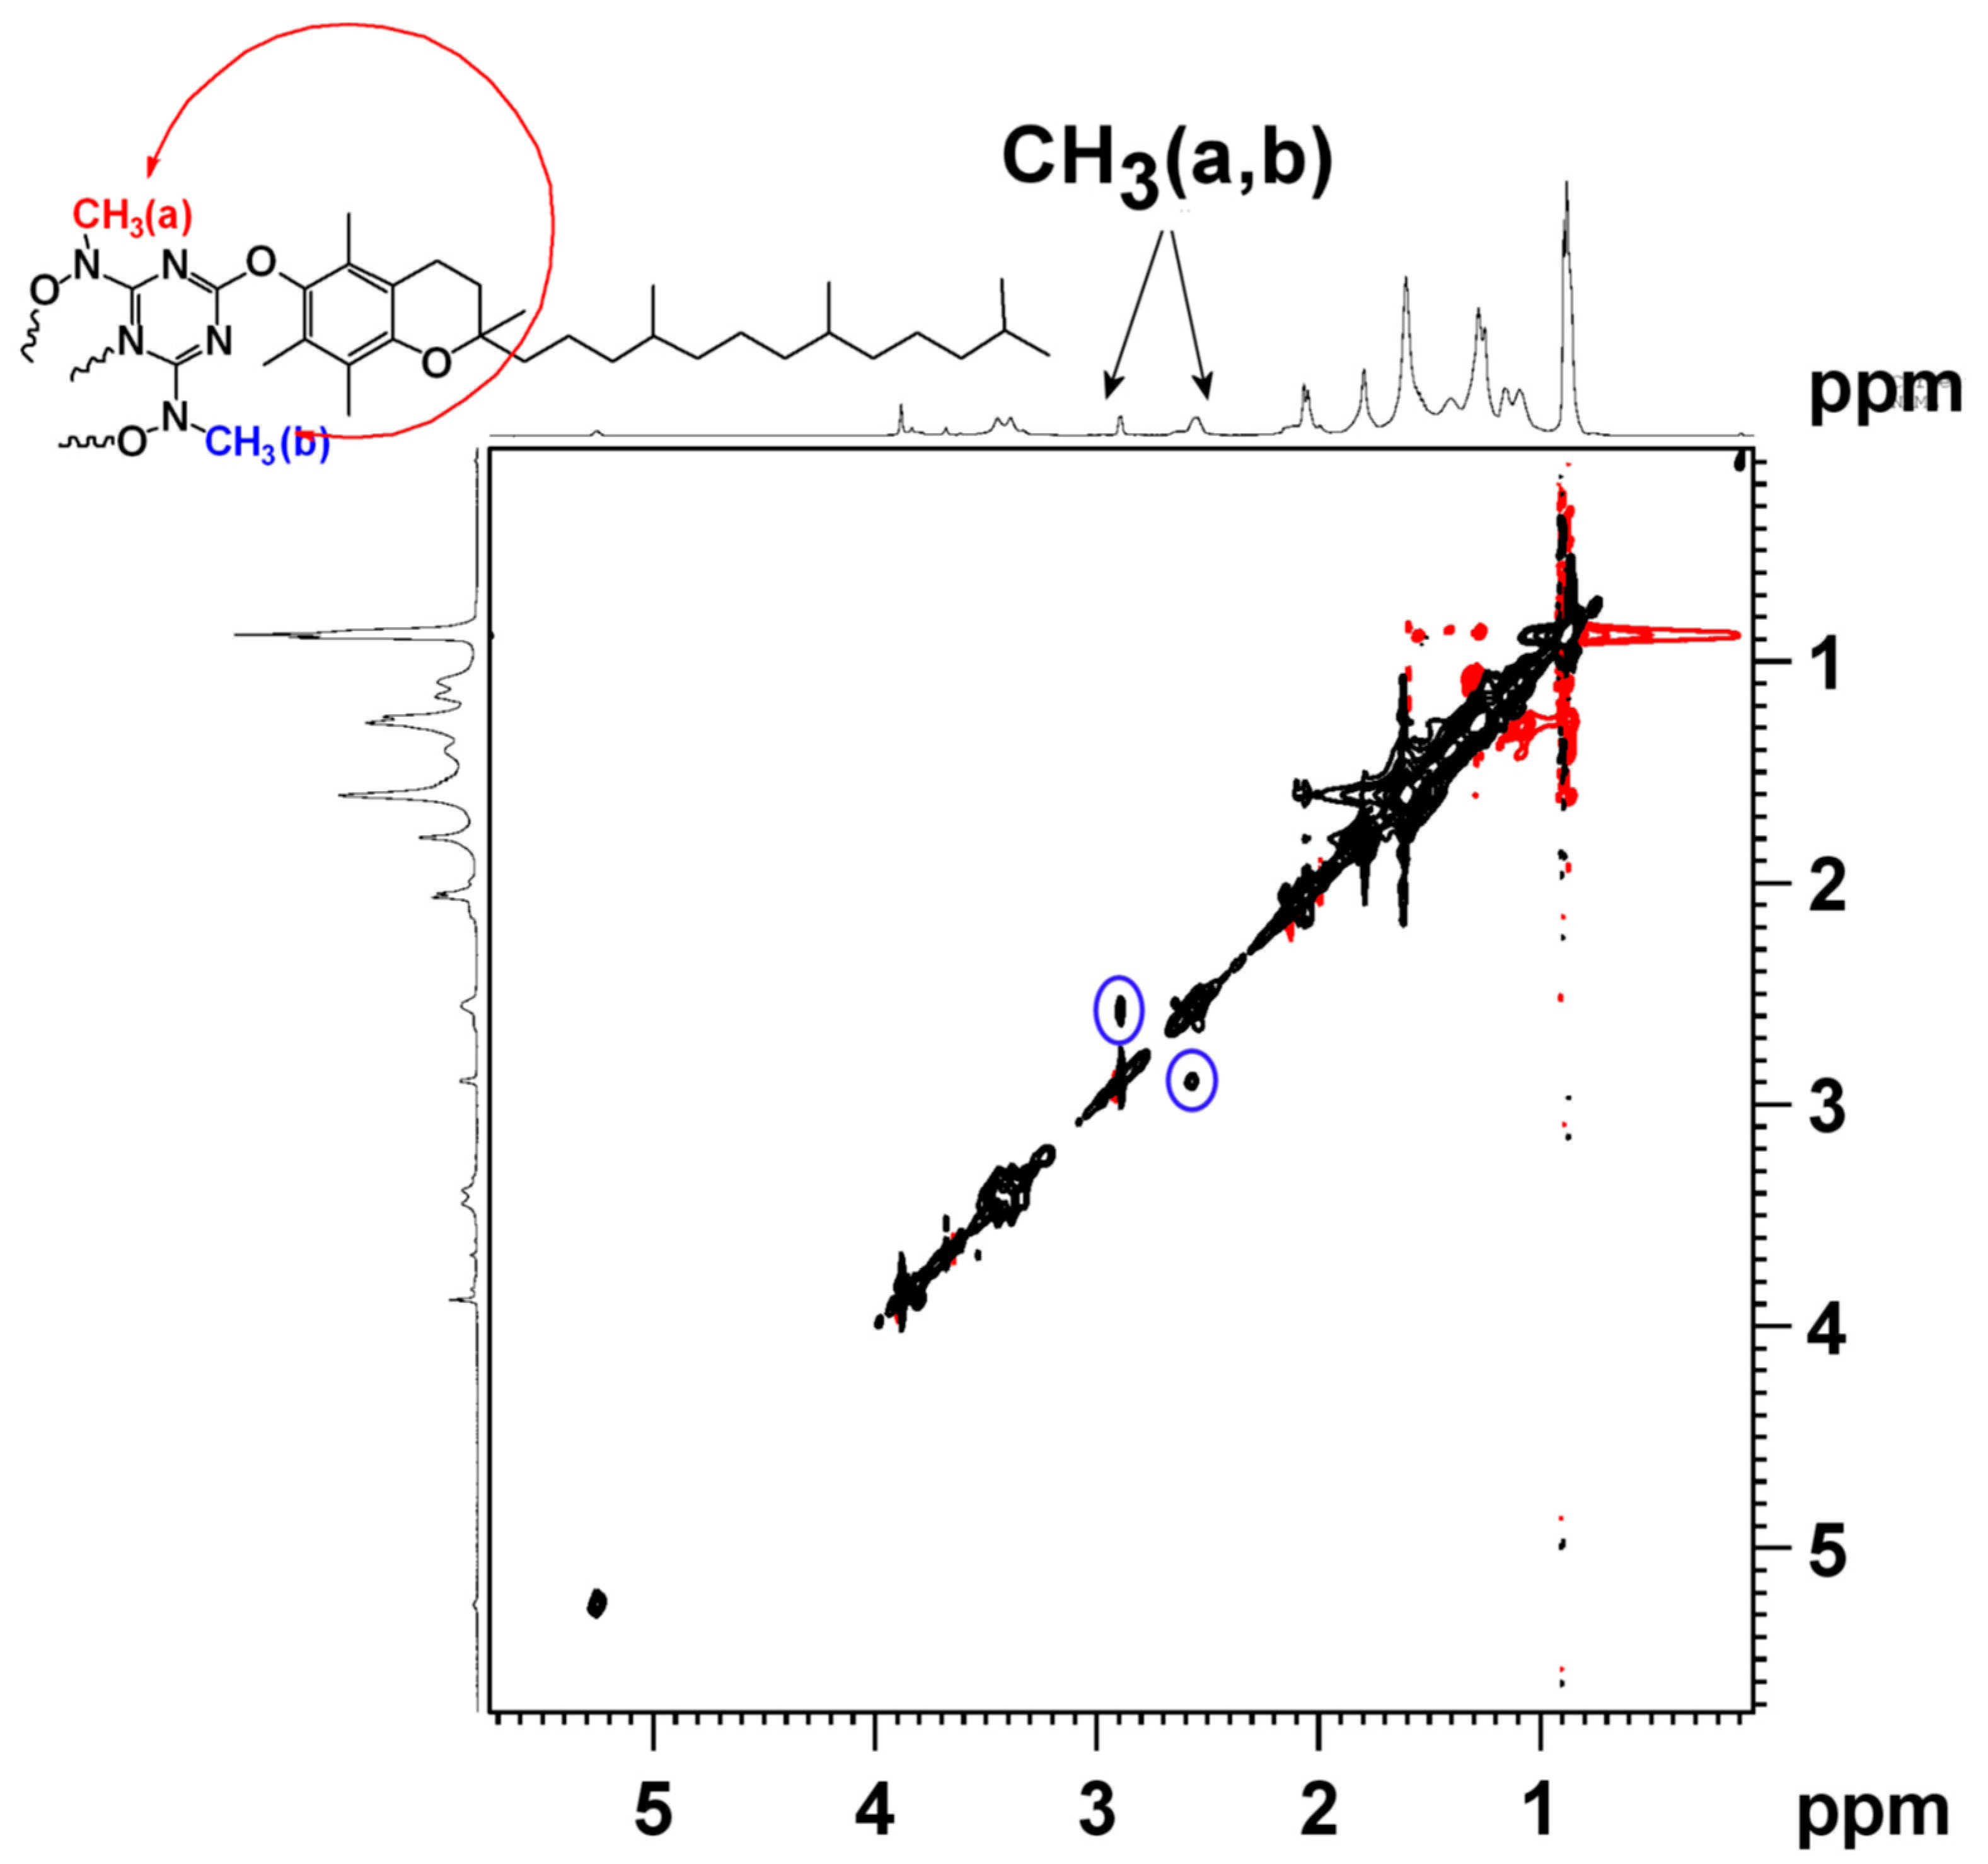
3.3. Complex Characterisation by 51V NMR, 2D {1H} grNOESY

The 51V spectra of each of the VV complexes (1, 2) in CDCl3 solutions gave two signals at −216 and −387 ppm (Figure 2). The intensity of the peaks is dependent on the concentration of the complexes in solution. At low concentration (i.e., 1 mM) the component at −216 ppm is the major, whereas at more concentrate solutions (i.e., 7 mM) the spectra of each of the complexes shows only the peak at −387 ppm. For more concentrated solutions three broad additional peaks of equal intensity appear at higher field (−402, −439 and −648 ppm), presumably originated from a higher nuclearity compound. The 51V NMR spectra changes observed by the variation of the concentration are attributed to the equilibrium between the monomer (1m), dimer (1) and oligomers (Scheme 4). The quantities of 1m and 1 are equal at concentration 2.5 mM, calculating a Keq = [1m2]/[1] = 1.25 × 10⁻³ M. The conversion of the 1 to 1m species takes approximately 2 min after the dissolution of 1 in CDCl3, and it can be observed by the change of the colour of the solution from purple to blue. Dimerization of the hydroxylamine-triazine ligands through the formation of M-O-M bridge has been previously observed for UVI-, MoVI- and VV-bihyat2− complexes [42,43]. The respective 51V NMR spectrum of CDCl3 solution of the structurally characterised by single crystal X-ray dinuclear complex [VV2O22-O)(bihyat)2] exhibits peaks at −192, −402 and −485 ppm. However, the 51V NMR peaks of the CDCl3 solution of [VV2O22-O)(bihyat)2] at −192 ppm had been mistakenly attributed to the decomposition of the compound.
The 2D {1H} grNOESY of 1 is shown in Figure 3. The two methyl groups show difference in chemical shifts due to the different chemical environment. 2D {1H} grNOESY shows positive cross peaks between the protons of the two methyl groups assigned to the slow rotation methylhydroxylamine giving two peaks at 2.869 and 2.573 ppm in proton NMR. The rotation of tocopherol is performed around the ether bond between tocopherol and triazine moieties (Figure 3).

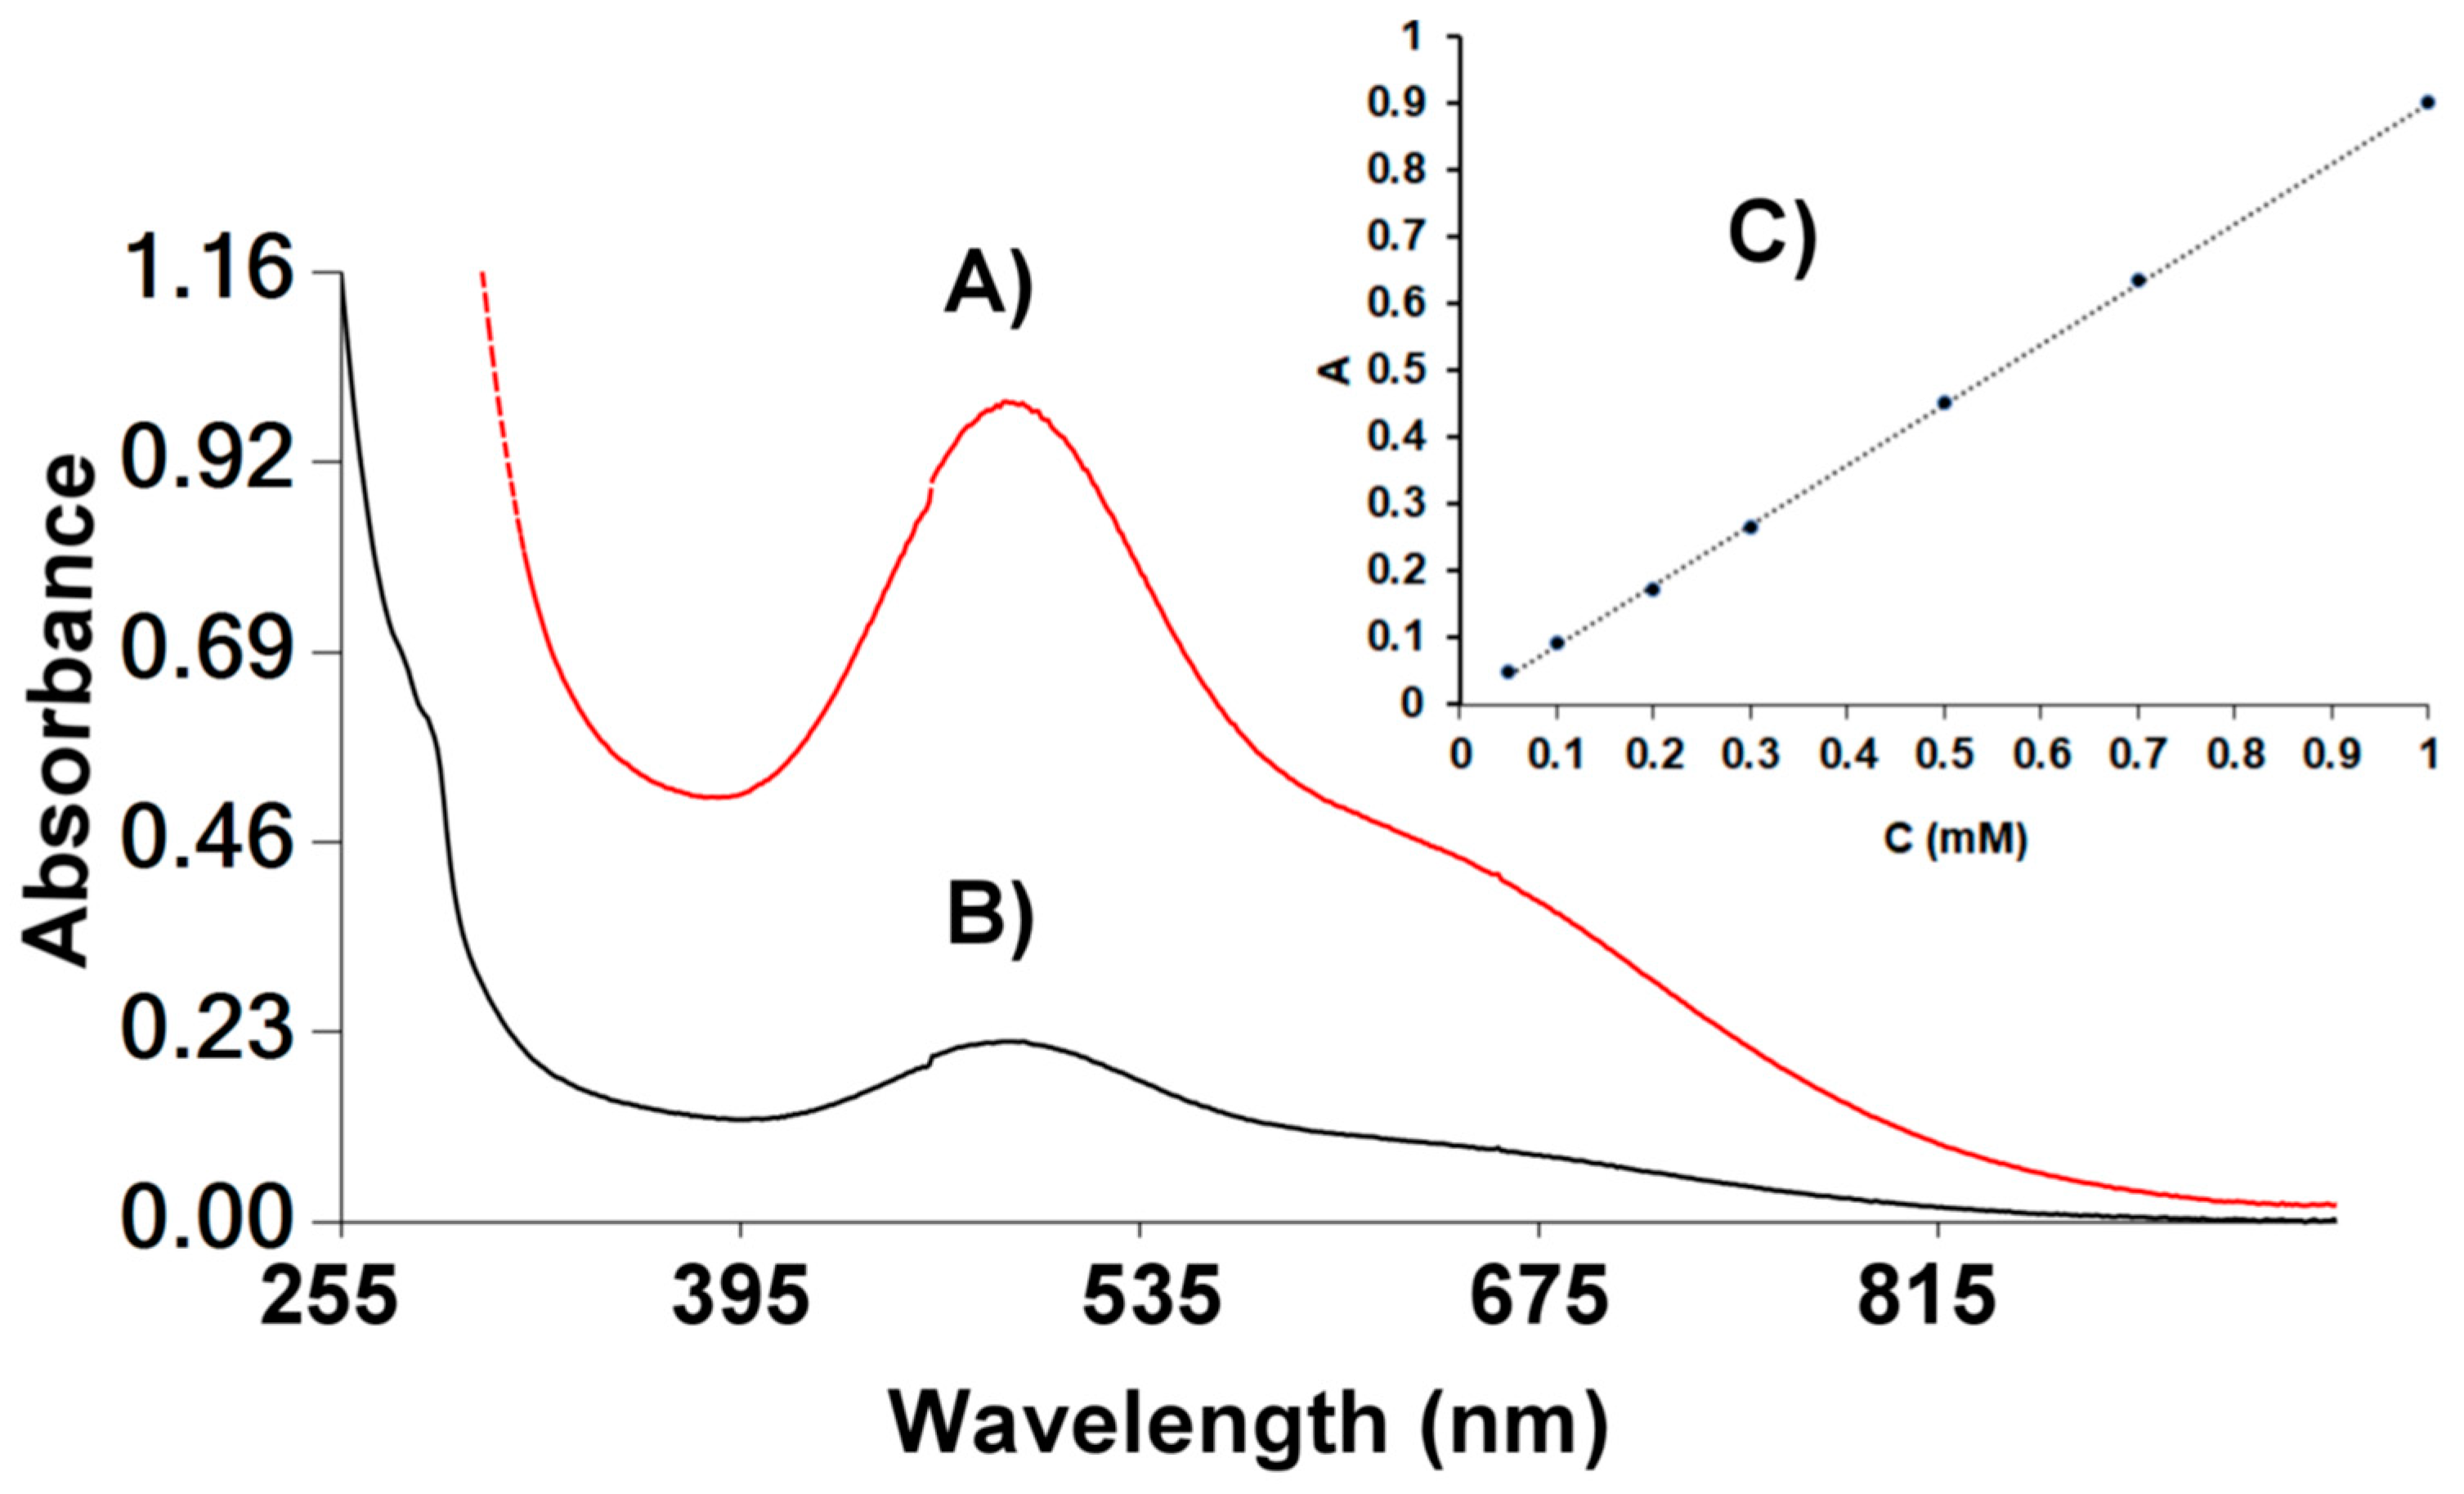
3.4. Complexes Characterisation by UV-Vis

The UV-vis spectra of the CHCl3 solutions of 1 and 2 are shown in Figure 4. Both gave strong peaks in the visible region [λ(ε) of 1 = 493 nm (3600 M−1 cm−1), 682 nm (1140 M−1 cm−1), λ(ε) of 2 = 484 nm (2300 M−1 cm−1), 645 nm (860 M−1 cm−1)] assigned to the ligand to metal charge transfer transitions (LMCT). The concentration of the complexes in solutions were 0.500 mM, and according to 51V NMR the species in the solution have the monomeric structure, 1m and 2m (Scheme 4). Although [VVO2(bihyat)] has a similar structure with the monomers 1m and 2m, it does not exhibit any strong absorption peaks in the visible region. Thus, the strong colour of 1m and 2m is due to electron transitions from the chromanol ring to the metal. Chromanol ring can contribute electronically to the metal ion through the resonance of the triazine ring (Scheme 5) [42]. The shift of the UV-vis peaks of 1 to lower energy compared to those of 2 agrees with the higher electron density of α- than δ-tocopherol, supporting our hypothesis regarding the significance of the chromanol role on the LMCT effect.
The CHCl3 solutions of FeIII complexes 3 and 4 gave peaks at 560 nm (3200 M−1 cm−1) and 535 nm (2200 M−1 cm−1) respectively (Figure 5A). These spectra are similar to other hydroxylamine-triazin iron complexes, for example the FeIII-bihyat compounds [41]. Complexes 3 and 4 exhibit the same pattern as the vanadate complexes; the α-tocopherol complex 3 absorbs at lower energy than the δ-tocopherol complex 4. This is in line with the proposed electron transfer resonance mechanism proposed in Scheme 5.
Addition of various quantities of either H2α-tocTHMA or H2δ-tocTHMA to a CHCl3 solution of FeIIICl3 gave the same spectra with 3 and 4 respectively. Titration of the CHCl3 solution of FeIIICl3 with either H2α-tocTHMA (Figure 5B) or H2δ-tocTHMA reveal that only the 1:2 FeIII-Ligand complexes are formed in the solution.

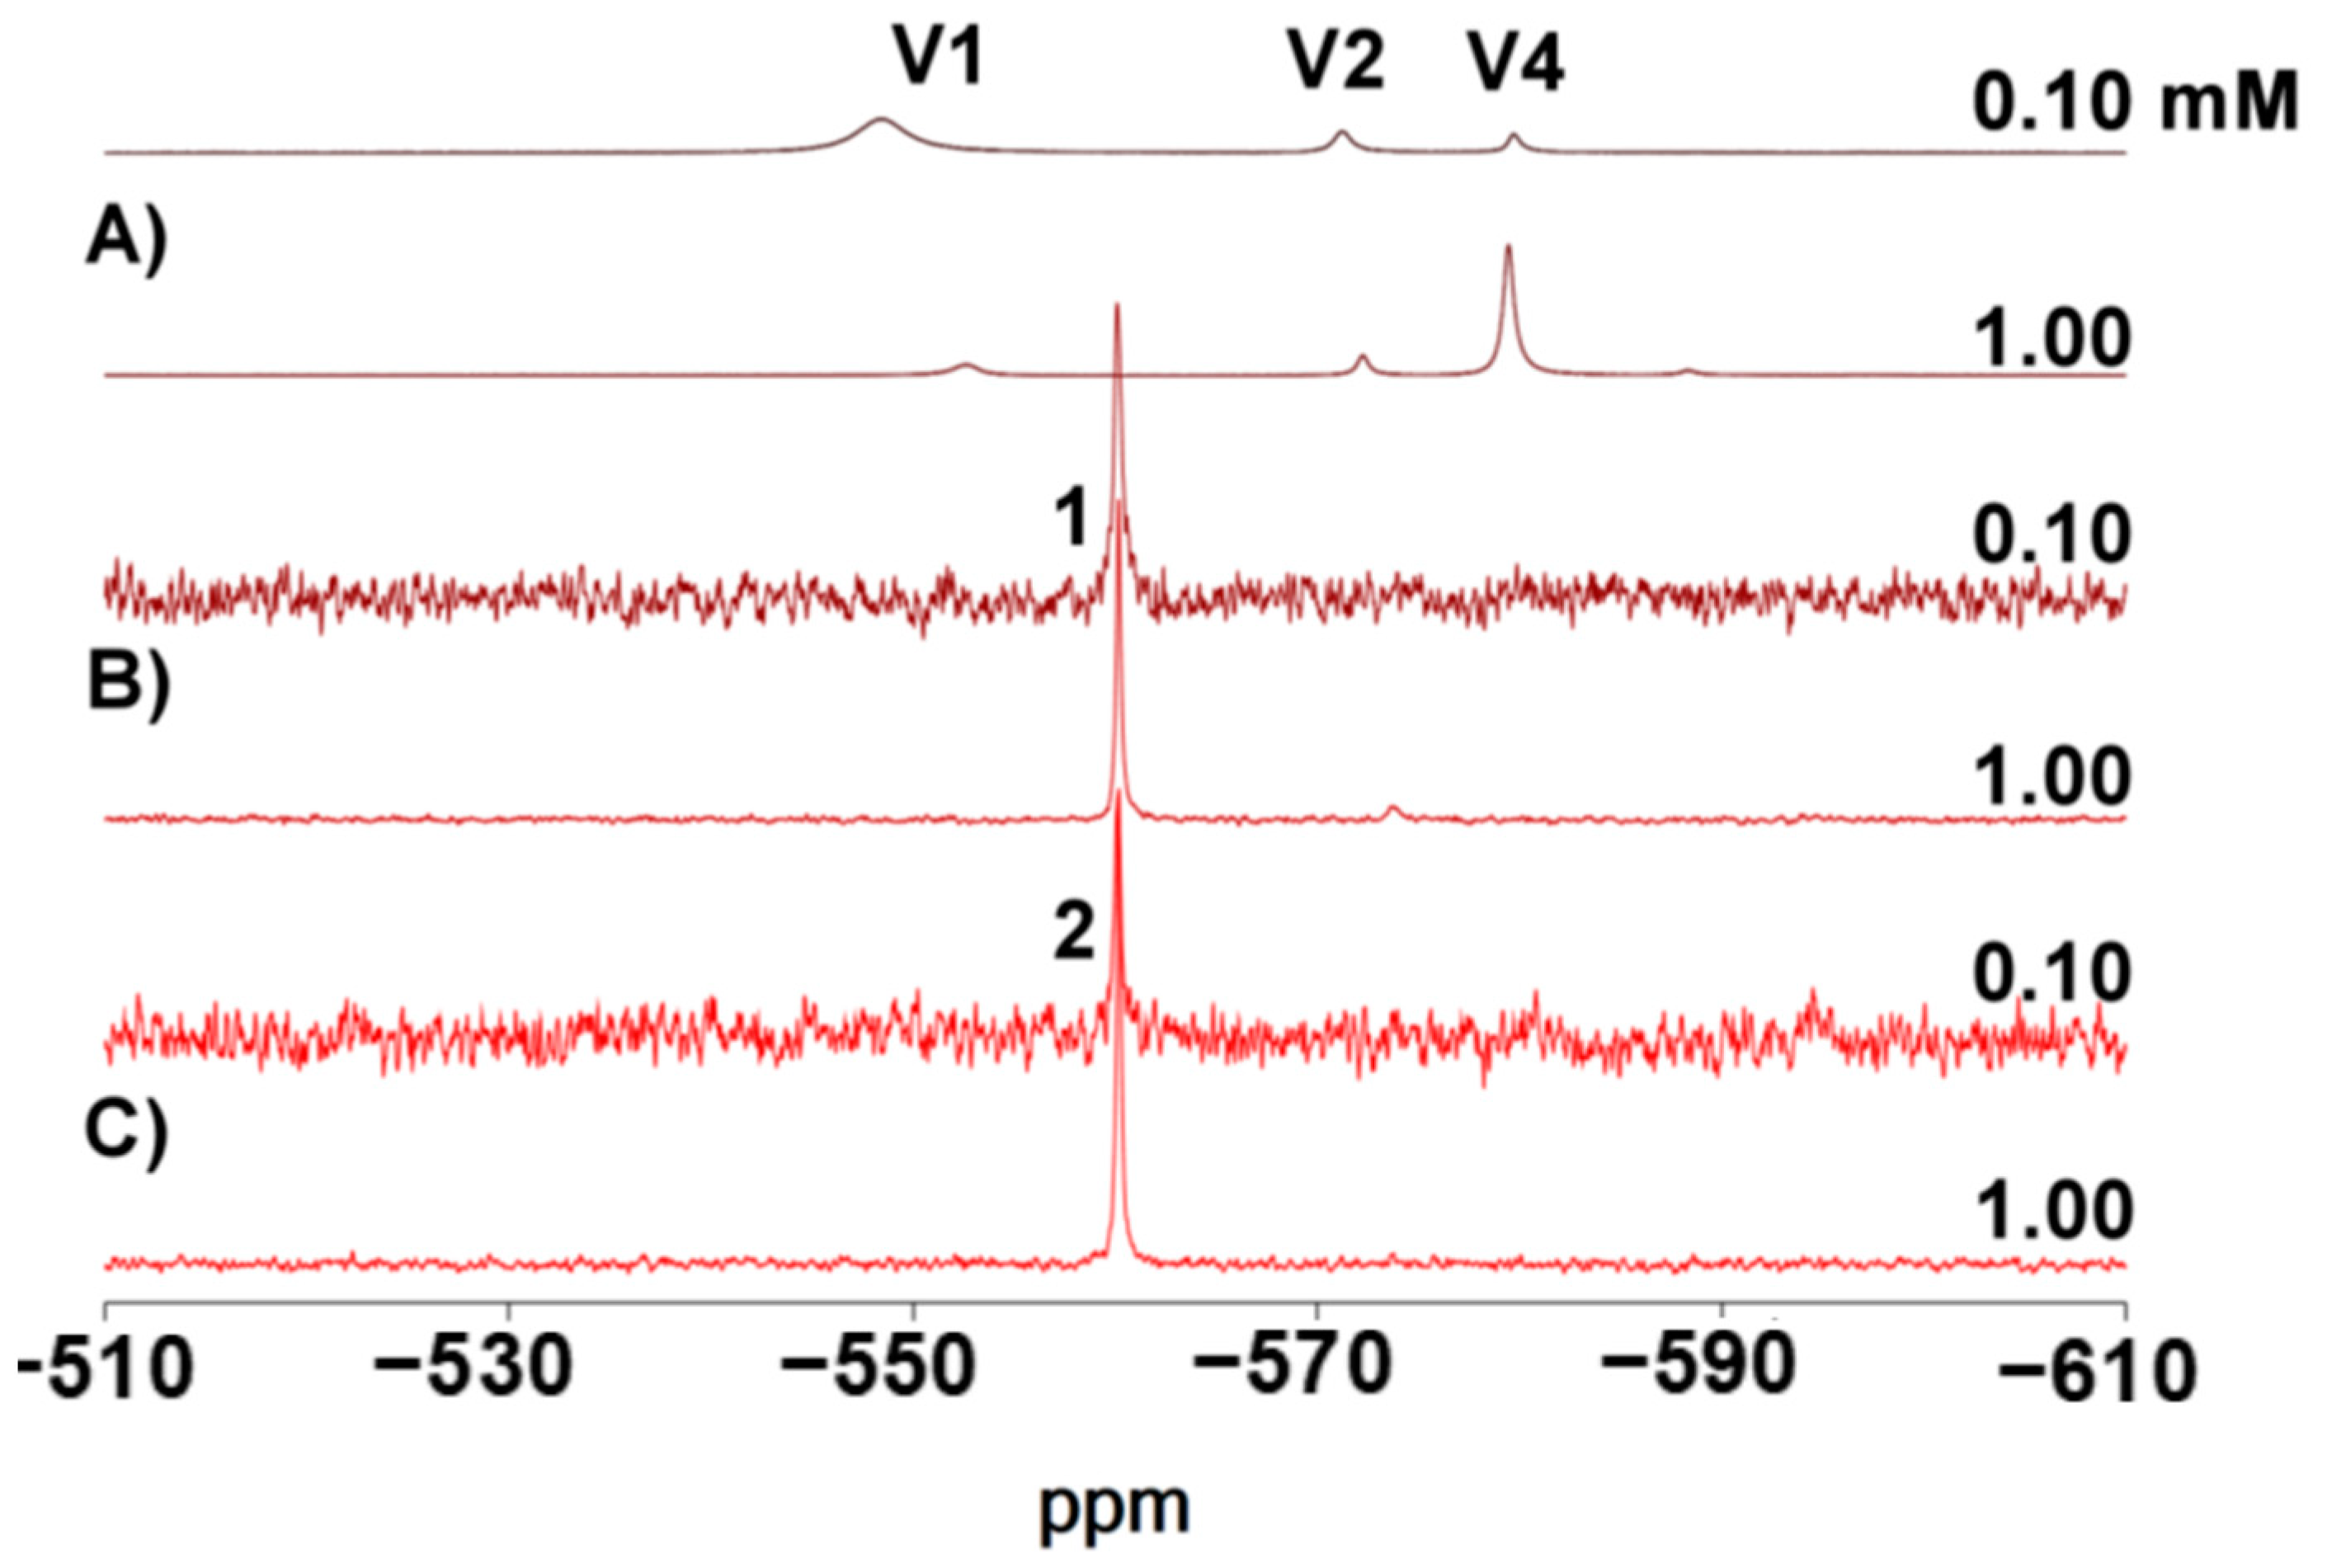
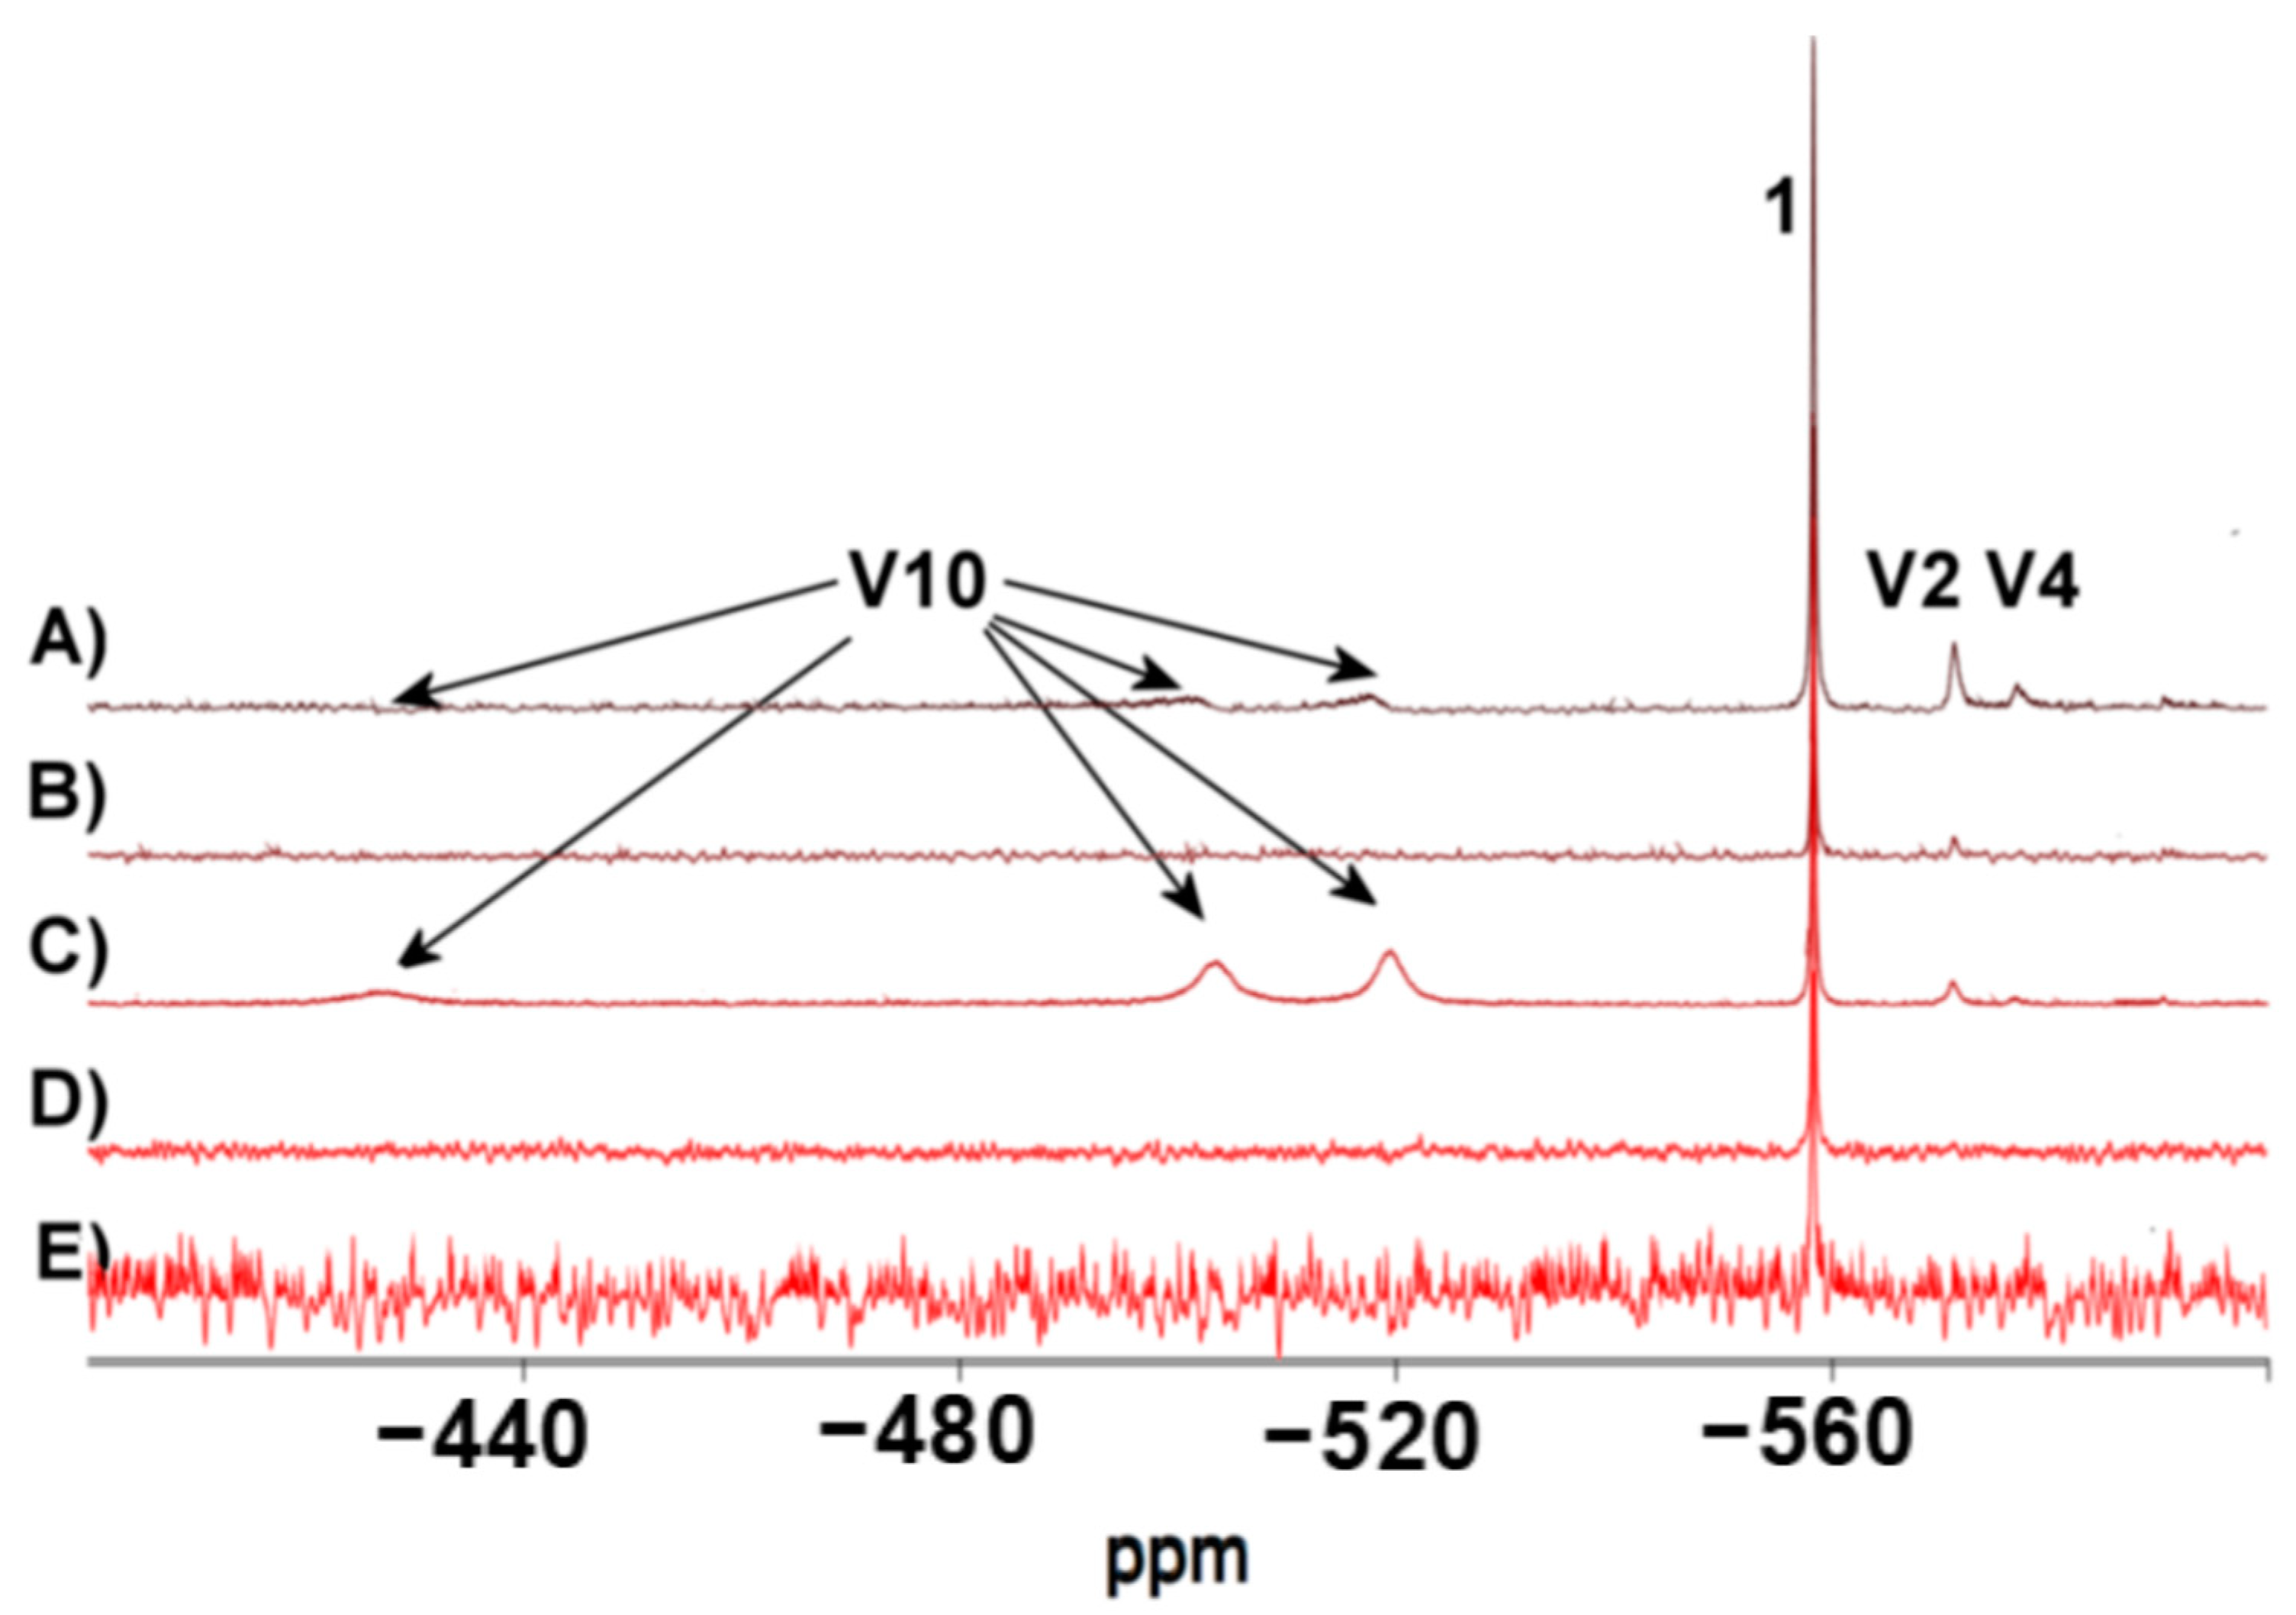
3.5. Characterisation of the Complexes in 10% DMSO:90% D2O Solutions by 51V NMR

The 51V NMR spectra of 10% DMSO:90% D2O solutions of inorganic vanadate with either 1 or 2 at pD = 5.0–7.5 clearly shows very different chemical shifts for the peaks of vanadate oligomers from those of the complexes, undoubtedly assigning the peaks at −560 ppm to the new vanadium complexes (Figure 6 and Figure 7). The addition of D2O in the DMSO solutions (10% DMSO:90% D2O, pD = 6.0–7.5) of 1 or 2 at concentrations 0.10 mM do not hydrolyse the complexes as evidenced by the 51V NMR spectroscopy (the spectra show only one peak originated from the complex and there is no formation of any inorganic vanadate species (Figure 6)). In the 51V NMR spectra, a shift from −387 ppm in CDCl3 to −560 ppm in 10% DMSO:90% D2O observed for 1 originated from the structural change of the complex from tetragonal pyramidal to dioxido octahedral geometry. A similar shift was observed upon changing from CDCl3 to D2O solutions for [VO2(bihyat)] as well [42]. The 10% DMSO:90% D2O solutions of 1 or 2 were stable at these conditions for more than 72 h. The high hydrolytic stability of 1 and 2 is attributed to their amphiphilic nature [36,38,39]. The lipophilicity of 1 and 2 may enhance the hydrolytic stabilisation over the non-lipophilic vanadium complexes, exhibiting the same coordination environment, through a more favourable solvation [40].

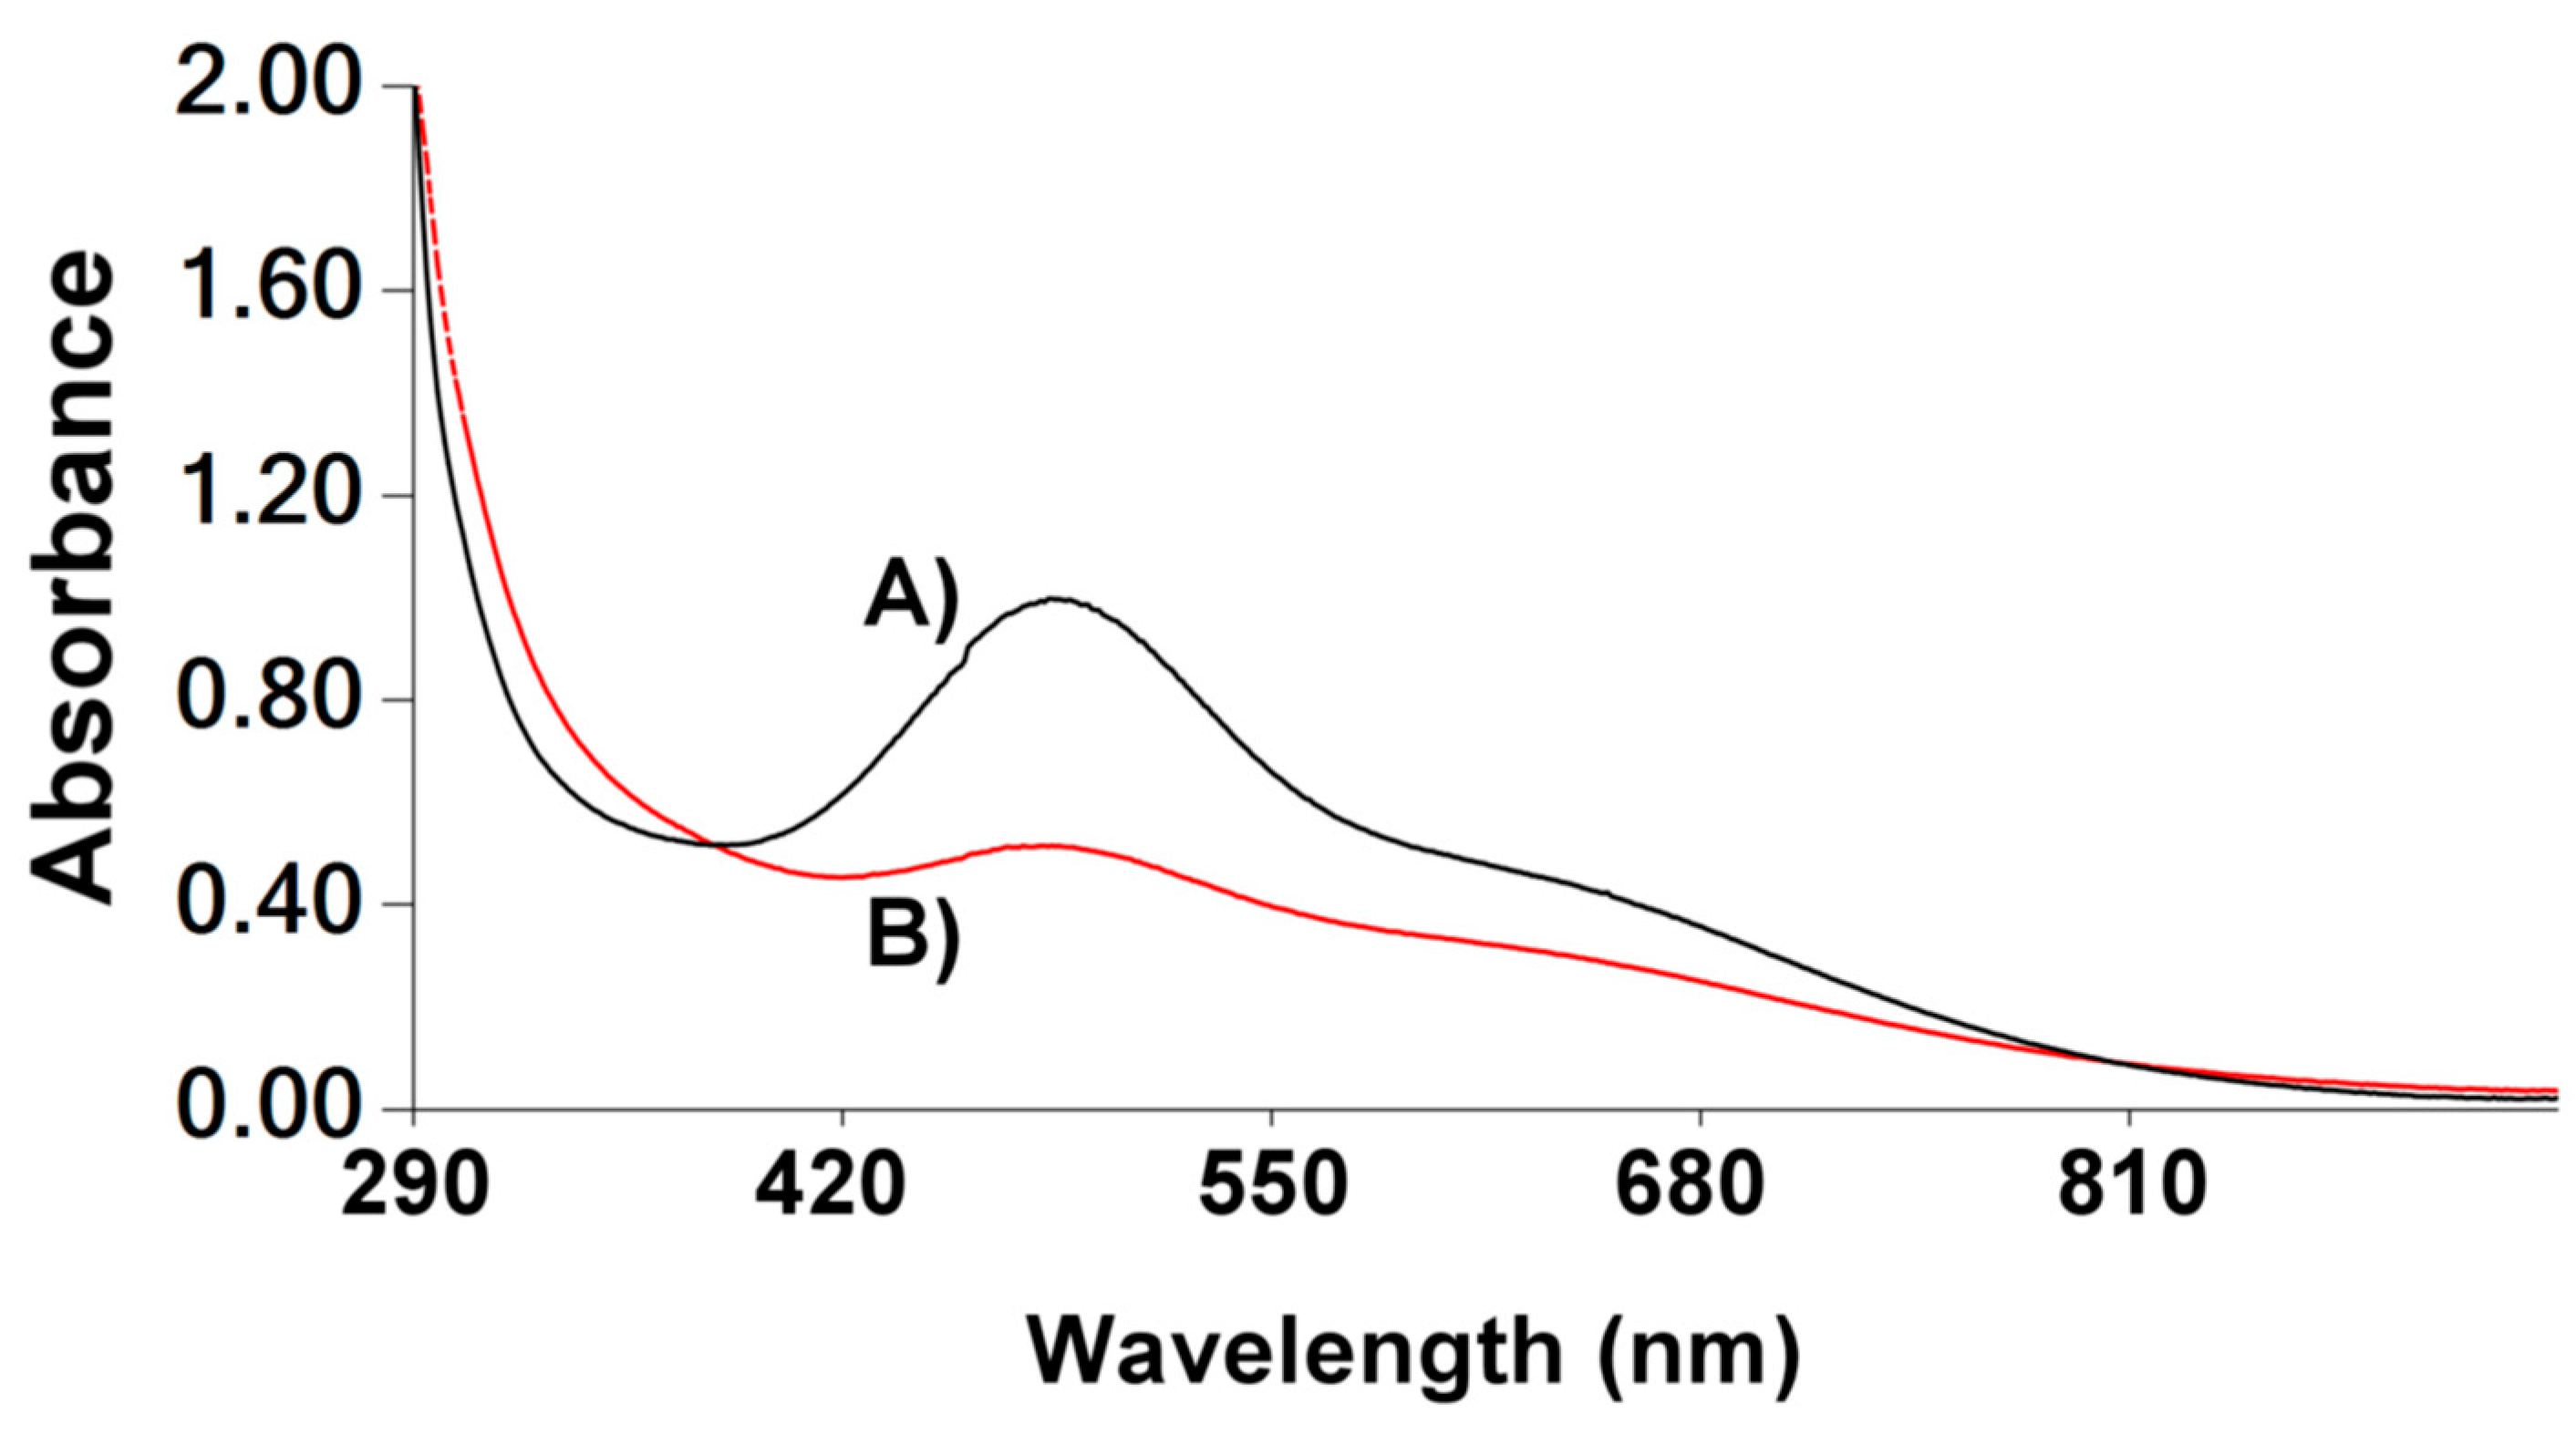
3.6. Characterisation of the Complexes in 10% DMSO:90% D2O Solutions by UV-Vis Spectroscopy

The UV-vis spectra of the 10%DMSO: 90%D2O solutions of 1 and 2 were similar to the spectra of the complexes in CHCl3 (Figure 8). The only difference between the spectra in the two different solvents is the lower intensity of the peaks in 10%DMSO: 90%D2O than CHCl3. However, complexes 1 and 2 show significant different absorption coefficients compared to those of [VO2(bihyat)] in various solvents [42]. The extinction coefficients of 1 and 2 are lower in protic polar solvents than in the non-polar ones in the same manner as [VO2(bihyat)]. The absorbance values from the UV spectra of 1, 2 solutions appear to obey Beer’s law, even at low concentrations at 50 μM, suggesting that the complexes are hydrolytically stable in those solutions (Figure 9), in agreement with 51V NMR spectroscopy. The spectra of the 10% DMSO:90% D2O solutions of the iron complexes 3 and 4 are also similar with their spectra in CHCl3 solutions.

3.7. Reactivity with DPPH

The radical scavenging activity (RSC) values of the organic compounds and the complexes towards scavenging the DPPH radical are shown in Table 1. α-tocTHMA and δ-tocTHMA exhibit very low antioxidant activity, much lower than free α-tocopherol. The reason for this low activity is the replacement of the labile phenoxy proton of α-tocopherol with an inert ether bond of α-tocTHMA and δ-tocTHMA. Large number of vanadium complexes exhibit radical scavenging activity [50]. However, complexes 14 either did not show any or very little decrease of the peak intensity at 520 nm, resulting in the conclusion that they do not have any antioxidant activity.

3.8. Oxidative Inducing Effect of Vanadium Compounds by EPR Spectroscopy

The ability of the new vanadium compounds to produce radicals was examined by monitoring the generation of α-tocopheryl radicals in olive oil by cw X-band EPR using 2D intensity vs. time experiments (Figure 10). The ability of complexes 1 and 2 were compared with that of the [VVO(C18DEA)] used in a previous study [36,37]. [VVO(C18DEA)] has been studied for its activity towards the production of radicals in olive oil, therefore, it is used in this work as a reference. Based on previous studies, it has been reported that VV and/or VIV coordinated catalytic sites are able to activate phenolics in the lipophilic matrix of oil mediated by dioxygen activation; in this oxidative environment free radicals are trapped by α-tocopherol to give α-tocopheryl radical. The generation of α-tocopheryl radicals is monitored by X-band cw-EPR vs. time. The graph of the signal intensity vs. time is a very useful quantification tool to determine the ability of the complexes to initiate radicals. Experiments were run for two different quantities of each radical initiator for the study, (0.490 μmole or 0.720 μmole). The intensity of the EPR peaks, at the same time period after addition of the radical initiator in olive oil is higher for [VVO(C18DEA)] than 1, meaning that [VVO(C18DEA)] produces more α-tocopheryl radicals than 1. The intensity of the EPR signal is lower at higher concentrations of the radical initiator due to the faster oxidation of the polar antioxidants that regenerate α-tocopherol in olive oil; the mechanism has been previously investigated [37]. Apparently, [VVO(C18DEA)], and consequently [VVO(β-tocDEA)] which is stronger initiator than [VVO(C18DEA)] [36], are by far much more potent radical initiators than 1.
[VVO(C18DEA)] and [VVO(β-toc)DEA] vanadium complexes have been reported to have high cytotoxicity [36]. If the cytotoxicity of the complexes is related to their oxidative power measured by EPR, then 1 is expected to be less cytotoxic than [VVO(C18DEA)] or [VVO(β-toc)DEA].

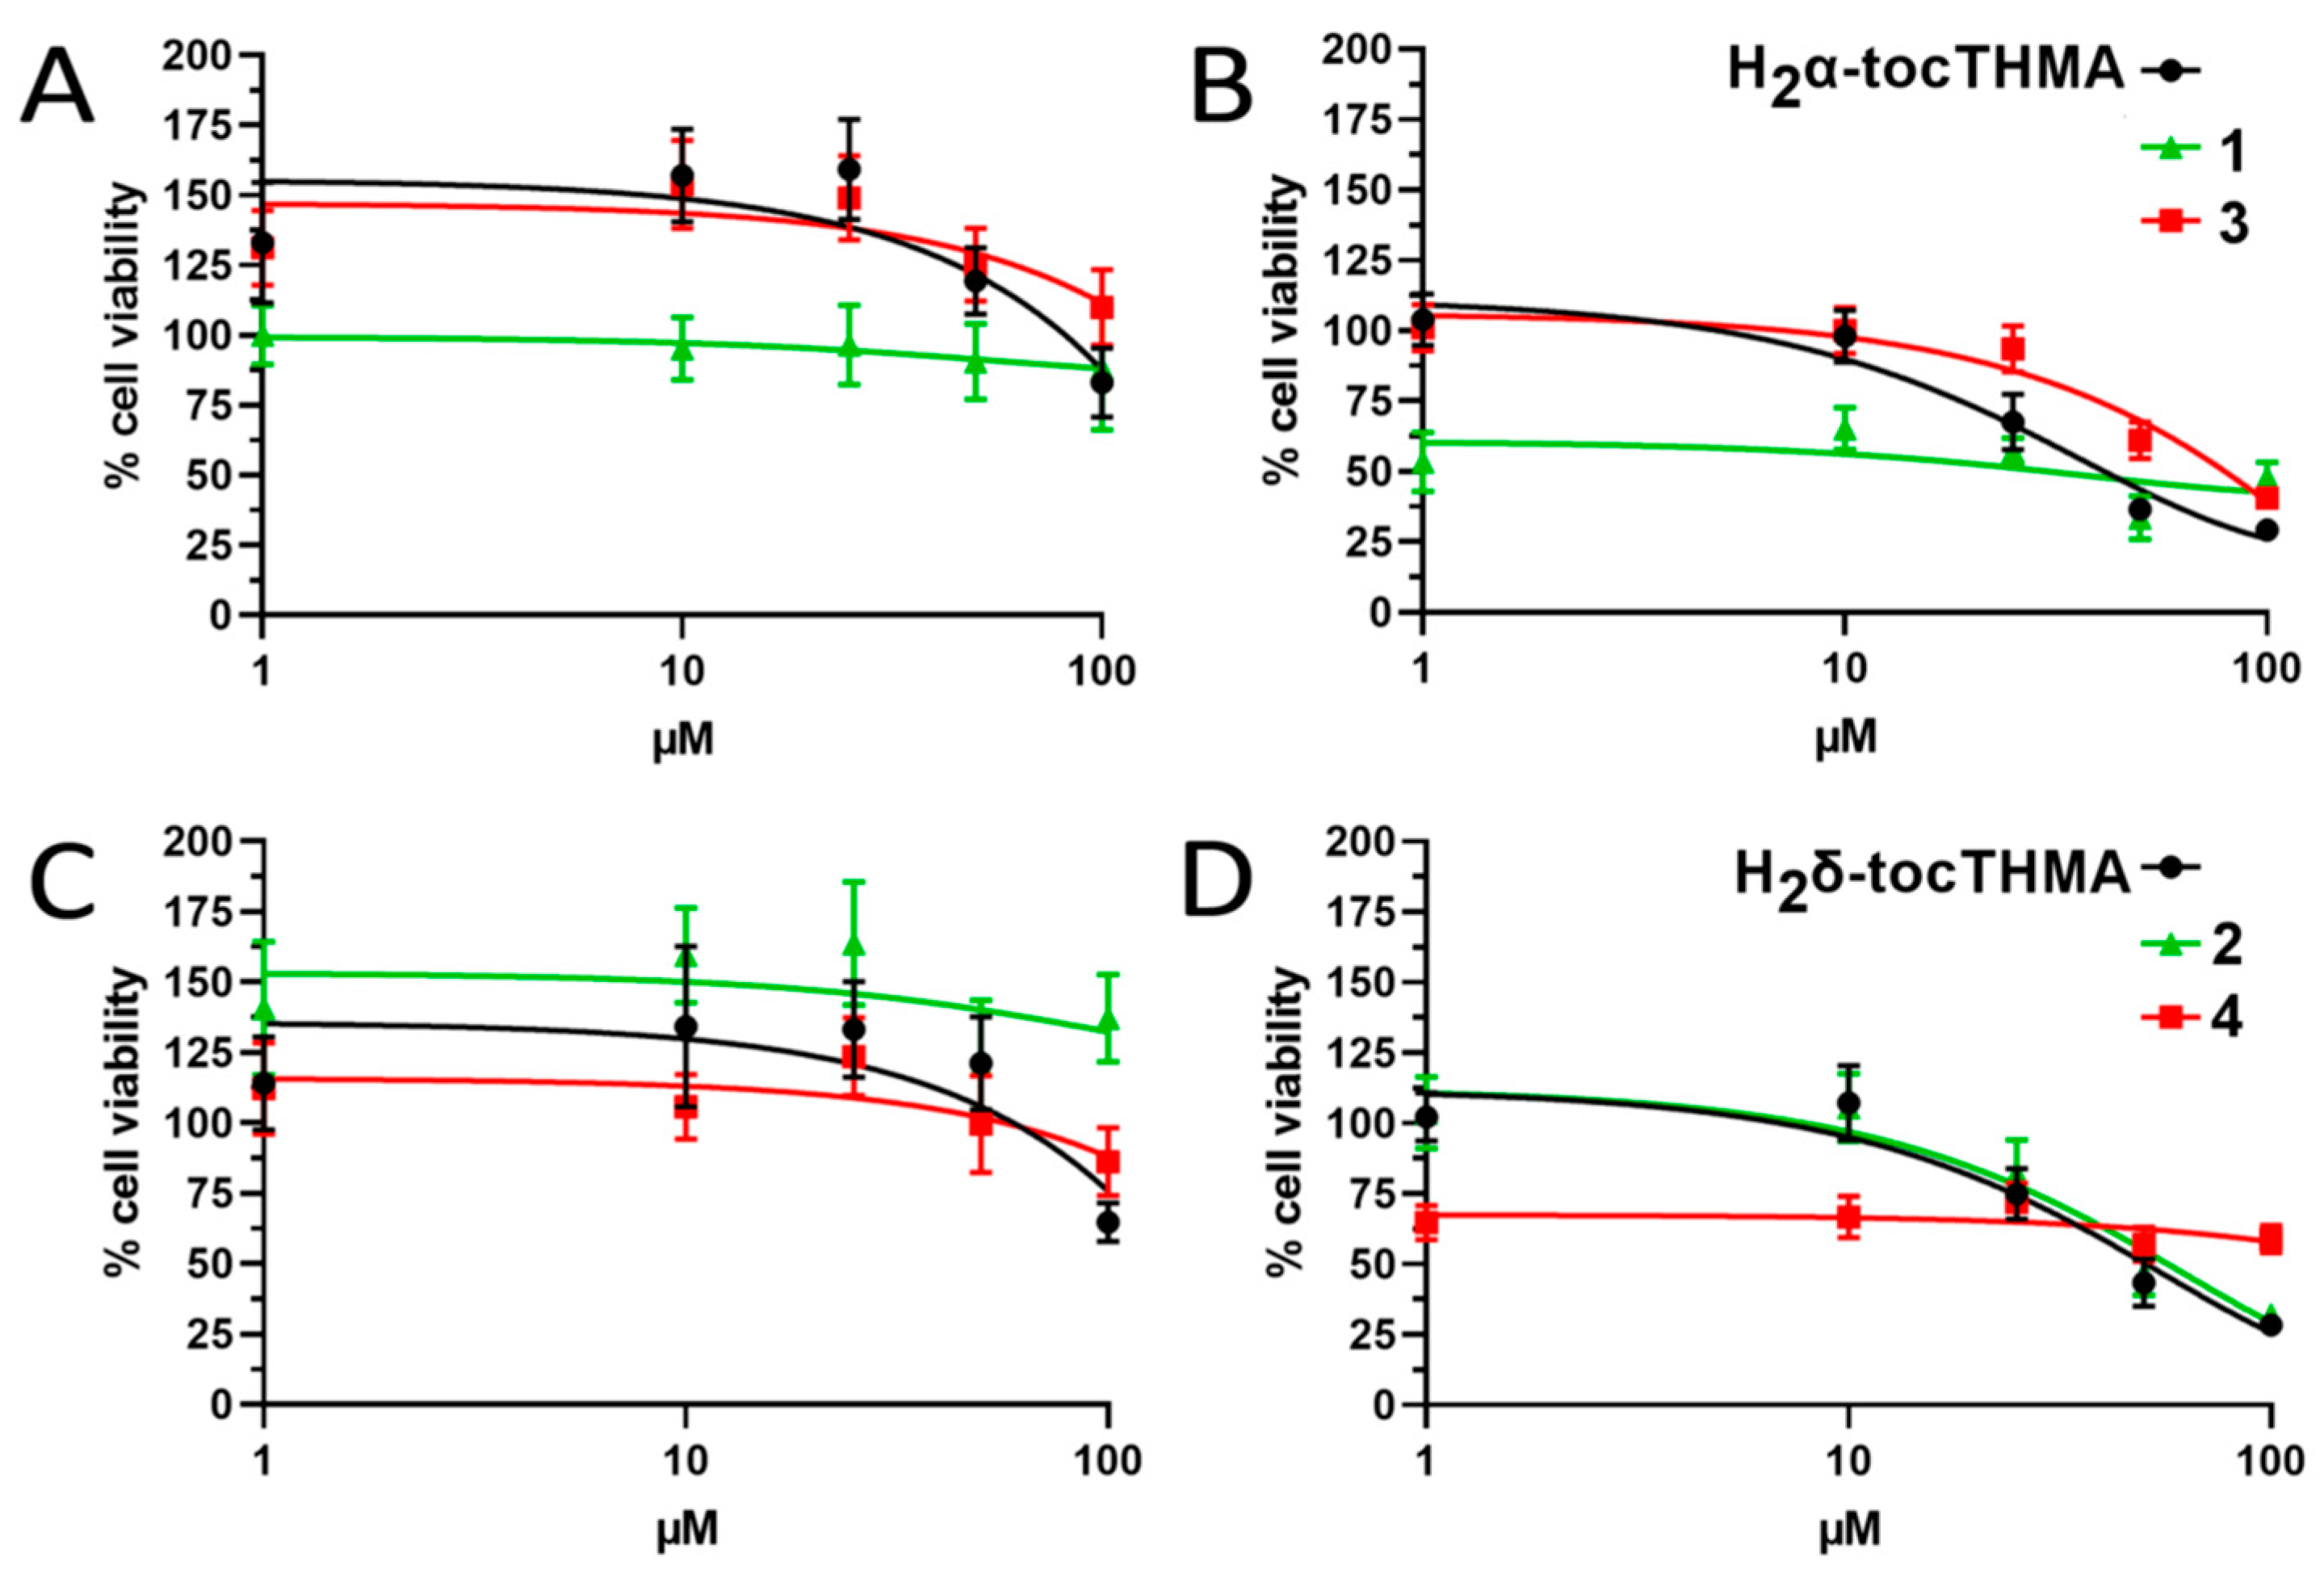
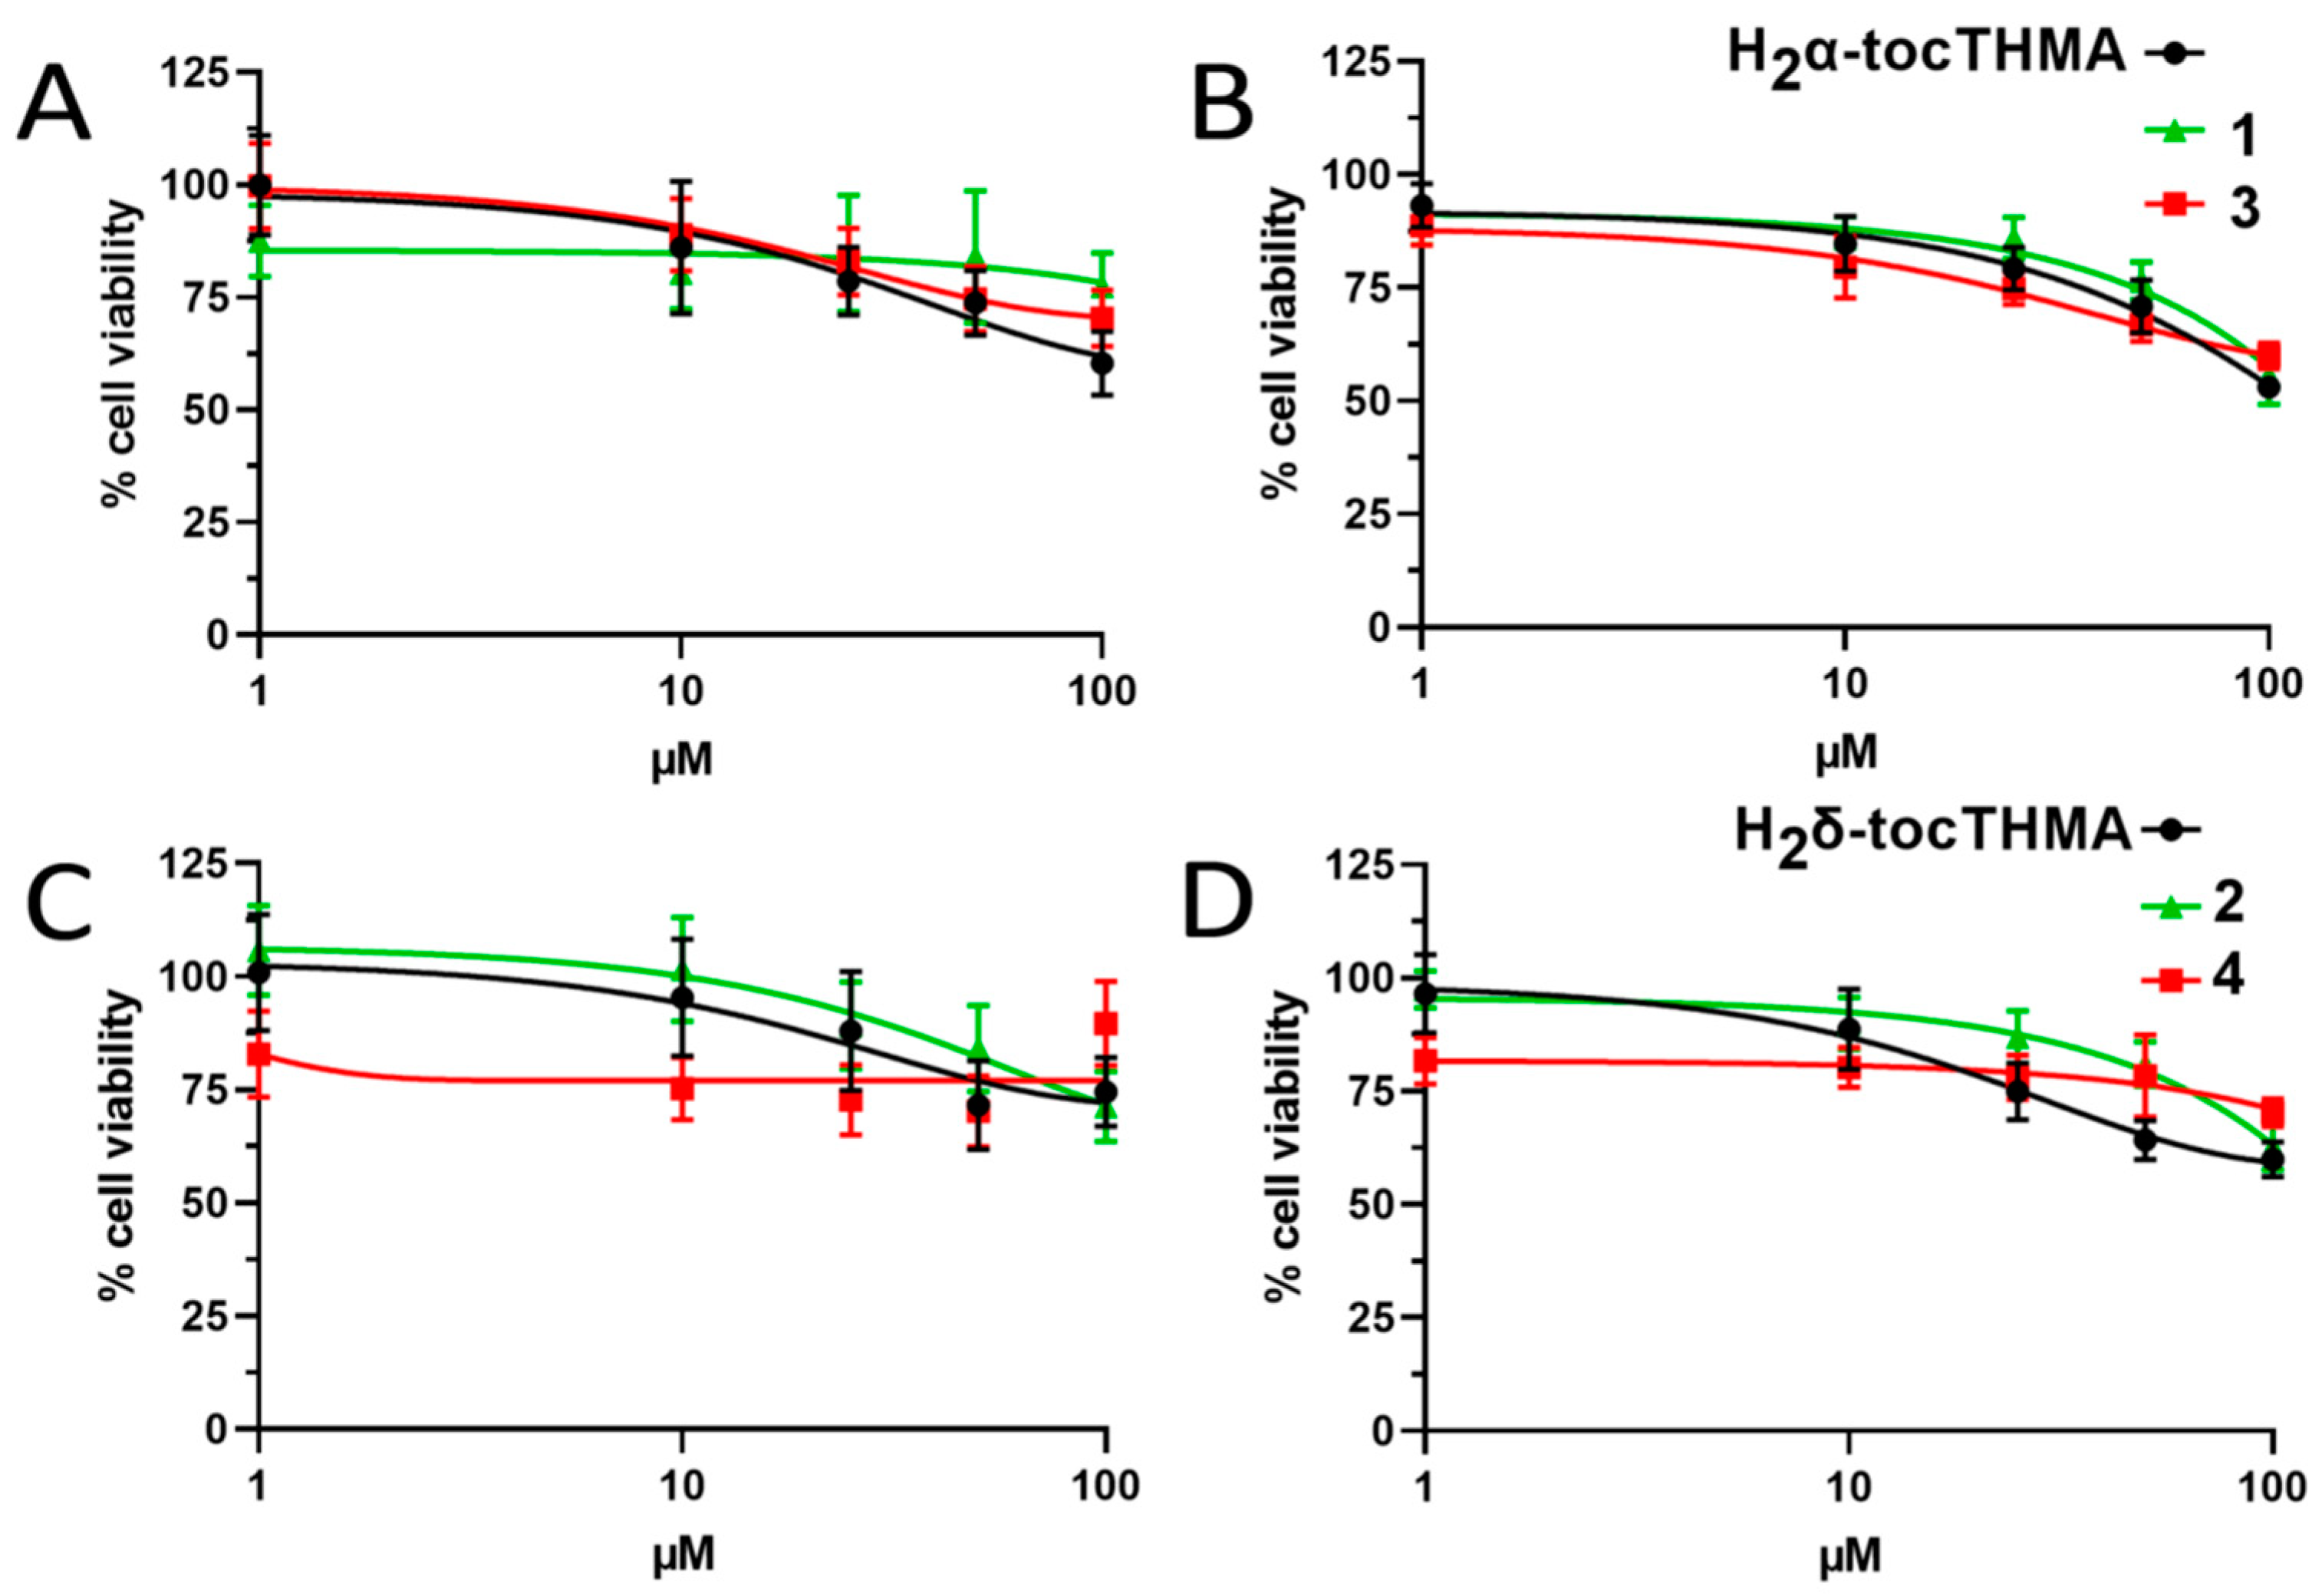
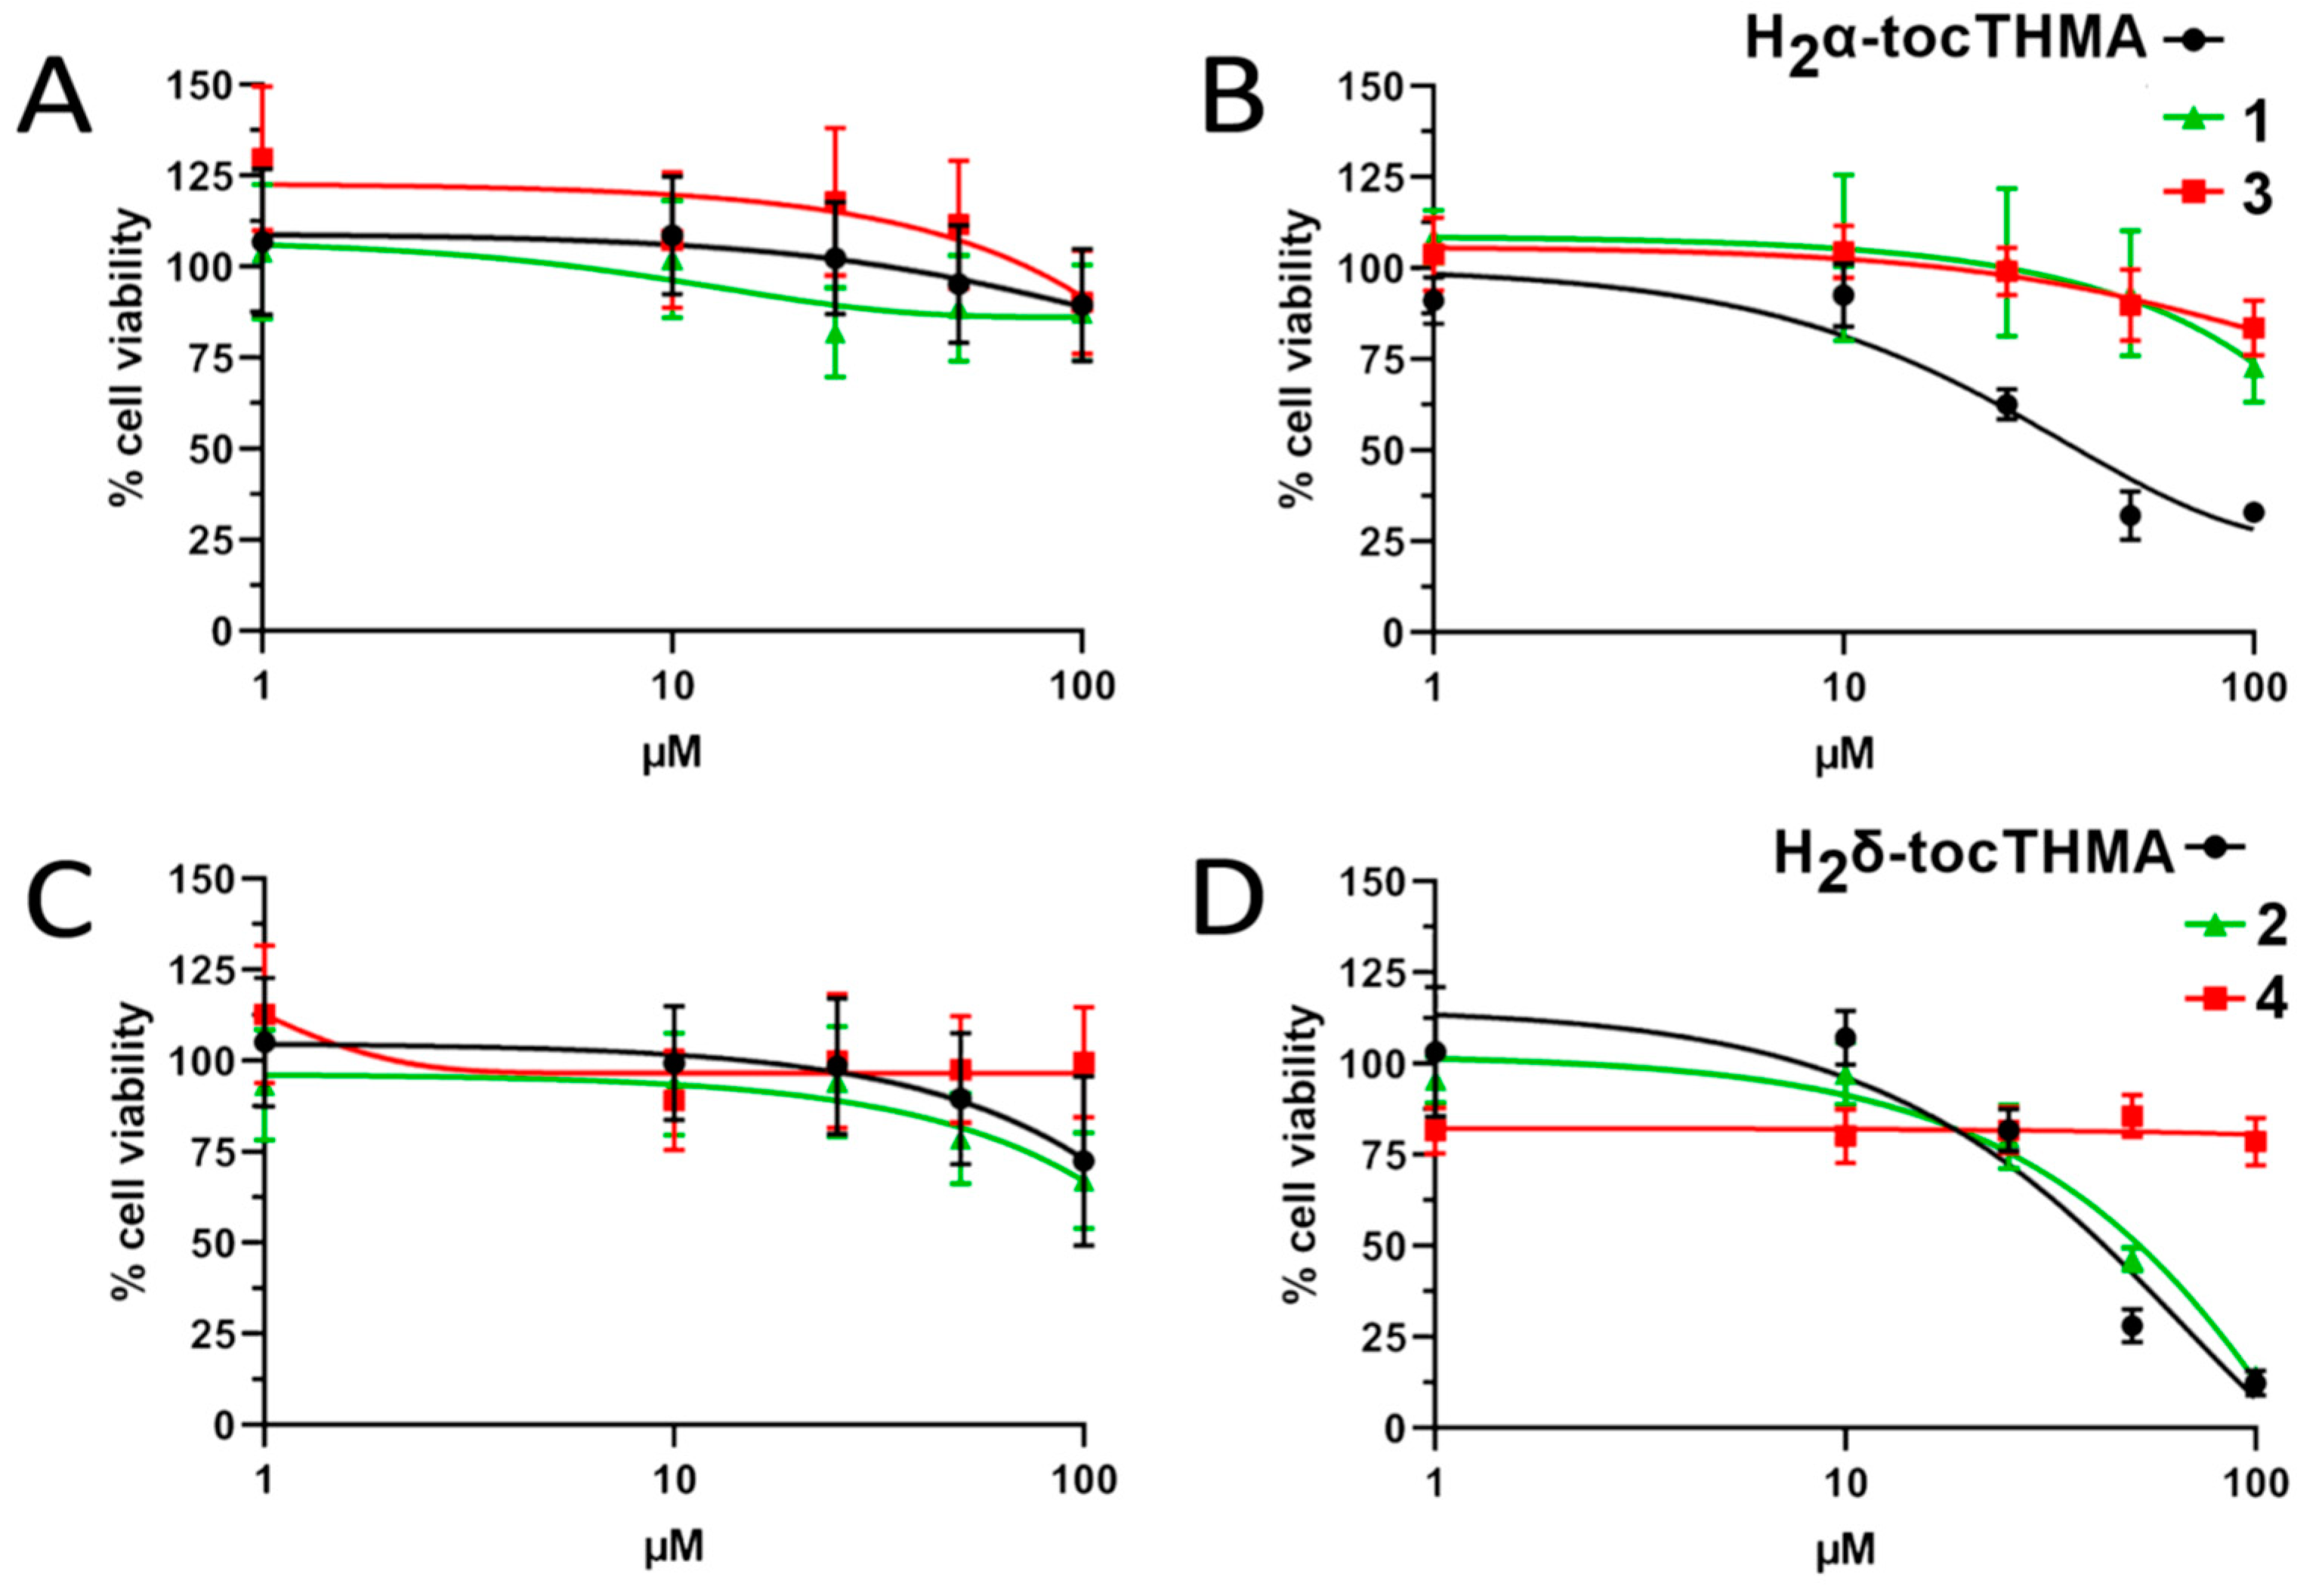
3.9. Cytotoxic Activity

None of the complexes exerted cytotoxic activity against the three cell lines, a fact that differentiated them significantly from the ligands. As seen in Figure 11, exposure of Cal33 cells for 24 h to increasing concentrations of the ligands and the complexes had no severe effect on the ability of the cells to proliferate (Figure 11A,C). Prolongation of the incubation time revealed that complexes 1 and 4 exerted a no-dose-dependent cytotoxicity across the different doses (1 to 100 μM) leading to a 40% reduction of cell population. On the contrary, the cytotoxic activity of the ligands H2α-tocTHMA and H2δ-tocTHMA as well as the complexes 2 and 3 was depicted mainly at doses higher than 25 μΜ. Order of cytotoxic activity (100 μΜ) was found as following: H2δ-tocTHMA < H2α-tocTHMA < 4 < 1 < 3 < 2 (24 h), H2δ-tocTHMA = H2α-tocTHMA < 2 < 3 < 1 < 4 (48 h).
A similar cytotoxic profile was also seen against Hela cells (Figure 12). Twenty-four hours of exposure to the ligands and the complexes exerted a mild effect on cell viability even at the highest dose. At 48 h a slightly greater reduction in cell viability was recorded for both ligands and the complexes. Order of cytotoxic activity (100 μΜ): H2α-tocTHMA < 3 < 2 < H2δ-tocTHMA < 1 < 4 (24 h), H2α-tocTHMA < 1 < 3 = H2δ-tocTHMA < 2 < 4 (48 h).
Against embryonic mouse fibroblasts (NIH/3T3), the complexes exerted minimal toxicity after 24 h of incubation (Figure 13A,C). H2α-tocTHMA presented a strong cytotoxic effect after 48 h, a pattern similar to that seen against Cal33 cells. On the contrary, complexes 1 and 3 had no effect on cell viability and remained relatively non-toxic (Figure 13B). Complex 4 maintains the same cytotoxic profile, as seen in HeLa and Cal33 cells, exerting a mild reduction in cell viability across the range of doses (1–100 μM) whereas H2δ-tocTHMA and 2 were cytotoxic at concentrations higher than 25 μΜ (Figure 13D). Order of cytotoxic activity (100 μΜ) was found as follows: 2 > H2δ-tocTHMA > 1 = H2α-tocTHMA > 3 > 4 (24 h), H2δ-tocTHMA = 2 > H2α-tocTHMA > 1 > 4 > 3 (48 h).

4. Conclusions

Stepwise substitution reactions of cyanuric chloride with α- or δ-tocopherol and then with N-methylhydroxylamine resulted in the synthesis of the amphiphilic H2α-tocTHMA and H2δ-tocTHMA ligands. Reaction of the ligands with either the VIV starting materials [VIVO(acac)2] or VIVOSO4 afforded the complexes 1 and 2. Reaction of FeIIICl3 with H2α-tocTHMA or H2δ-tocTHMA resulted in the formation of complexes 3 and 4 respectively. The new compounds have been characterised by NMR, UV/Vis and infrared spectroscopies. The RSC activities for all compounds have been determined by the DPPH assay and the results showed than none of the molecules, ligands or complexes, exhibits antioxidant activity. On the contrary, EPR spectroscopy showed that 1 and 2 are radical initiators. All complexes exhibit high hydrolytic stability even at low concentrations similar to those used in cell viability studies. All complexes, 14, do not exerted significant cytotoxic activity against NIH/3T3, Cal33 and HeLa cell lines. The low cytotoxic activity is attributed to the low antioxidant-prooxidant activity of the tocopherol—triazine conjugate molecules. This is in line with the fact that 1 and 2 are moderate radical initiators. Previous studies support that the tocopherol–metal complexes with the hydroxy group of chromanol accessible to metal ion coordination, are stronger radical initiators than 1 and 2, and they exert high cytotoxic activity. However, we cannot exclude the structural differences of the chelate moieties that might induce various biological responses. Currently, the vitamin E metal complexes are rare, and more work is required, including synthesis of new compounds with specific structural features, in order to understand the mechanism of their reactivity.

Author Contributions

Conceptualization, A.D.K. and C.D.; data curation, M.L., I.H. and Y.V.S.; methodology, A.D.K., C.D., Y.V.S. and D.P.; writing—original draft, A.D.K., C.D. and Y.V.S.; writing—review and editing, A.D.K. and C.D. All authors have read and agreed to the published version of the manuscript.

Funding

This research received no external funding.

Institutional Review Board Statement

Not applicable.

Informed Consent Statement

Not applicable.

Data Availability Statement

Data is contained within the article.

Conflicts of Interest

The authors declare no conflict of interest.

References

  1. Michibata, H.; Sakurai, H. Vanadium in Biological Systems; Chasteen, N.D., Ed.; Kluer Academic Publishers: Dordrecht, The Netherlands, 1990; pp. 153–171. [Google Scholar]
  2. Crans, D.C.; Keramidas, A.D.; Hoover-Litty, H.; Anderson, O.P.; Miller, M.M.; Lemoine, L.M.; Pleasic-Williams, S.; Vandenberg, M.; Rossomando, A.J.; Sweet, L.J. Synthesis, structure, and biological activity of a new insulinomimetic peroxovanadium compound: Bisperoxovanadium imidazole monoanion. J. Am. Chem. Soc. 1997, 119, 5447–5448. [Google Scholar] [CrossRef]
  3. Rehder, D. The coordination chemistry of vanadium as related to its biological functions. Coord. Chem. Rev. 1999, 182, 297–322. [Google Scholar] [CrossRef]
  4. Kioseoglou, E.; Petanidis, S.; Gabriel, C.; Salifoglou, A. The chemistry and biology of vanadium compounds in cancer therapeutics. Coord. Chem. Rev. 2015, 301–302, 87–105. [Google Scholar] [CrossRef]
  5. Levina, A.; Lay, P.A. Stabilities and Biological Activities of Vanadium Drugs: What is the Nature of the Active Species? Chem. Asian J. 2017, 12, 1692–1699. [Google Scholar] [CrossRef] [PubMed]
  6. Harwood, C.S. Iron-Only and Vanadium Nitrogenases: Fail-Safe Enzymes or Something More? Annu. Rev. Microbiol. 2020, 74, 247–266. [Google Scholar] [CrossRef] [PubMed]
  7. Amante, C.; De Sousa-Coelho, A.L.; Aureliano, M. Vanadium and melanoma: A systematic review. Metals 2021, 11, 828. [Google Scholar] [CrossRef]
  8. Sciortino, G.; Maréchal, J.D.; Garribba, E. Integrated experimental/computational approaches to characterize the systems formed by vanadium with proteins and enzymes. Inorg. Chem. Front. 2021, 8, 1951–1974. [Google Scholar] [CrossRef]
  9. Costa Pessoa, J.; Garribba, E.; Santos, M.F.A.; Santos, S. Vanadium and proteins: Uptake, transport, structure, activity and function. Coord. Chem. Rev. 2015, 301–302, 49–86. [Google Scholar] [CrossRef]
  10. Pessoa, J.C.; Etcheverry, S.; Gambino, D. Vanadium compounds in medicine. Coord. Chem. Rev. 2015, 301–302, 24–48. [Google Scholar] [CrossRef]
  11. Rehder, D. The future of/for vanadium. Dalton Trans. 2013, 42, 11749–11761. [Google Scholar] [CrossRef]
  12. Crans, D.C.; Trujillo, A.M.; Pharazyn, P.S.; Cohen, M.D. How environment affects drug activity: Localization, compartmentalization and reactions of a vanadium insulin-enhancing compound, dipicolinatooxovanadium(V). Coord. Chem. Rev. 2011, 255, 2178–2192. [Google Scholar] [CrossRef]
  13. McLauchlan, C.C.; Peters, B.J.; Willsky, G.R.; Crans, D.C. Vanadium-phosphatase complexes: Phosphatase inhibitors favor the trigonal bipyramidal transition state geometries. Coord. Chem. Rev. 2015, 301–302, 163–199. [Google Scholar] [CrossRef]
  14. Willsky, G.R.; Chi, L.H.; Godzala, M.; Kostyniak, P.J.; Smee, J.J.; Trujillo, A.M.; Alfano, J.A.; Ding, W.; Hu, Z.; Crans, D.C. Anti-diabetic effects of a series of vanadium dipicolinate complexes in rats with streptozotocin-induced diabetes. Coord. Chem. Rev. 2011, 255, 2258–2269. [Google Scholar] [CrossRef] [Green Version]
  15. Crans, D.C.; Tarlton, M.L.; McLauchlan, C.C. Trigonal bipyramidal or square pyramidal coordination geometry? Investigating the most potent geometry for vanadium phosphatase inhibitors. Eur. J. Inorg. Chem. 2014, 2014, 4450–4468. [Google Scholar] [CrossRef]
  16. Crans, D.C.; Schoeberl, S.; Gaidamauskas, E.; Baruah, B.; Roess, D.A. Antidiabetic vanadium compound and membrane interfaces: Interface-facilitated metal complex hydrolysis. J. Biol. Inorg. Chem. 2011, 16, 961–972. [Google Scholar] [CrossRef]
  17. Sánchez-Lombardo, I.; Alvarez, S.; McLauchlan, C.C.; Crans, D.C. Evaluating transition state structures of vanadium-phosphatase protein complexes using shape analysis. J. Inorg. Biochem. 2015, 147, 153–164. [Google Scholar] [CrossRef]
  18. Crans, D.C. Antidiabetic, Chemical, and Physical Properties of Organic Vanadates as Presumed Transition-State Inhibitors for Phosphatases. J. Org. Chem. 2015, 80, 11899–11915. [Google Scholar] [CrossRef] [Green Version]
  19. Crans, D.C.; Henry, L.; Cardiff, G.; Posner, B.I. Developing Vanadium as an Antidiabetic or Anticancer Drug: A Clinical and Historical Perspective. Met. Ions Life Sci. 2019, 19, 203–230. [Google Scholar] [CrossRef]
  20. Kostova, I. Titanium and vanadium complexes as anticancer agents. Anti-Cancer Agents Med. Chem. 2009, 9, 827–842. [Google Scholar] [CrossRef] [PubMed]
  21. Bishayee, A.; Waghray, A.; Patel, M.A.; Chatterjee, M. Vanadium in the detection, prevention and treatment of cancer: The in vivo evidence. Cancer Lett. 2010, 294, 1–12. [Google Scholar] [CrossRef]
  22. Evangelou, A.M. Vanadium in cancer treatment. Crit. Rev. Oncol. Hematol. 2002, 42, 249–265. [Google Scholar] [CrossRef]
  23. León, I.E.; Cadavid-Vargas, J.F.; Di Virgilio, A.L.; Etcheverry, S. Vanadium, ruthenium and copper compounds: A new class of non-platinum Metallodrugs with anticancer activity. Curr. Med. Chem. 2016, 24, 112–148. [Google Scholar] [CrossRef]
  24. Crans, D.C.; Yang, L.; Haase, A.; Yang, X. Health Benefits of Vanadium and Its Potential as an Anticancer Agent. Met. Ions Life Sci. 2018, 18, 251–259. [Google Scholar] [CrossRef]
  25. Doucette, K.A.; Hassell, K.N.; Crans, D.C. Selective speciation improves efficacy and lowers toxicity of platinum anticancer and vanadium antidiabetic drugs. J. Inorg. Biochem. 2016, 165, 56–70. [Google Scholar] [CrossRef] [PubMed]
  26. Yan, B.; Stantic, M.; Zobalova, R.; Bezawork-Geleta, A.; Stapelberg, M.; Stursa, J.; Prokopova, K.; Dong, L.; Neuzil, J. Mitochondrially targeted vitamin E succinate efficiently kills breast tumour-initiating cells in a complex II-dependent manner. BMC Cancer 2015, 15, 401. [Google Scholar] [CrossRef] [PubMed] [Green Version]
  27. Dong, L.F.; Grant, G.; Massa, H.; Zobalova, R.; Akporiaye, E.; Neuzil, J. α-Tocopheryloxyacetic acid is superior to α-tocopheryl succinate in suppressing HER2-high breast carcinomas due to its higher stability. Int. J. Cancer 2012, 131, 1052–1058. [Google Scholar] [CrossRef] [PubMed] [Green Version]
  28. Dong, L.-F.; Neuzil, J. Vitamin E Analogues as Prototypic Mitochondria-Targeting Anti-cancer Agents. In Mitochondria: The Anti-Cancer Target for the Third Millennium; Neuzil, J., Pervaiz, S., Fulda, S., Eds.; Springer: Dordrecht, The Netherlands, 2014; pp. 151–181. [Google Scholar]
  29. Kovarova, J.; Bajzikova, M.; Vondrusova, M.; Stursa, J.; Goodwin, J.; Nguyen, M.; Zobalova, R.; Pesdar, E.A.; Truksa, J.; Tomasetti, M.; et al. Mitochondrial targeting of α-tocopheryl succinate enhances its anti-mesothelioma efficacy. Redox Rep. 2014, 19, 16–25. [Google Scholar] [CrossRef] [Green Version]
  30. Yap, W.N.; Chang, P.N.; Han, H.Y.; Lee, D.T.W.; Ling, M.T.; Wong, Y.C.; Yap, Y.L. γ-Tocotrienol suppresses prostate cancer cell proliferation and invasion through multiple-signalling pathways. Br. J. Cancer 2008, 99, 1832–1841. [Google Scholar] [CrossRef]
  31. Zingg, J.M. Molecular and cellular activities of vitamin E analogues. Mini-Rev. Med. Chem. 2007, 7, 545–560. [Google Scholar] [CrossRef]
  32. Dunn, B.K.; Richmond, E.S.; Minasian, L.M.; Ryan, A.M.; Ford, L.G. A nutrient approach to prostate cancer prevention: The selenium and vitamin e cancer prevention trial (SELECT). Nutr. Cancer 2010, 62, 896–918. [Google Scholar] [CrossRef] [Green Version]
  33. Vraka, P.S.; Drouza, C.; Rikkou, M.P.; Odysseos, A.D.; Keramidas, A.D. Synthesis and study of the cancer cell growth inhibitory properties of α-, γ-tocopheryl and γ-tocotrienyl 2-phenylselenyl succinates. Bioorg. Med. Chem. 2006, 14, 2684–2696. [Google Scholar] [CrossRef]
  34. Vraka, P.S.; Rikkou, M.N.; Drouza, C.; Keramidas, A.D.; Odysseos, A.D. Modulation of apoptotic signals with esterification of selenium and vitamin E in binary compounds. FEBS J. 2006, 273, 115. [Google Scholar]
  35. Pussinen, P.J.; Karten, B.; Wintersperger, A.; Reicher, H.; McLean, M.; Malle, E.; Sattler, W. The human breast carcinoma cell line HBL-100 acquires exogenous cholesterol from high-density lipoprotein via CLA-1 (CD-36 and LIMPII analogous 1)-mediated selective cholesteryl ester uptake. Biochem. J. 2000, 349, 559–566. [Google Scholar] [CrossRef]
  36. Hadjiadamou, I.; Vlasiou, M.; Spanou, S.; Simos, Y.; Papanastasiou, G.; Kontargiris, E.; Dhima, I.; Ragos, V.; Karkabounas, S.; Drouza, C.; et al. Synthesis of vitamin E and aliphatic lipid vanadium(IV) and (V) complexes, and their cytotoxic properties. J. Inorg. Biochem. 2020, 208, 111074. [Google Scholar] [CrossRef]
  37. Drouza, C.; Dieronitou, A.; Hadjiadamou, I.; Stylianou, M. Investigation of Phenols Activity in Early Stage Oxidation of Edible Oils by Electron Paramagnetic Resonance and19F NMR Spectroscopies Using Novel Lipid Vanadium Complexes As Radical Initiators. J. Agric. Food. Chem. 2017, 65, 4942–4951. [Google Scholar] [CrossRef]
  38. Crans, D.C.; Koehn, J.T.; Petry, S.M.; Glover, C.M.; Wijetunga, A.; Kaur, R.; Levina, A.; Lay, P.A. Hydrophobicity may enhance membrane affinity and anti-cancer effects of Schiff base vanadium(v) catecholate complexes. Dalton Trans. 2019, 48, 6383–6395. [Google Scholar] [CrossRef]
  39. Lemons, B.G.; Richens, D.T.; Anderson, A.; Sedgwick, M.; Crans, D.C.; Johnson, M.D. Stabilization of a vanadium(v)-catechol complex by compartmentalization and reduced solvation inside reverse micelles. New J. Chem. 2013, 37, 75–81. [Google Scholar] [CrossRef]
  40. Crans, D.C.; Keramidas, A.D.; Mahroof-Tahir, M.; Anderson, O.P.; Miller, M.M. Factors Affecting Solution Properties of Vanadium(V) Compounds:  X-ray Structure of β-cis-NH4[VO2(EDDA)]. Inorg. Chem. 1996, 35, 3599–3606. [Google Scholar] [CrossRef]
  41. Ekeltchik, I.; Gun, J.; Lev, O.; Shelkov, R.; Melman, A. Bis(hydroxyamino)triazines: Versatile and high-affinity tridentate hydroxylamine ligands for selective iron(III) chelation. Dalton Trans. 2006, 6, 1285–1293. [Google Scholar] [CrossRef] [PubMed]
  42. Nikolakis, V.A.; Tsalavoutis, J.T.; Stylianou, M.; Evgeniou, E.; Jakusch, T.; Melman, A.; Sigalas, M.P.; Kiss, T.; Keramidas, A.D.; Kabanos, T.A. Vanadium(V) compounds with the bis-(hydroxylamino)-1,3,5-triazine ligand, H2bihyat: Synthetic, structural, and physical studies of [V 2 VO3(bihyat)2] and of the enhanced hydrolytic stability species cis-[VVO2(bihyat)]. Inorg. Chem. 2008, 47, 11698–11710. [Google Scholar] [CrossRef] [PubMed]
  43. Stylianou, M.; Nikolakis, V.A.; Chilas, G.I.; Jakusch, T.; Vaimakis, T.; Kiss, T.; Sigalas, M.P.; Keramidas, A.D.; Kabanos, T.A. Molybdenum(VI) coordination chemistry of the N,N-disubstituted bis(hydroxylamido)-1,3,5-triazine ligand, H2bihyat. Water-assisted activation of the MoVI=O bond and reversible dimerization of cis-[MoVIO2(bihyat)] to [MoVI2O4(bihyat)2(H2O)2]. Inorg. Chem. 2012, 51, 13138–13147. [Google Scholar] [CrossRef]
  44. Hadjithoma, S.; Papanikolaou, M.G.; Leontidis, E.; Kabanos, T.A.; Keramidas, A.D. Bis(hydroxylamino)triazines: High Selectivity and Hydrolytic Stability of Hydroxylamine-Based Ligands for Uranyl Compared to Vanadium(V) and Iron(III). Inorg. Chem. 2018, 57, 7631–7643. [Google Scholar] [CrossRef]
  45. Chatterjee, P.B.; Abtab, S.M.T.; Bhattacharya, K.; Endo, A.; Shotton, E.J.; Teat, S.J.; Chaudhury, M. Hetero-bimetallic complexes involving vanadium(V) and rhenium(VII) centers, connected by unsupported μ-oxido bridge: Synthesis, characterization, and redox study. Inorg. Chem. 2008, 47, 8830–8838. [Google Scholar] [CrossRef]
  46. Espín, J.C.; Soler-Rivas, C.; Wichers, H.J.; García-Viguera, C. Anthocyanin-based natural colorants: A new source of antiradical activity for foodstuff. J. Agric. Food. Chem. 2000, 48, 1588–1592. [Google Scholar] [CrossRef]
  47. Avdikos, A.; Karkabounas, S.; Metsios, A.; Kostoula, O.; Havelas, K.; Binolis, J.; Verginadis, I.; Hatziaivazis, G.; Simos, I.; Evangelou, A. Anticancer effects on leiomyosarcoma-bearing Wistar rats after electromagnetic radiation of resonant radiofrequencies. Hell. J. Nucl. Med. 2007, 10, 95–101. [Google Scholar]
  48. Drouza, C.; Keramidas, A.D. Solid state and aqueous solution characterization of rectangular tetranuclear V(IV/V)-p-semiquinonate/hydroquinonate complexes exhibiting a proton induced electron transfer. Inorg. Chem. 2008, 47, 7211–7224. [Google Scholar] [CrossRef]
  49. Drouza, C.; Stylianou, M.; Papaphilippou, P.; Keramidas, A.D. Structural and electron paramagnetic resonance (EPR) characterization of novel vanadium(V/IV) complexes with hydroquinonate-iminodiacetate ligands exhibiting “noninnocent” activity. Pure Appl. Chem. 2013, 85, 329–342. [Google Scholar] [CrossRef]
  50. Etcheverry, S.B.; Williams, P.A.M. Medicinal chemistry of copper and vanadium bioactive compounds. In New Developments in Medicinal Chemistry; Nova Science Publishers, Inc.: Hauppauge, NY, USA, 2009; pp. 105–129. [Google Scholar]
Scheme 1. Hydroxylamino-triazine ligands and H3β-tocDEA. RO- is α- or δ-tocopherol. The donor atoms for metal ion coordination are in red colour.
Inorganics 09 00073 sch001
Scheme 2. Synthetic route for the organic compounds.
Inorganics 09 00073 sch002
Scheme 3. Synthetic route for the vanadium complexes.
Inorganics 09 00073 sch003
Figure 1. IR spectra of: 1 [v(V=O, 966 cm−1; (C=N triazine), 1579, 1529 cm−1; (Ph-O), 1242 cm−1; (N-O), 1092 cm−1]; 798 (V-O-V)] (black line), 2 [v(V=O, 966 cm−1; (C=N triazine), 1579, 1529 cm−1; (Ph-O), 1240 cm−1; (N-O), 1084 cm−1]; 798 (V-O-V) (red line), 3 [(C=N triazine), 1569, 1525 cm−1; (Ph-O), 1244 cm−1; (N-O), 1093 cm−1] (blue line).
Inorganics 09 00073 g001
Figure 2. 51V NMR spectra of CD3Cl solutions of 1, (A) 1.00 mM (B) 7.00 mM.
Inorganics 09 00073 g002
Scheme 4. Equilibrium between the monomer, 1m and the dimer, 1.
Inorganics 09 00073 sch004
Figure 3. 2D {1H} grNOESY spectrum of CDCl3 solution of 1 (1.00 mM). Exchange of CH3(a) and CH3(b) cross peaks in blue circles.
Inorganics 09 00073 g003
Scheme 5. Triazine resonance structures.
Inorganics 09 00073 sch005
Figure 4. UV-vis spectra of CHCl3 solutions of 0.500 mM of (A) 1m [λ(ε) = 493 nm (3600 M−1cm−1), 682 nm (1140 M−1 cm−1)] and (B) 2m [λ(ε) = 484 nm (2300 M−1 cm−1), 645 nm (860 M−1 cm−1)].
Inorganics 09 00073 g004
Figure 5. (A) UV-vis spectra of CHCl3 solutions of 0.100 mM of 3 [black line, λ(ε) = 560 nm (3200 M−1 cm−1)] and 4 [red line, λ(ε) = 535 nm (2200 M−1 cm−1)]. (B) Absorbance at 560 nm vs. the concentration of a-tocTMHA added in the CHCl3 solution of FeCl3 (1.00 mM).
Inorganics 09 00073 g005
Figure 6. 51V NMR spectra DMSO-d6:D2O (1:9) solutions of (A) NaVO3, (B) 1, (C) 2 at pD ~ 7. V1, V2, V4 are the vanadium oligomers.
Inorganics 09 00073 g006
Figure 7. 51V NMR spectra DMSO-d6:D2O (1:9) solutions of (A) 1.00 mM of 1 + 1.00 mM NaVO3, pD = 5.9 (B) 1.00 mM of 1 pD = 5.9 (C) 1.00 mM of 1 + 1.00 mM NaVO3, pD = 5.0 (D) 1.00 mM of 1, pD = 5.0. (E) 0.10 mM of 1, pD = 7.0. V10, V2, V4 are the vanadium oligomers.
Inorganics 09 00073 g007
Figure 8. UV-vis spectra of DMSO-d6:D2O (1:9) solutions of 0.500 mM of (A) 1 [λ(ε) = 490 nm (2000 M−1cm−1), 675 nm (900 M−1cm−1)] and (B) 2 [λ(ε) = 490 nm (1100 M−1cm−1), 675 nm (660 M−1cm−1)].
Inorganics 09 00073 g008
Figure 9. UV-vis spectra of DMSO-d6:D2O (1:9) solutions of 1 (A) 0.500 mM and (B) 0.100 mM, (C) graph of the absorption at 490 nm vs. concentration.
Inorganics 09 00073 g009
Figure 10. (A) X-band EPR spectra of virgin olive oil (0.500 g) vs. time after addition of 1 (0.720 μmole) at RT. The period between two continues spectra is 150 s. The total number of spectra is 30. (B) Intensity of the α-tocopheryl radical signal in X-band EPR spectra vs. time after the addition of the radical initiator in extra virgin olive oil (0.500 g), t = 0 s. Complex 1 (red colour), [VO(C18DEA)] (black colour). Different concentrations of radical initiator with respect to each VV catalytic site per molecule: filled circles (0.490 μmole), open circles (0.720 μmole). The fitting curves have been generated from quadratic equations.
Inorganics 09 00073 g010
Figure 11. Cytotoxicity of H2α-tocTHMA (A,B) and H2δ-tocTHMA (C,D) complexes against Cal33 cells after exposure for 24 (A,C) and 48 h (B,D), respectively.
Inorganics 09 00073 g011
Figure 12. Cytotoxicity of H2α-tocTHMA (A,B) and H2δ-tocTHMA (C,D) complexes against HeLa cells after exposure for 24 (A,C) and 48 h (B,D), respectively.
Inorganics 09 00073 g012
Figure 13. Cytotoxicity of H2α-tocTHMA (A,B) and H2δ-tocTHMA (C,D) complexes against NIH/3T3 cells after exposure for 24 (A,C) and 48 h (B,D), respectively.
Inorganics 09 00073 g013
Table 1. Rate constants (k2) for the RSC of the compounds under study.
Compoundsk2 (M−1s−1)
Toluene
α-tocTMHA7.0 ± 0.16
δ-tocTMHA12.5 ± 0.08
1m−0.88 ± 0.02
2m−0.88 ± 0.02
35.0 ± 0.09
4−0.75 ± 0.02
[VIVO(acac)2]6.8 ± 0.3
α-tocopherol [33]560 ± 80
Publisher’s Note: MDPI stays neutral with regard to jurisdictional claims in published maps and institutional affiliations.

