
Breakdown Properties of Cables with Different Inorganic, Insulating Nanomaterials


Mechanical and Electrical Engineering Institute, University of Electronic Science and Technology of China, Zhongshan Institute, Zhongshan 528400, China
*
Author to whom correspondence should be addressed.
Inorganics 2021, 9(12), 90; https://0-doi-org.brum.beds.ac.uk/10.3390/inorganics9120090
Submission received: 1 November 2021
/
Revised: 10 December 2021
/
Accepted: 16 December 2021
/
Published: 20 December 2021
Abstract
:The insulation performance of cable insulating materials can be optimised via matrix modification. Typically, low-density polyethylene (LDPE) is used as the matrix, and a certain proportion of nanoparticles are added to this matrix. To explore the effects of nanoparticles with different forms on the structural interface and crystal morphology of the material, nano-MMT and nano-ZnO were added to LDPE, and comparative experiments were carried out. Based on microscopic test results, material insulation performance changes before and after optimisation were observed. Then, simulation cable models with different insulating materials were developed. Based on the simulated electrical measurements, the thermal breakdown performance of the different insulating materials was tested. According to infrared stereo vision detection results, anomalous temperature points in the cables can be located accurately. Finally, based on macroscopic test results, we verified whether the inorganic, insulating nanomaterials meet the requirements for high-voltage transmission.
1. Introduction
High-voltage direct current is the key link in the power development process, and stable transmission determines the working efficiency of the high-voltage system. Optimising the insulation performance of cables has always been a research focus of current carriers. Low-density polyethylene (LDPE) possesses excellent electrical, chemical, and processing properties. It has been widely used as a traditional cable-insulating preparation material [1,2,3,4]. With the increasing demand for high-voltage transmission, cable insulation capacity must be strengthened. Breakdown property is an important indicator for determining the insulating properties of a material. LDPE has been used as the polymer matrix, with an inorganic filler added to this matrix [5,6,7,8,9]. In this way, the internal electric field of the cables is distributed uniformly, the dielectric loss of the material is reduced, and the material breakdown strength increases. This meets modern high-voltage transmission requirements [10,11,12,13].
Nanocomposites were first proposed by Lewis in the 1990s. As nanocomposites could improve the dielectric properties of materials effectively, researchers have studied them extensively and have achieved significant accomplishments. Many non-conductive nanoparticles, such as nano-MgO, nano-SiO2, and nano-Al2O3, can be used as the main filler, which can restrain space charges well. The dielectric properties of the materials were improved to some extent [14,15,16,17]. In 2009, Guo et al. [18] researched cables with a nano-ZnO/XLPE insulation. The quasi-static electric field in the cables was simulated and analysed, and a new method for insulation status detection was provided. In 2015, Zhang et al. [19] first proposed that the thermal state of cable terminals could be tested via infrared thermography. According to their test results, cables with nano-insulation possess good thermal breakdown properties. However, research on the micro-simulation/macro-conjoint analysis of nanocomposite insulation materials is limited. In this study, the effects of adding different nanoparticles on the microstructure and breakdown properties of composites were explored. Spherical nano-ZnO particles and lamellar nano-MMT particles were chosen as the filler, and LDPE was chosen as the matrix [20,21,22,23,24]. Based on the results, a new nano-insulation material with good insulation properties was prepared. The composite crystal morphology of the material was observed according to polarisation microscope (PLM) test results. Cable models with different insulation layers were built in COMSOL. The current field module was used for the cable electric field distribution and dielectric loss simulation experiments. Finally, three cables with different insulating materials were subjected to thermal breakdown tests. A series resonance power supply device was built, and the cable layers were measured using infrared stereovision. By combining the temperature anomalous point detection in infrared images with the thermal breakdown strength of different materials, a cable insulating material with excellent insulation properties could be explored.
2. Nanocomposite Preparation
The raw materials for preparing the nanocomposite were LDPE (JinLong chemical plant, Lanzhou, China), KH-570 silane coupling agent (SCA) (FeiXiang chemical plant, Shaoxing, China), nano-ZnO particles (particle diameter: 40 nm) (JinLong chemical plant, Lanzhou, China), nano-MMT particles (cation exchange value: 80 mol/g) (JinLong chemical plant, Lanzhou, China), 40% stearyl trimethyl ammonium chloride (STAC) (FeiXiang chemical plant, Shaoxing, China), 5% potassium permanganate solution (Dashan chemical plant, Hefei, China), 35% hydrochloric acid (Jinbei chemical plant, Liuzhou, China), 99% cyclohexane solution (Linchong chemical plant, Changchun, China), 52% NaOH solutionJinbei chemical plant, Liuzhou, China), 99.8% P-xylene solution (Daye chemical plant, Dongguan, China), and 70% acetone (Jinbei chemical plant, Liuzhou, China).
The experimental instruments for the cable insulation material preparation and characterisation included a vulcanising press (Fuxin RUbber Co. LTD, Fuxin, China), a PLM (Aunion Tech Co., Ltd., Shanghai, China), an industrial frequency AC experimental system (Wuhan Moen Intelligent Electric Co., Ltd., Wuhan, China), a vacuum coater(Yuedong vacuum equipment manufacture Co., Ltd., Shantou, China), a differential scanning calorimeter (DSC) (Shanghai Yanjin scientific instrument Co., Ltd., Shanghai, China), a node spectrum analyser((Yunfan equipment manufacture Co., Ltd., Shenzhen, China), a torque rheometer (Lihang equipment manufacture Co., Ltd., Qingzhou, China, and a picoammeter (Damei equipment manufacture Co., Ltd., Chongqing, China). The models and manufacturer information of these experiment instruments are presented in Table 1.
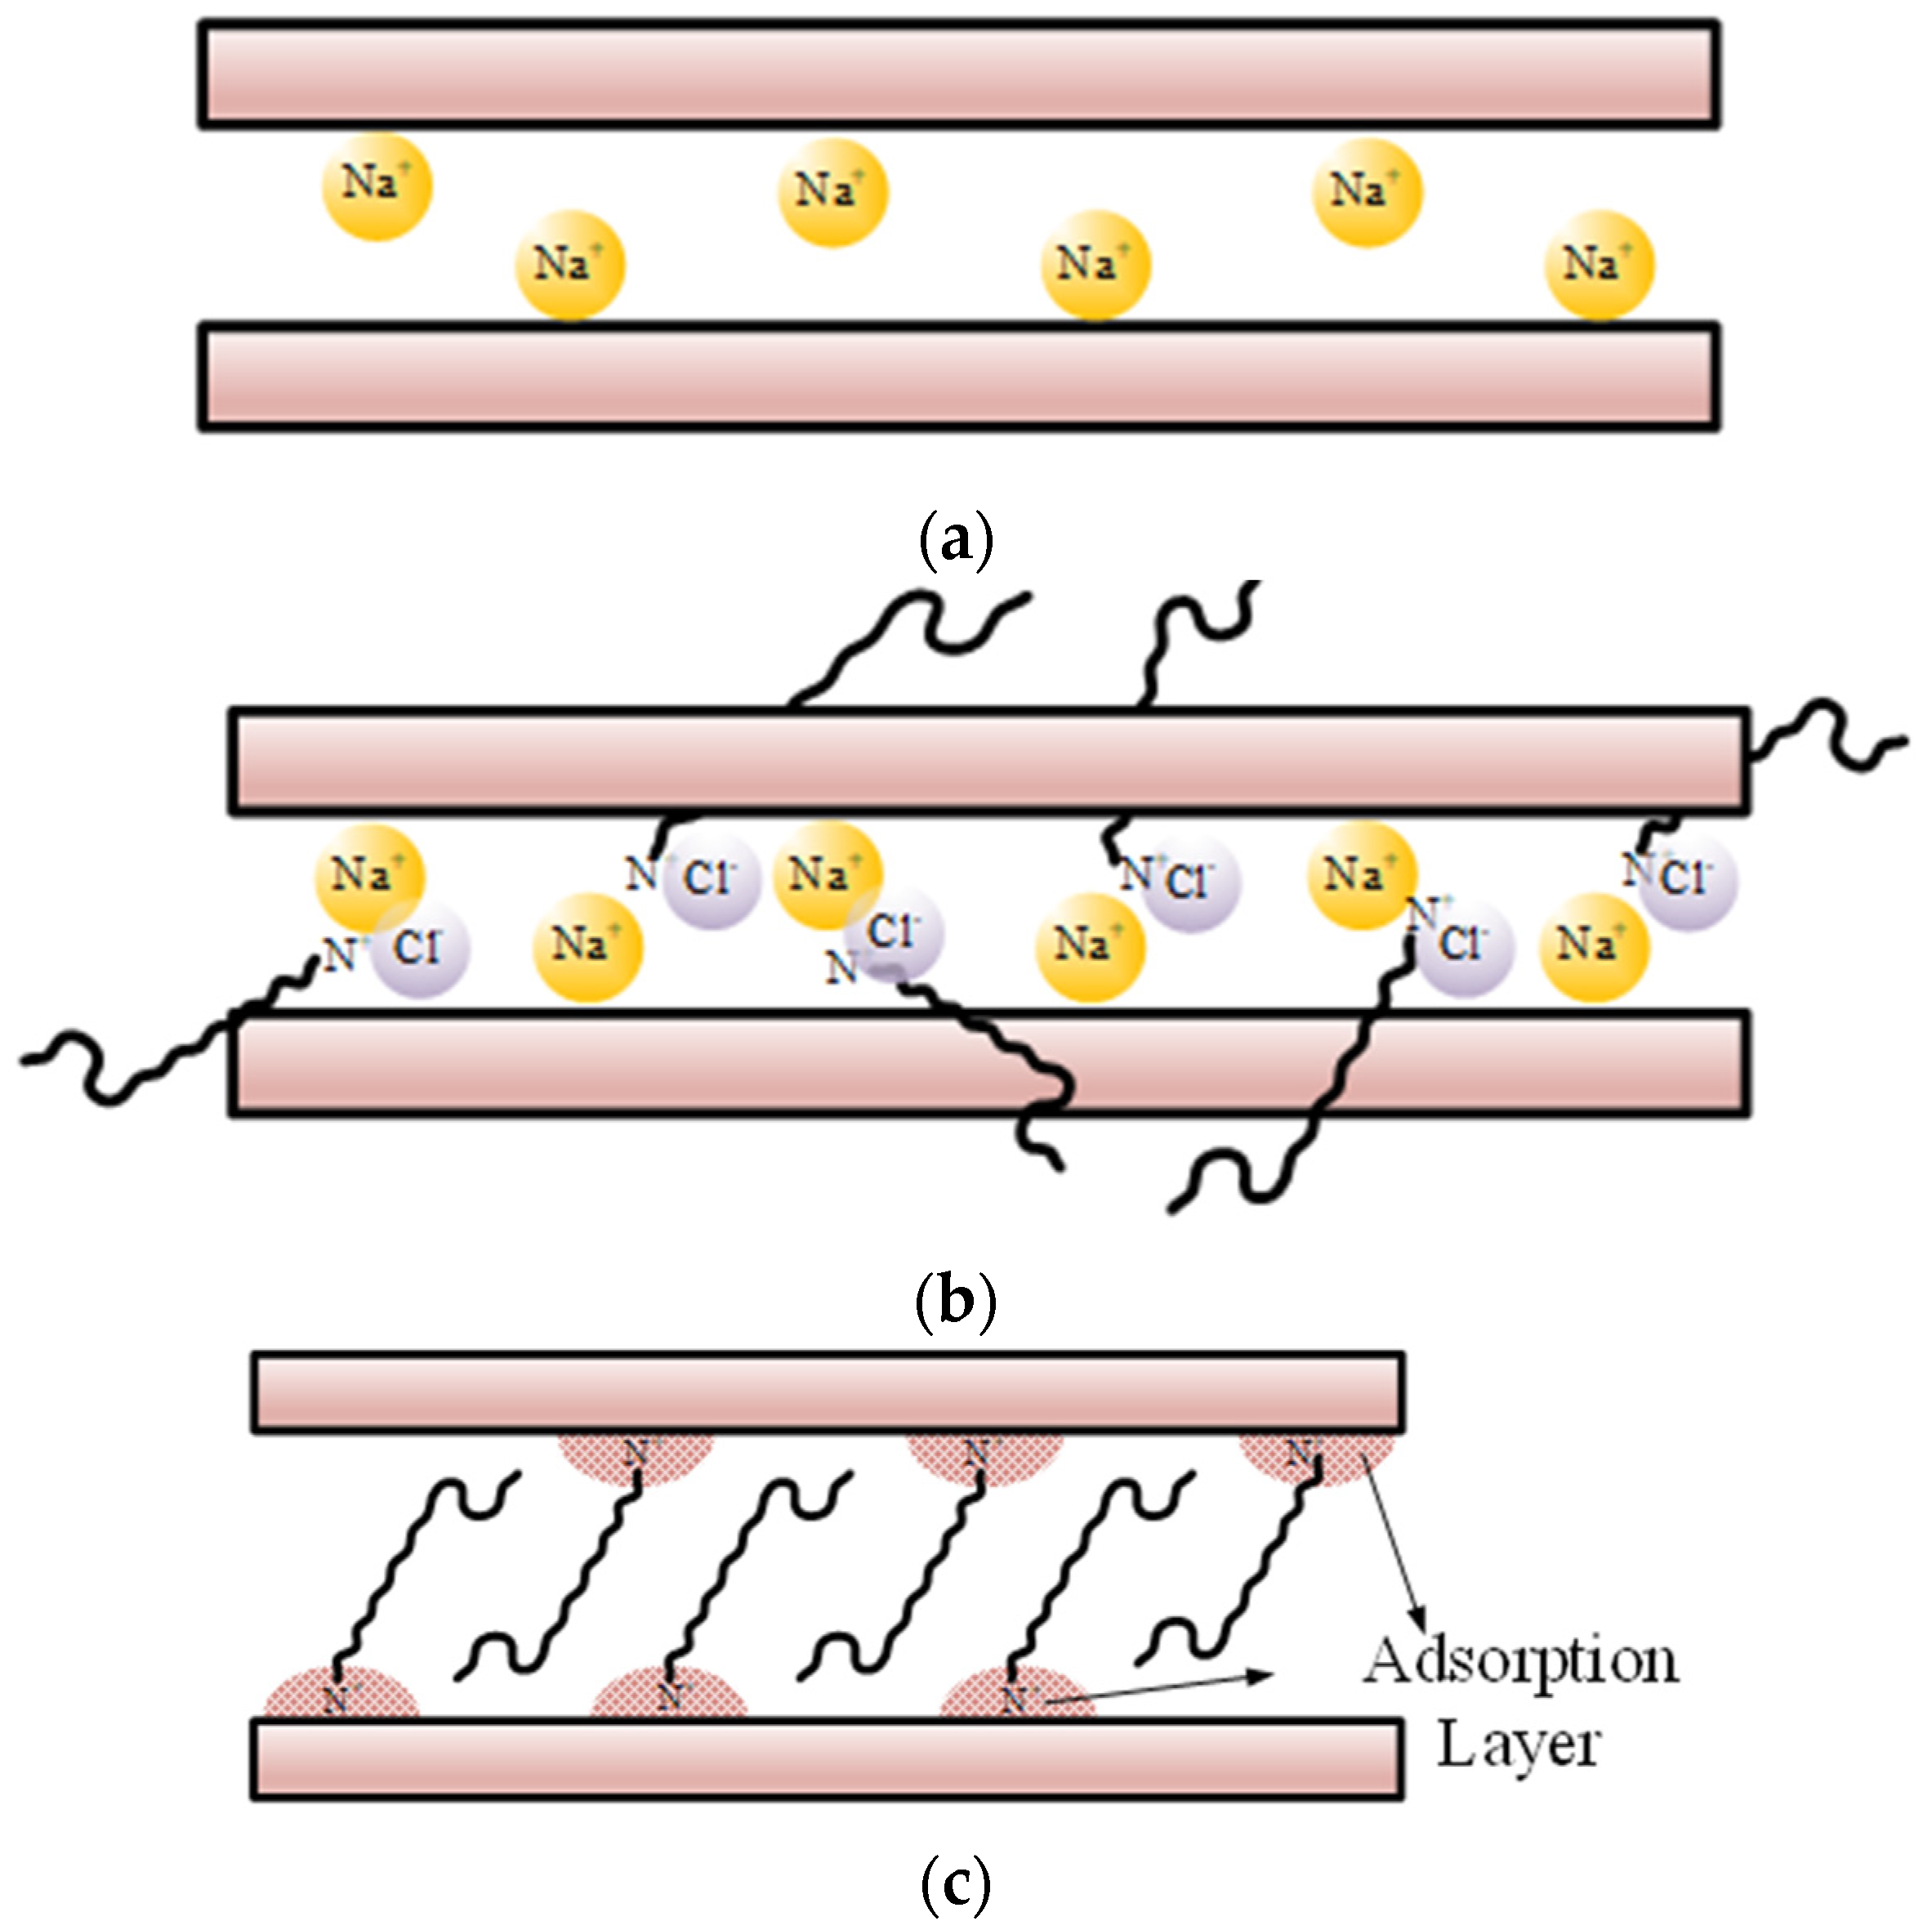
In this study, an intercalation agent was used to modify the nano-MMT particle surface. The experimental steps are as follows: First, the original MMT particles were added to distilled water, stirred to form a suspension, and then, STAC was added to this solution and stirred under at 80 °C for 2 h. A filter flask was used for decompression, and a core funnel was used to filter the mixture. Subsequently, a 1% silver nitrate solution was slowly added to the mixture to remove white sediment. Once the white sediment was removed completely, we stopped adding the silver nitrate solution. Finally, the mixture was dried in a vacuum drier. After carefully grinding the dried mixture, nano-MMT particles with surface modification were prepared. Figure 1 presents a schematic of nano-MMT particle surface modification by the intercalation agent.
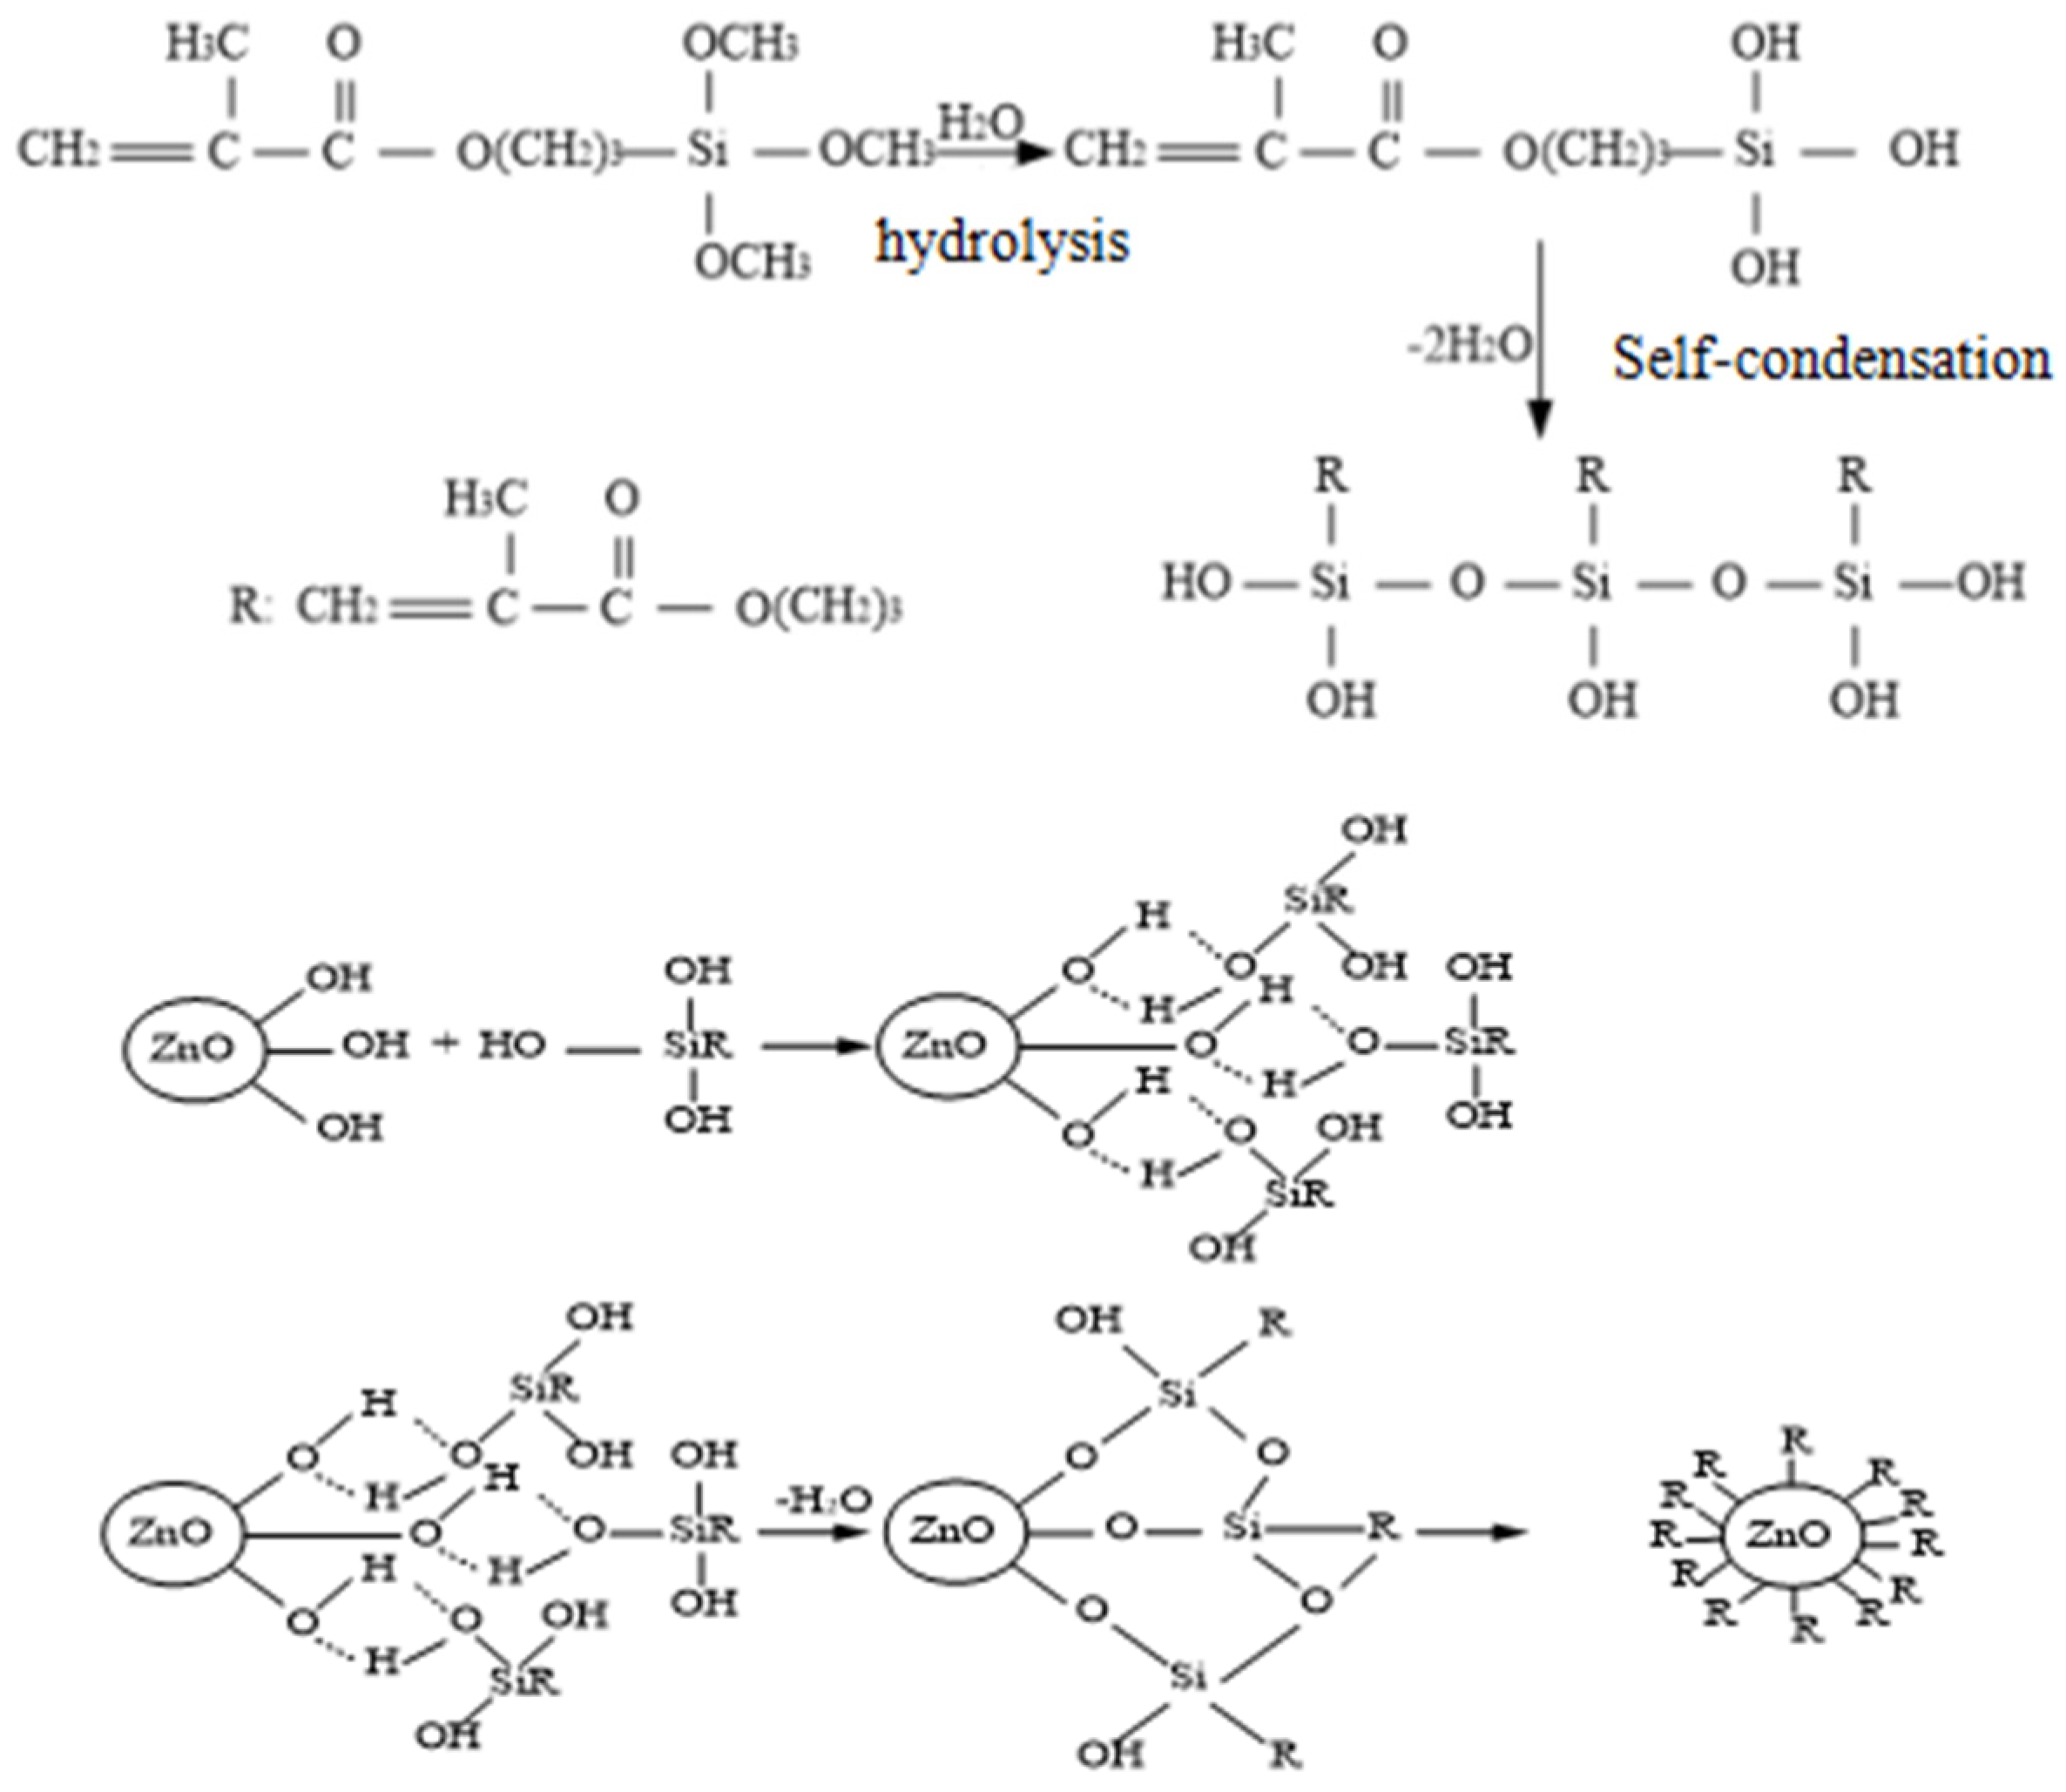
SCA was used in a similar manner to modify nano-ZnO particle surfaces. Specifically, first, absolute alcohol and distilled water were mixed. The original nano-ZnO particles were added to the mixture. After ultrasonic concussion for 1 h, the mixture was stirred under a constant temperature of 80 °C for 2 h. Subsequently, SCA was slowly added to the mixture. The filter flask was used for decompression, whereas the core funnel was used to filter the mixture. Then, the filtered material was dried. After carefully grinding the dried mixture, the nano-ZnO particles with surface modification were prepared. Figure 2 illustrates the surface modification mechanism by the SCA.
The steps for nanocomposite preparation are as follows: First, the nanoparticles were subjected to surface modification. Then, these nanoparticles reacted with the matrix LDPE under the 1010 antioxygen synergistic effect. This method involves melt blending. The nanoparticles and LDPE were fully mixed at a constant temperature of 150 °C and a uniform screw stirring speed of 40 rpm. Then, the mixture was dried. Finally, the nanocomposites were vulcanised.
3. Crystalline Structure Characterisation and Analysis
The material microstructure can be detected via PLM testing, from which different crystalline structures can be observed [25,26].
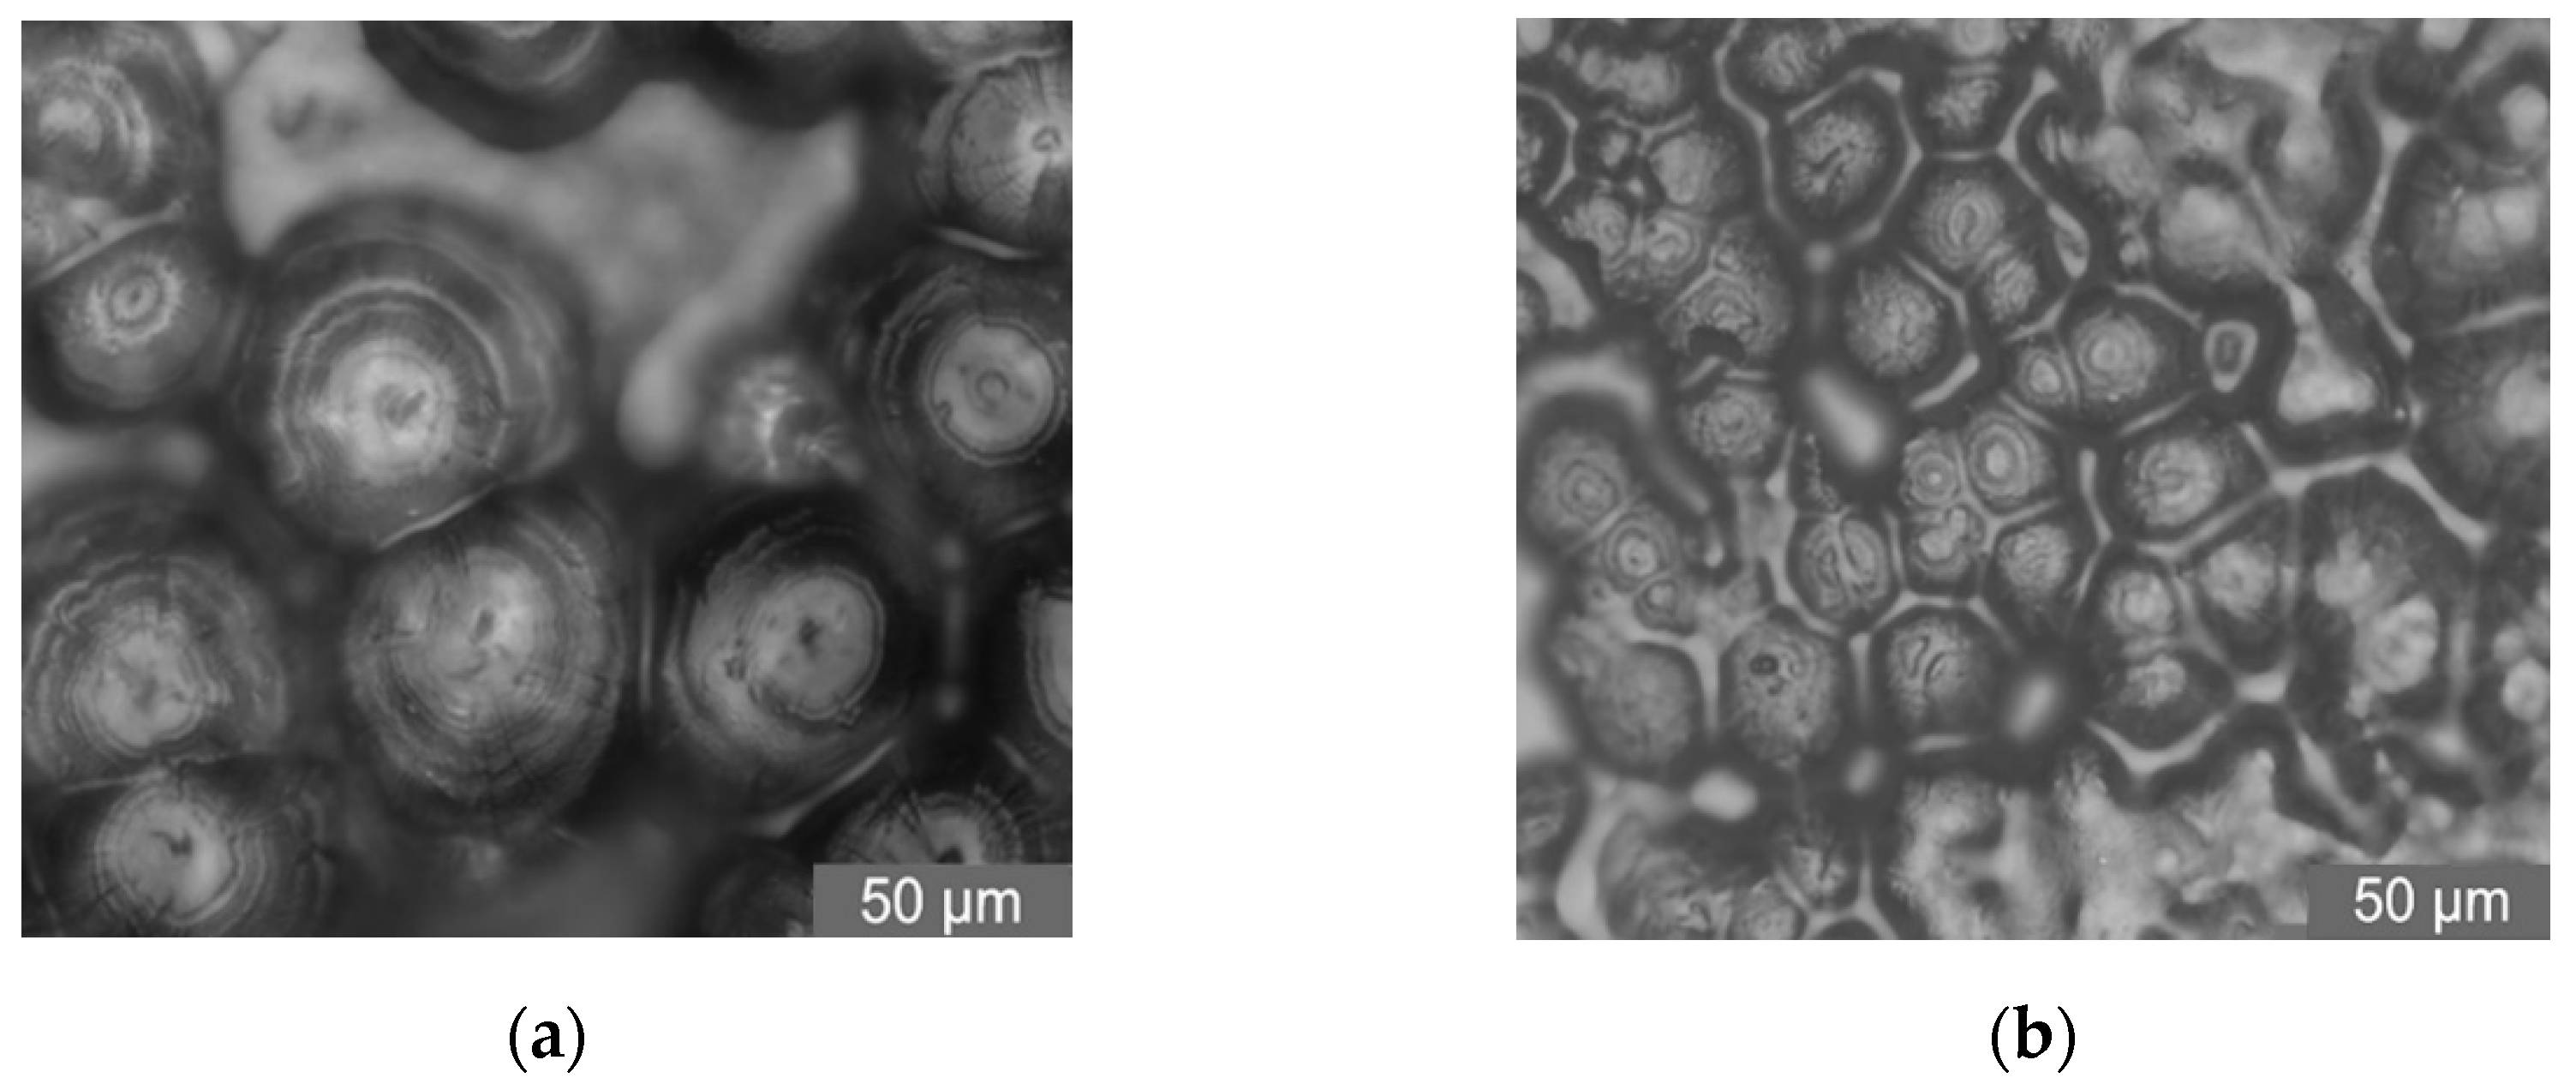
To characterise the effect of nanoparticle addition on polymer crystallisation, the crystalline morphology and size of pure LDPE, nano-MMT/LDPE, and nano-ZnO/LDPE samples were observed via PLM. The mass fraction of nanoparticles in the nanocomposites was 3%. The experimental results are shown in Figure 3.
As shown in Figure 3, the addition of nanoparticles reduces the polymer crystal size, and the interface between the spherocrystals is indistinct. In particular, the sample crystal size is significantly reduced when the fillers are nano-ZnO particles. The crystallites are closely arranged, and the interface structure increases. The crystal morphologies of the composites are complex. Moreover, the addition of different forms of nanoparticles changes the crystal size of the composites to varying degrees. Therefore, different crystal morphologies and interface structures have different effects on the insulation properties of the composites. This can be further verified in subsequent tests.
According to microscopic detection, the crystallinity and crystallisation rate are promoted in both nanocomposites. The trap density in the mediums increases, resulting in more deep traps. Additionally, the carriers in the trap reduce the carrier mobility, decreasing the conductivity. Furthermore, the carriers in the trap form a homopolar electric field to offset the partial external electric field in local areas, which decreases the local electric field intensity and increases the material breakdown field strength. Therefore, adding nano-ZnO and nano-MMT particles improves the polymer crystalline structure, from which the material interface structure becomes increasingly complex, and the amorphous structure increases. Among the samples, the improvements of the nano-ZnO/LDPE samples are more significant.
4. Simulation Test of Cable Breakdown Conditions
To verify that these nanocomposites possess excellent insulation characteristics, three cable models with different insulating materials were built in COMSOL for the simulation experiments. The current field module was used for the electric field distribution and dielectric loss experiments.
The boundary condition describes the physical field distribution in the simulated object boundary area. For 2D cable images, when the research target was an internal electric field, the cable insulation was set to zero potential energy. The potential value was set as the conductor boundary. Without special external factor disturbances, the other conditions were set to their default form. All the simulation cables maintained their current conservation state.
To visually detect the breakdown properties of the simulation cable insulation, cable internal electric field distribution and dielectric loss cloud images were built. In addition, four points in the three simulation cables were randomly selected. The electric field and loss values of these points were determined. According to the detection data, the breakdown strengths of the three cable insulating layers could be distinguished. The four points in the cable model are shown in Figure 4.
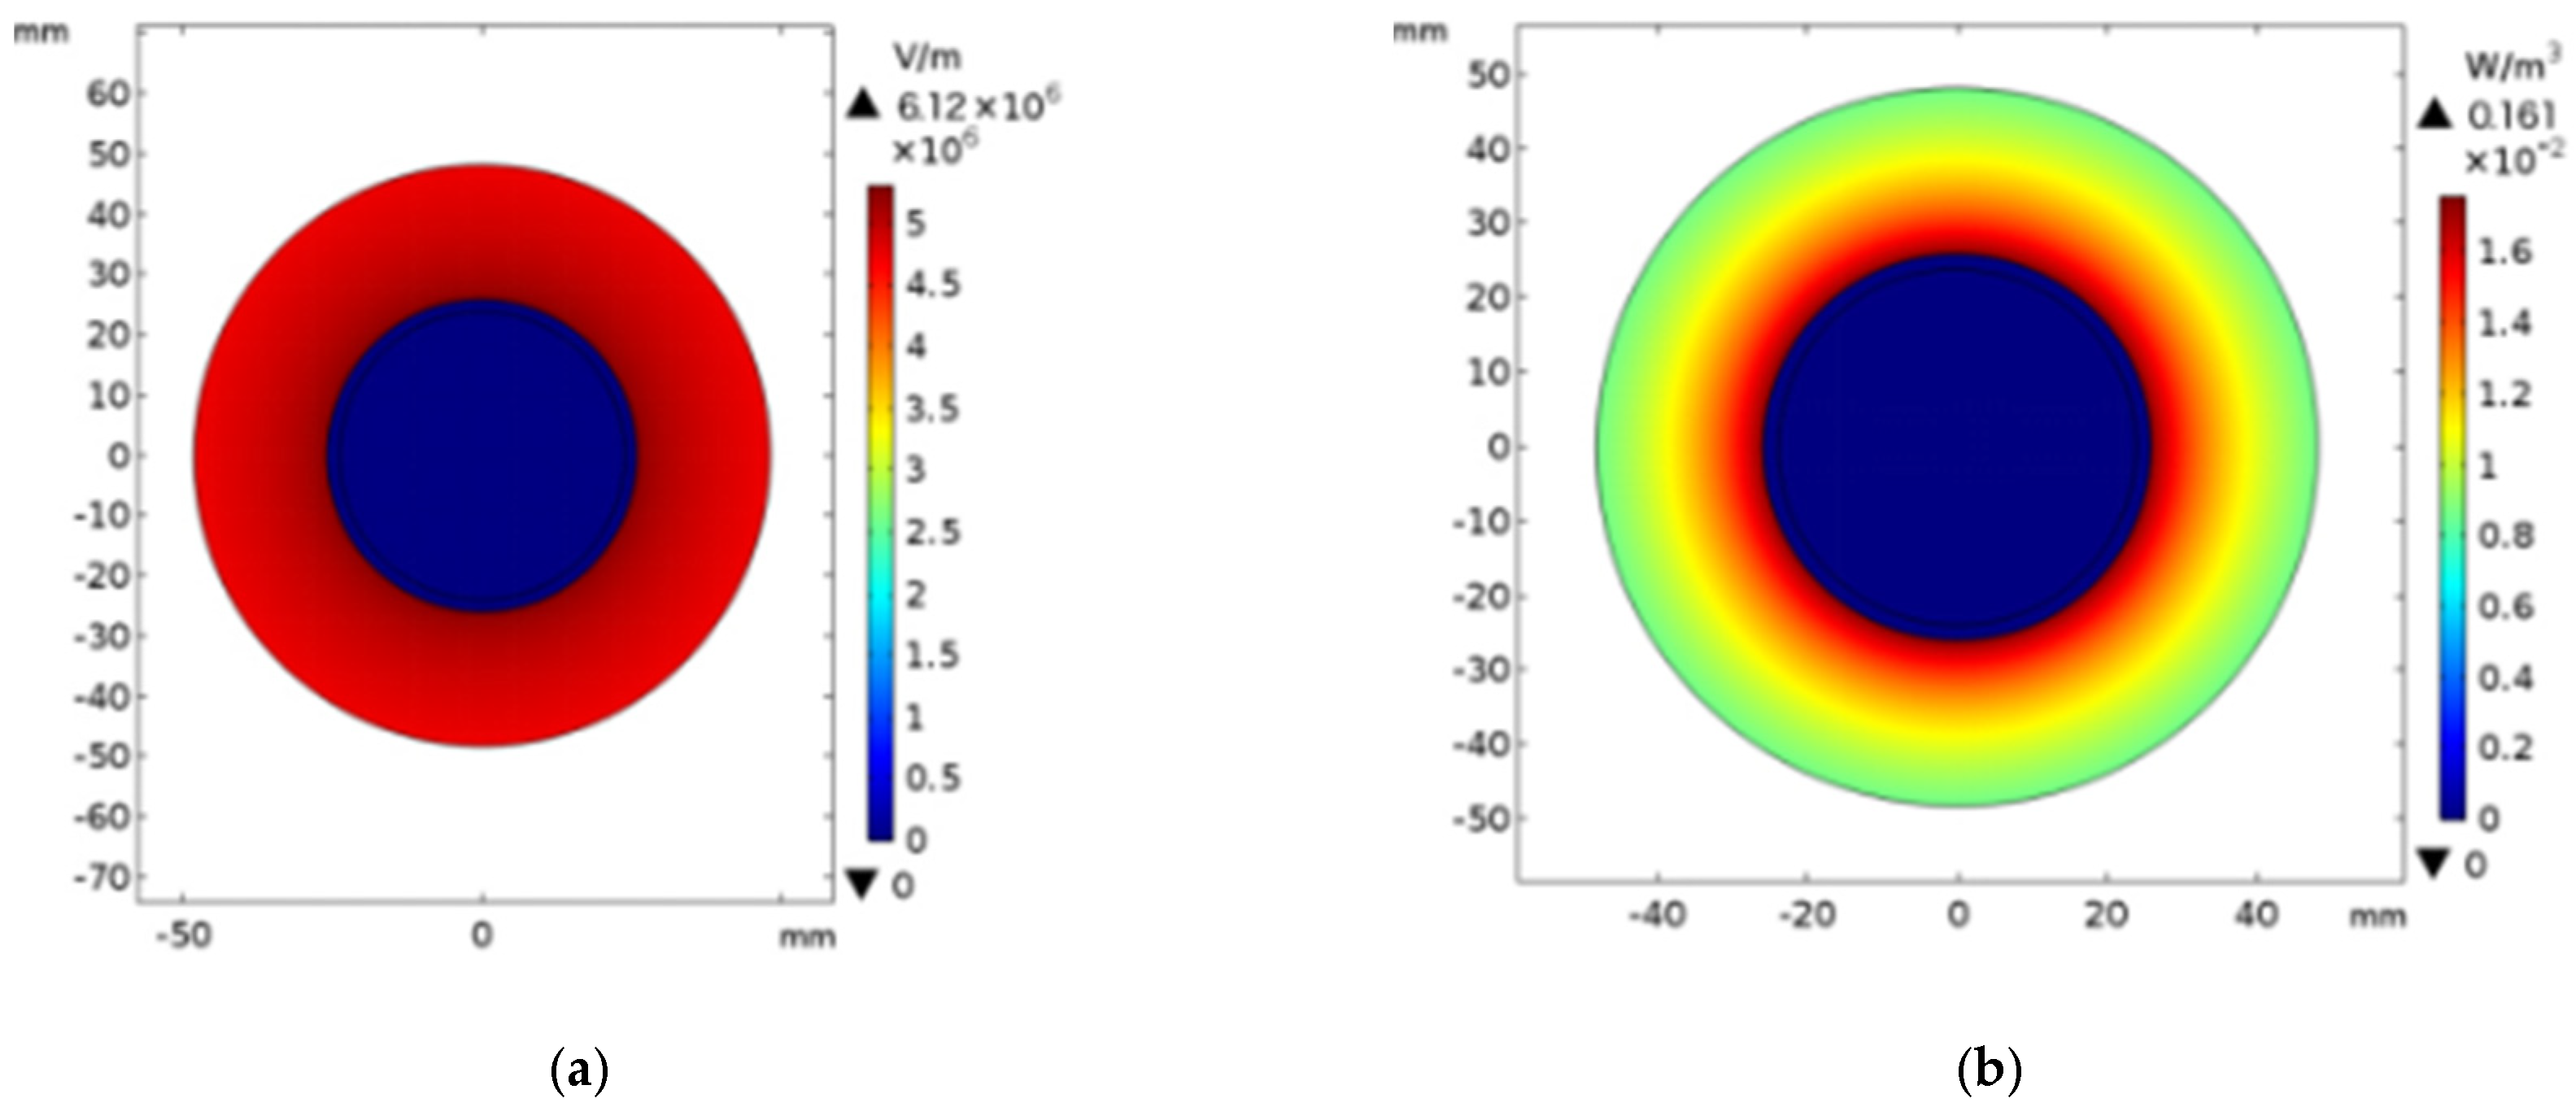
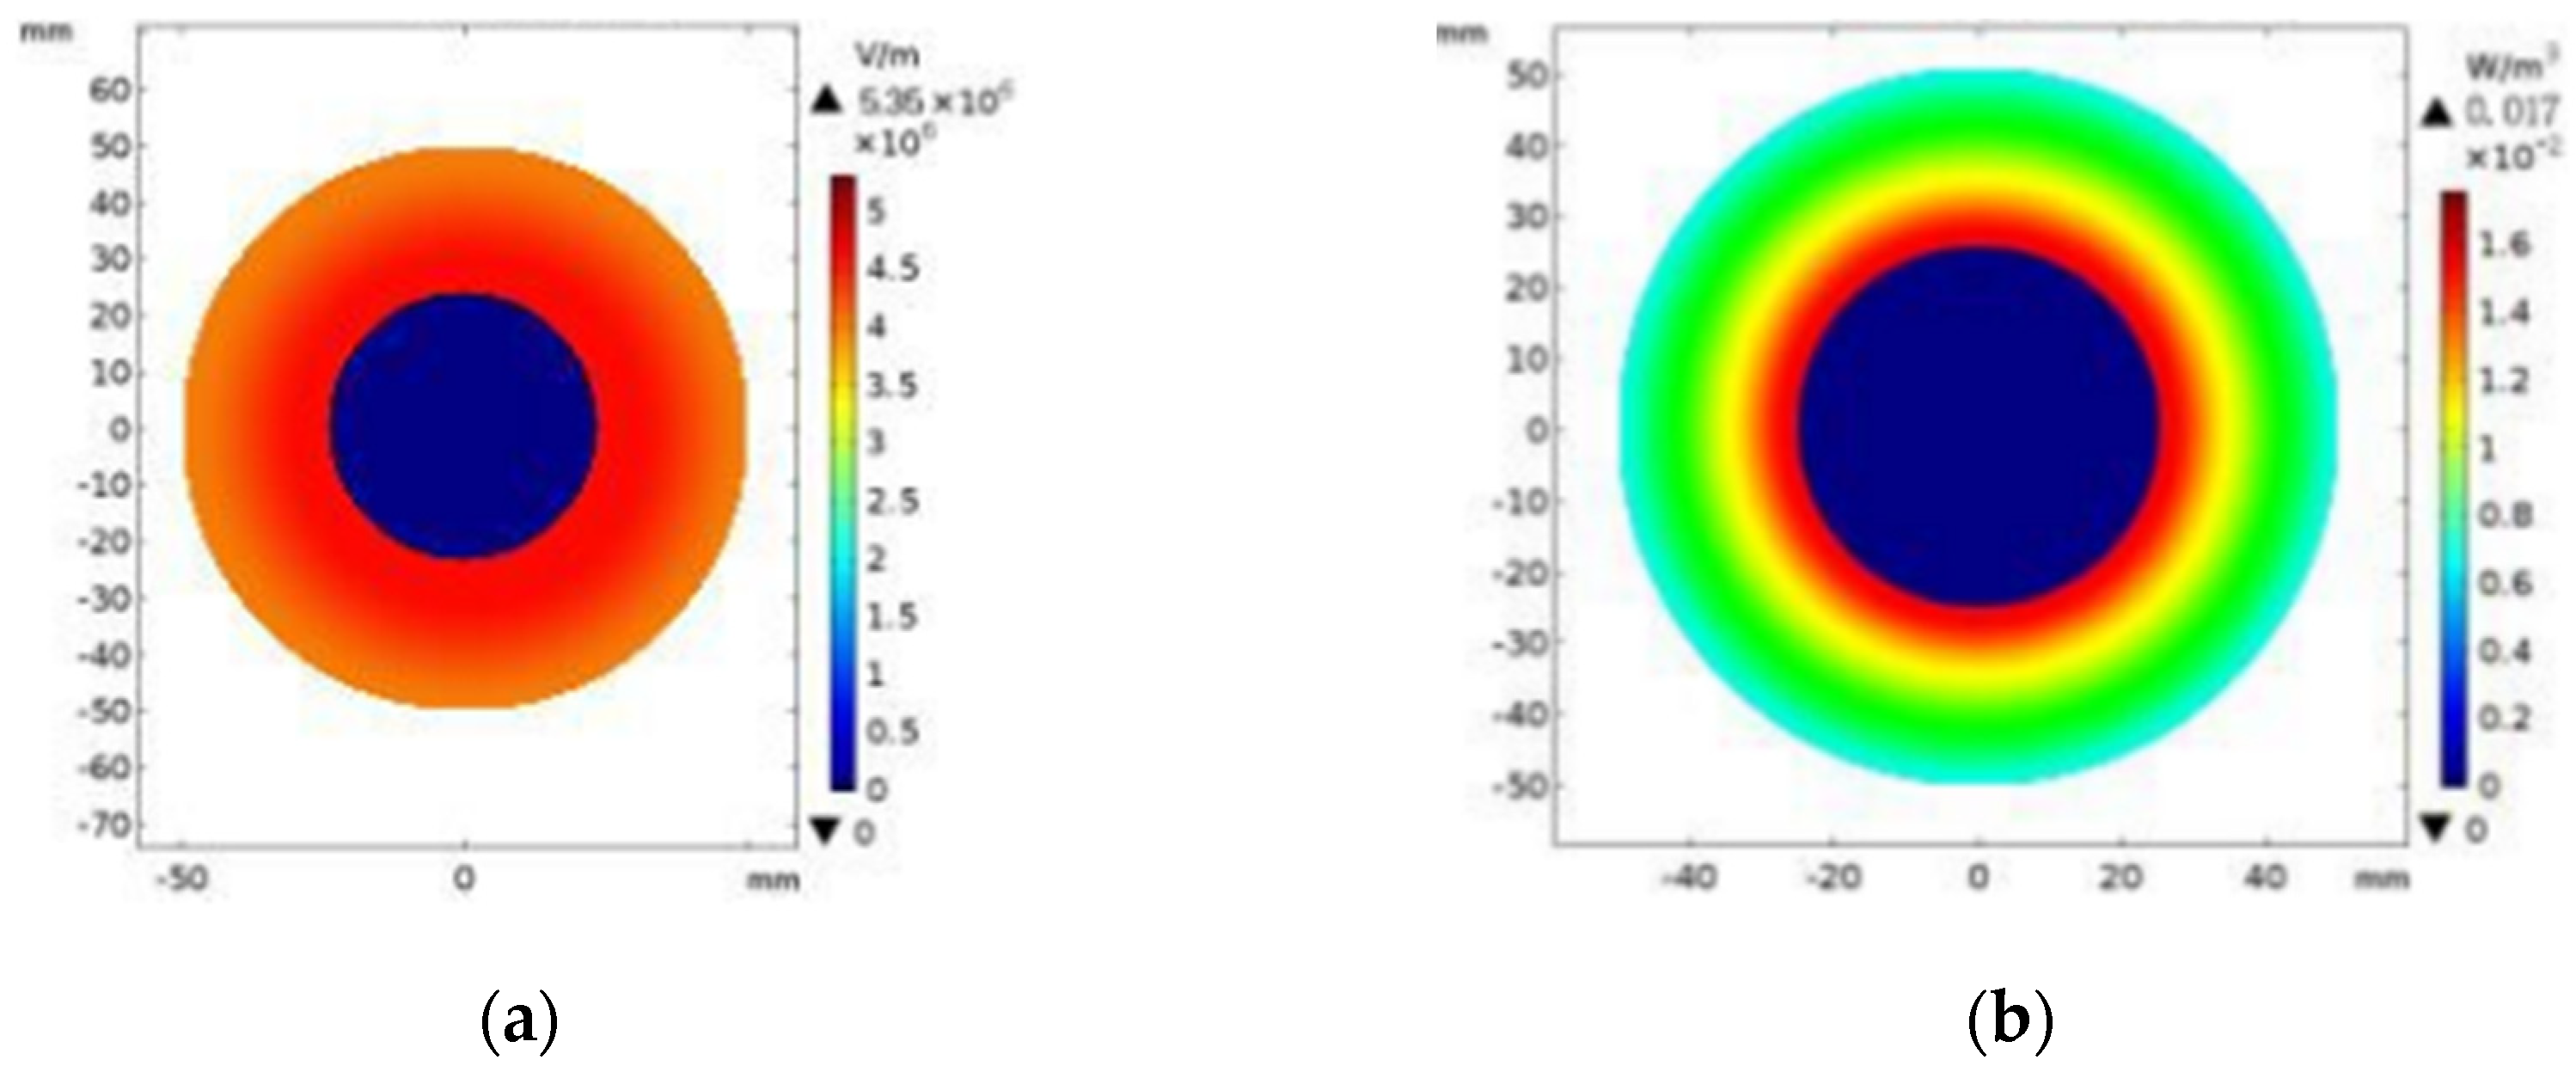
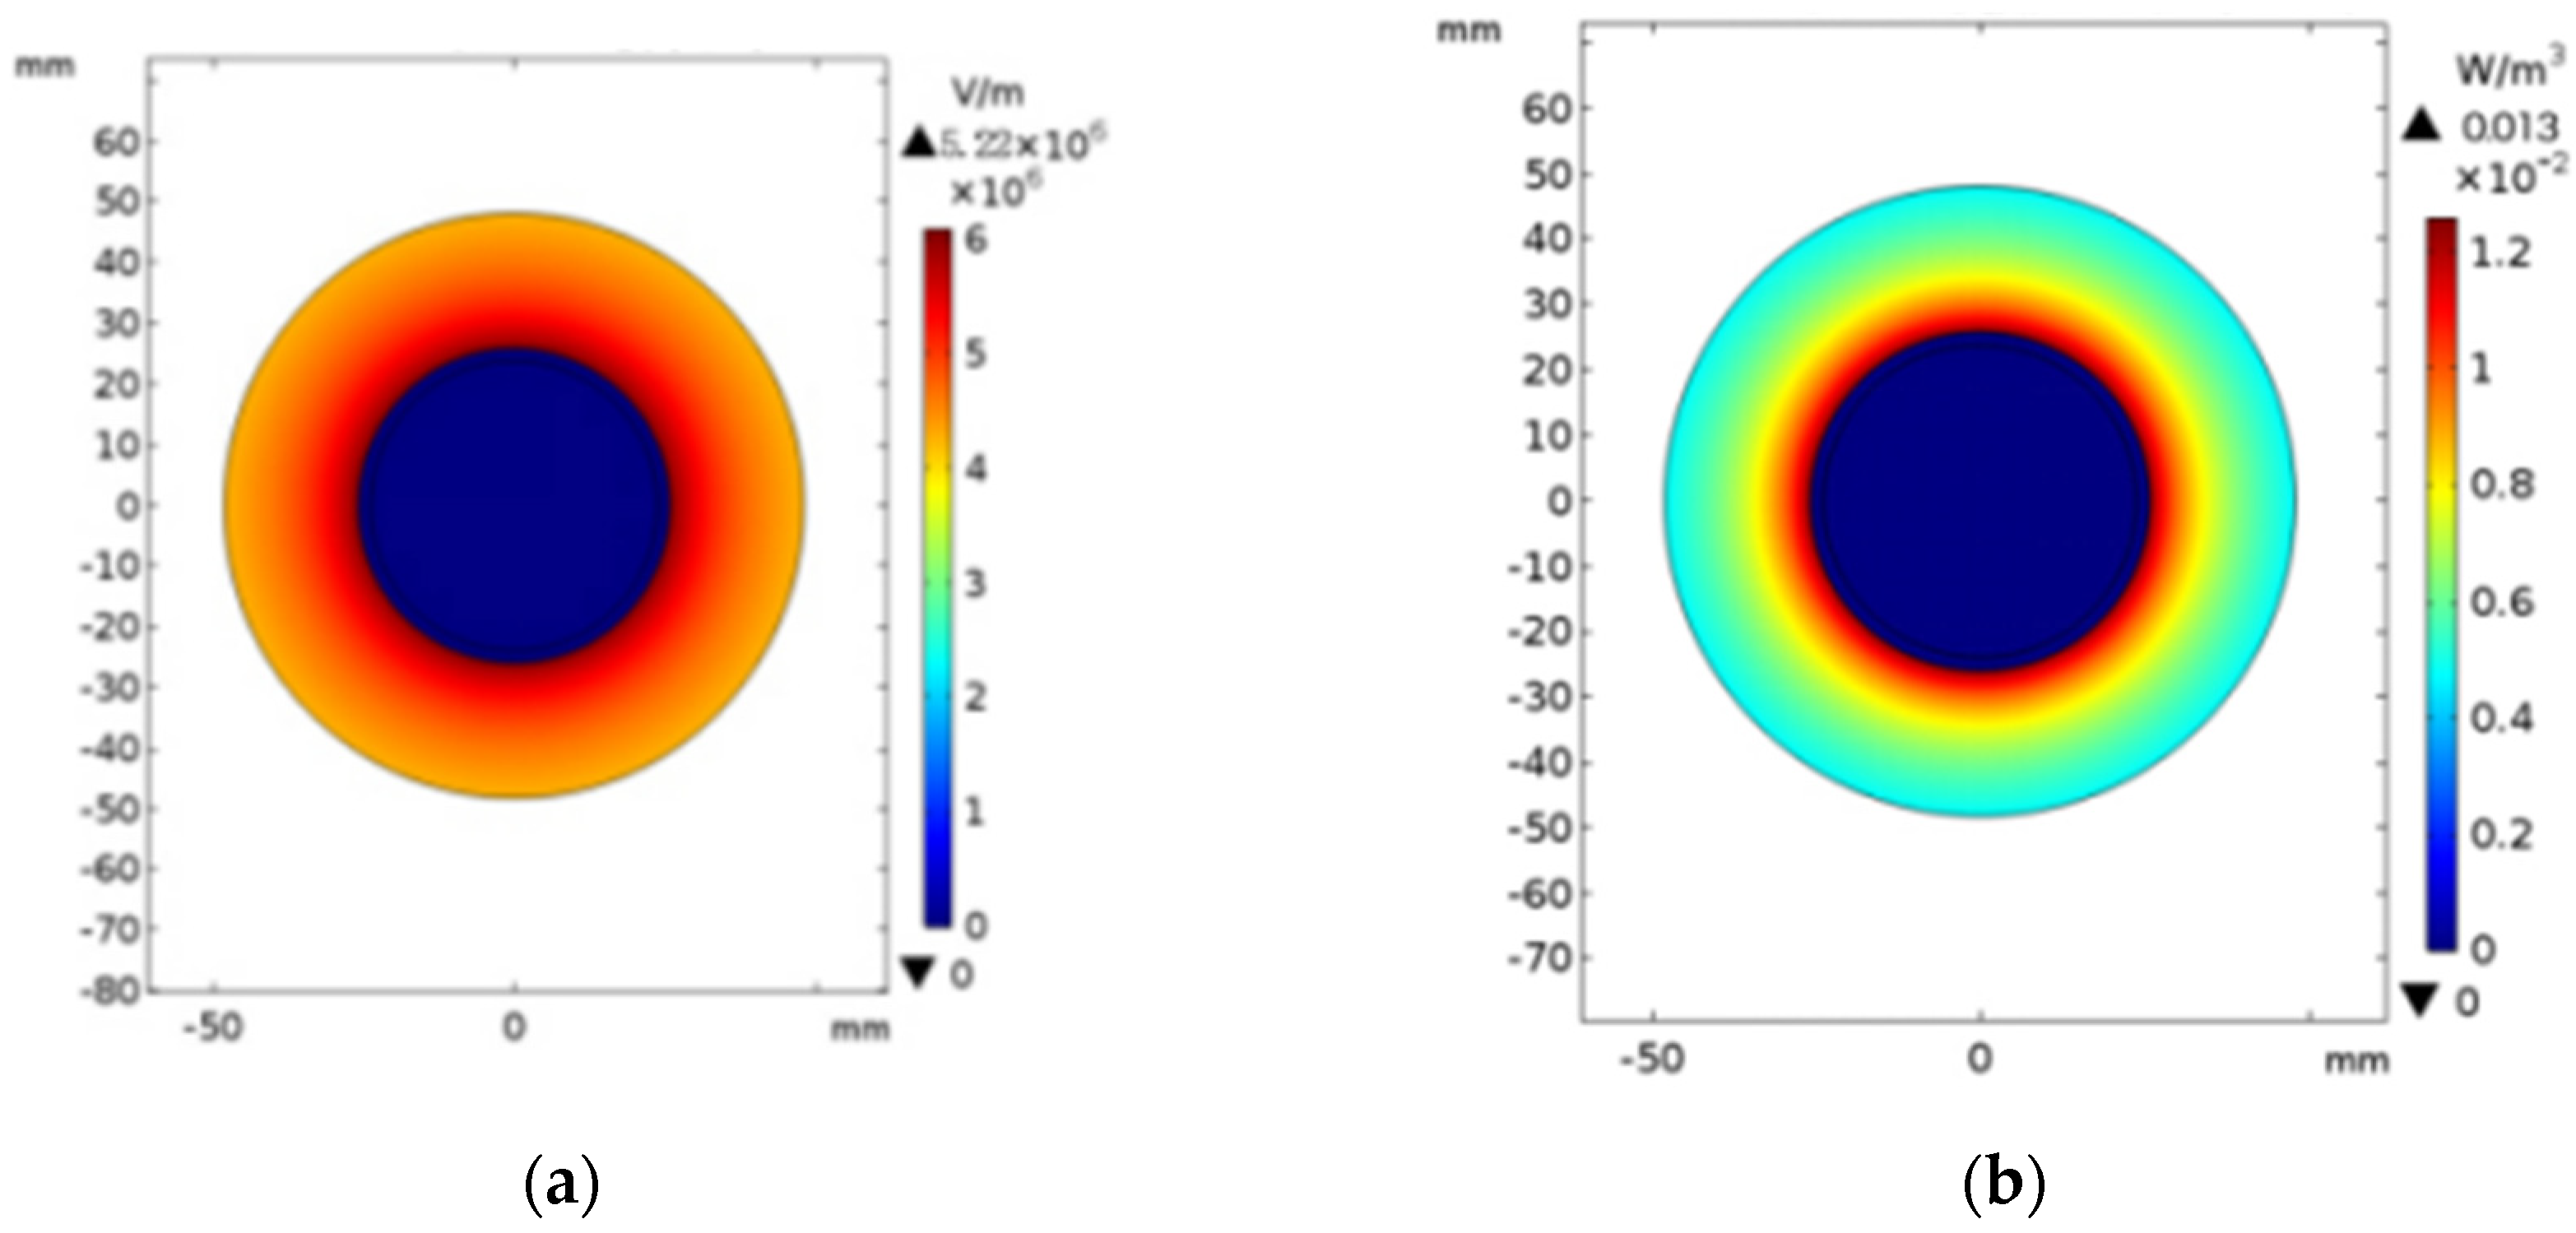
A current field module was applied to the simulation cables. The internal electric field distribution contours and dielectric loss density map of the simulation cables with the pure LDPE, nano-MMT/LDPE, and nano-ZnO/LDPE insulation materials are illustrated in Figure 5, Figure 6 and Figure 7.
The internal electric field distribution contours and dielectric loss density map of the simulation cables with nano-MMT/LDPE insulation material are shown in Figure 6.
The internal electric field distribution contours and dielectric loss density map of the simulation cables with nano-ZnO/LDPE insulation material are shown in Figure 7.
According to the internal electric field distribution contours of the simulation cables with different insulation materials, the simulation cable with the pure LDPE insulation material exhibited field strength distribution reversal (Figure 5a). Therefore, the external electric field of the cables was much higher than their internal electric field. From the test results, the steady-state maximum electric field of the cable with the pure LDPE insulation material was the highest (6,117,678.1 V/m). The steady-state maximum electric field of the cables with nano-MMT/LDPE and nano-ZnO/LDPE insulation materials decreased to 5,347,354.0 and 5,223,001.7 V/m, respectively. Meanwhile, the steady-state electric field average test results of the pure LDPE, nano-MMT/LDPE, and nano-ZnO/LDPE insulation materials were similar, i.e., 3,447,236.5, 3,484,378.3, and 3,490,814.9 V/m, respectively. Therefore, adding inorganic nanoparticles to the LDPE matrix could uniformly distribute the steady-state electric field. From Figure 7a, the electric field value gaps between the cable insulation layer inside and outside were small. The electrical breakdown strength of the nano-ZnO/LDPE composite was the highest.
From the dielectric loss detection images of the simulation cables with different insulation materials, the dielectric loss of the LDPE insulation material was relatively significant under the current field (Figure 5b). The maximum loss was 0.1609 W/m3. However, the dielectric loss of nano-MMT/LDPE and nano-ZnO/LDPE insulation materials decreased (Figure 6b and Figure 7b, respectively). The maximum losses were 0.0173 and 0.0127 W/m3, respectively. From the test results, the nanocomposites effectively improved the cable service life. Among them, the thermal breakdown strength of nano-ZnO/LDPE insulation material was the highest and more durable. The internal electric field maximum, dielectric loss maximum, and current average value of the three simulation cables are listed in Table 2.
From Table 2 and Table 3, under the current field, the electric field value gaps of each detection point in the nanocomposites were small. In addition, the dielectric loss of the nanocomposites was low. Among them, the electric field distribution in the nano-ZnO/LDPE composite was uniform, and its dielectric loss was the lowest. These experimental results were consistent with previous breakdown property tests.
5. Infrared Detection of Fault Points in Cable Insulation Materials
The traditional cable insulation material breakdown test is considered effective for verifying the improvement in the material insulation property after nanoparticle optimisation. The detecting subjects were the insulation material test samples, which were not the real cable insulation layers. This is because when cables are put into service, it is difficult to conduct a breakdown test. Cable overheating during operation due to dielectric loss is difficult to detect, which increases the thermal breakdown probability of the cable insulation layer. Therefore, a real-time detection method for cable insulation conditions is proposed herein. The temperature anomaly points in the cables can be detected via infrared images. The temperature anomaly points can be accurately pinpointed according to a quick and intuitive method. From this, the thermal breakdown properties of different cable insulation materials can be distinguished, which is convenient for cable maintenance.
5.1. Establishment of the Experimental Device
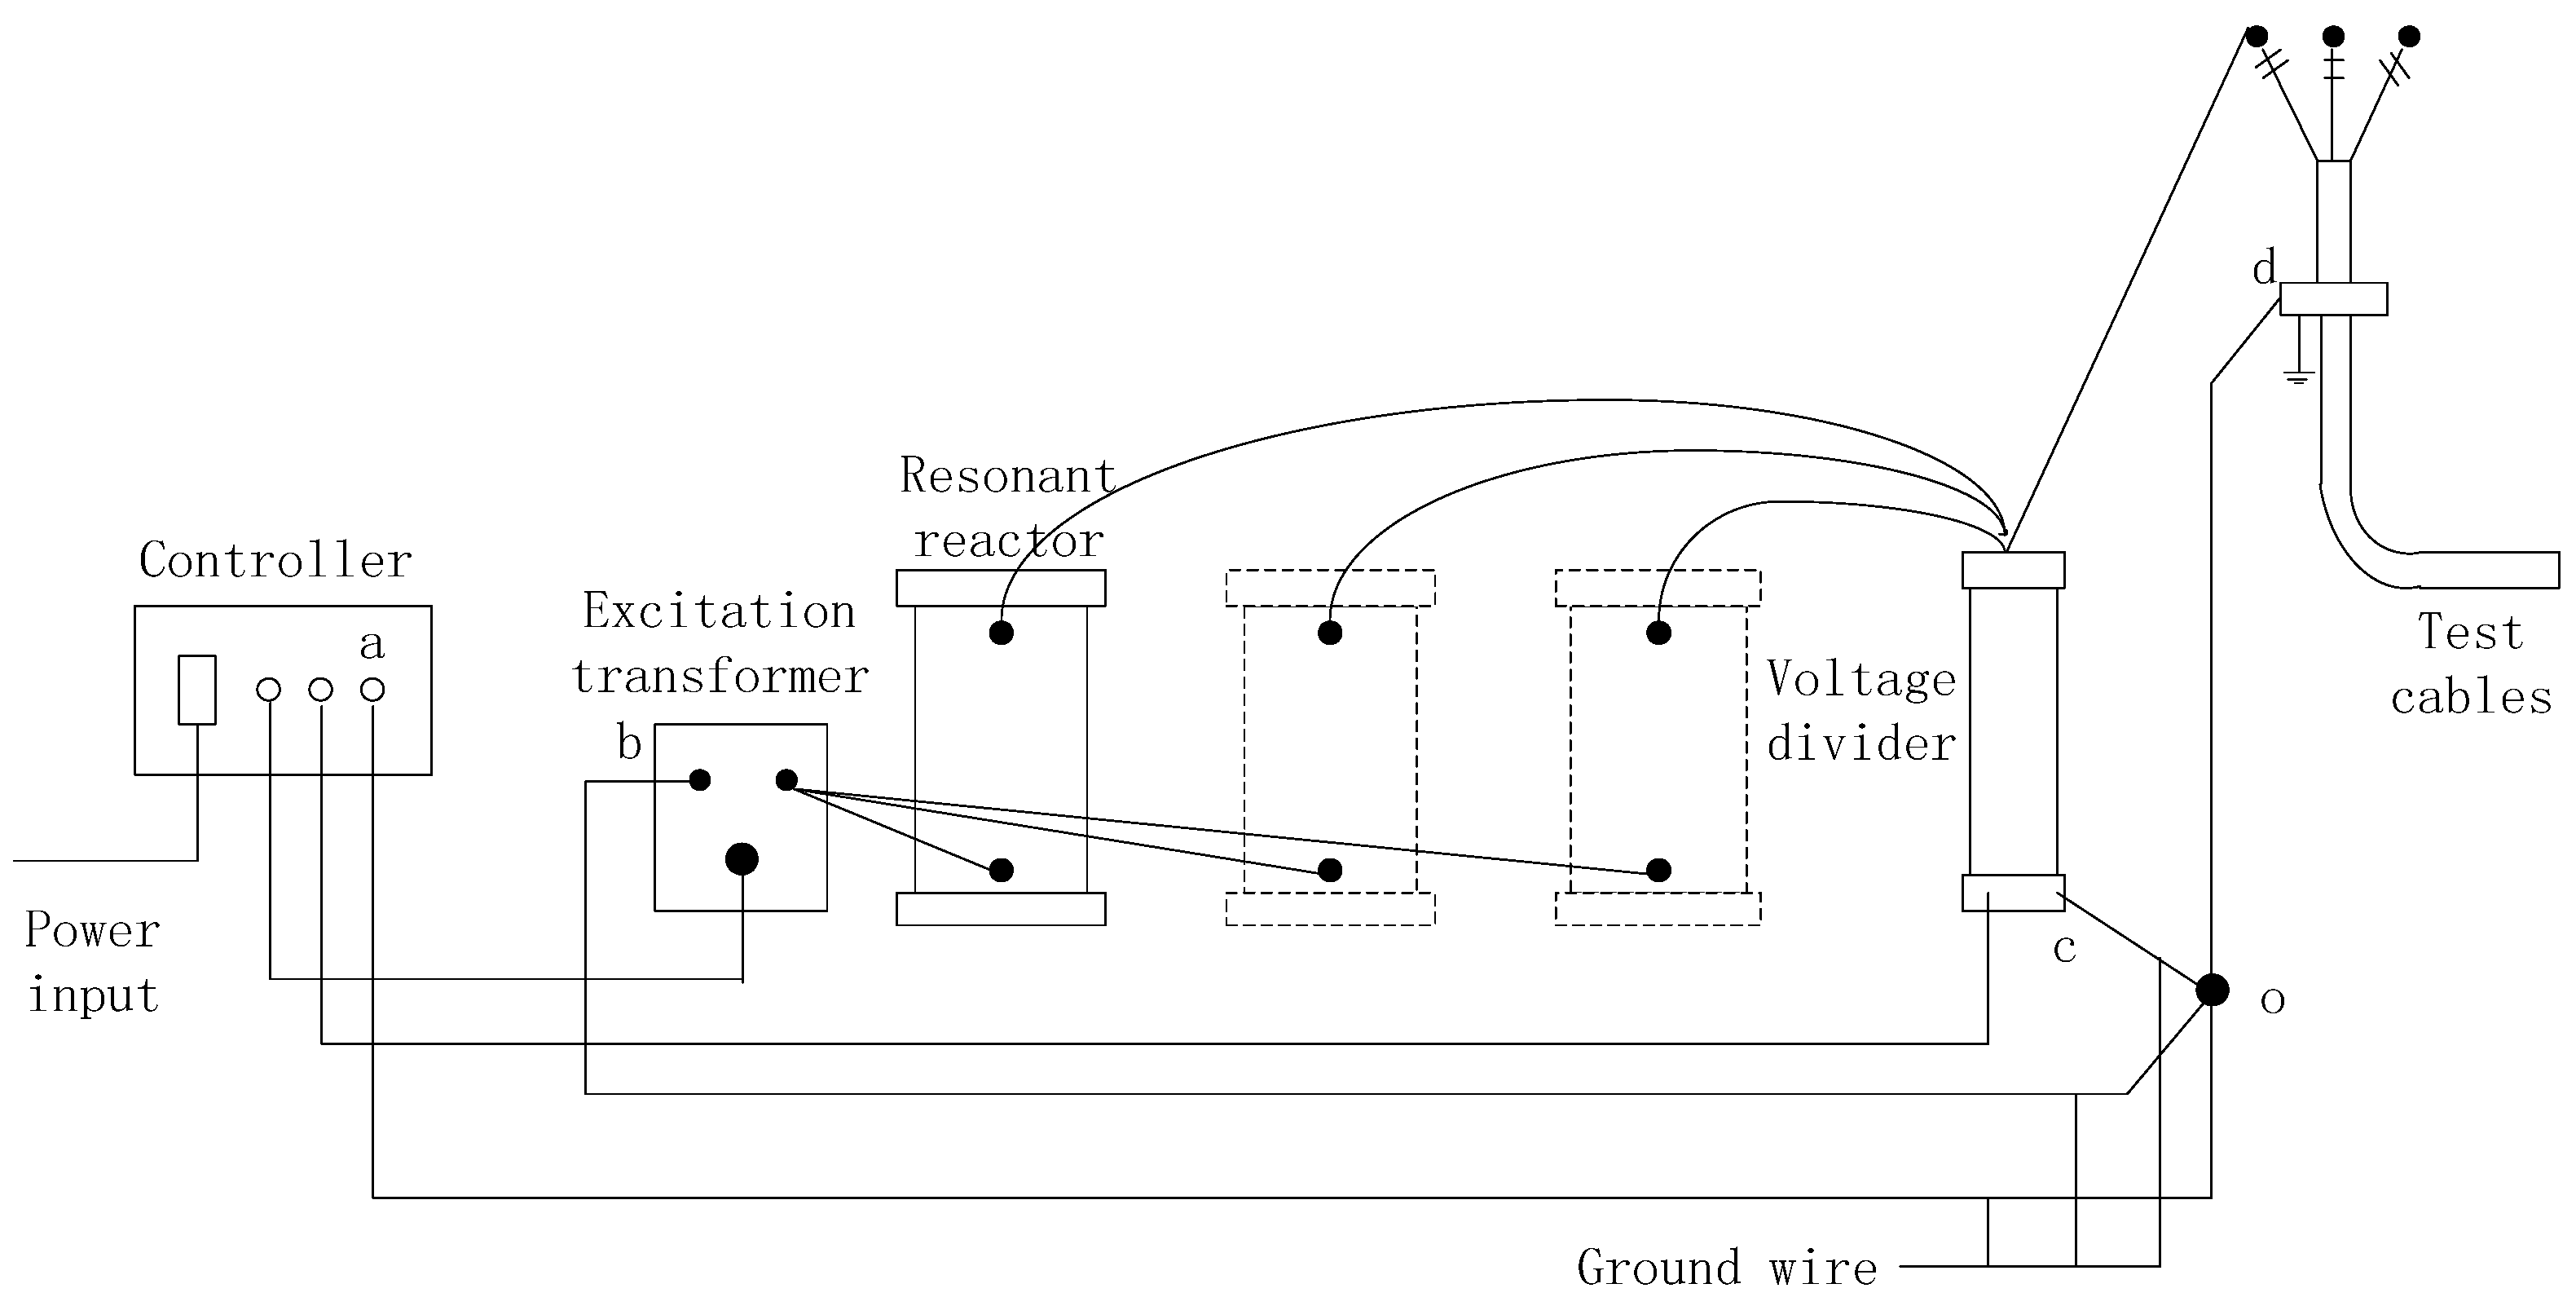
In cable thermal breakdown condition testing, a high-voltage stable power supply is required. In this study, a series of resonant equipment was selected, and the testing environment was relatively simple and safe. By adjusting the power frequency, resonant reactor, and capacitor, resonance phenomena occurred, from which a high-voltage current emerged in the detected cables. The main experimental devices of the series resonant equipment included a frequency and voltage modulation power supply, a capacitive voltage divider (CVD), an excitation transformer, and an electric reactor. The wiring diagram of cables powered by the series resonant equipment is shown in Figure 8.
After the series resonant equipment was installed, the tested cables were electrified. In the cable infrared detection experiment, the hardware devices include two infrared cameras, a tripod, and a computer, as depicted in Figure 9.
To distinguish the thermal breakdown condition of the cable insulation layers with different materials, all tested cables were fixed to a fixture for measurement. The three tested cables were powered using the series resonant equipment. The high voltage was set to 320 kV.
5.2. Fault Points Detection and Breakdown Property Analysis
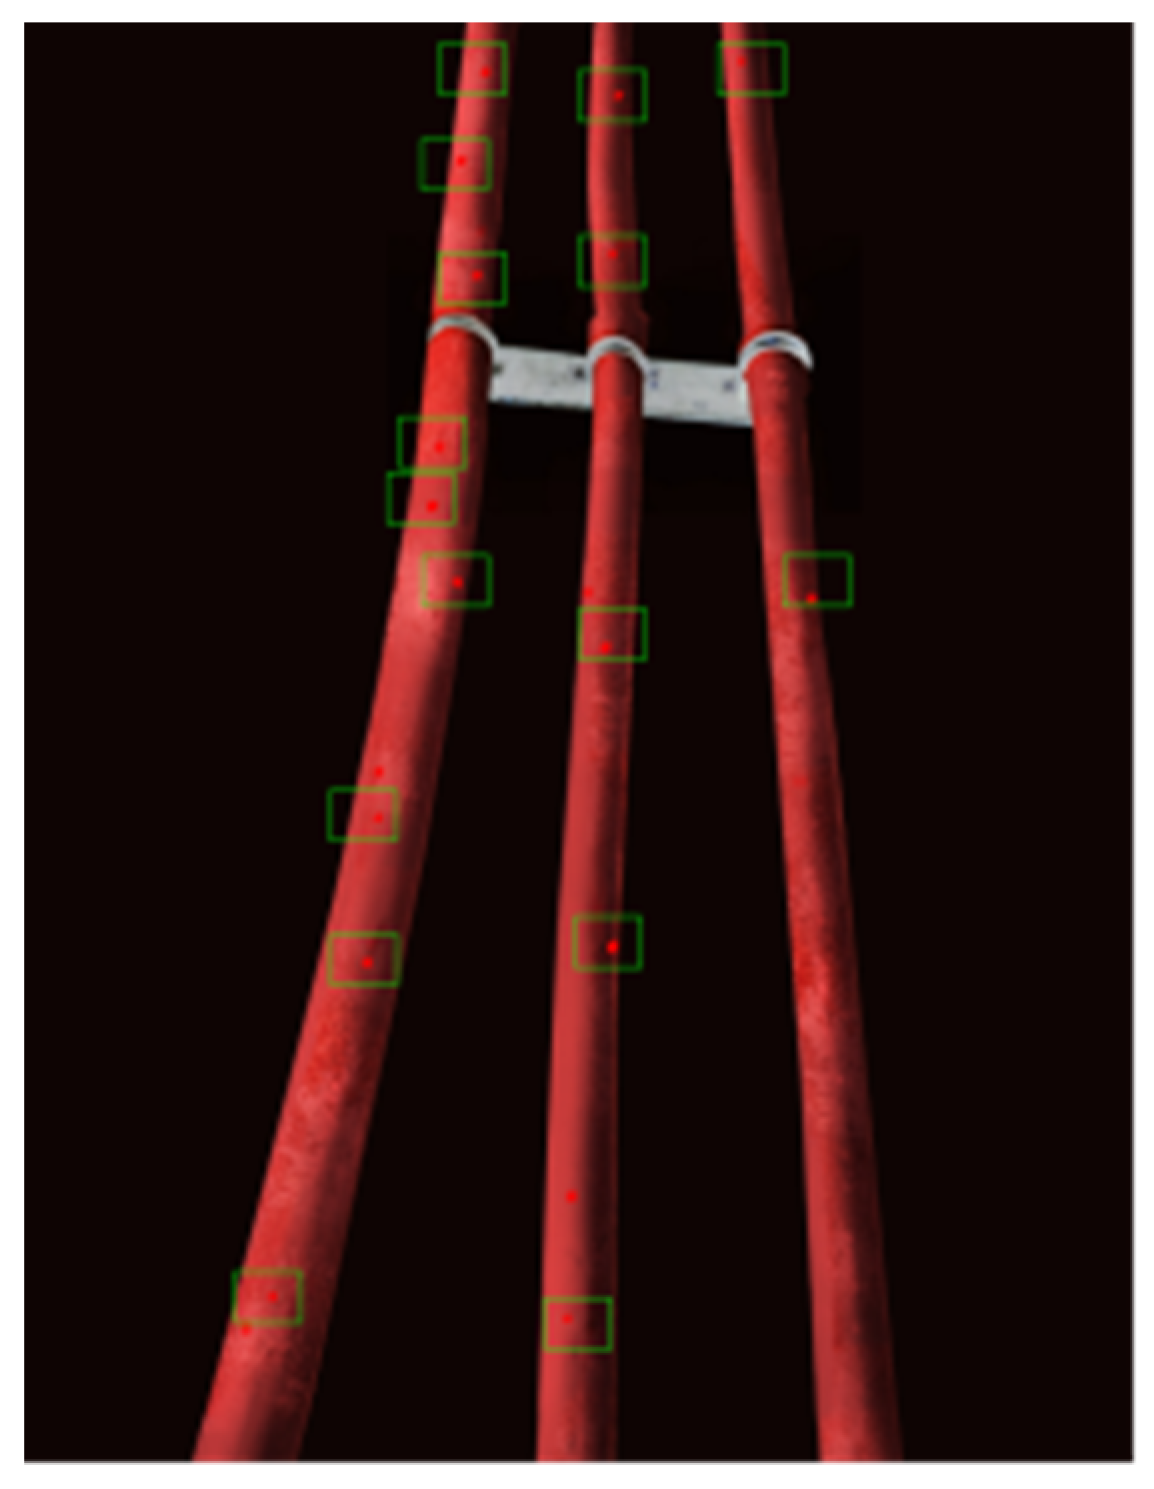
The insulation materials of the three cables in the fixture were pure LDPE, nano-MMT/LDPE, and nano-ZnO/LDPE, from left to right. From the infrared images of the cables, anomalous temperature points were observed in all tested cables. This is because the dielectric loss of the materials decreased the conductivity. The heat could not be rejected in a timely manner; therefore, electrical trees appeared in the insulation materials, which caused thermal distortion. The external layer of the cables was continually heated. The infrared images of the cables were processed using MATLAB. With grey value changes, the Thompson points in the infrared images were the temperature anomalous points. Figure 10 presents the infrared detection results of the temperature anomalous points.
The number of temperature anomalous points and the proportion of temperature anomalous areas in the tested cables are listed in Table 4.
Based on the temperature anomalous point detection results, the cables with the pure LDPE insulation material exhibited more anomalous points and the largest proportion of temperature anomalous area. Combined with the simulation test results, the thermal breakdown strength of the pure LDPE insulation material was the lowest. Therefore, a thermal breakdown would easily appear in the cable insulation layer produced with pure LDPE. In the cables with nano-MMT/LDPE insulation material, the number of temperature anomalous points and the proportion of temperature anomalous area were lower. Combined with the simulation test results, the thermal breakdown strength of nano-MMT/LDPE insulation material was higher. Therefore, the thermal breakdown probability decreased in the cable insulation layer produced using nano-MMT/LDPE. Finally, in the cables with nano-ZnO/LDPE insulation material, the number of temperature anomalous points and the proportion of temperature anomalous area were the lowest. Combined with the simulation test results, the thermal breakdown strength of nano-ZnO/LDPE insulation material was the highest.
Based on microstructural detection, simulation test results, and cable infrared detection of fault points, the cables with ZnO/LDPE insulation material could effectively avoid thermal breakdown. In summary, the optimisation effect of nano-ZnO on the LDPE insulation material is evident. The insulation properties of nano-ZnO/LDPE were excellent and exhibited less breakdown. Therefore, nano-ZnO/LDPE is suitable for cable insulation layer production.
6. Conclusions
According to the requirements for cable insulation material property optimisation and temperature anomalous point detection, different forms of nanoparticles were added to an LDPE matrix by melting the blend. In addition, infrared measurements were used to detect the cable thermal breakdown condition. The main research methods and conclusions of this study are as follows:
(1) According to the melting blend, the different forms of nanoparticles and LDPE matrix were mixed uniformly to prepare nano-ZnO/LDPE and nano-MMT/LDPE samples. All samples were tested via PLM. Microscopic analysis revealed that the crystal size of nano-ZnO/LDPE samples was smaller, and their grains were dispersed uniformly.
(2) COMSOL Multiphysics was used to build a cable insulation model. To test the breakdown property of different cable insulation materials, cable internal electric field distribution and dielectric loss tests were performed under an electric current field. Based on the test results, it was determined that the internal electric field distribution of nano-ZnO/LDPE was uniform and its dielectric loss was the lowest. Therefore, the breakdown strength of the nano-ZnO/LDPE material was predicted to be the highest.
(3) The three tested cables were powered using a series of resonant equipment. Infrared detection of anomalous temperature points in the cable insulation layer was performed. Based on the detection results, the number of temperature anomalous points in the cables with nano-ZnO/LDPE insulation material was the lowest. Combined with the breakdown strength of different samples, the cables with nano-ZnO/LDPE insulation material could avoid thermal breakdown. In summary, the nano-ZnO/LDPE composite is more suitable for cable insulation layer preparation.
Author Contributions
Conceptualisation, G.Y.; methodology, Y.C. and G.Y.; formal analysis, G.Y. and Z.D.; investigation, Y.C.; resources, Z.D.; data curation, Y.C. and G.Y.; writing—original draft preparation, Y.C.; writing—review and editing, G.Y.; supervision, Z.D.; project administration, Y.C.; funding acquisition, Z.D. All authors have read and agreed to the published version of the manuscript.
Funding
This research was funded by the Zhongshan Social Welfare and Basic Research Initiative, Grant Number 2020B2026; the Colleges Young Creative Talents Project of Guangdong Province, China, Grant Number 2020KQNCX117; the Science and Technology Planning Program of Zhongshan City, China, Grant Number 2018B1018.
Data Availability Statement
The data that support the findings and conclusions of this study are available from the corresponding author upon reasonable request.
Acknowledgments
The authors thank Duan Zhuohua and Yu Guang for their help.
Conflicts of Interest
The authors declare no conflict of interest.
References
- Cheng, Y.; Zhang, X.; Guo, N.; Wang, R. Dielectric propeties of nano ZnO/low density polyethylene composites. Acta Mater. Compos. Sin. 2015, 32, 1351–1360. [Google Scholar]
- Jinliang, H.; Lin, P.; Yao, Z. Research progress of environment-friendly HVDC power cable insulation materials. High Volt. Eng. 2017, 43, 337–343. [Google Scholar]
- Li, C.; Zhang, G.; Li, C.; Han, B. Inhibition of electrical tree initiation inside high-voltage cross-linked polyethylene cable with nonlinear shielding layer. Adv. Mater. Res. 2014, 873, 406–410. [Google Scholar] [CrossRef]
- Lee, S.M.; Tiekink, E.R.T. A structural survey of poly-functional dithiocarbamate ligands and the aggregation patterns they sustain. Inorganics 2021, 9, 7. [Google Scholar] [CrossRef]
- Pourrahimi, A.M.; Olsson, R.T.; Hedenqvist, M.S. The role of interfaces in polyethylene/metal-oxide nanocomposites for ultrahigh-voltage insulating materials. Adv. Mater. 2018, 30, 1703624. [Google Scholar] [CrossRef]
- Hajibeygi, M.; Mousavi, M.; Shabanian, M.; Vahabi, H. The effect of phosphorus based melamine-terephthaldehyde resin and Mg-Al layered double hydroxide on the thermal stability, flame retardancy and mechanical properties of polypropylene MgO composites. Mater. Today Commun. 2020, 23, 100880. [Google Scholar] [CrossRef]
- Yan, H.D.; Zhang, C.; Li, W.K.; Zha, J.W. Effect of trap level density on breakdown strength and space charge distribution of polypropylene/low-density polyethylene composites. Polym. Compos. 2020, 41, 780–787. [Google Scholar] [CrossRef]
- Bense, V.F.; Read, T.; Verhoef, A. Using distributed temperature sensing to monitor field scale dynamics of ground surface temperature and related substrate heat flux. Agri. For. Meteorol. 2016, 220, 207–215. [Google Scholar] [CrossRef] [Green Version]
- Artini, C.; Gigli, L.; Carnasciali, M.M.; Pani, M. Effect of the (Nd,Dy)-double doping on the structural properties of ceria. Inorganics 2019, 7, 94. [Google Scholar] [CrossRef] [Green Version]
- Liao, R.; Li, X.; Bai, G.; Yang, L.; Gu, J. Influence of montmorillonite on electrical treeing and breakdown characteristics of low-density polyethylene. J. Reinf. Plast. Compos. 2014, 33, 2117–2128. [Google Scholar] [CrossRef]
- Teng, C.; Zhang, L.; Zhou, Y.; Zhang, Y.; Mo, Y.; Zhou, Z. Influence of crystalline phase on conduction current and space charge in isotactic polypropylene. High Volt. Eng. 2018, 44, 2679–2686. [Google Scholar]
- Lei, Q.Q.; Wang, X.; He, L.J.; Zhang, D.; Han, B.; Song, W.; Sun, Z. Review, thinking and countermeasure about engineering dielectric theory. High Volt. Eng. 2007, 33, 1–4. [Google Scholar]
- Zha, J.; Zhu, Y.; Li, W. Low dielectric permittivity and high thermal conductivity silicone rubber composites with micro-nano-sized particles. Appl. Phys. Lett. 2012, 101, 062905. [Google Scholar] [CrossRef]
- Khalymendyk, I.; Brui, A.; Baryshnikov, A. Usage of Cable Bolts for Gateroad Maintenance in Soft Rocks. J. Sustain. Min. 2014, 13, 1–6. [Google Scholar] [CrossRef] [Green Version]
- Virtanen, S.; Vaughan, A.S.; Yang, L.; Saiz, F.; Quirke, N. Dielectric Breakdown Strength and Electrical Conductivity of Low Density Polyethylene Octylnanosilica Composite. In Proceedings of the 2016 IEEE Conference on Electrical Insulation and Dielectric Phenomena (CEIDP), Toronto, ON, Canada, 16–19 October 2016; pp. 58–61. [Google Scholar]
- Zhang, L.; Zhou, Y. Effect of nanparticle surface modificantion on breakdown and space charge behavior of XLPE/SiO2 nanocomposites. IEEE Trans. Dielectr. Electr. Insul. 2014, 21, 1554–1564. [Google Scholar] [CrossRef]
- Yan, H.; Song, S.; Zhao, H.; Yao, Z. Dielectric properties of polystyrene graft copolymer/low density polyethylene. High Volt. Eng. 2018, 44, 3840–3847. [Google Scholar]
- Guo, C.; Huang, C.; Qian, Y.; Liu, J.; Jiang, X. The electroquasistatic field simulation and analysis for the insulation defects in XLPE power cables. Int. Rev. Electr. Eng. 2009, 4, 1413–1417. [Google Scholar]
- Zhang, Z.; Meng, S.; Xia, R.; Xie, Y. Infrared Thermal Imaging Measurement of Power Cable Terminal. In Proceedings of the International Conference on Electrical and Control Engineering, Guilin, China, 18 April 2015; pp. 245–248. [Google Scholar]
- Couderc, H.; Frechette, M.; David, E.; Savoie, S. Study of dielectric relaxation of epoxy composites containing micro and nano particles. IEEE Trans. Dielectr. Electr. Insul. 2013, 20, 592–600. [Google Scholar] [CrossRef]
- Zhang, J.; Zuo, J.; Ai, W.; Liu, S.; Zhu, D.; Zhang, J.; Wei, C. Preparation of a new high-efficiency resin deodorant from coal gasification fine slag and its application in the removal of volatile organic compounds in polypropylene composites. J. Hazard. Mater. 2020, 384, 121347. [Google Scholar] [CrossRef] [PubMed]
- Kovacs, A.; Apostolidis, C.; Walter, O. Comparative study of complexes of rare earths and actinides with 2,6-Bis(1,2,4-triazin-3-yl)pyridine. Inorganics 2019, 7, 26. [Google Scholar] [CrossRef] [Green Version]
- Zheng, J.; Zhou, X.; Xie, X. Non-isothermal crystallization kinetics of polypropylene containing silica hybrid particles as fillers. Acta Mater. Compos. Sin. 2013, 30, 18–23. [Google Scholar]
- Wu, M.; Lu, L.; Yu, L.; Yu, X.; Naito, K.; Qu, X.; Zhang, Q. Preparation and characterization of epoxy/alumina nanocomposites. J. Nanosci. Nanotechnol. 2020, 20, 2694–2970. [Google Scholar] [CrossRef]
- Peng, S.; He, J.; Hu, J.; Huang, X.; Jiang, P. Influence of functionalized MgO nanoparticles on electrical properties of polyethylene nanocomposites. IEEE Trans. Dielectr. Electr. Insul. 2015, 22, 1512–1519. [Google Scholar] [CrossRef]
- Ostrowski, J.P.A.; Wooles, A.J.; Liddle, S.T. Synthesis and characterisation of molecular polarised-covalent thorium-rhenium and -ruthenium bonds. Inorganics 2021, 9, 30. [Google Scholar] [CrossRef]
Figure 1.
Schematic of surface modification of nano-MMT particles. (a) Raw Montmorillonite, (b) Cation Exchange Reaction, (c) Modified Montmorillonite.
Figure 1.
Schematic of surface modification of nano-MMT particles. (a) Raw Montmorillonite, (b) Cation Exchange Reaction, (c) Modified Montmorillonite.

Figure 2.
Nano-ZnO particle surface modification mechanism.

Figure 3.
PLM patterns of the (a) pure LDPE, (b) nano-MMT/LDPE, and (c) nano-ZnO/LDPE samples.


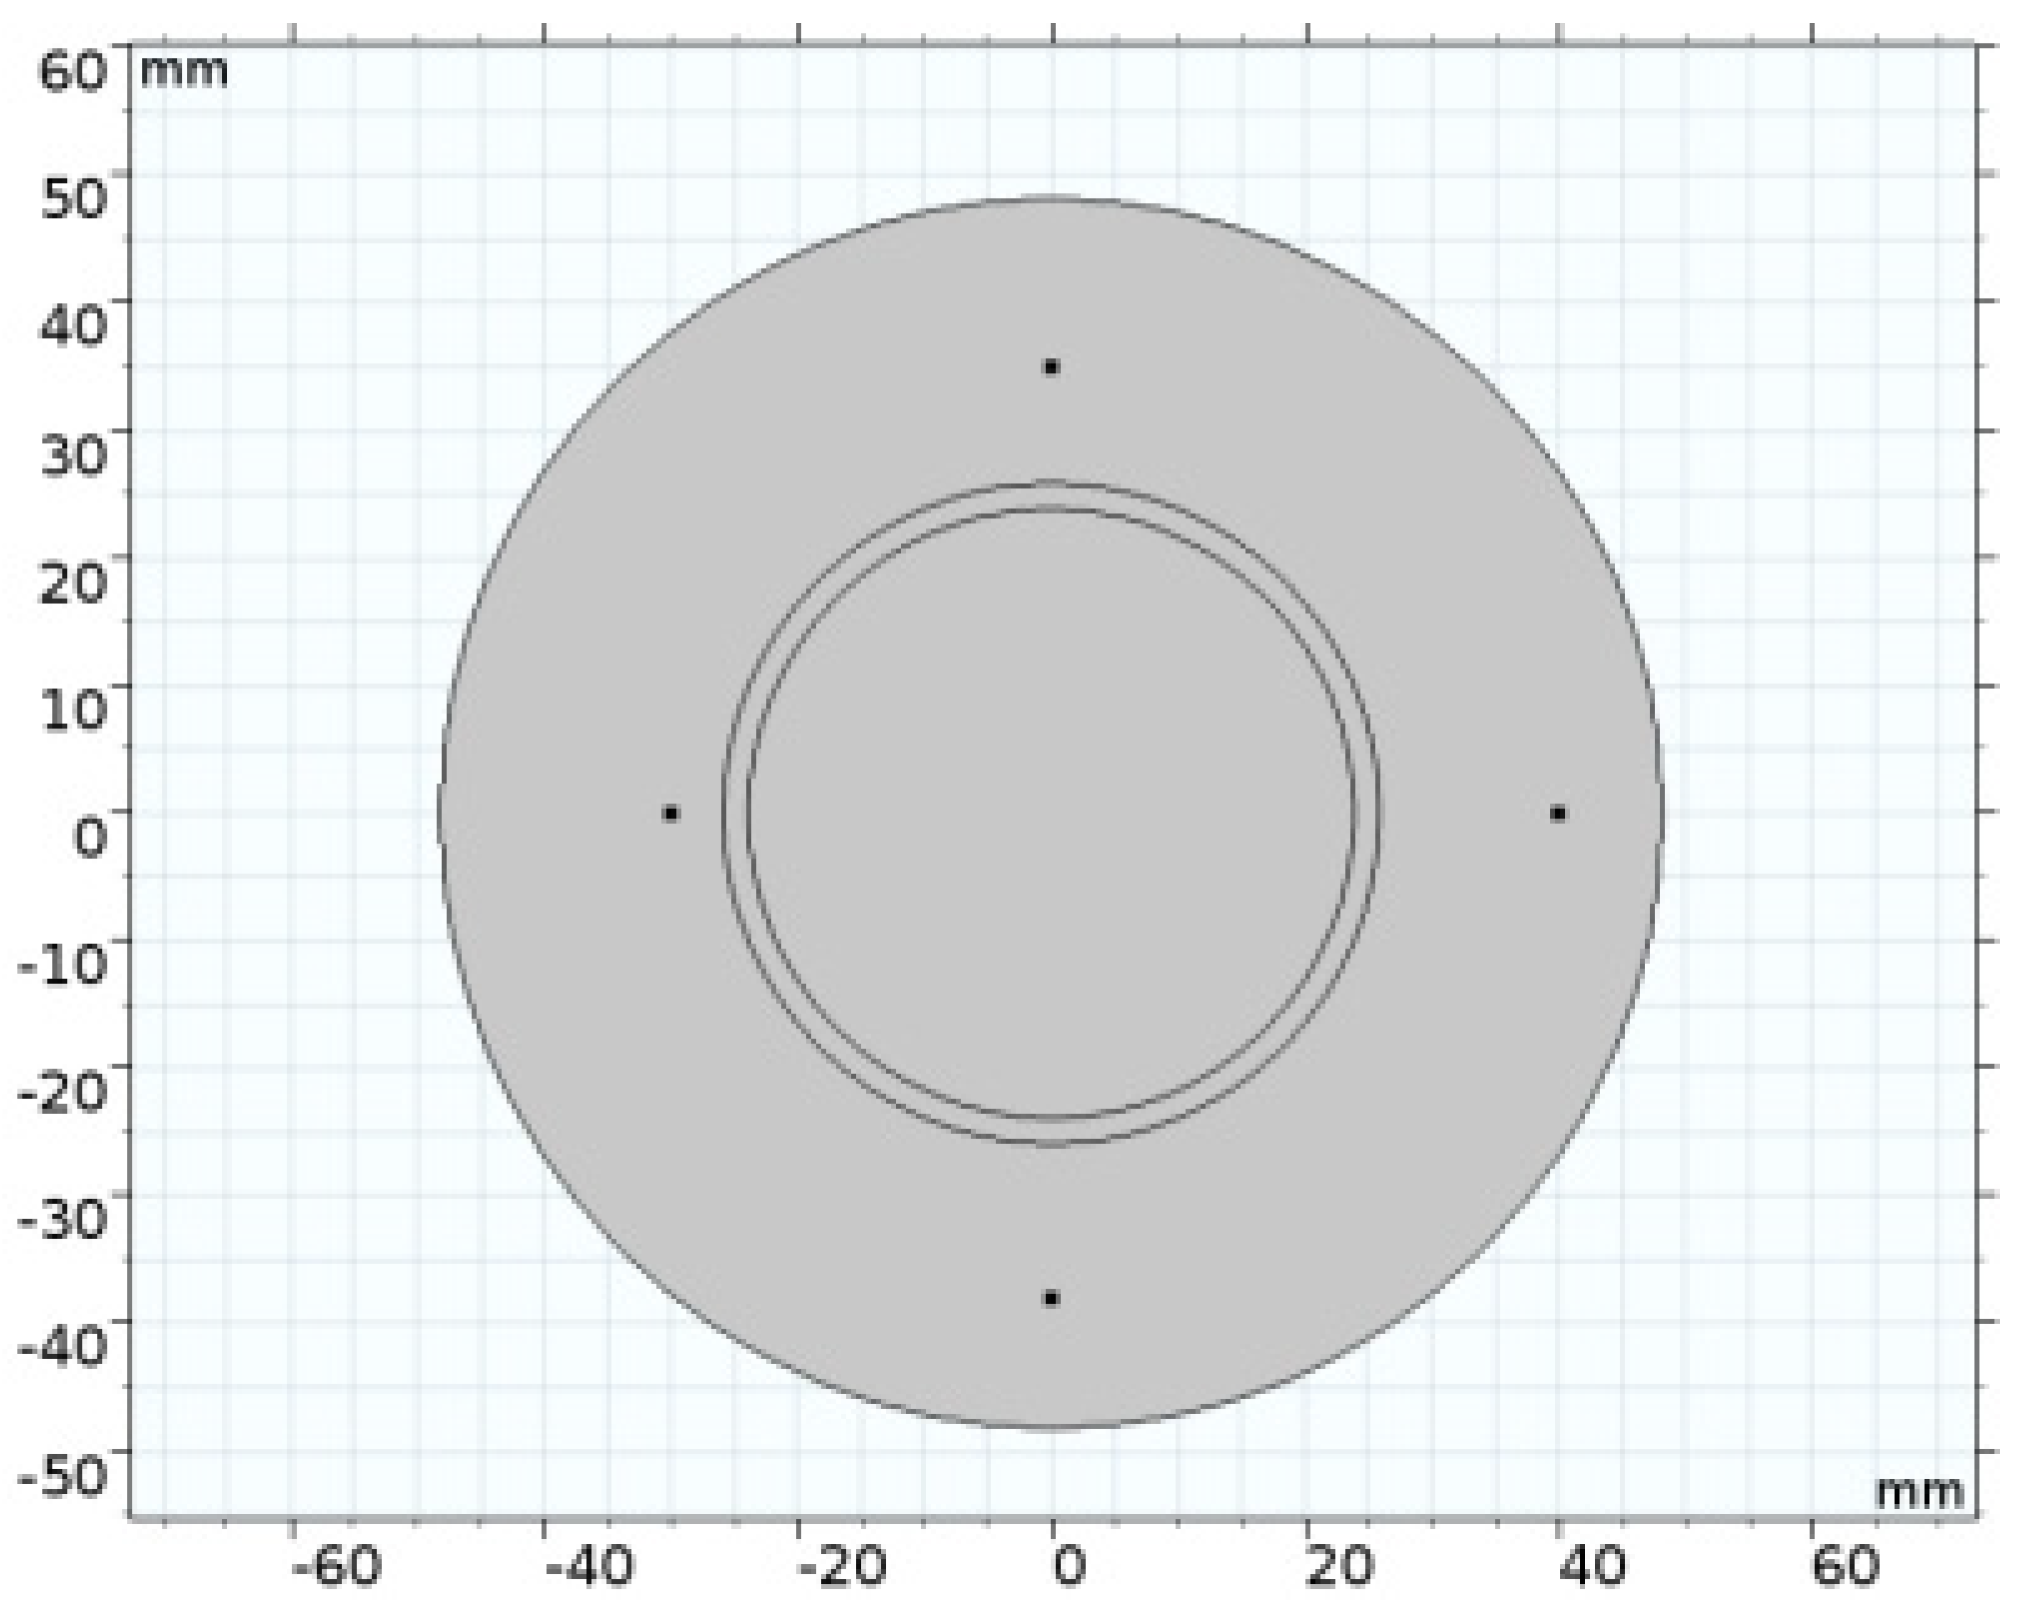
Figure 4.
Sketch map of the cable model monitoring points.

Figure 5.
Detection chart of LDPE insulation: (a) electric field distribution of LDPE; (b) dielectric loss density of LDPE.
Figure 5.
Detection chart of LDPE insulation: (a) electric field distribution of LDPE; (b) dielectric loss density of LDPE.

Figure 6.
Detection chart of nano-MMT/LDPE insulation: (a) electric field distribution of nano-MMT/LDPE; (b) dielectric loss density of nano-MMT/LDPE.
Figure 6.
Detection chart of nano-MMT/LDPE insulation: (a) electric field distribution of nano-MMT/LDPE; (b) dielectric loss density of nano-MMT/LDPE.

Figure 7.
Detection chart of nano-ZnO/LDPE insulation: (a) electric field distribution of nano-ZnO/LDPE; (b) dielectric loss density of nano-ZnO/LDPE.
Figure 7.
Detection chart of nano-ZnO/LDPE insulation: (a) electric field distribution of nano-ZnO/LDPE; (b) dielectric loss density of nano-ZnO/LDPE.

Figure 8.
Field connection wiring diagram (a, button, b, knob, c, foundation, d, electrical grounding).
Figure 8.
Field connection wiring diagram (a, button, b, knob, c, foundation, d, electrical grounding).

Figure 9.
Experimental installation for cable thermal property detection.

Figure 10.
Infrared detection results of the temperature anomalous points.


Table 1.
Experimental equipment used in this study.
| Equipment Name | Model | Manufacturer |
|---|---|---|
| Electronic balance | YP202N | Sincere Dedication of Science and Technology Innovation, Shanghai, China |
| Electric booster mixer | JJ-1 | Rong Hua Equipment Manufacture Co., Ltd., Suzhou, China |
| Constant-temperature water-dissolving pot | DSY-2-4 | Shu Li Instrument Manufacturing Co., Ltd., Shanghai, China |
| Adjustable electric jacket | SHSL | Shu Li Instrument Manufacturing Co., Ltd., Shanghai, China |
| Vacuum pump | 2XZ-1 | Huang Yan Vacuum Pump Factory, Ningbo, China |
| Vacuum drying oven | DZF-6020MBE | Boxun Industry and Commerce Co., Ltd., Shanghai, China |
| Sand core funnel | G4 | GuangDa Glass Co., Ltd., Changchun, China |
Table 2.
Electric field of random points.
| Electric Field Strength (V/m) | ||||
|---|---|---|---|---|
| 1 | 2 | 3 | 4 | |
| LDPE | 5,466,397.5 | 4,892,039.7 | 4,976,506.8 | 4,856,976.8 |
| MMT | 5,143,072.3 | 4,874,482.3 | 4,960,716.2 | 4,824,045.8 |
| ZnO | 5,079,515.6 | 4,761,384.1 | 4,952,096.5 | 4,638,851.2 |
Table 3.
Dielectric loss of random points.
| Dielectric Loss (W/m3) | ||||
|---|---|---|---|---|
| 1 | 2 | 3 | 4 | |
| LDPE | 0.133 | 0.099 | 0.110 | 0.093 |
| MMT | 0.015 | 0.011 | 0.012 | 0.011 |
| ZnO | 0.009 | 0.007 | 0.008 | 0.006 |
Table 4.
Comparison of the anomaly point measurements in the infrared cable images.
| Insulation Material | Number of Temperature Anomalous Points | Proportion of Temperature Anomalous Area |
|---|---|---|
| LDPE | 9 | 1.8% |
| Nano-MMT/LDPE | 5 | 1.1% |
| Nano-ZnO/LDPE | 2 | 0.2% |
Publisher’s Note: MDPI stays neutral with regard to jurisdictional claims in published maps and institutional affiliations. |
© 2021 by the authors. Licensee MDPI, Basel, Switzerland. This article is an open access article distributed under the terms and conditions of the Creative Commons Attribution (CC BY) license (https://creativecommons.org/licenses/by/4.0/).
Share and Cite
MDPI and ACS Style
Cheng, Y.; Yu, G.; Duan, Z. Breakdown Properties of Cables with Different Inorganic, Insulating Nanomaterials. Inorganics 2021, 9, 90. https://0-doi-org.brum.beds.ac.uk/10.3390/inorganics9120090
AMA Style
Cheng Y, Yu G, Duan Z. Breakdown Properties of Cables with Different Inorganic, Insulating Nanomaterials. Inorganics. 2021; 9(12):90. https://0-doi-org.brum.beds.ac.uk/10.3390/inorganics9120090
Chicago/Turabian StyleCheng, Yujia, Guang Yu, and Zhuohua Duan. 2021. "Breakdown Properties of Cables with Different Inorganic, Insulating Nanomaterials" Inorganics 9, no. 12: 90. https://0-doi-org.brum.beds.ac.uk/10.3390/inorganics9120090
Note that from the first issue of 2016, this journal uses article numbers instead of page numbers. See further details here.