
Optimization of the Synthesis and Energy Transfer of Ca2MgWO6:Cr3+,Nd3+


Department of Chemical Engineering, FH Münster University of Applied Sciences, Stegerwaldstrasse 39, D-48565 Steinfurt, Germany
*
Author to whom correspondence should be addressed.
Inorganics 2021, 9(4), 23; https://0-doi-org.brum.beds.ac.uk/10.3390/inorganics9040023
Submission received: 22 February 2021
/
Revised: 22 March 2021
/
Accepted: 25 March 2021
/
Published: 31 March 2021
Abstract
:This work pertains to Cr3+ and Nd3+ co-activated Ca2MgWO6 phosphors synthesized by high temperature solid-state method using oxides and carbonates as raw materials. All luminescent samples according to Ca2MgWO6:Cr3+,Nd3+ include Cr3+ for the absorption of UV and visible radiation (230–800 nm) prior to energy transfer to Nd3+. As a result of the energy transfer between Cr3+ and Nd3+, we observe line emission originating from Nd3+ in the near infrared range additionally to the broad band near infrared emission from Cr3+ assigned to the spin-allowed 4T2 → 4A2 transition. The energy transfer from Cr3+ to Nd3+ is discussed via the variations of the lifetime data of Cr3+ and Nd3+. The strong absorption of Cr3+ in the ultraviolet range and the efficient energy transfer from Cr3+ to Nd3+ indicate that the herein presented material type can serve as a radiation converter for near infrared region light emitting diodes (NIR-LEDs) comprising an UV-A emitting (Al,Ga)N chip.
1. Introduction
Cr3+ is a widely applied activator ion in phosphors or solid state lasers emitting in the near infrared region (NIR) [1]. NIR radiation sources have a broad area of application in biomedical imaging, phototherapy, thermography, optical communication, and environment monitoring [2,3,4,5,6].
Incandescent and halogen lamps, silicon carbide heating elements, as well as GaAs or (Al,Ga)As LEDs are commonly used as NIR emitters. However, the application of these NIR sources is hampered by low efficiency, size, and (for NIR LEDs) their poor thermal stability, low electroluminescence efficiency, and sensitivity towards humidity [7]. To solve these problems, we can use LEDs based on a blue or UV-A emitting (Al,Ga)N semiconductor chip in combination with a suitable NIR emitting phosphor.
The rare earth ion Nd3+ offers suitable energy levels which, subsequent to an excitation process, lead to emission in the near infrared range and is therefore particularly well suited for application as a luminescent converter [8]. However, Nd3+ doped phosphors always exhibit narrow-band absorption features in the blue to ultraviolet region with a rather low absorption cross section due to the involved parity forbidden 4f–4f transitions. To overcome this drawback, the use of Cr3+ as a broadband sensitizer is widely discussed, since it exhibits up to three broad absorption bands in the near ultraviolet and visible spectral range due to its spin-allowed 4A2/4T2 and 4A2/4T1 transitions [9].
Ca2MgWO6 (CMW) is a low-cost material with high chemical and physical stability, which can be synthesized by a rather simple synthesis pathway and which can be doped with transition metal ions as soon as with rare earth metal ions [10]. In the past, several phosphors with CMW host have been reported, such as CMW:Eu3+ [11], CMW:Bi3+ [12], CMW:Bi3+,Sm3+ [13], CMW:Bi3+,Eu3+ [14], CMW:Er3+,Yb3+ [15], and CMW:Mn4+ [16]. Xu et al. studied CMW:Cr3+ and CMW:Cr3+,Yb3+. It turned out that Cr3+ in this host material can be very efficiently excited in the ultraviolet range [17,18].
Therefore, this work deals with the synthesis of this material by solid state reaction and the investigation of the energy transfer from Cr3+ to Nd3+ in a set of CMW:Cr3+,Nd3+ samples. After having confirmed the presence of single-phase materials, diffuse reflectance spectra and luminescence properties such as excitation spectra, emission spectra, and time-dependent spectroscopy were recorded.
2. Experimental Section
For the synthesis of the compounds according to Table 1, we used the high temperature solid state synthesis. Stoichiometric amounts of the educts CaCO3, MgO, WO3, Na2CO3, Li2CO3, Cr2O3, and Nd2O3 were used, and these were ground in agate mortar with the addition of acetone. The mixture was then dried and transferred to a corundum crucible. The samples were first heated for 2 h at 600 °C and then for 5 h at 1300 °C. Between the heating steps and after the final sintering, the sinter bodies were ground again to obtain a fine beige powder.
The samples were identified by X-ray powder diffraction (XRD) (PANalytical X’Pert Pro, Malvern Panalytical B.V., Almelo, The Netherlands) with Cu Kα radiation (λ = 0.15406 nm) operating at 40 kV and 40 mA. XRD patterns were collected from 10° ≤ 2Θ ≤ 80°.
Diffuse reflectance spectra were recorded on a FLS920 spectrometer (Edinburgh Instruments Ltd., Kirkton Campus, UK) equipped with a 450 W Xe arc lamp, a cooled (−20 °C) single-photon counting photomultiplier R2658P (Hamamatsu Photonics K.K., Hamamatsu City, Japan), and a Spectralon integration sphere. BaSO4 (99.998%, Merck KGaA, Munich, Germany) was used as a reflectance standard.
The photoluminescence excitation (PLE) and emission (PL) spectra at room temperature were measured on a FLS920 spectrometer (Edinburgh Instruments Ltd., Kirkton Campus, UK) equipped with a 450 W Xe arc lamp, mirror optics for powder samples, and a cooled (−20 °C) single-photon counting photomultiplier R2658P (Hamamatsu Photonics K.K., Hamamatsu City, Japan). The decay curves were recorded on the same instrument (FLS920), and a µF900 flash lamp was used as the excitation source.
3. Results and Discussion
Ca2MgWO6 crystalized in a monoclinic structure with space group P21/n and was characterized by B-Site cation ordering and a-a-c+-type BO6 octahedral tilting. The lattice parameters were a = 5.4199 Å, b = 5.5479 Å, and c = 7.7147 Å [19]. Calcium atoms were coordinated by twelve oxygen atoms, where four oxygen atoms were significantly shortened. The average distance for the Mg–O octahedra was 2.069 Å and for the W–O octahedra was 1.922 Å, which were in good agreement with the ionic radii according to Shannon [r(Mg2+) = 0.86 Å, r(W6+) = 0.74 Å, r(O2−) = 1.28 Å] [20].
Because of the strong ligand-field stabilization energy of Cr3+ ions ([Ar]3d3 configuration) in sixfold coordination and the similar ionic radii between Cr3+ (0.755 Å) and Mg2+ (0.86 Å), chromium preferred to occupy octahedral magnesium sites. Another reason for occupying the magnesium sites instead of the tungsten sites was the smaller difference in ion charge. Due to the similar ionic radii, Nd3+ (1.410 Å) occupied Ca2+ (1.480 Å) lattice sites.
A charge balance was thus necessary, which was achieved by replacing Mg2+ with Li+ and Ca2+ with Na+ in appropriate concentration. To avoid the formation of color centers, twice the amount of charge compensation was used, which is described further on.
The XRD pattern as shown in Figure 1 proves that no changes in the crystal structure could be observed upon substituting with Cr3+ and Nd3+. All the diffraction peaks were well indexed to those of the monoclinic Ca2MgWO6 phase (ICDD (International Centre for Diffraction Data): 04-012-4403).
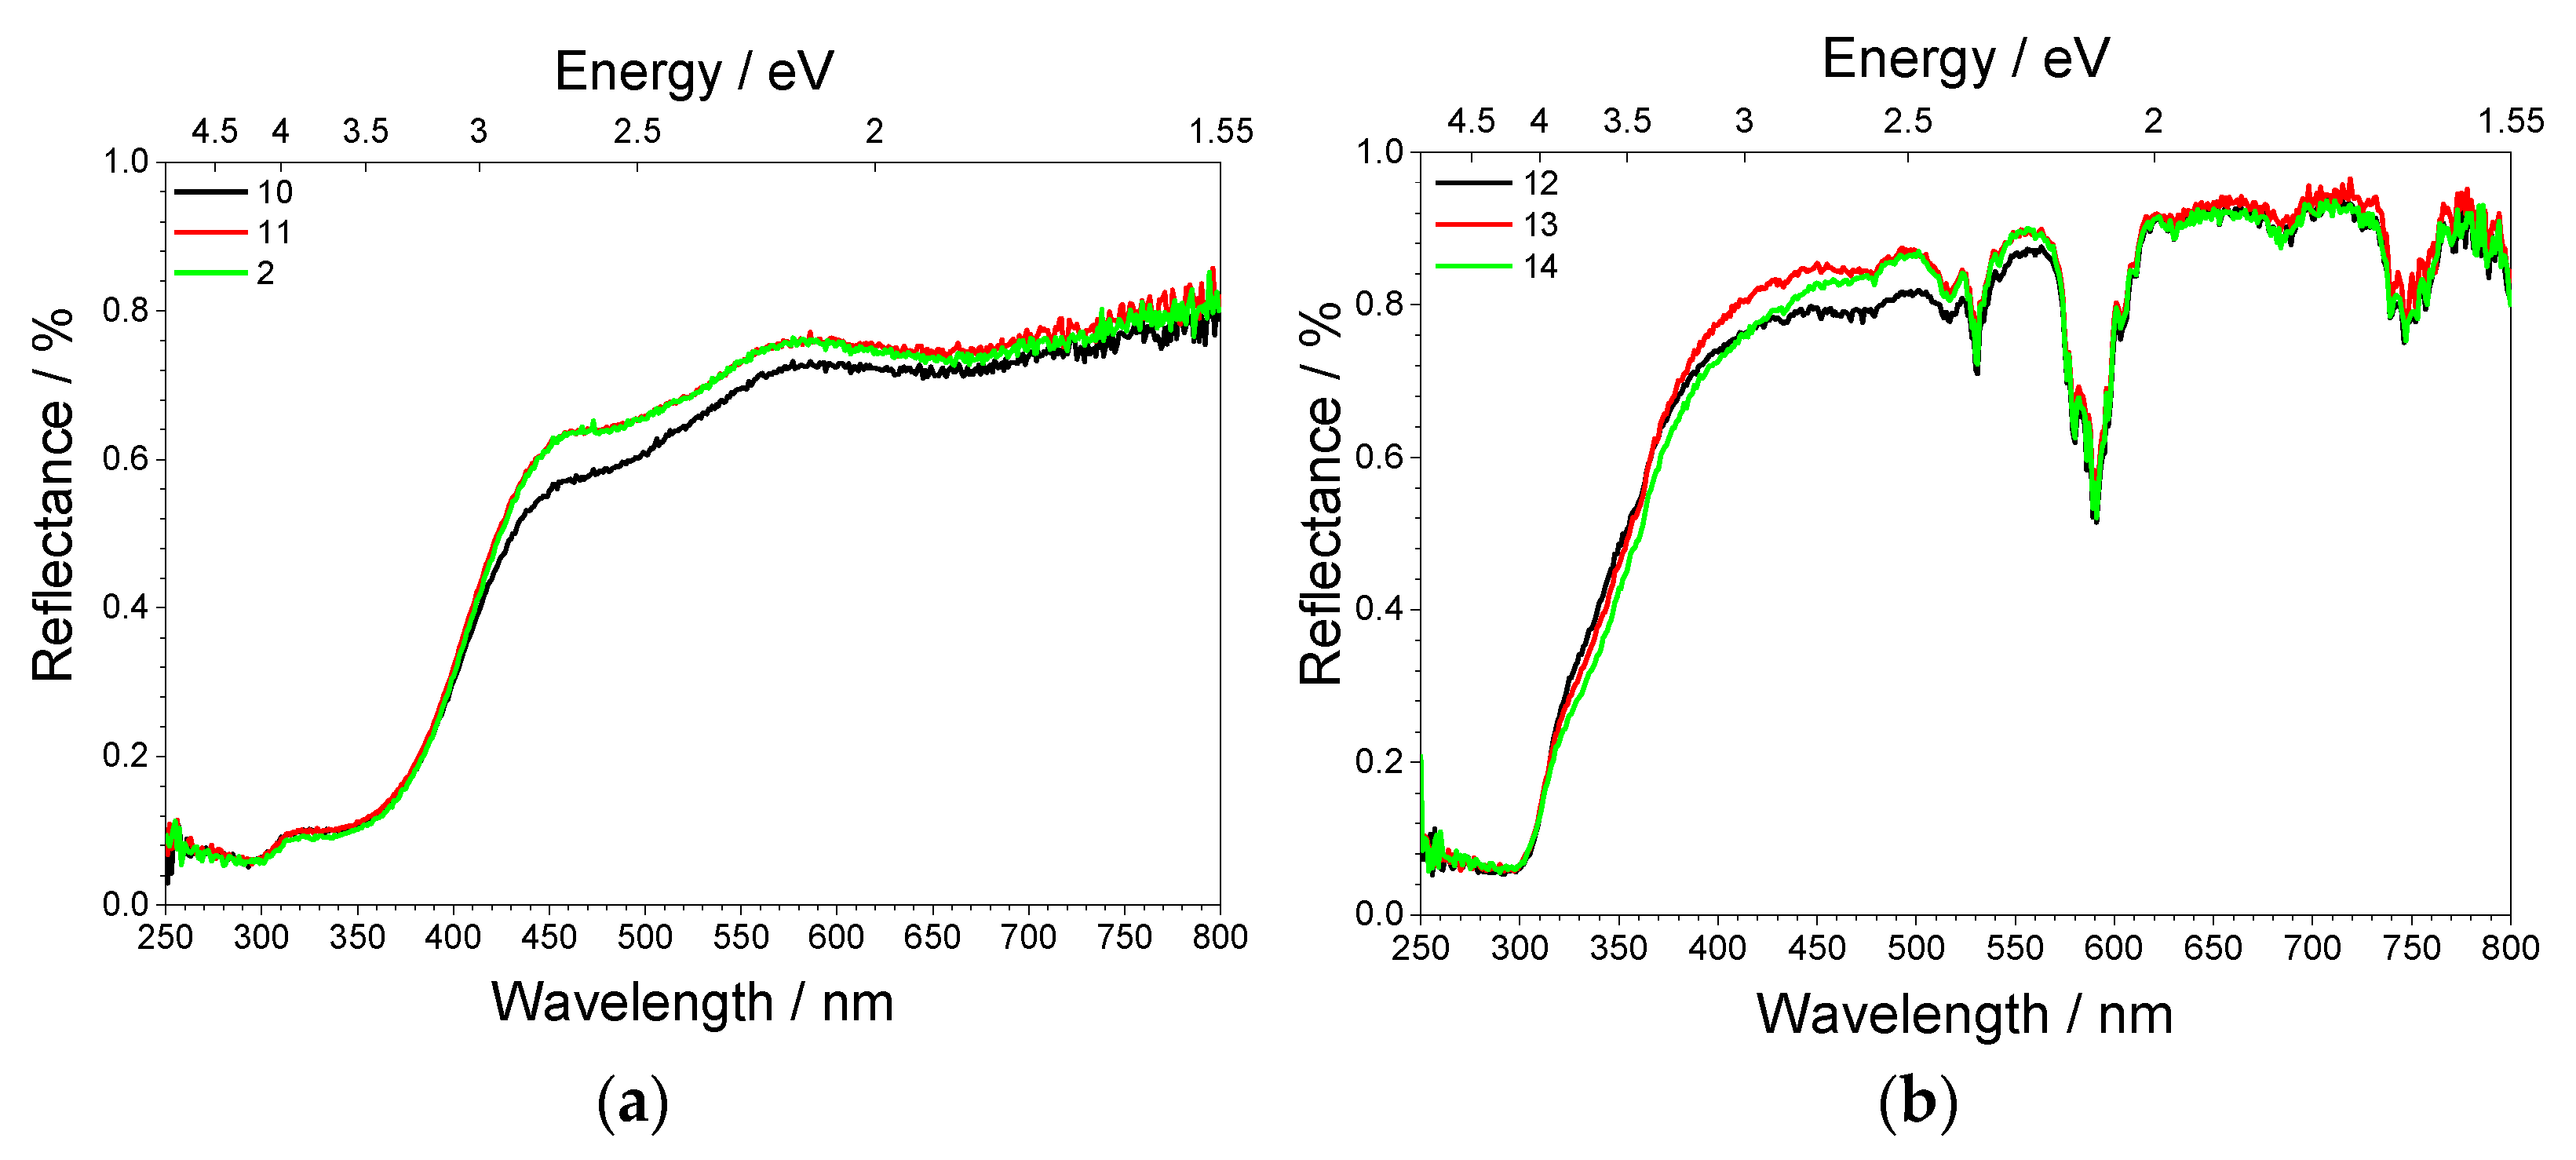
Moreover, Figure 2 depicts a series of reflection spectra of Ca2MgWO6 in order to underline the necessity of the application of a double amount of charge compensation.
As displayed in Figure 2a Ca2MgWO6 was doped with Cr3+ and different amounts of Li+ to reveal the effect of charge compensation. For all three samples, the three expected spin-allowed [Ar]3d3–[Ar]3d3 transitions of Cr3+ having the electron configuration [Ar]3d3 were observed. These were in the UV range with its center at 345 nm (4A2 → 4T1(4P)), in the green spectral range with its center at 475 nm (4A2 → 4T1(4F)), and in the deep red spectral range with its center at 694 nm (4A2 → 4T2(4F)) [17]. The sample 10 in which no charge compensation was present showed a slightly worse reflectivity, whereas the other two samples (2 and 11) had identical reflection spectra.
Figure 2b shows the reflection spectra of the Ca2MgWO6:Nd3+ samples, where the charge was balanced with different amounts of Na+. Again, only a slight improvement of the reflectivity could be observed. For all three samples (12–14), the typical 4f–4f-transitions of Nd3+ were observed. These were located at 530 nm (4I9/2 → 4G7/2), 590 nm (4I9/2 → 4G5/2), 685 nm (4I9/2 → 4F9/2), and 750 nm (4I9/2 → 4F7/2).
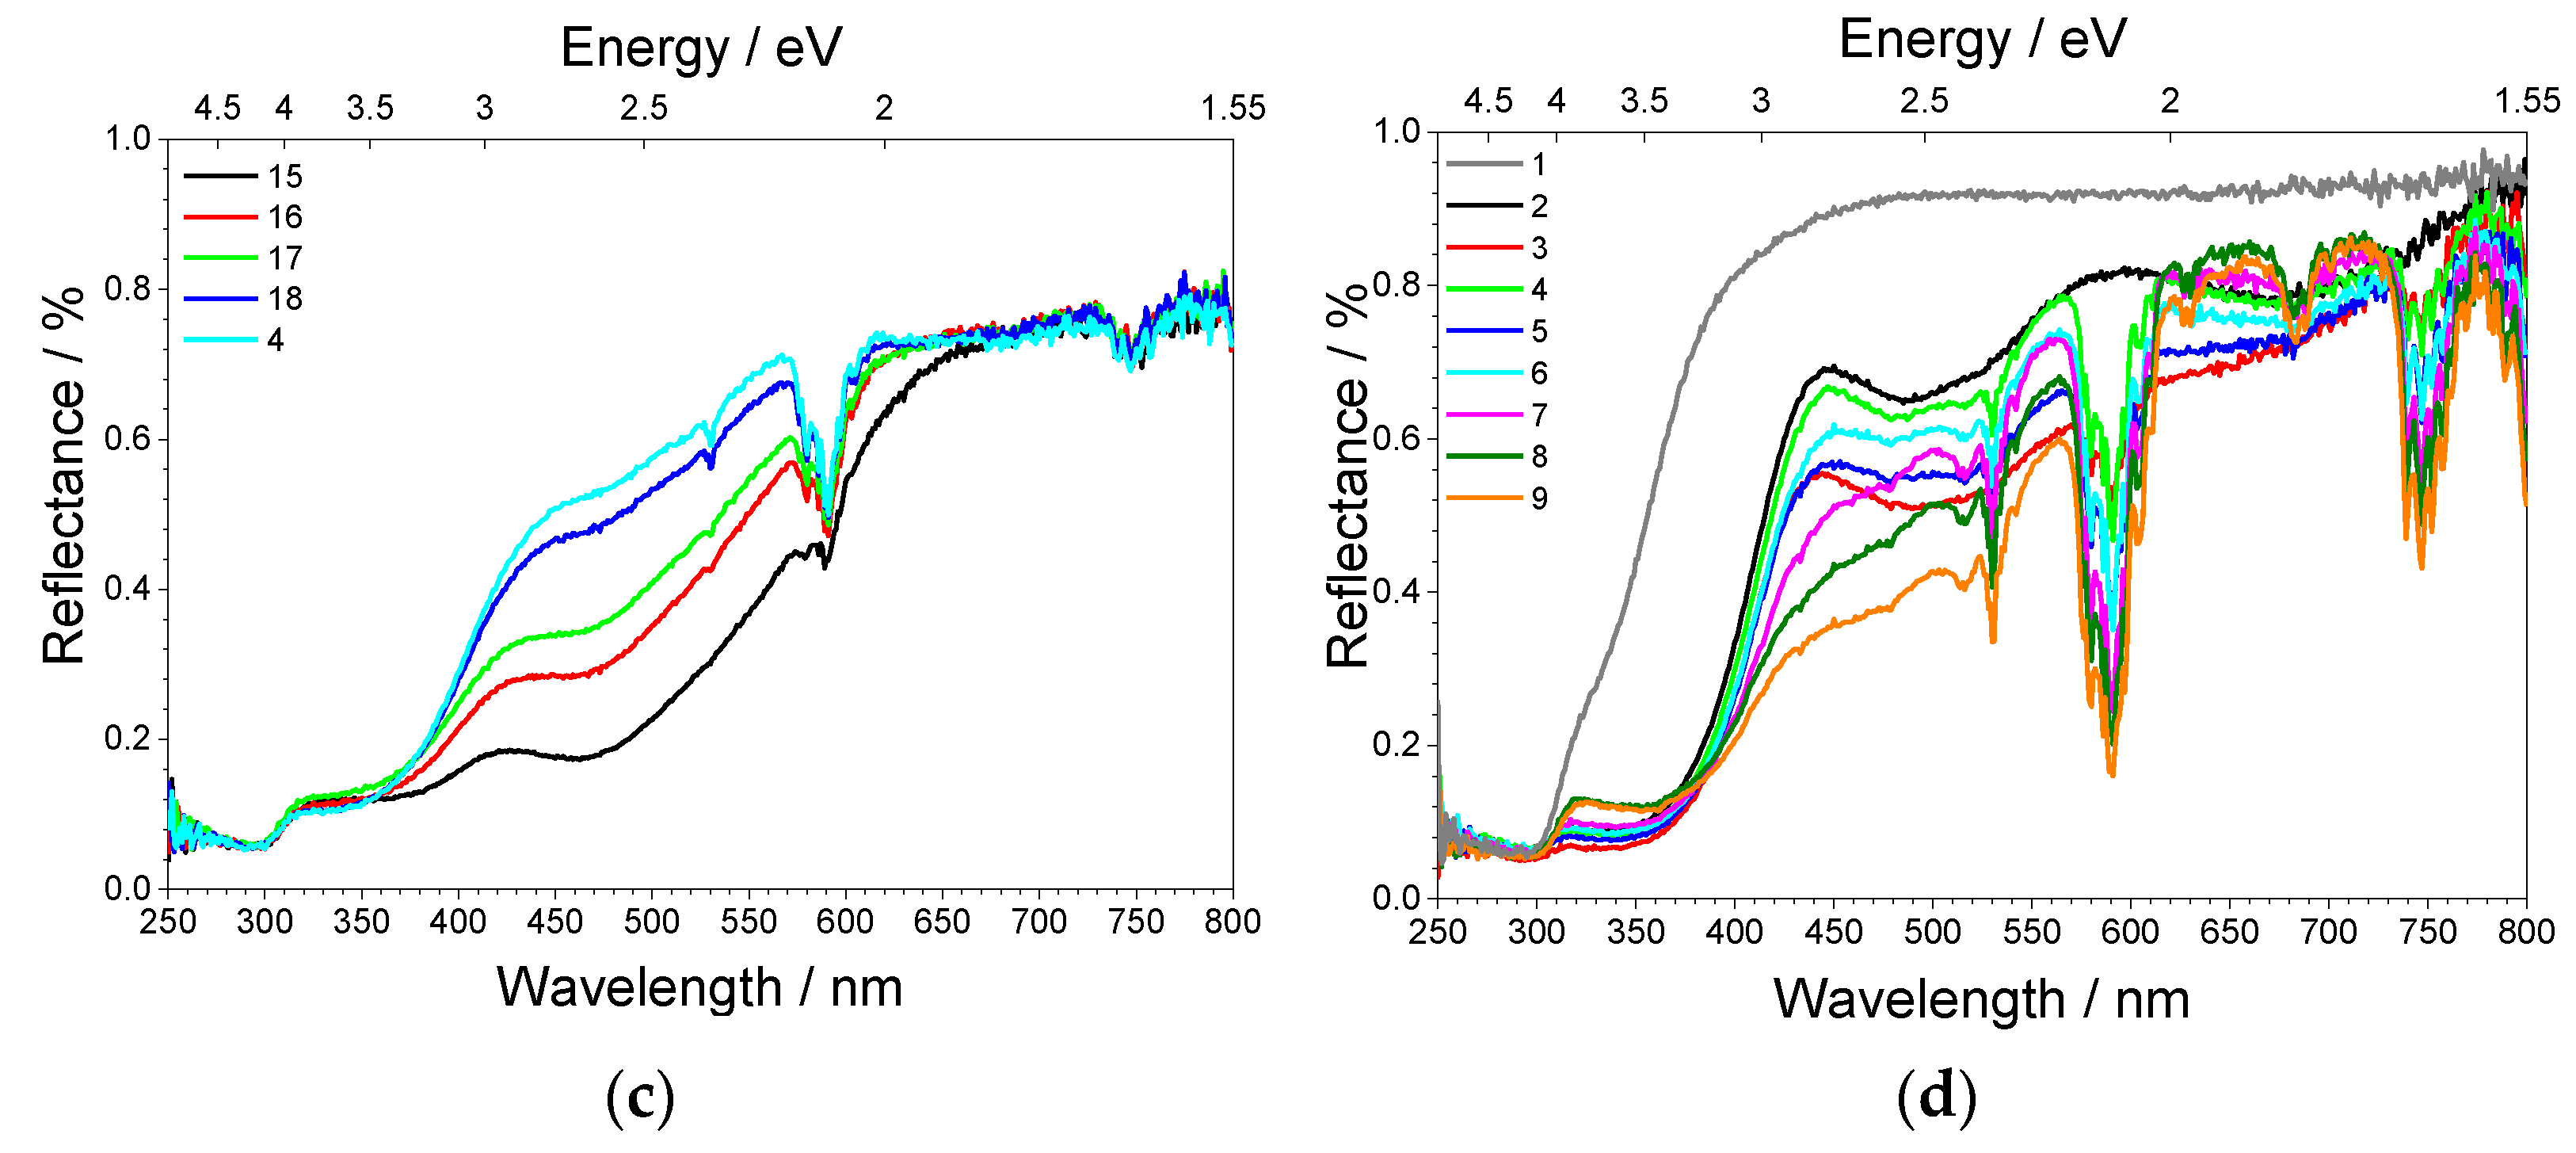
Figure 2c shows the reflection spectra of Ca2MgWO6 samples co-doped with Cr3+ and Nd3+, where the charge was balanced with different amounts of Li+/Na+ (samples 4 and 15–18). In contrast to Ca2MgWO6:Cr3+ and Ca2MgWO6:Nd3+, another very broad absorption band was recorded, which only occurred if Cr3+ and Nd3+ were present at the same time. Therefore, we assumed the presence of a charge transfer transition between Cr3+ and Nd3+. This charge transfer was significantly suppressed by the addition of Li+/Na+ due to the better ion distribution, and thus this additional absorption band disappeared gradually until the amount of charge compensation was doubled. Then, only the typical spin-allowed transitions of Cr3+ and the spin-forbidden transitions of Nd3+ were visible.
Therefore, the reflection spectra of samples shown in Figure 2d (Ca2MgWO6:1%Cr,y%Nd) were synthesized with just this required amount of Li+/Na+ (Samples 2–9). Additionally, the undoped compound (Sample 1) was plotted here, which was used to determine the band gap of Ca2MgWO6, which was derived to be 4.0 eV. As described above, one could observe the transitions of Cr3+ as well as the transitions of Nd3+. As the proportion of Nd3+ increased, the absorption lines of Nd3+ gained more intensity.
Figure 2.
Diffuse reflection spectra of Ca2MgWO6 with (a) 1% Cr3+ and different amounts of Li+; (b) 1% Nd3+ and different amounts of Na+; (c) 1% Cr3+, 1% Nd3+ and different amounts of Li+ and Na+; and (d) 1% Cr3+, (0–8)% Nd3+ and double amount of Li+ and Na+.
Figure 2.
Diffuse reflection spectra of Ca2MgWO6 with (a) 1% Cr3+ and different amounts of Li+; (b) 1% Nd3+ and different amounts of Na+; (c) 1% Cr3+, 1% Nd3+ and different amounts of Li+ and Na+; and (d) 1% Cr3+, (0–8)% Nd3+ and double amount of Li+ and Na+.


Figure 3 shows the excitation spectra of Ca2MgWO6 doped with 1% Cr3+ and a variable content of Nd3+ between 0 and 8 atom-%. The emission monochromator in Figure 3a was fixed to the emission of the Cr3+ emission band at 825 nm, while in Figure 3b, it was set to the line emission of Nd3+ located at 879 nm.
In the excitation spectrum monitoring the Cr3+ emission, all three expected 3d–3d excitation bands were seen in the UV (maximum at 330 nm), the green (maximum at 490 nm), and the deep red (maximum at 687 nm) spectral range. They could be clearly assigned to the spin-allowed crystal-field transitions 4A2 → 4T1(4P), 4A2 → 4T1(4F), and 4A2 → 4T2(4F) of Cr3+. However, the high intensity of the former transition in this compound was not typical, which showed a comparison to other Cr3+ doped compounds. Mostly, the two transitions in the visible spectral region exhibited much higher intensity [21,22,23,24]. The decrease in excitation intensity occurred with increasing content of Nd3+, as expected for efficient energy transfer from Cr3+ to Nd3+. The excitation lines visible at about 580 nm, which were caused by the presence of Nd3+, point to the presence of back transfer from Nd3+ to Cr3+, because there were no Nd3+ emission lines in the emission range set here.
The excitation spectrum of Nd3+ emission also showed the three typical broad excitation bands of Cr3+ in the UV, the green, and the deep red spectral range, which also confirmed efficient energy transfer from Cr3+ to Nd3+. In addition, excitation lines were found at 530 nm, 590 nm, 750 nm, and 800 nm, which could be assigned to the intraconfigurational 4f–4f transitions 4I9/2 → 4G7/2, 4I9/2 → 4G5/2, 4I9/2 → 4F7/2, and 4I9/2 → 4F5/2 of Nd3+.
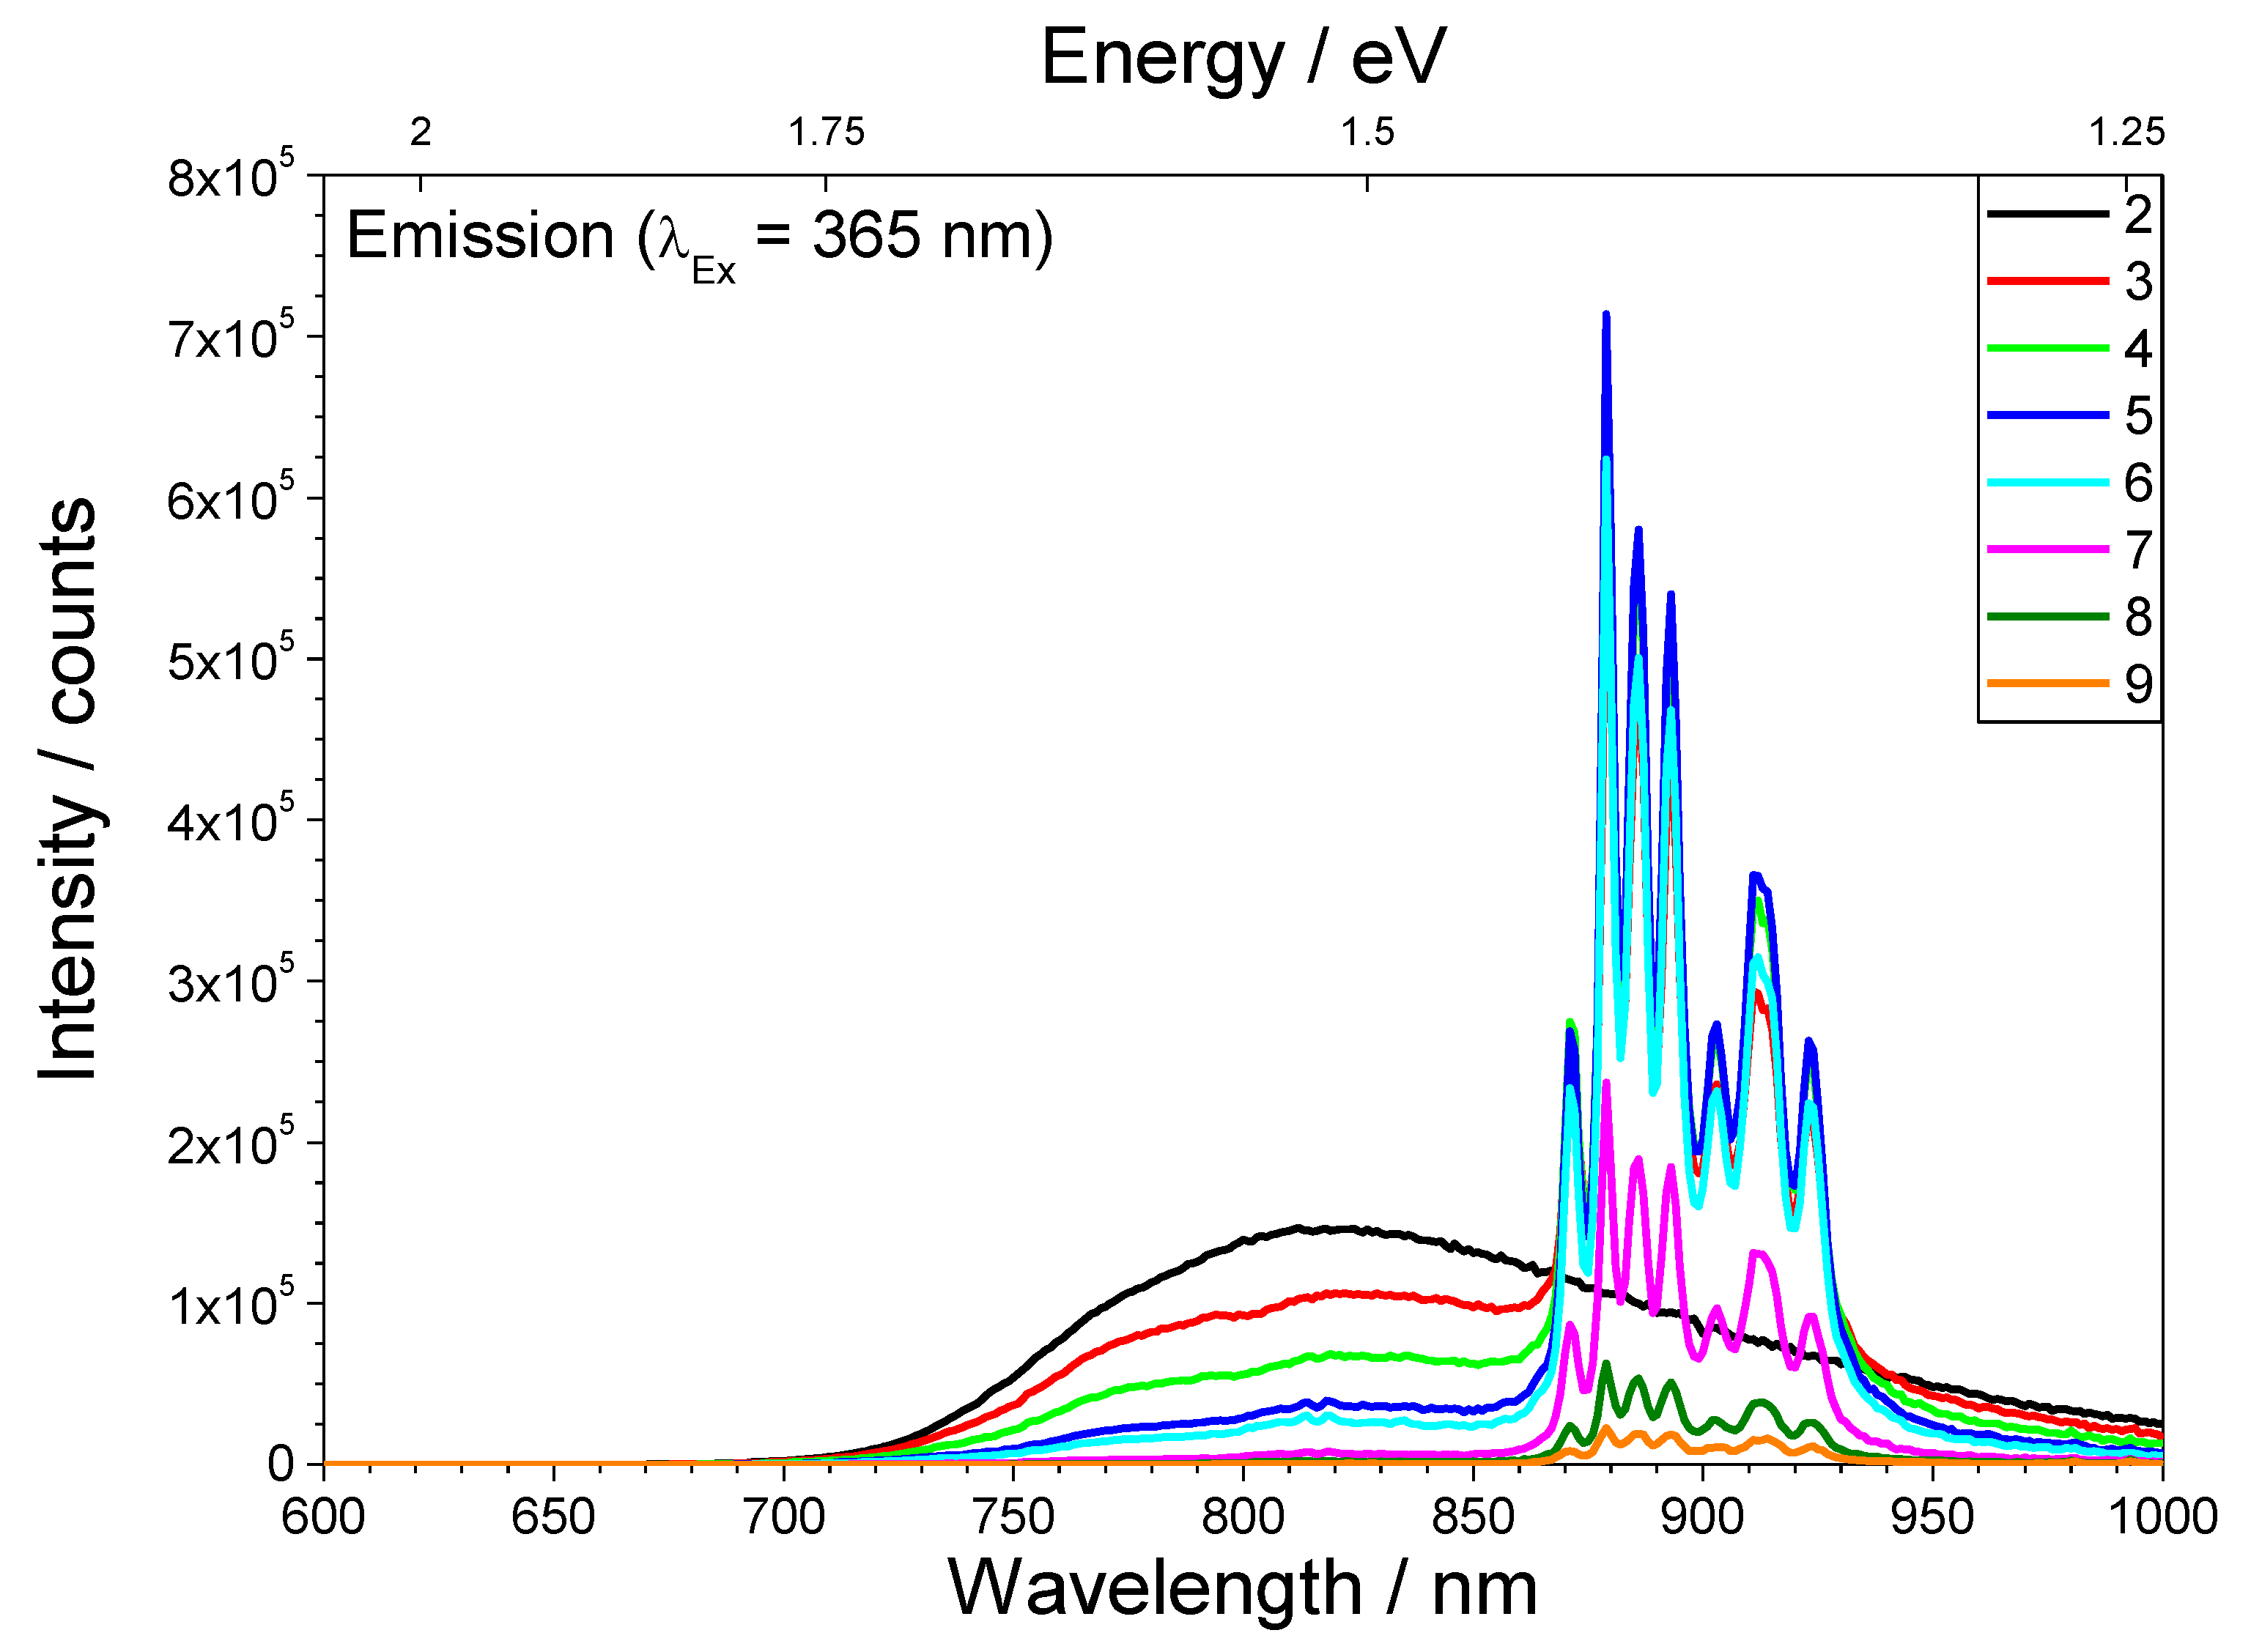
Figure 4 depicts the emission spectra of the compounds Ca2MgWO6:1%Cr,y%Nd, whereby y was between 0 and 8. In the absence of Nd3+ (sample 2), solely the broadband emission of Cr3+ was visible (4T2 → 4A2), which was located between 700 and 1000 nm and culminated at 825 nm. After adding the Nd3+, the emission intensity of the Cr3+ transition decreased, and new emission lines could be measured in the spectral range between 870 and 930 nm. Up to a Nd content of 1.5% (Sample 5), the Nd3+ emission intensity increased due to the gradually promoted energy transfer, while at even higher concentrations, it declined again due to concentration quenching.
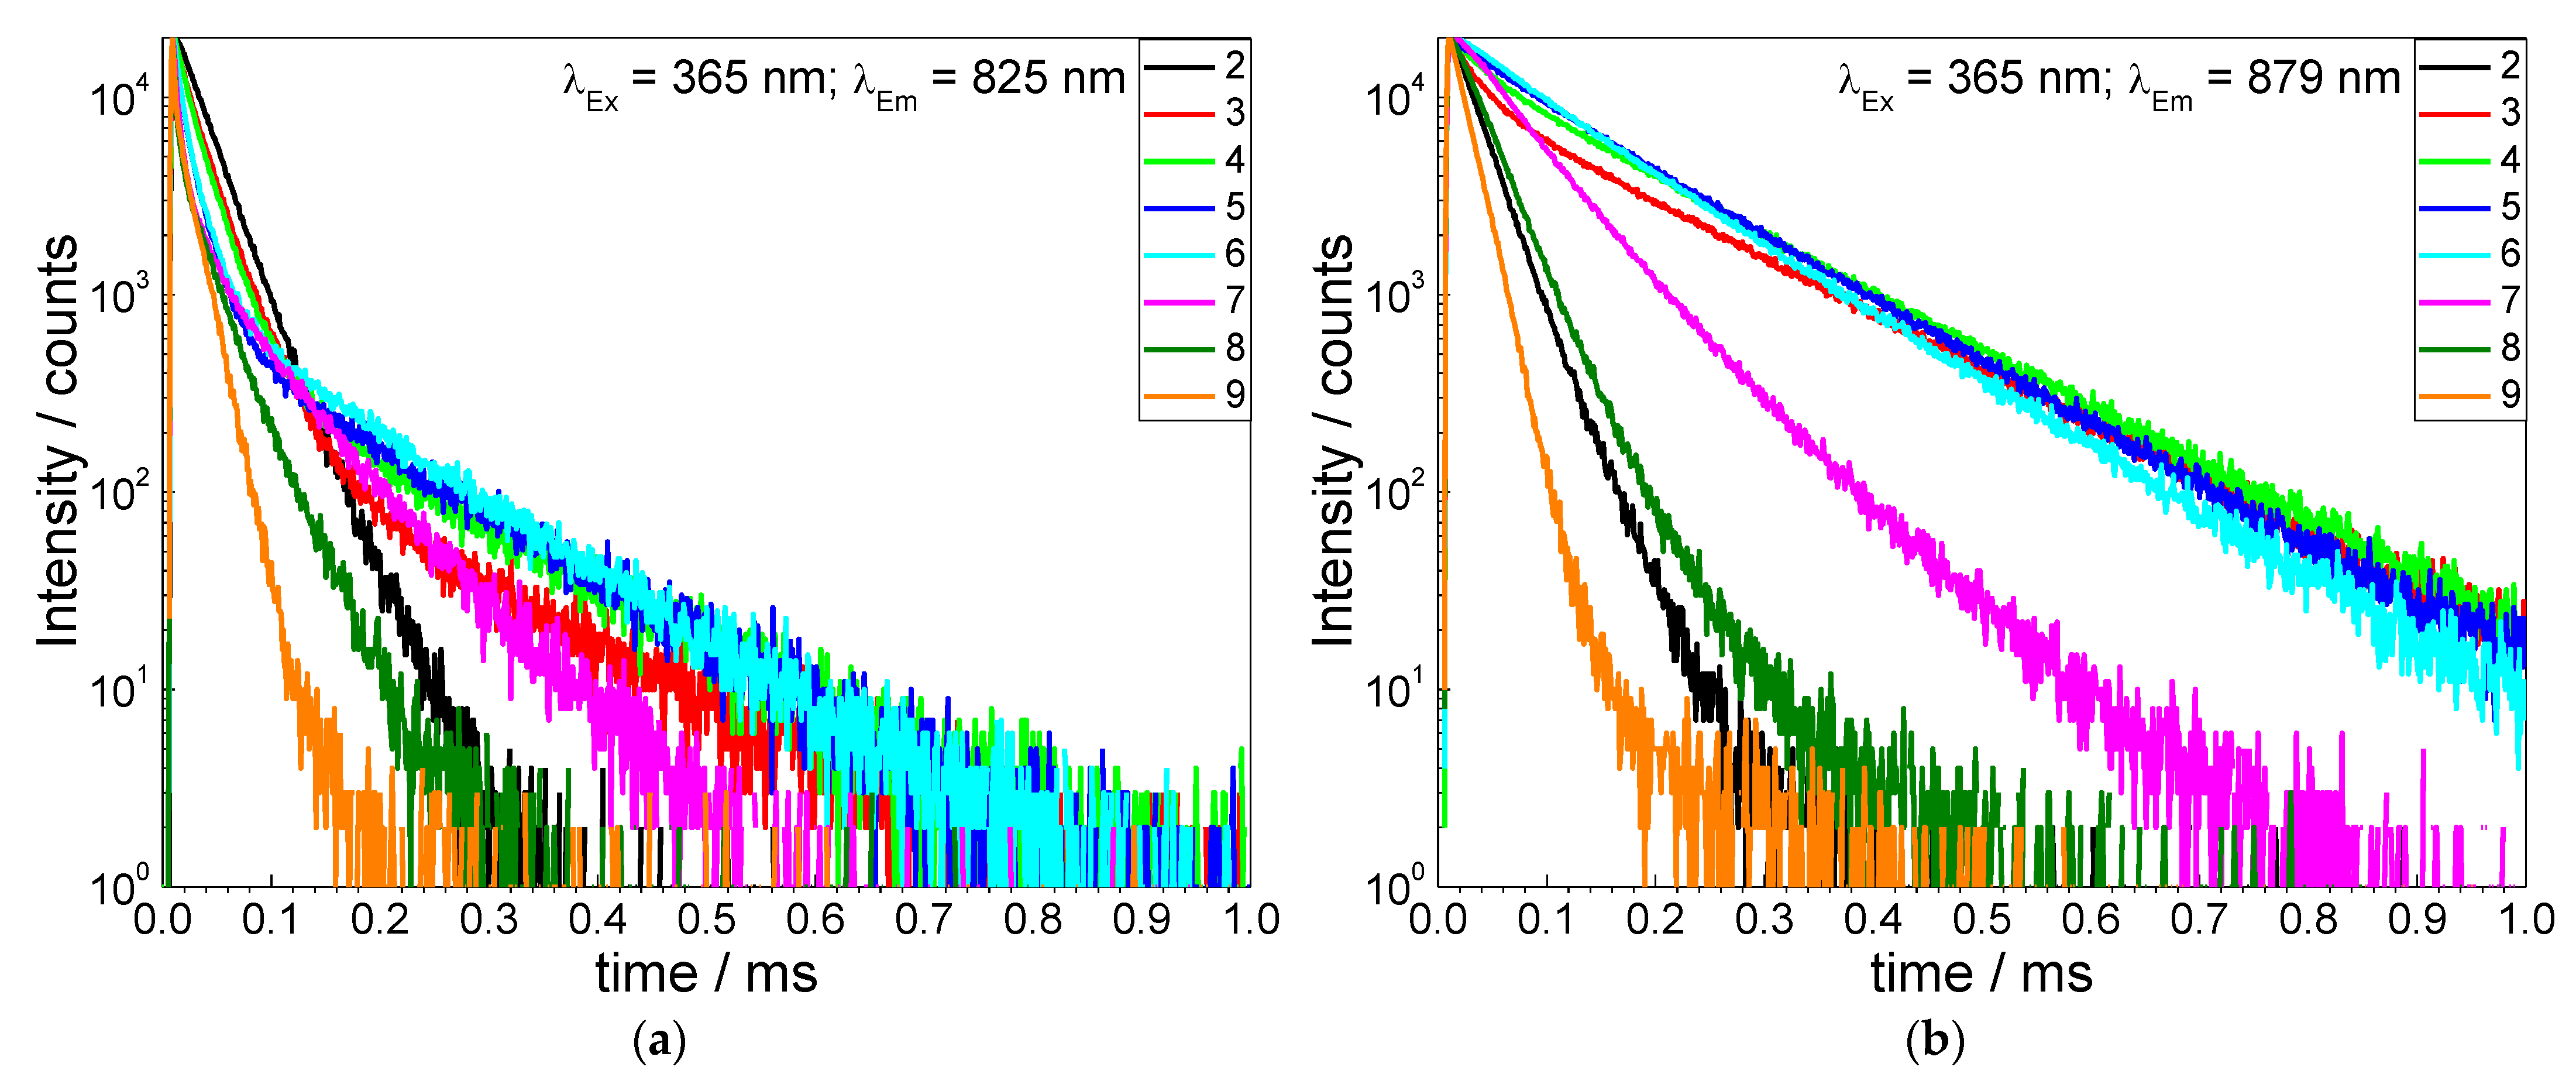
Figure 5 shows the decay curves of the compounds Ca2MgWO6:1%Cr, y%Nd, with excitation at λEx = 365 nm in each case.
In Figure 5a, the Cr3+ emission subsequent to UV-A excitation was observed at 825 nm. If only Cr3+ ions were present (Sample 2), a monoexponential decay curve was observed, which could be fitted with a decay time of τ = 28 µs. This fit very well with a spin-allowed transition originating from the 4T2 state. Upon co-doping with Nd3+ ions, biexponential decay curves were just obtained, with the first component decaying faster and the second component decaying much more slowly than observed for the sample without Nd3+. From this, it can be concluded that the energy was firstly transferred to the Nd3+ ions, and, secondly, back transfer to the Cr3+ ions occurred. The more Nd3+ ions were present in the compound (Samples 8 and 9), the more the observed decay curve could be approached by a monoexponential function. This points to the conclusion that the back transfer was no longer the rate-determining step.
In Figure 5b, the emission was observed at 879 nm. If solely Cr3+ ions were present Sample 2), a monoexponential decay behavior was present, which corresponded to the previously described decay behavior of Cr3+. By co-doping with Nd3+ ions, biexponential decay curves with significantly delayed decay behavior were initially obtained. With a further increase of the Nd3+ concentration (Sample 6), there was a monoexponential decay curve yielding a decay time of 120 µs. A further increase led again to a biexponential decay curve but with a shorter decay time compared to the previous samples.
Figure 5.
Decay curves of Ca2MgWO6 doped with 1% Cr3+ and (0–8)% Nd3+ and double amount of Li+ and Na+; (a) emission monochromator fixed at emission line of Cr3+ (825 nm), (b) emission monochromator fixed at emission line of Nd3+ (879 nm).
Figure 5.
Decay curves of Ca2MgWO6 doped with 1% Cr3+ and (0–8)% Nd3+ and double amount of Li+ and Na+; (a) emission monochromator fixed at emission line of Cr3+ (825 nm), (b) emission monochromator fixed at emission line of Nd3+ (879 nm).

4. Conclusions
In summary, a set of single phase samples of Ca2MgWO6:Cr3+,Nd3+ were prepared by a conventional solid state reaction due to sintering at 1300 °C. Additionally, the synthesis procedure of this material was optimized by adding the double molar amount of Li+ and Na+ for charge compensation. The presence of highly pure samples and the lack of the formation of color centers were confirmed by reflection spectra.
Photoluminescence properties were also studied in detail. The excitation spectra of the Cr3+ activator extended from 250 to 750 nm, while the emission spectra of the Cr3+ spread out from 700 to 1000 nm. Efficient energy transfer occurred from Cr3+ to Nd3+, which was proven by the decline of luminescence intensity and the decay time of Cr3+ by ascending the concentration of the co-dopant Nd3+. Since the activator Cr3+ exhibited broadband absorption between 250 and 750 nm, especially between 250 and 430 nm, and Nd3+ emit in the NIR range, the Ca2MgWO6:Cr3+,Nd3+ phosphors are promising materials to be employed as luminescent converters in ultraviolet (Al,Ga)N or near UV (In,Ga)N emitting LEDs.
Author Contributions
Writing—original draft, V.A.; Writing—review & editing, T.J. All authors have read and agreed to the published version of the manuscript.
Funding
This research was funded by Bundesdruckerei GmbH, Berlin, Germany and European Union (Europäische Union, Europäischer Fonds für regionale Entwicklung (EFRE)), Förderkennzeichen: 1703FI01).
Institutional Review Board Statement
Not applicable.
Informed Consent Statement
Not applicable.
Data Availability Statement
Not applicable.
Conflicts of Interest
The authors declare no conflict of interest.
References
- Zabiliūtė-Karaliūnė, A.; Dapkus, H.; Petrauskas, R.P.; Butkutė, S.; Žukauskas, A.; Kareiva, A. Cr3+ doped yttrium gallium garnet for phosphor-conversion light emitting diodes. Lith. J. Phys. 2015, 55, 200–207. [Google Scholar] [CrossRef] [Green Version]
- Martin, P.A. Near-infrared diode laser spectroscopy in chemical process and environmental air monitoring. Chem. Soc. Rev. 2002, 31, 201–210. [Google Scholar] [CrossRef] [PubMed]
- Godavarty, A.; Thompson, A.B.; Roy, R.; Gurfinkel, M.; Eppstein, M.J.; Zhang, C.; Sevick-Muraca, E.M. Diagnostic imaging of breast cancer using fluorescence-enhanced optical tomography: Phantom studies. J. Biomed. Opt. 2004, 9, 488–496. [Google Scholar] [CrossRef]
- Blanco, M.; Villarroya, I. NIR spectroscopy: A rapid-response analytical tool. Trends Anal. Chem. 2002, 21, 240–250. [Google Scholar] [CrossRef]
- Min, P.K.; Goo, B.L. 830 nm light-emitting diode low level light therapy (LED-LLLT) enhances wound healing: A preliminary study. Laser Ther. 2013, 22, 43–49. [Google Scholar] [CrossRef] [PubMed] [Green Version]
- Usamentiaga, R.; Venegas, P.; Guerediaga, J.; Vega, L.; Molleda, J.; Bulnes, F.G. Infrared thermography for temperature measurement and non-destructive testing. Sensors 2014, 14, 12305–12348. [Google Scholar] [CrossRef] [Green Version]
- Han, C.B.; He, C.; Li, X.J. Near-infrared light emission from a GaN/Si nanoheterostructure array. Adv. Mater. 2011, 23, 4811–4814. [Google Scholar] [CrossRef]
- Xia, Q.; Batentschuk, M.; Osvet, A.; Richter, P.; Häder, D.P.; Schneider, J.; Brabec, C.J.; Wondraczek, L.; Winnacker, A. Enhanced photosynthetic activity in Spinacia oleracea by spectral modification with a photoluminescent light converting material. Opt. Express 2013, 21 (Suppl. S6), A909–A916. [Google Scholar] [CrossRef] [Green Version]
- Zhu, J.; Xia, Z.; Liu, Q. Synthesis and energy transfer studies of LaMgAl11O19:Cr3+,Nd3+ phosphors. Mater. Res. Bull. 2016, 74, 9–14. [Google Scholar] [CrossRef]
- Patwe, S.J.; Achary, S.N.; Mathews, M.D.; Tyagi, A.K. Crystal structure and thermal expansion behavior of Ca2MgWO6. Mater. Chem. Phys. 2006, 98, 486–493. [Google Scholar] [CrossRef]
- Lei, F.; Yan, B. Synthesis and photoluminescence of perovskite-type Ca2MgWO6:Eu3+ micrometer phosphor. Optoelectron. Adv. Mater. Rapid Commun. 2008, 10, 158–163. [Google Scholar]
- Cao, R.; Quan, G.; Shi, Z.; Luo, Z.; Hu, Q.; Guo, S. A double perovskite Ca2MgWO6:Bi3+ yellow-emitting phosphor: Synthesis and luminescence properties. J. Lumin. 2017, 181, 332–336. [Google Scholar] [CrossRef]
- Cao, R.; Xu, H.; Luo, W.; Luo, Z.; Guo, S.; Xiao, F.; Ao, H. Synthesis, energy transfer and luminescence properties of Ca2MgWO6:Sm3+, Bi3+ phosphor. Mater. Res. Bull. 2016, 81, 27–32. [Google Scholar] [CrossRef]
- Cui, M.; Wang, J.; Li, J.; Huang, S.; Shang, M. An abnormal yellow emission and temperature-sensitive properties for perovskite-type Ca2MgWO6 phosphor via cation substitution and energy transfer. J. Lumin. 2019, 214, 116588. [Google Scholar] [CrossRef]
- Jiang, Y.; Tong, Y.; Chen, S.; Zhang, W.; Hu, F.; Wei, R.; Guo, H. A three-mode self-referenced optical thermometry based on up-conversion luminescence of Ca2MgWO6:Er3+,Yb3+ phosphors. Chem. Eng. J. 2021, 421, 127470. [Google Scholar] [CrossRef]
- Chen, X.; Zhao, T.; Qin, L. The red-emitting phosphors of Mn4+-activated A2MgWO6 (A = Ba, Sr, Ca) for light emitting diodes. Ceram. Int. 2021, 47, 6010–6022. [Google Scholar] [CrossRef]
- Xu, D.; Wu, X.; Zhang, Q.; Li, W.; Wang, T.; Cao, L.; Meng, J. Fluorescence property of novel near-infrared phosphor Ca2MgWO6:Cr3+. J. Alloy. Compd. 2018, 731, 156–161. [Google Scholar] [CrossRef]
- Xu, D.; Zhang, Q.; Wu, X.; Li, W.; Meng, J. Synthesis, luminescence properties and energy transfer of Ca2MgWO6:Cr3+,Yb3+ phosphors. Mater. Res. Bull. 2019, 110, 135–140. [Google Scholar] [CrossRef]
- Yang, J.H.; Choo, W.K.; Lee, C.H. Ca2MgWO6 from neutron and X-ray powder data. Acta. Crystallogr. C 2003, 59, i86–i88. [Google Scholar] [CrossRef] [Green Version]
- Shannon, R.D.; Prewitt, C.T. Effective ionic radii in oxides and fluorides. Acta. Crystallogr. B Struct. Sci. 1969, 25, 925–946. [Google Scholar] [CrossRef]
- Malysa, B.; Meijerink, A.; Jüstel, T. Temperature dependent luminescence Cr3+-doped GdAl3(BO3)4 and YAl3(BO3)4. J. Lumin. 2016, 171, 246–253. [Google Scholar] [CrossRef]
- Malysa, B.; Meijerink, A.; Wu, W.; Jüstel, T. On the influence of calcium substitution to the optical properties of Cr3+ doped SrSc2O4. J. Lumin. 2017, 190, 234–241. [Google Scholar] [CrossRef]
- Malysa, B.; Meijerink, A.; Jüstel, T. Temperature dependent photoluminescence of Cr3+ doped Sr8MgLa(PO4)7. Opt. Mater. 2018, 85, 341–348. [Google Scholar] [CrossRef]
- Anselm, V.; Jüstel, T. On the photoluminescence and energy transfer of SrGa12O19:Cr3+,Nd3+ microscale NIR phosphors. J. Mater. Res. Technol. 2021, 11, 785–791. [Google Scholar] [CrossRef]
Figure 1.
Room temperature X-ray diffractions (XRDs) of Cr3+ and Nd3+ co-doped Ca2MgWO6 samples compared to the reference from the Pearson’s Crystal Database (ICDD: 04-012-4403).
Figure 1.
Room temperature X-ray diffractions (XRDs) of Cr3+ and Nd3+ co-doped Ca2MgWO6 samples compared to the reference from the Pearson’s Crystal Database (ICDD: 04-012-4403).

Figure 3.
Excitation spectra of Ca2MgWO6 doped with 1% Cr3+ and (0–8)% Nd3+ and double amount of Li+ and Na+; (a) emission monochromator fixed at emission line of Cr3+ (825 nm), (b) emission monochromator fixed at emission line of Nd3+ (879 nm).
Figure 3.
Excitation spectra of Ca2MgWO6 doped with 1% Cr3+ and (0–8)% Nd3+ and double amount of Li+ and Na+; (a) emission monochromator fixed at emission line of Cr3+ (825 nm), (b) emission monochromator fixed at emission line of Nd3+ (879 nm).

Figure 4.
Emission spectra of Ca2MgWO6 doped with 1% Cr3+ and (0–8)% Nd3+ and double amount of Li+ and Na+.
Figure 4.
Emission spectra of Ca2MgWO6 doped with 1% Cr3+ and (0–8)% Nd3+ and double amount of Li+ and Na+.


Table 1.
Stoichiometric details of prepared samples.
| Sample Number | Atom-% Cr3+ | Atom-% Nd3+ | Atom-% Li+ | Atom-% Na+ | Formula |
|---|---|---|---|---|---|
| 1 | 0 | 0 | 0 | 0 | Ca2MgWO6 |
| 2 | 1 | 0 | 2 | 0 | Ca2Mg0.97Cr0.01Li0.02WO6 |
| 3 | 1 | 0.5 | 2 | 1 | Ca1.97Nd0.01Na0.02Mg0.97Cr0.01Li0.02WO6 |
| 4 | 1 | 1 | 2 | 2 | Ca1.94Nd0.02Na0.04Mg0.97Cr0.01Li0.02WO6 |
| 5 | 1 | 1.5 | 2 | 3 | Ca1.91Nd0.03Na0.06Mg0.97Cr0.01Li0.02WO6 |
| 6 | 1 | 2 | 2 | 4 | Ca1.88Nd0.04Na0.08Mg0.97Cr0.01Li0.02WO6 |
| 7 | 1 | 4 | 2 | 8 | Ca1.76Nd0.08Na0.16Mg0.97Cr0.01Li0.02WO6 |
| 8 | 1 | 6 | 2 | 12 | Ca1.64Nd0.16Na0.24Mg0.97Cr0.01Li0.02WO6 |
| 9 | 1 | 8 | 2 | 16 | Ca1.52Nd0.16Na0.32Mg0.97Cr0.01Li0.02WO6 |
| 10 | 1 | 0 | 0 | 0 | Ca2Mg0.99Cr0.01WO6 |
| 11 | 1 | 0 | 1 | 0 | Ca2Mg0.98Cr0.01Li0.01WO6 |
| 12 | 0 | 1 | 0 | 0 | Ca1.98Nd0.02MgWO6 |
| 13 | 0 | 1 | 0 | 1 | Ca1.96Nd0.02Na0.02MgWO6 |
| 14 | 0 | 1 | 0 | 2 | Ca1.94Nd0.02Na0.04MgWO6 |
| 15 | 1 | 1 | 0 | 0 | Ca1.98Nd0.02Mg0.99Cr0.01WO6 |
| 16 | 1 | 1 | 0.5 | 0.5 | Ca1.97Nd0.02Na0.01Mg0.985Cr0.01Li0.005WO6 |
| 17 | 1 | 1 | 1 | 1 | Ca1.96Nd0.02Na0.02Mg0.98Cr0.01Li0.01WO6 |
| 18 | 1 | 1 | 1.5 | 1.5 | Ca1.95Nd0.02Na0.03Mg0.975Cr0.01Li0.015WO6 |
Publisher’s Note: MDPI stays neutral with regard to jurisdictional claims in published maps and institutional affiliations. |
© 2021 by the authors. Licensee MDPI, Basel, Switzerland. This article is an open access article distributed under the terms and conditions of the Creative Commons Attribution (CC BY) license (https://creativecommons.org/licenses/by/4.0/).
Share and Cite
MDPI and ACS Style
Anselm, V.; Jüstel, T. Optimization of the Synthesis and Energy Transfer of Ca2MgWO6:Cr3+,Nd3+. Inorganics 2021, 9, 23. https://0-doi-org.brum.beds.ac.uk/10.3390/inorganics9040023
AMA Style
Anselm V, Jüstel T. Optimization of the Synthesis and Energy Transfer of Ca2MgWO6:Cr3+,Nd3+. Inorganics. 2021; 9(4):23. https://0-doi-org.brum.beds.ac.uk/10.3390/inorganics9040023
Chicago/Turabian StyleAnselm, Viktor, and Thomas Jüstel. 2021. "Optimization of the Synthesis and Energy Transfer of Ca2MgWO6:Cr3+,Nd3+" Inorganics 9, no. 4: 23. https://0-doi-org.brum.beds.ac.uk/10.3390/inorganics9040023
Note that from the first issue of 2016, this journal uses article numbers instead of page numbers. See further details here.