Article

Study of Anharmonicity in Zirconium Hydrides Using Inelastic Neutron Scattering and Ab-Initio Computer Modeling

by
Jiayong Zhang
1,2,
Yongqiang Cheng
2,
Alexander I. Kolesnikov
2,
Jerry Bernholc
1,3,
Wenchang Lu
1,3 and
Anibal J. Ramirez-Cuesta
2,*
1
Department of Physics, North Carolina State University, Raleigh, NC 27695, USA
2
Oak Ridge National Laboratory, Neutron Scattering Division, Oak Ridge, TN 37831, USA
3
Oak Ridge National Laboratory, Computational Sciences and Engineering Division, Oak Ridge, TN 37831, USA
*
Author to whom correspondence should be addressed.
Submission received: 25 March 2021 / Revised: 15 April 2021 / Accepted: 16 April 2021 / Published: 21 April 2021

Abstract

:
The anharmonic phonon behavior in zirconium hydrides and deuterides, including ϵ-ZrH2, γ-ZrH, and γ-ZrD, has been investigated from aspects of inelastic neutron scattering (INS) and lattice dynamics calculations within the framework of density functional theory (DFT). The harmonic model failed to reproduce the spectral features observed in the experimental data, indicating the existence of anharmonicity in those materials and the necessity of further explanations. Here, we present a detailed study on the anharmonicity in zirconium hydrides/deuterides by exploring the 2D potential energy surface of hydrogen/deuterium atoms and solving the corresponding 2D single-particle Schrödinger equation to obtain the eigenfrequencies, which are then convoluted with the instrument resolution. The convoluted INS spectra qualitatively describe the anharmonic peaks in the experimental INS spectra and demonstrate that the anharmonicity originates from the deviations of hydrogen potentials from quadratic behavior in certain directions; the effects are apparent for the higher-order excited vibrational states, but small for the ground and first excited states.

Graphical Abstract

1. Introduction

Metal hydrides have been studied extensively during the past decades. In particular, there are special interests in their properties and applications in various areas, including hydrogen storage and utilization in nuclear reactors as neutron moderators [1] and fuel rod cladding materials [2], due to their low thermal neutron absorption cross-section and good mechanical properties. Therefore, numerous experimental and theoretical investigations on their structural and dynamical properties have been conducted and reported in publications since the 1950s.
It is well established that zirconium hydrides have a complex phase diagram as a function of temperature, hydrogen content, and pressure [3,4,5]. Different phases such as ζ-ZrH0.5 [6], γ-ZrH, δ-ZrH1.5, and ϵ-ZrH2 have been identified. A stoichiometric γ-ZrH (face-centered orthorhombic metal sublattice) can be prepared by special temperature treatment [5]. Among those phases, this study focuses on γ-ZrH in the Cccm space group, and ϵ-ZrH2 in the I4/mmm space group. Though the phase diagram has been determined, some hydrides’ structures, stabilities, or formation mechanisms are still unknown [7].
The optical phonon properties of ZrH1.5 were first analyzed using inelastic neutron scattering (INS) by Andresen et al. in 1957 [8]. Yamanaka [9] studied the thermal and mechanical properties of zirconium hydrides. Based on first-principles calculations, considerable research efforts have been devoted to the mechanical and thermodynamical properties of zirconium hydrides. Early studies by Ackland found that bistable crystal structures exist with minimal energy difference in ϵ-ZrH2 [10]. Subsequent studies demonstrated that one of the bistable structures may be unstable or metastable. Elsasser reported that at the center of the Brillouin zone (gamma point), the potential energy profiles for hydrogen atoms in ZrH2 are parabolic up to about 300 meV [11]. Besides theoretical treatments, INS spectroscopy has also been employed to measure the vibrational spectrum of ϵ-ZrH2. The peak splitting of multi-phonon events was observed in 1983 by Ikeda [12], yet was not explained. Kolesnikov et al. later attributed those split peaks below multi-phonon events in γ-ZrH and γ-ZrD to bound multi-phonon states [13,14].
Those experiments and calculations revealed that hydrogen vibrations in zirconium hydrides are almost harmonic for the ground and first excited states but turn out to be anharmonic for the higher excitations of the hydrogen atoms in the lattice. Though phonon theory and techniques have been well developed, they are mostly based on the harmonic approximation with a limited focus beyond that point. Phonon density of states (PDOS) with full consideration of anharmonicity can be extracted from molecular dynamics (MD) simulations by the velocity autocorrelation function (VACF); however, only frequency information can be accessed, which limits further analysis involving the polarization of phonons. More recently, the temperature-dependent effective potential (TDEP) method has been developed to address the anharmonicity problem by taking temperature effects into consideration from MD simulations [15,16]. However, none of the above approaches are capable of obtaining comparable results with our broadband INS data for zirconium hydrides, bringing the necessity of an alternative technique to address the problem.
Based on the above considerations, and to present a combined study regarding the origin of anharmonicity in ZrHx, we conducted a qualitative and semi-quantitative analysis that accounts for the effects observed in the INS spectra of zirconium hydrides by exploring the potential energy surface (PES) of these materials using density functional theory (DFT) and solving the corresponding eigenfrequencies using quantum theory. The isotope effects were also investigated by checking the γ-ZrD system. In this work, we successfully combined DFT, quantum theory, and INS spectra calculations, to improve our understanding of the mechanical and thermal properties of zirconium hydrides. The methodology can be applied to other metal hydride systems.

2. Methods

Multiple ab initio simulation packages within the framework of DFT have been employed to carry out first-principles calculations in this work, including the Vienna ab initio simulation package (VASP) [17,18], and the Real-space MultiGrid code (RMG) [19,20,21]. VASP is a plane-wave-based DFT package with the implementation of multiple pseudopotentials. In all our VASP calculations, the electron–ion interaction and exchange-correlation functional were described by the projector-augmented wave (PAW) method [22] and the generalized gradient approximation (GGA) [23] with the parametrization of Perdew–Burke–Ernzerhof (PBE) [24], respectively. A first-order Methfessel–Paxton scheme [25] with a smearing width of 0.05 eV was employed to integrate total energy in the Brillouin Zone (BZ), and the energy cutoff in the plane-wave functions was set to be 600 eV. Valence electron configuration in zirconium was carefully chosen as 4 s 2 4 p 6 4 d 2 5 s 2 to include semi-core states, and in hydrogen was 1 s 1 . The self-consistent convergence of the total energy calculation is 10 8 eV. RMG is an electronic structure calculation code based on the real-space method, implementing an ultrasoft pseudopotential and a norm-conserving pseudopotential. The RMG phonon methodology has been recently developed [26], and it is well suited for large-scale phonon calculations. In all RMG calculations, the real-space grid spacing was set to 0.15 Å, and a norm-conserving pseudopotential with exchange-correlation described by the PBE functional was used. Valence electrons for Zr were 4 d 2 5 s 2 . The convergence criteria for the root-mean-square (RMS) change in the total potential energy per step was set as 10 7 , and a Fermi–Dirac occupation type with electron temperature as 0.05 eV was used in energy integration.
The phonon dispersions of ZrHx (ZrHx means one of ϵ-ZrH2, γ-ZrH, and γ-ZrD) were calculated using the finite displacement method (FDM) as implemented in the Phonopy package [27] employing the forces calculated by both VASP and RMG packages. 2 × 2 × 2 supercells of ZrHx (containing 96 atoms for ϵ-ZrH2 or 64 for γ-ZrH and γ-ZrD) were used with small atomic displacements of 0.01 Å. A gamma-centered 5 × 5 × 5 k-mesh for ϵ-ZrH2, and an 11 × 11 × 11 mesh for γ-ZrH and γ-ZrD were used to integrate total energy. K-mesh and energy cutoff have been tested to converge to 1 meV/atom in RMG and VASP for the total energy. The phonon properties computed by the Phonopy package were used to simulate the INS spectra [28] by the OCLIMAX software [29,30], a program aiming at simulating INS spectra based on vibrational normal modes. A 31 × 31 × 31 uniformly sampled k-mesh in the BZ was used to represent vibrational modes for our OCLIMAX calculations.
The frozen phonon calculations and potential surface sampling calculations were done with the VASP package.
To validate simulation results, the experimental INS spectrum for ϵ-ZrH2 was measured at 5 K with the VISION spectrometer [31] at the Spallation Neutron Source (SNS), Oak Ridge National Laboratory (ORNL). The ZrH2 sample (99% purity) was obtained from Sigma-Aldrich, and for the INS experiment, the sample was placed in a flat aluminum container of 50 × 50 × 0.2 mm 3 size. The estimated transmission of thermal neutrons through the sample is ∼90%, that means the multiple neutron scattering should be small [32]. The spectrum from an empty container was measured under similar conditions and subtracted from the sample data. INS spectra for γ-ZrH and γ-ZrD were measured previously [13,14] with the TFXA spectrometer [33] at ISIS, Rutherford Appleton Laboratory, UK. INS can measure the vibrational spectrum weighted by the amplitude of motion and the neutron cross-section of the atoms. INS has no selection rules, and more importantly, the comparison of INS simulations with experimental data is rigorous and straightforward. Thus, INS becomes a perfect technique to be combined with theoretical vibrational analysis.

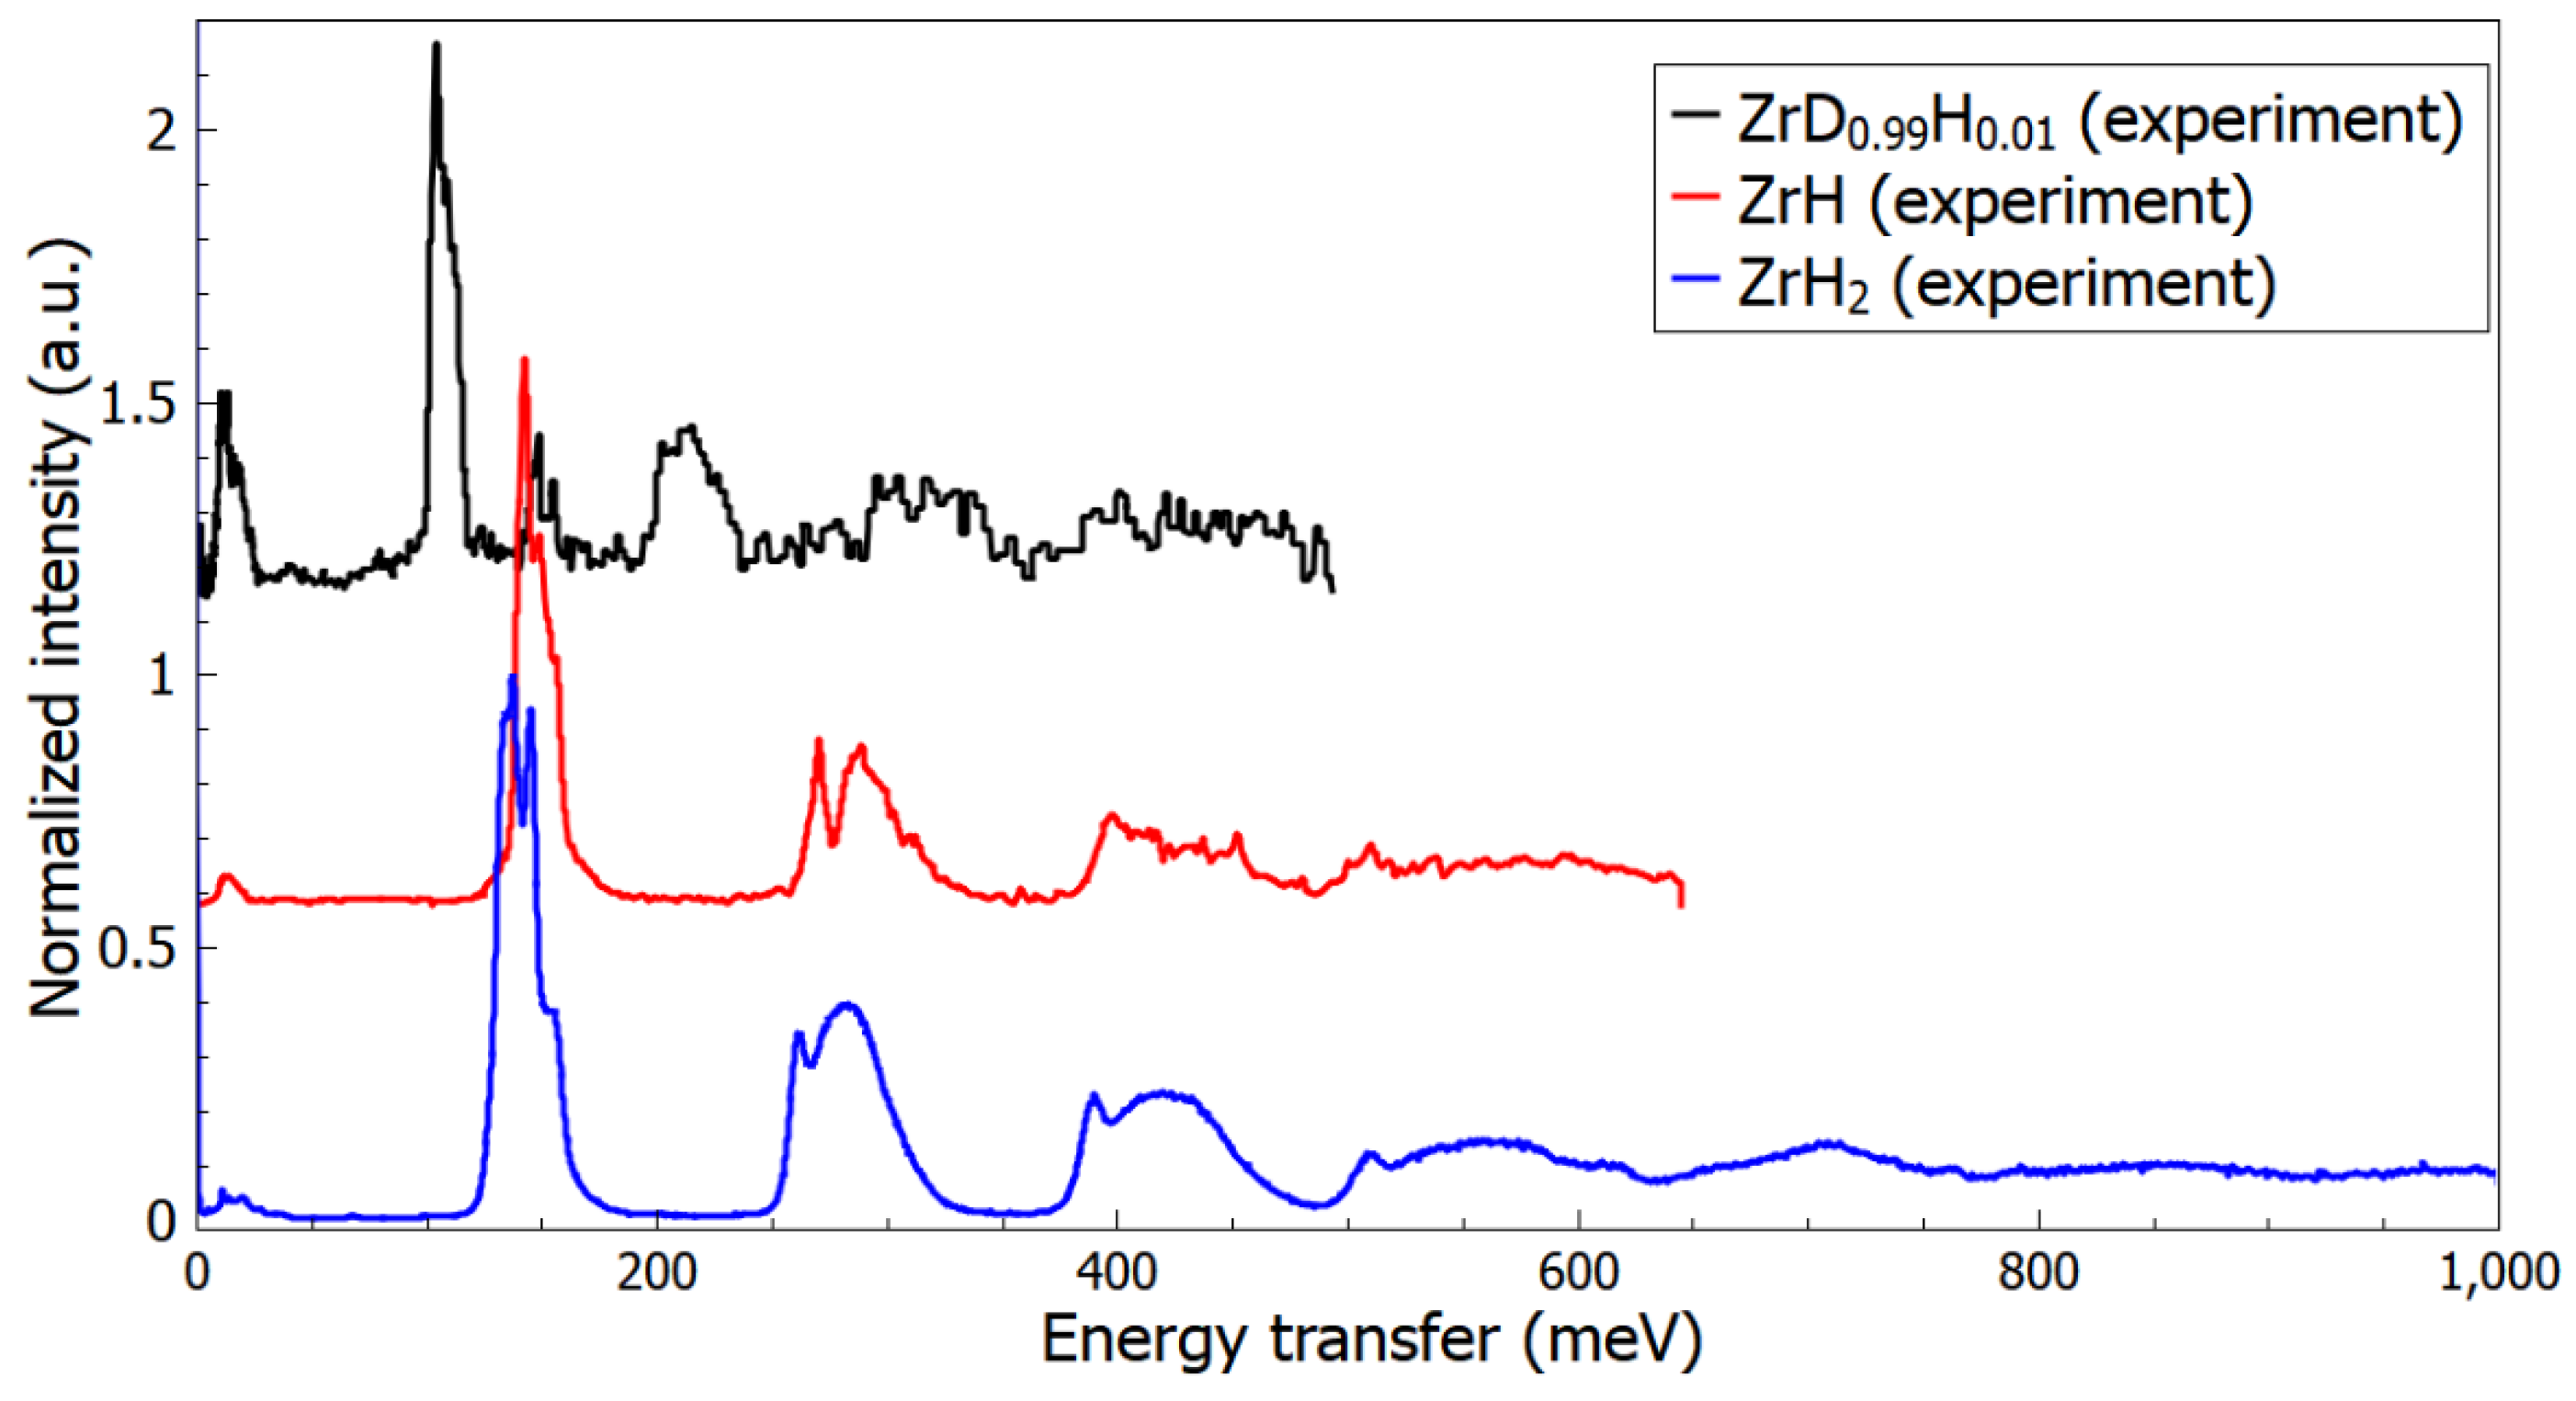
3. Results and Discussion

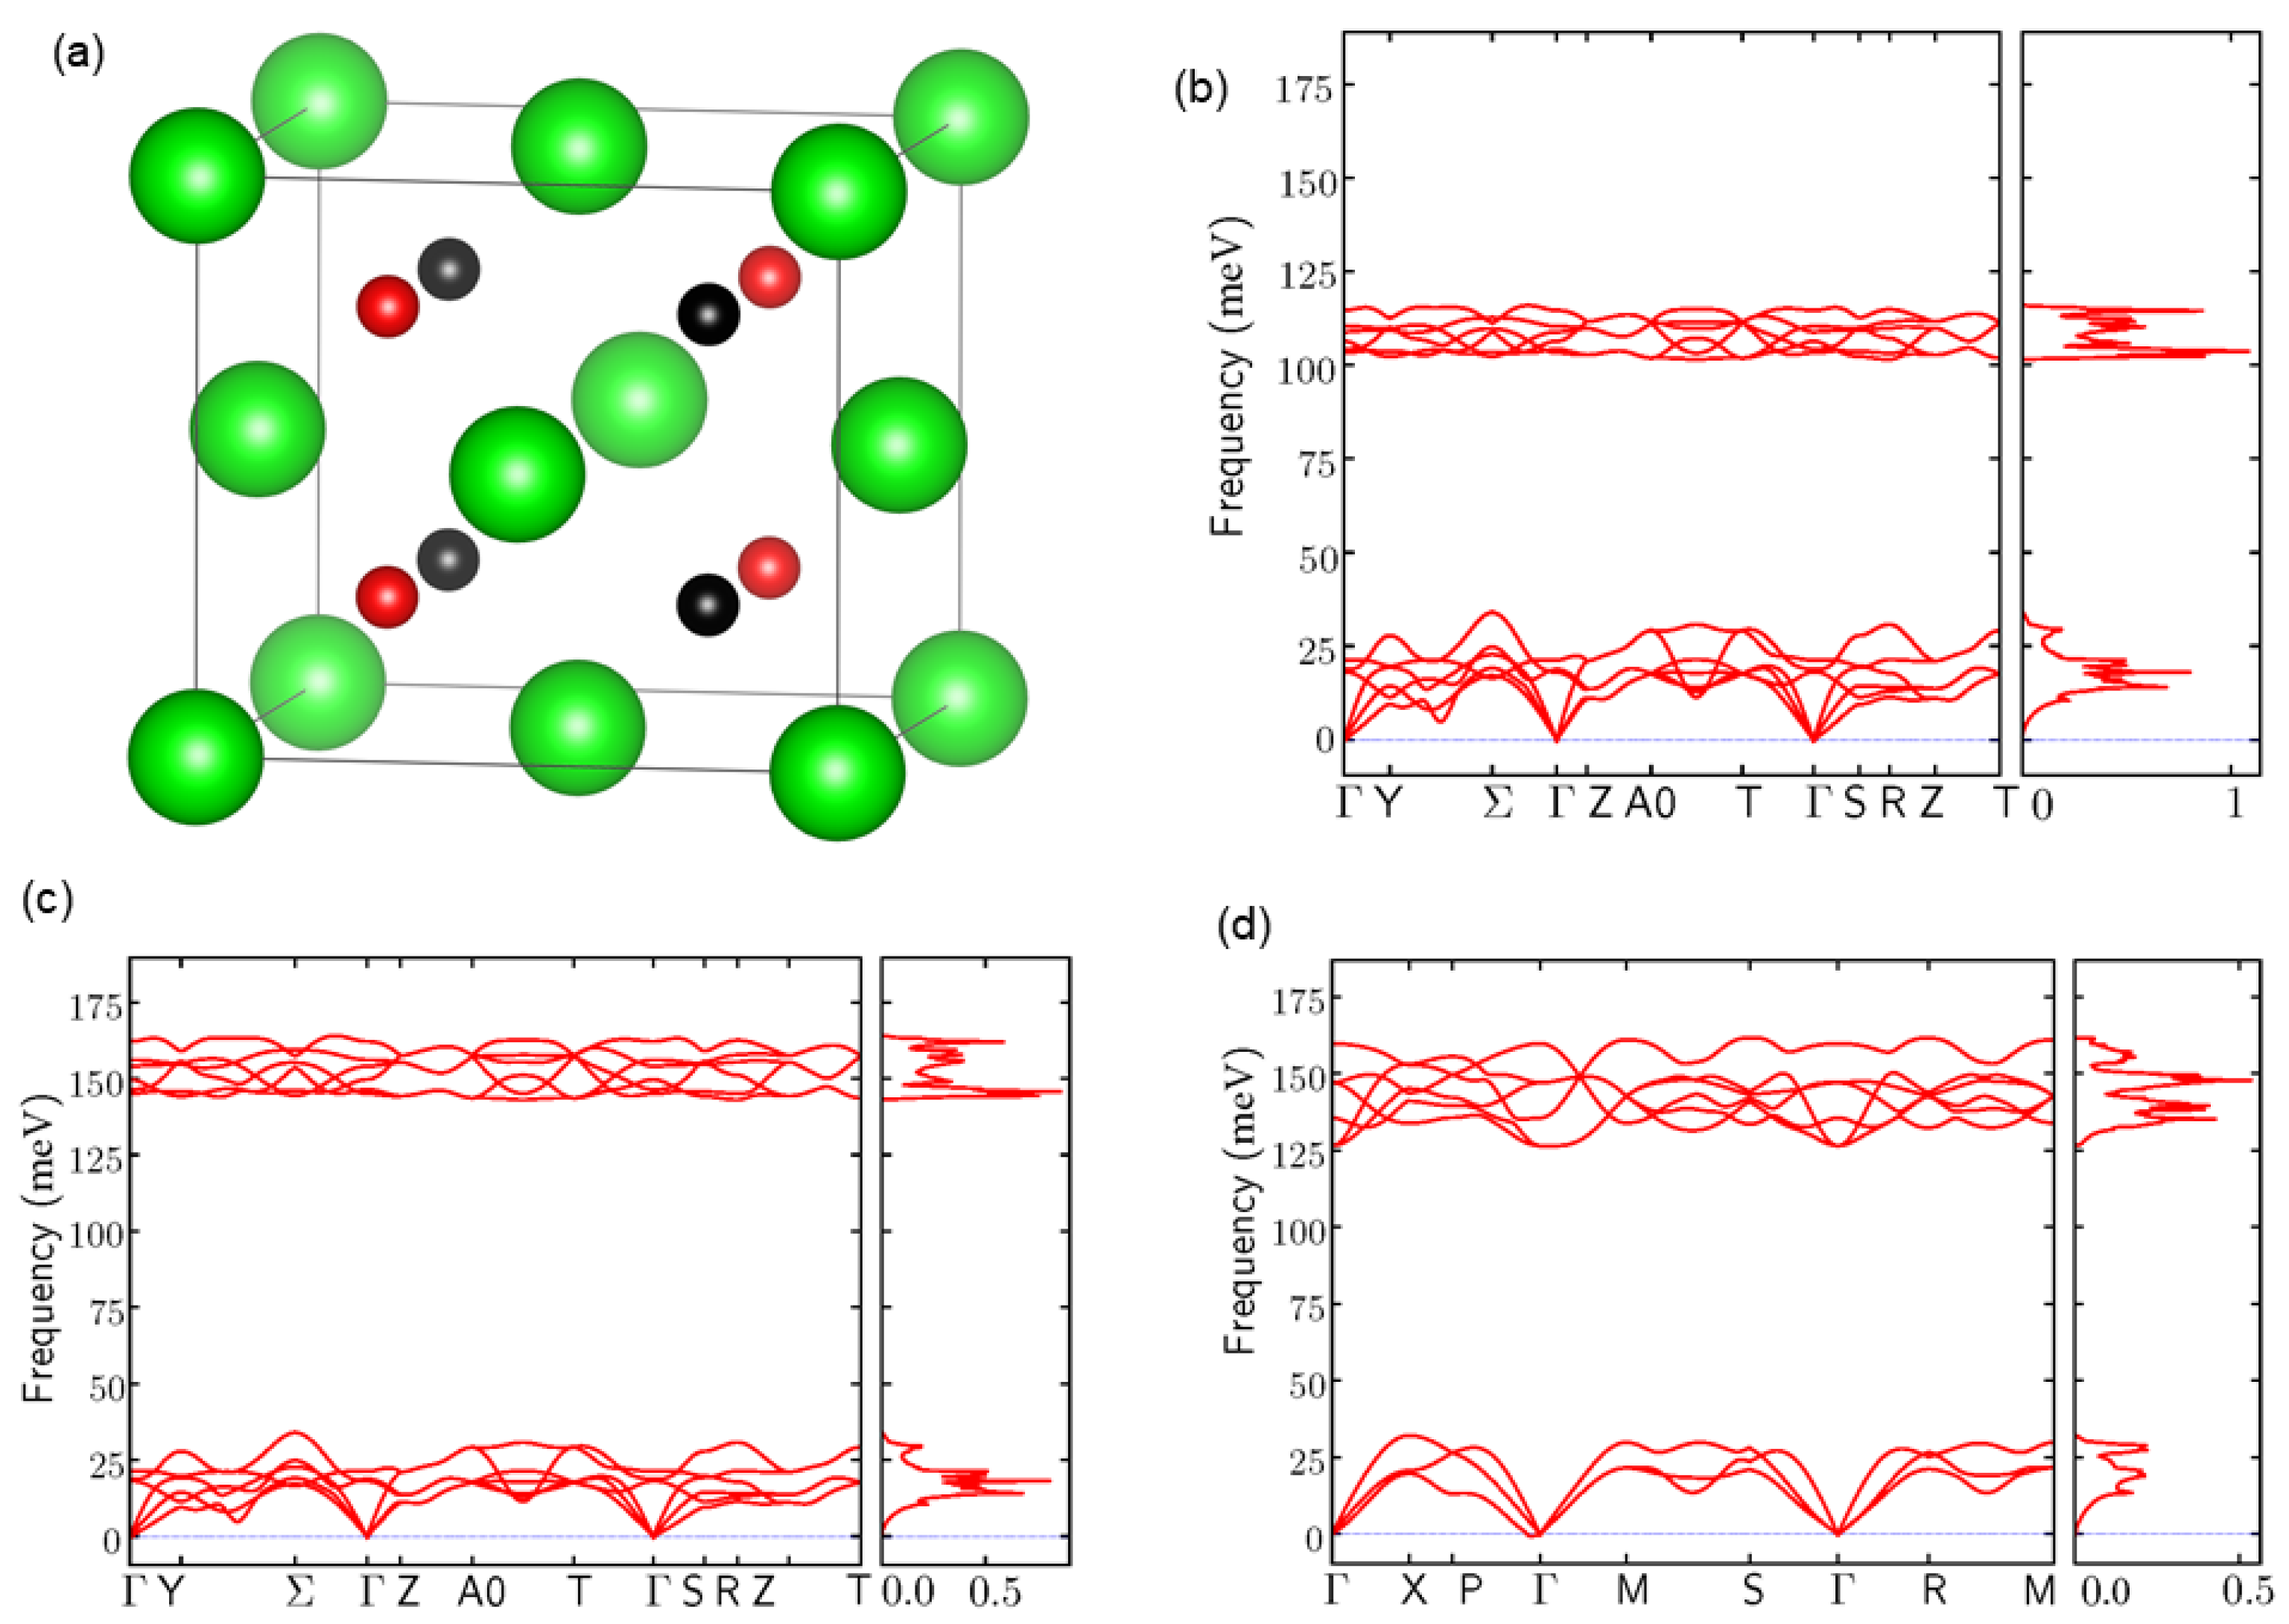
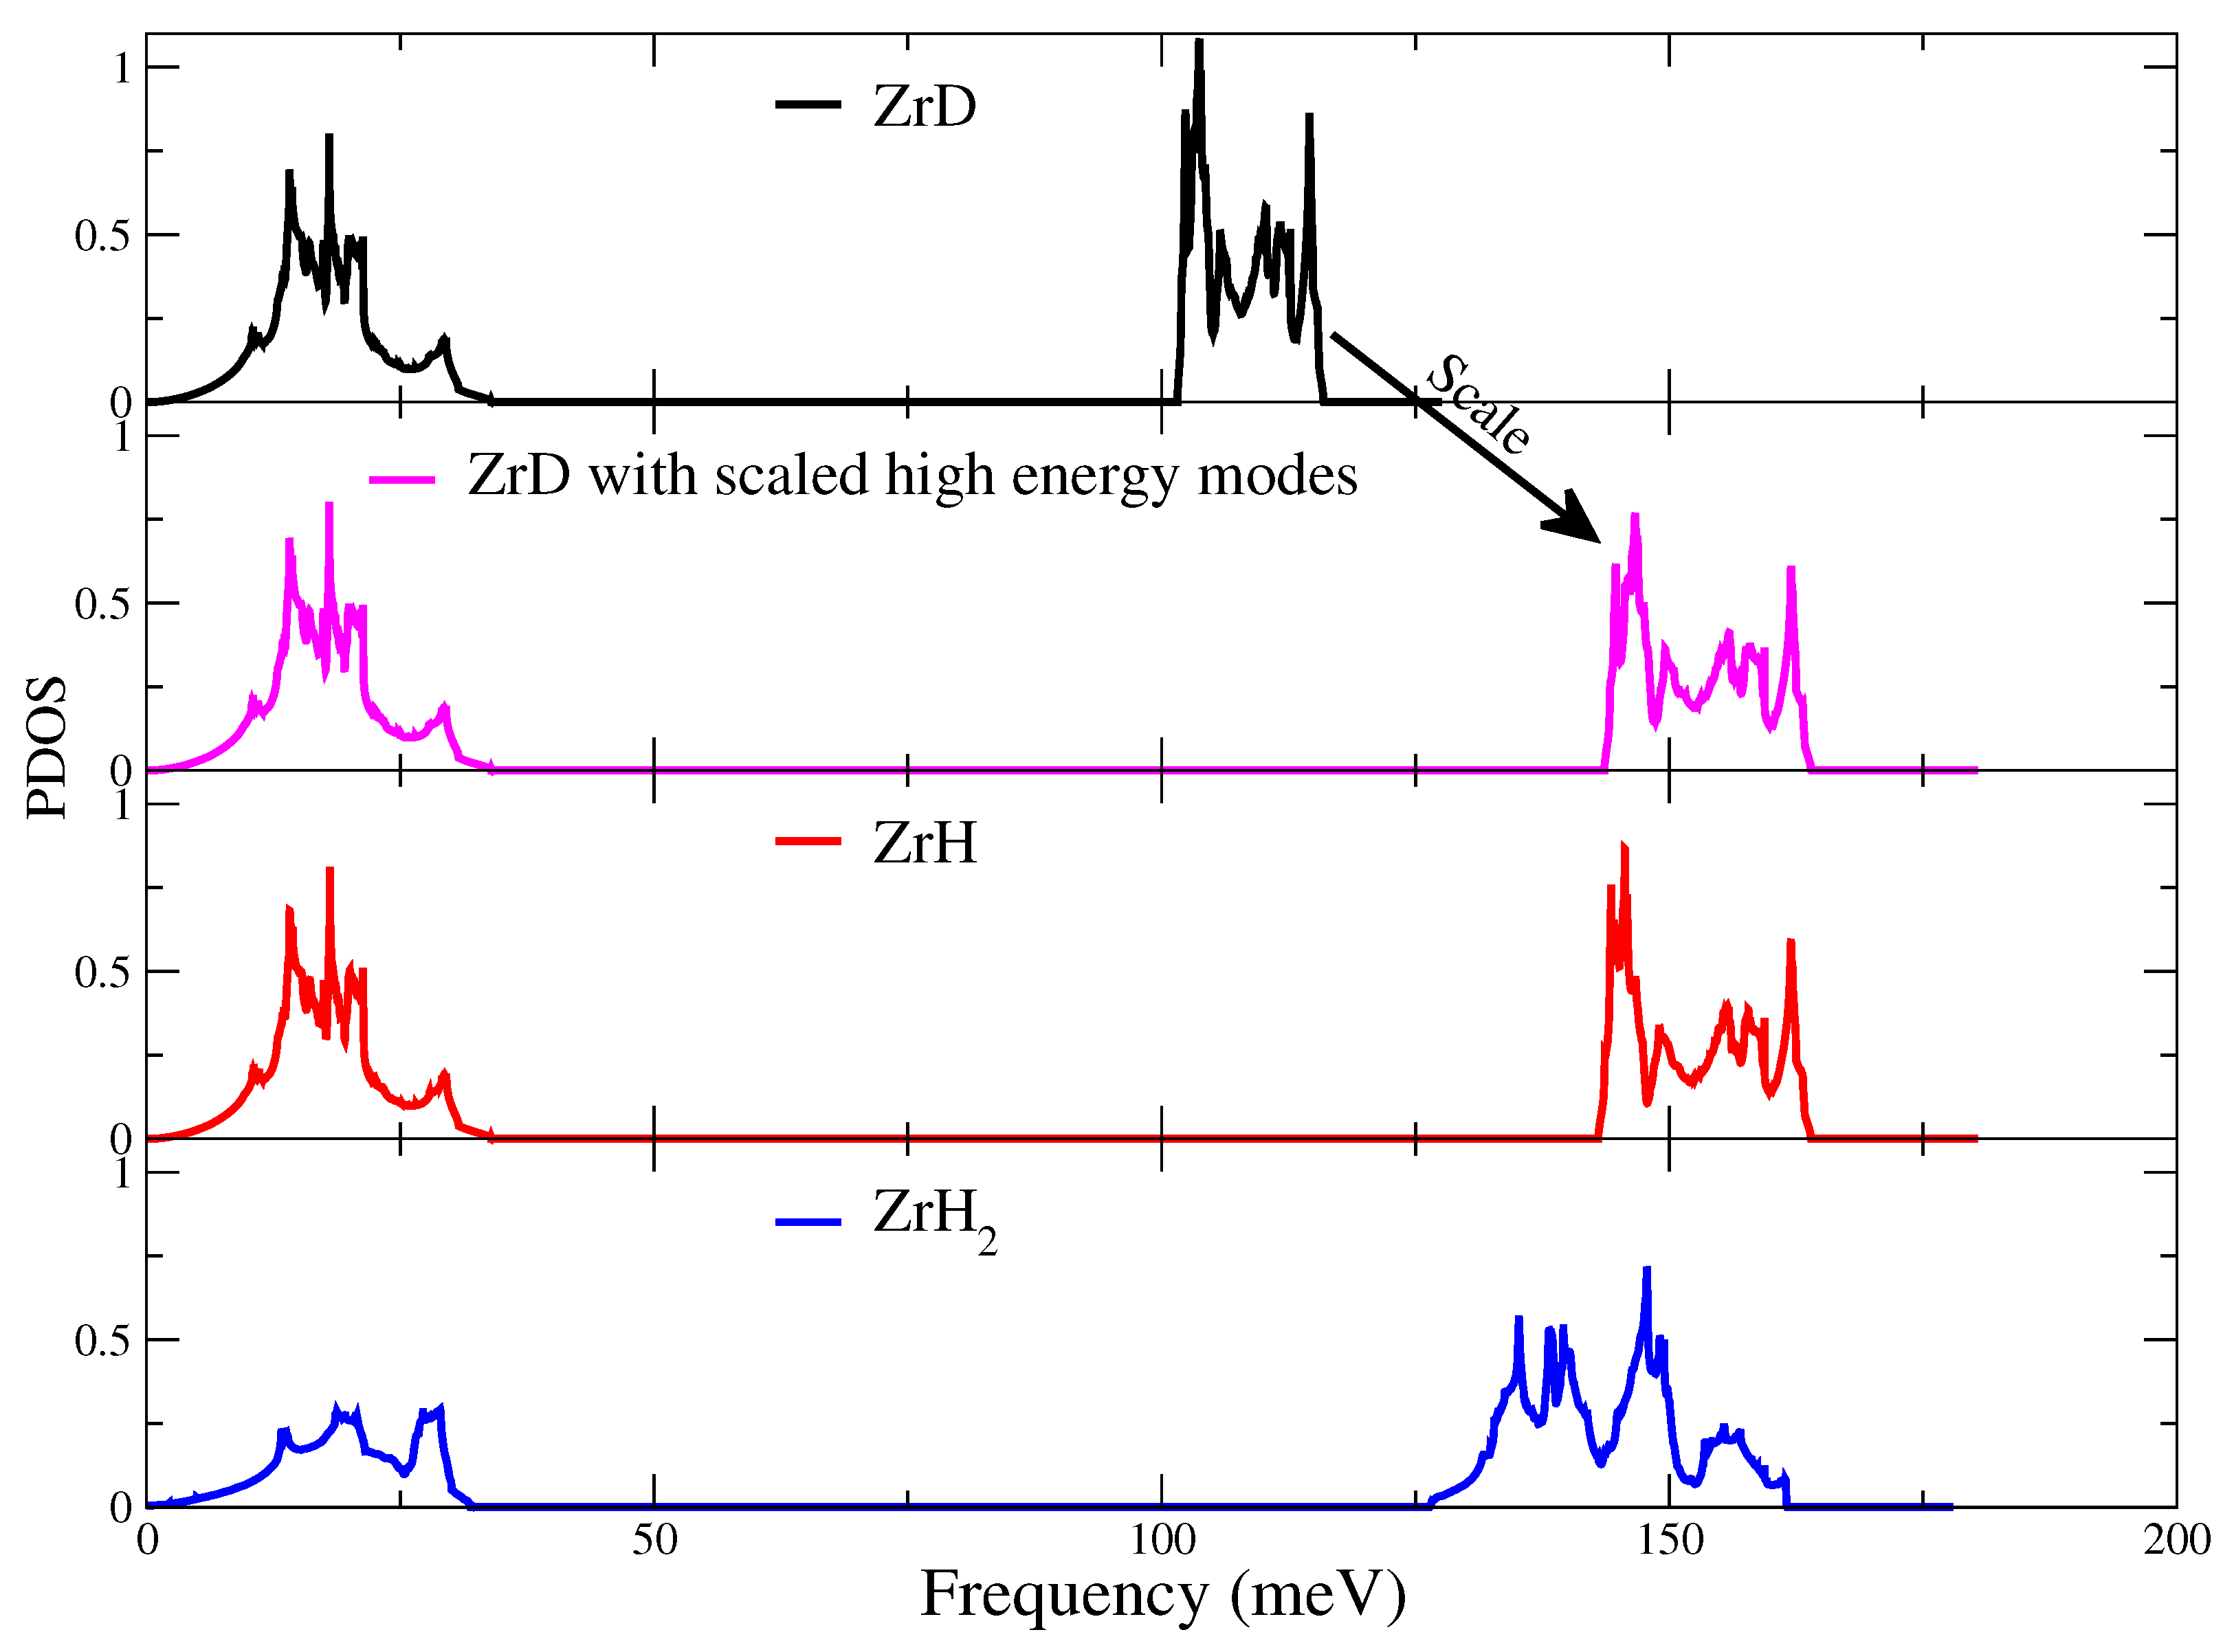
3.1. Atomic Structures and Phonon Properties of ZrHx

The crystal unit cells of ZrHx and their calculated phonon bands are shown in Figure 1. The lattice vectors (a, b, c) used in our simulations for ϵ-ZrH2 [34] and γ-ZrH(γ-ZrD) [13] were (4.97728, 4.97728, 4.449) and (4.549, 4.618, 4.965) in Å, respectively. Since phonon dispersions (especially optical modes) are sensitive to lattice parameters, no geometry optimization was performed on the lattice vectors of these three materials to better compare simulations with experiments. As is seen in Figure 1, large phonon band gaps exist between high energy modes and low energy modes for all materials.
Figure 2 plots the experimental INS spectra for ZrHx, and Figure 3 shows the simulated INS spectra for ϵ-ZrH2 with RMG and VASP along with the VISION data. Within the frequency region below 1000 meV, multiple peaks representing phonon excitations are observed in all materials. Focusing on ϵ-ZrH2, the peaks with energies lower than 30 meV correspond to lattice modes of heavy Zr atoms in the crystals. The peaks at around 150 meV correspond to single phonon excitations of H atoms from the ground state to their first excited states (fundamental excitations). All higher energy peaks are overtones and combinations, corresponding to multi-phonon events from the ground state to the excited states of higher orders than the first.
The INS spectra simulated from VASP and RMG for ϵ-ZrH2 show excellent agreement with the experimental data below 200 meV (see Figure 3). However, discrepancies can be observed between the experimental data and the simulated INS spectra in the higher energy range. In the region of overtone peaks, features at around 260, 390, and 510 meV exist in the experimental data, and cannot be observed in the calculation. This behavior suggests that the harmonic approximation, which in this case is good for the fundamental peaks, becomes inaccurate for higher energy excitations; thus, anharmonic effects need to be taken into consideration. It should be noted that for γ-ZrH and γ-ZrD, similar split peaks were also observed in the experimental data (see Figure 2).

3.2. Harmonic Approximation: Frozen Phonon Method

Frozen phonon calculations [38] for phonon modes at the gamma point were performed to explore the hydrogen potential energy profiles in ϵ-ZrH2 as it usually captures the anharmonicity (if any). The potential energy profiles were sampled along the phonon polarization vectors, and the RMS displacements of phonons ( < u 2 > 0.5 ) were chosen to be up to 0.58 Å (corresponding to deformation potential energy at ∼1 eV). Low-frequency lattice modes (smaller than 30 meV) were not included in our frozen phonon calculations.
Our results show that the sampled potentials can be well fitted to parabolas, leading us to conclude that no anharmonic effects can be probed with the frozen phonon method, presumably due to the anharmonicity falls outside the scope of potential energy profiles in polarization directions at the gamma point. To gain more insight into the origin of anharmonicity, we have conducted potential energy surface calculations as presented below.

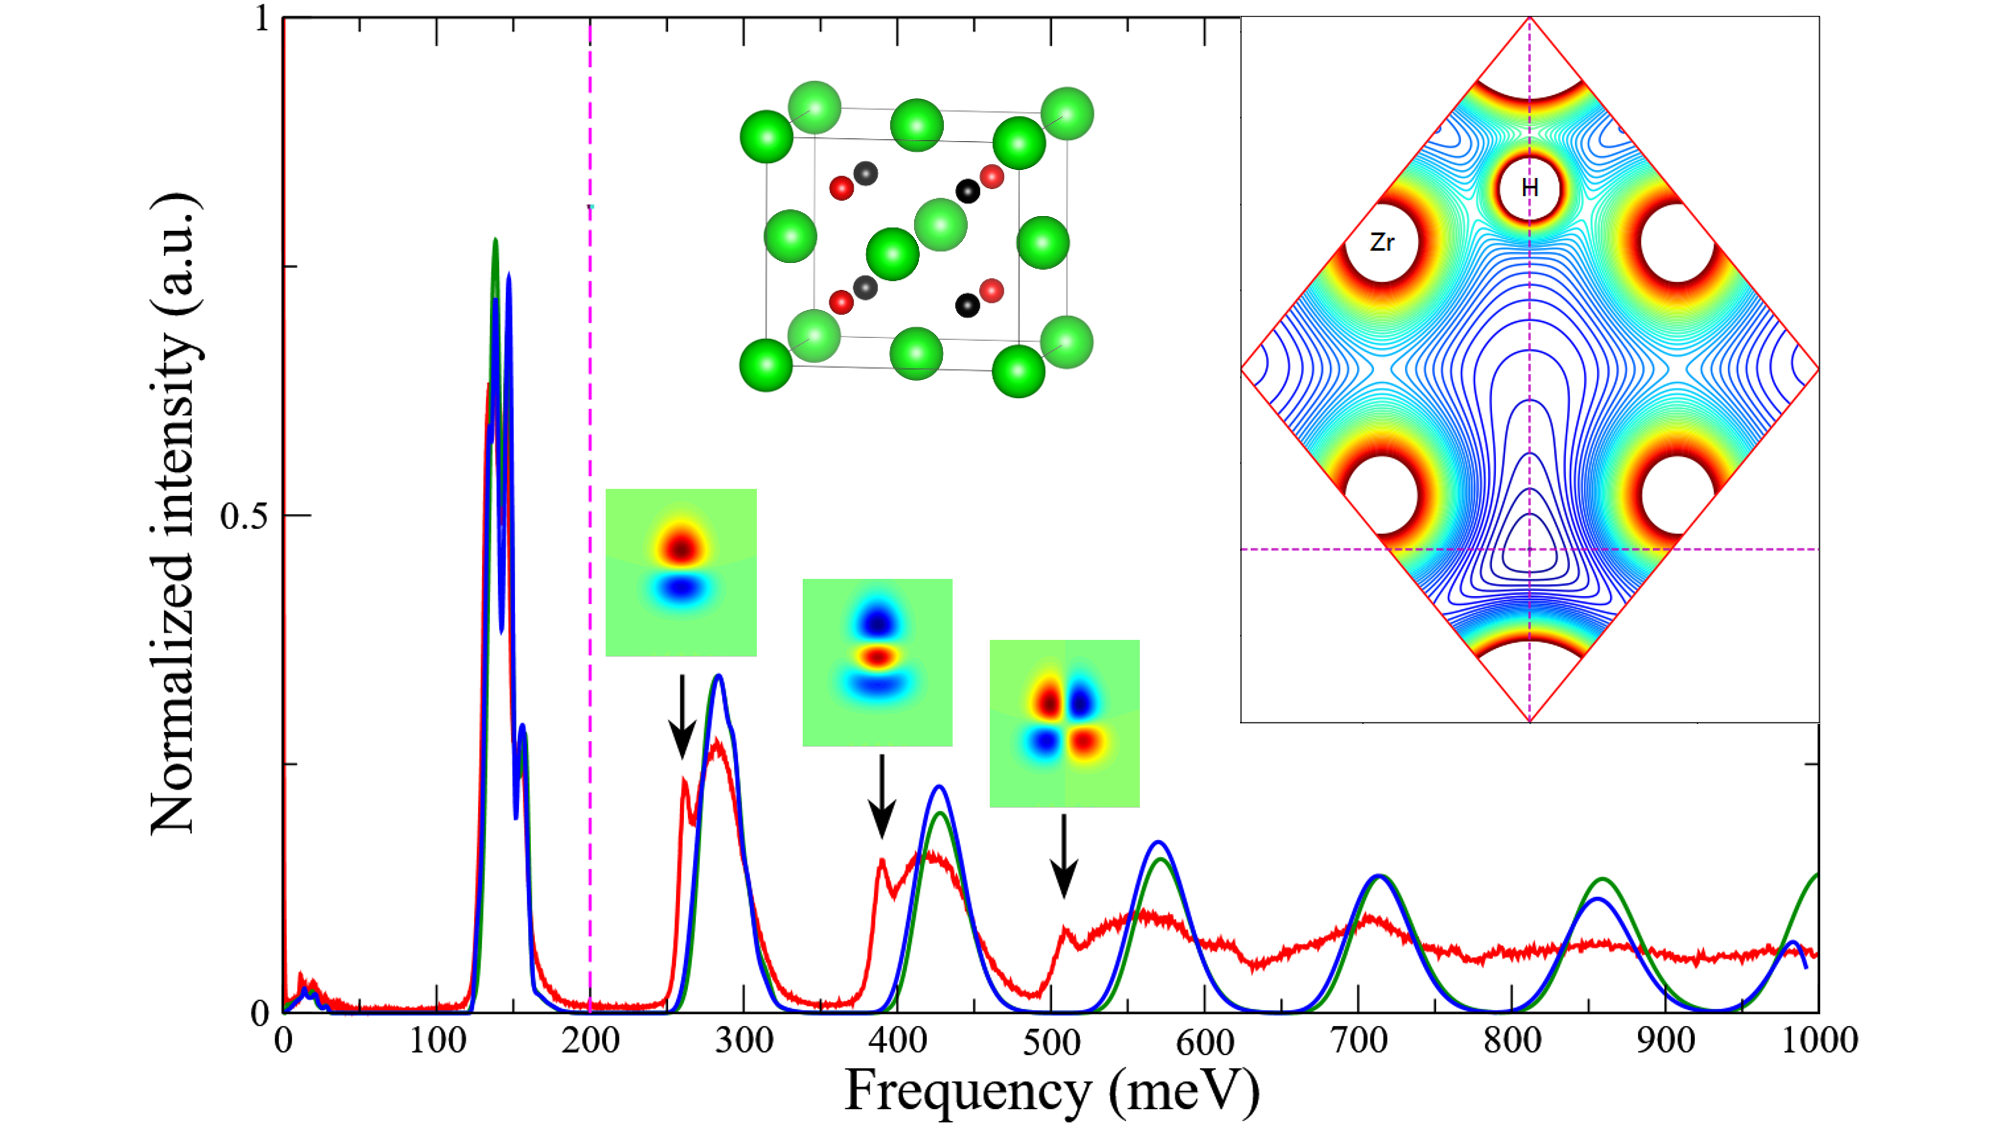
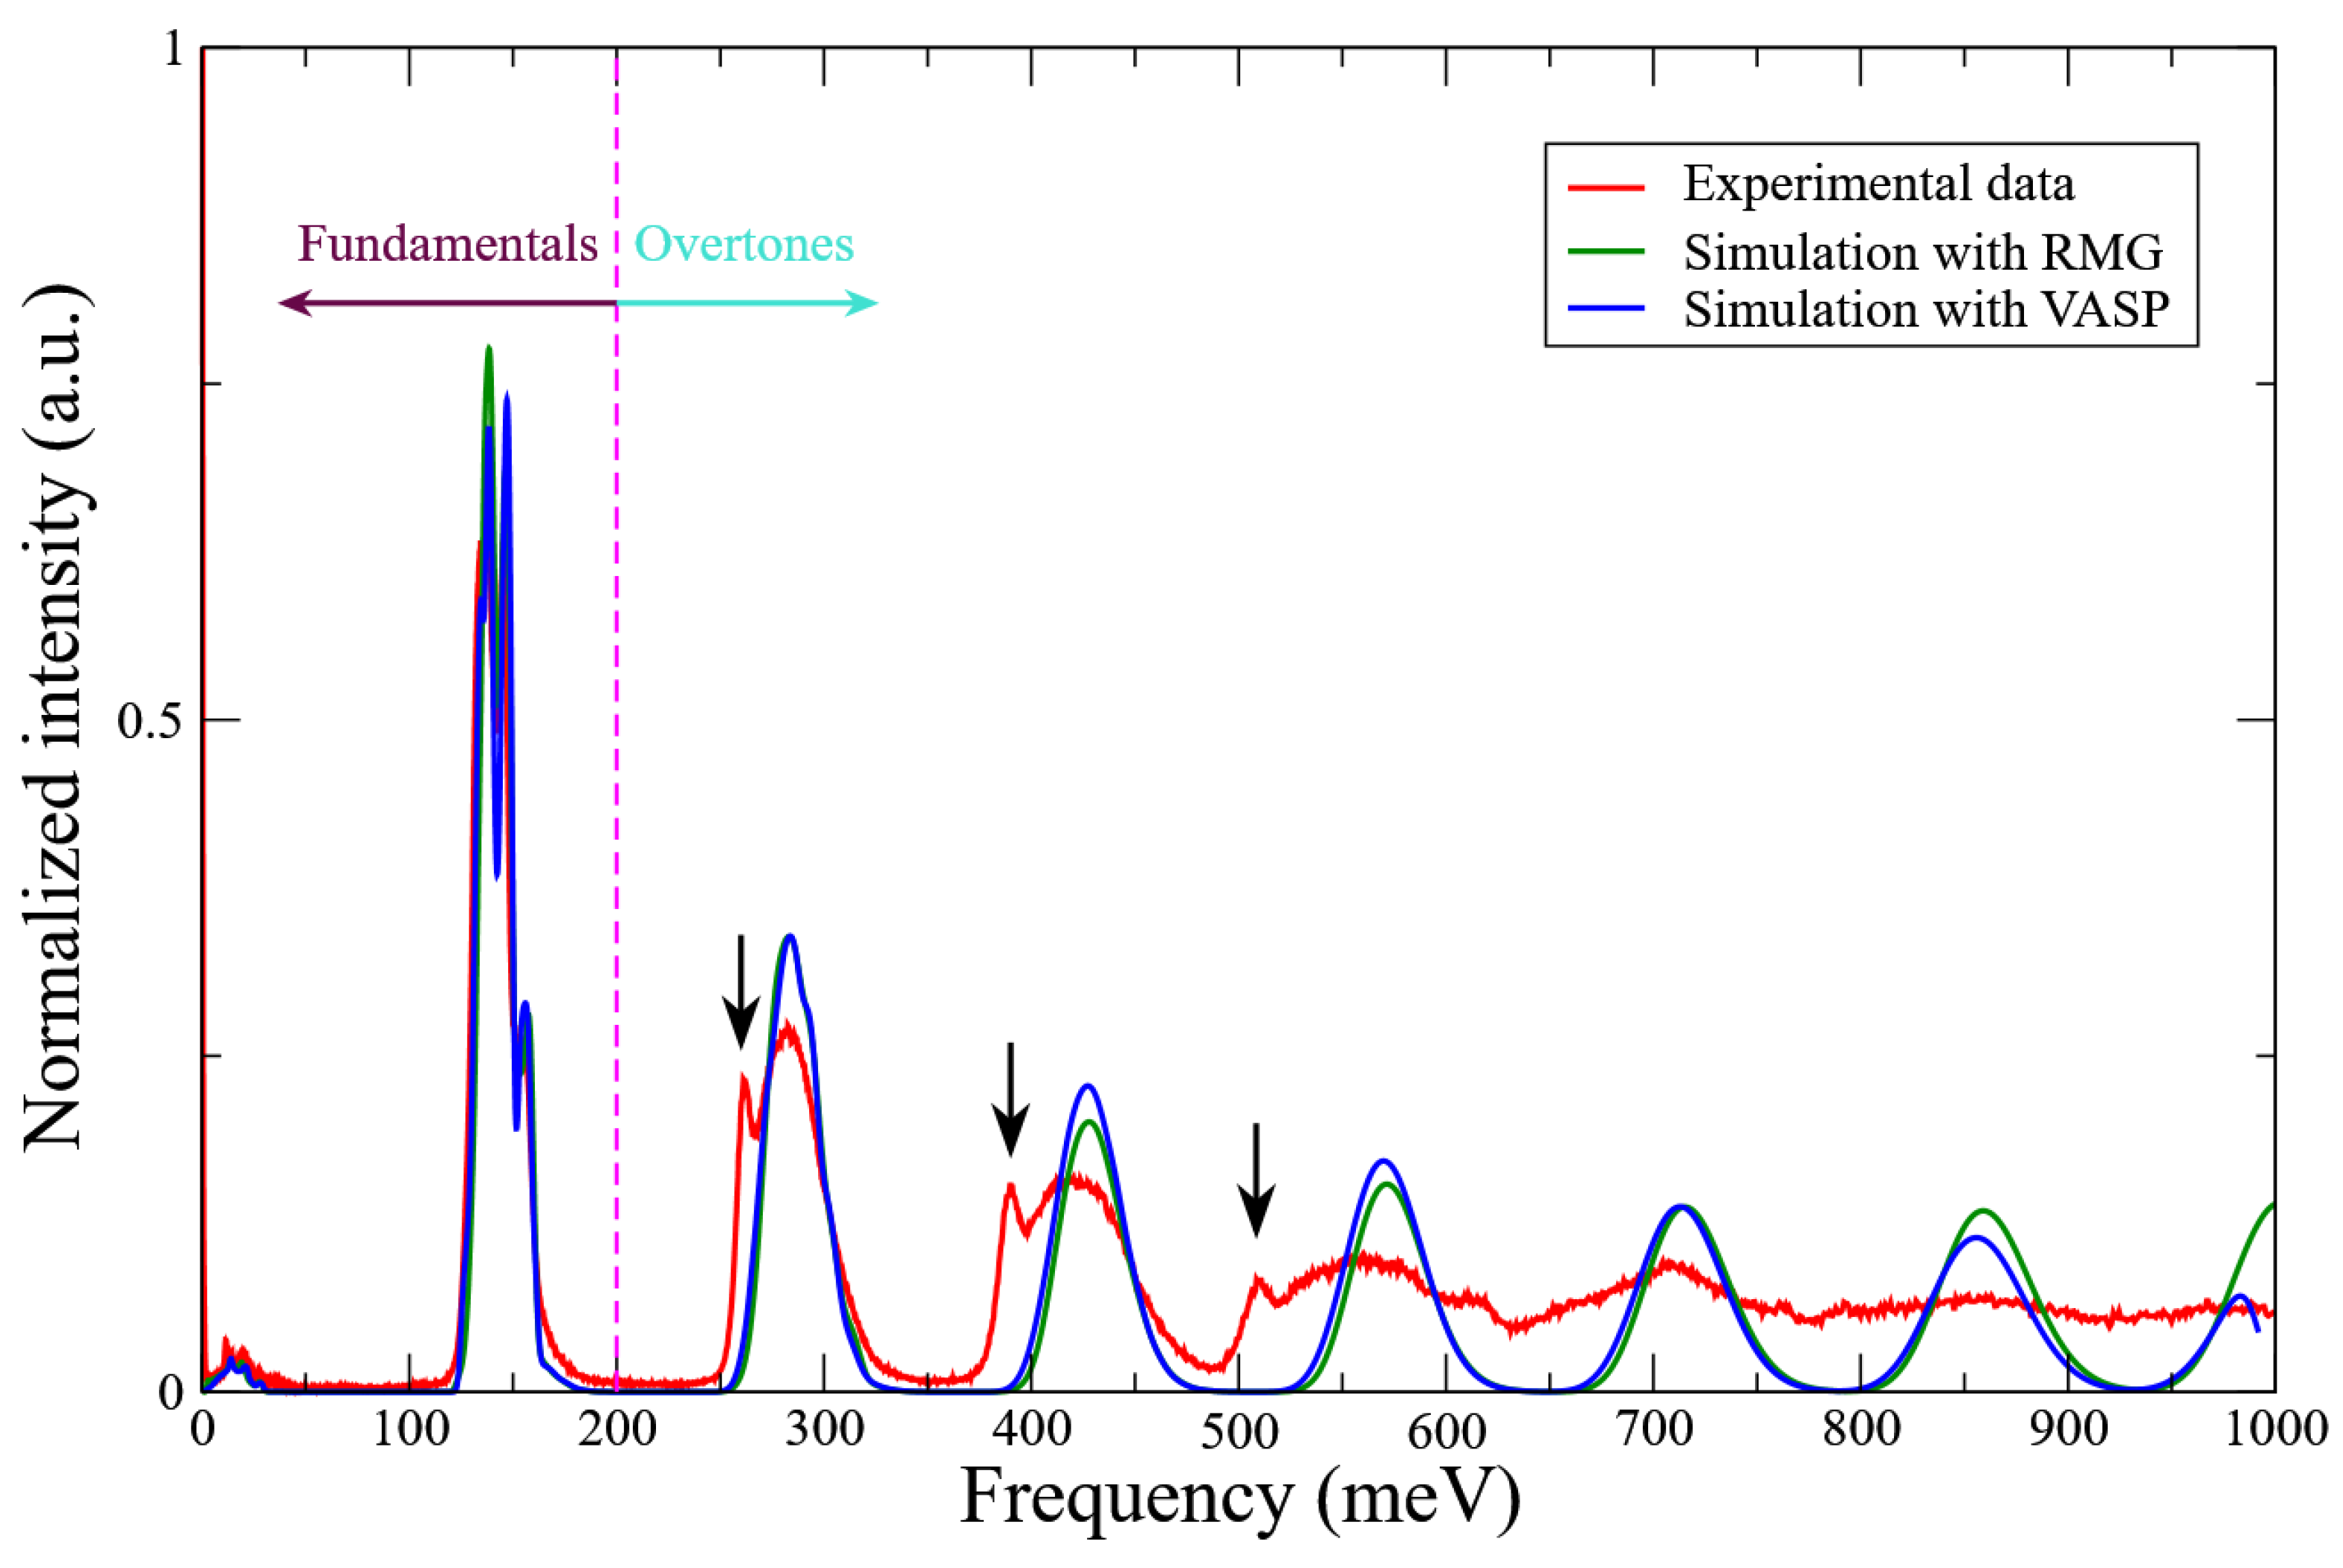
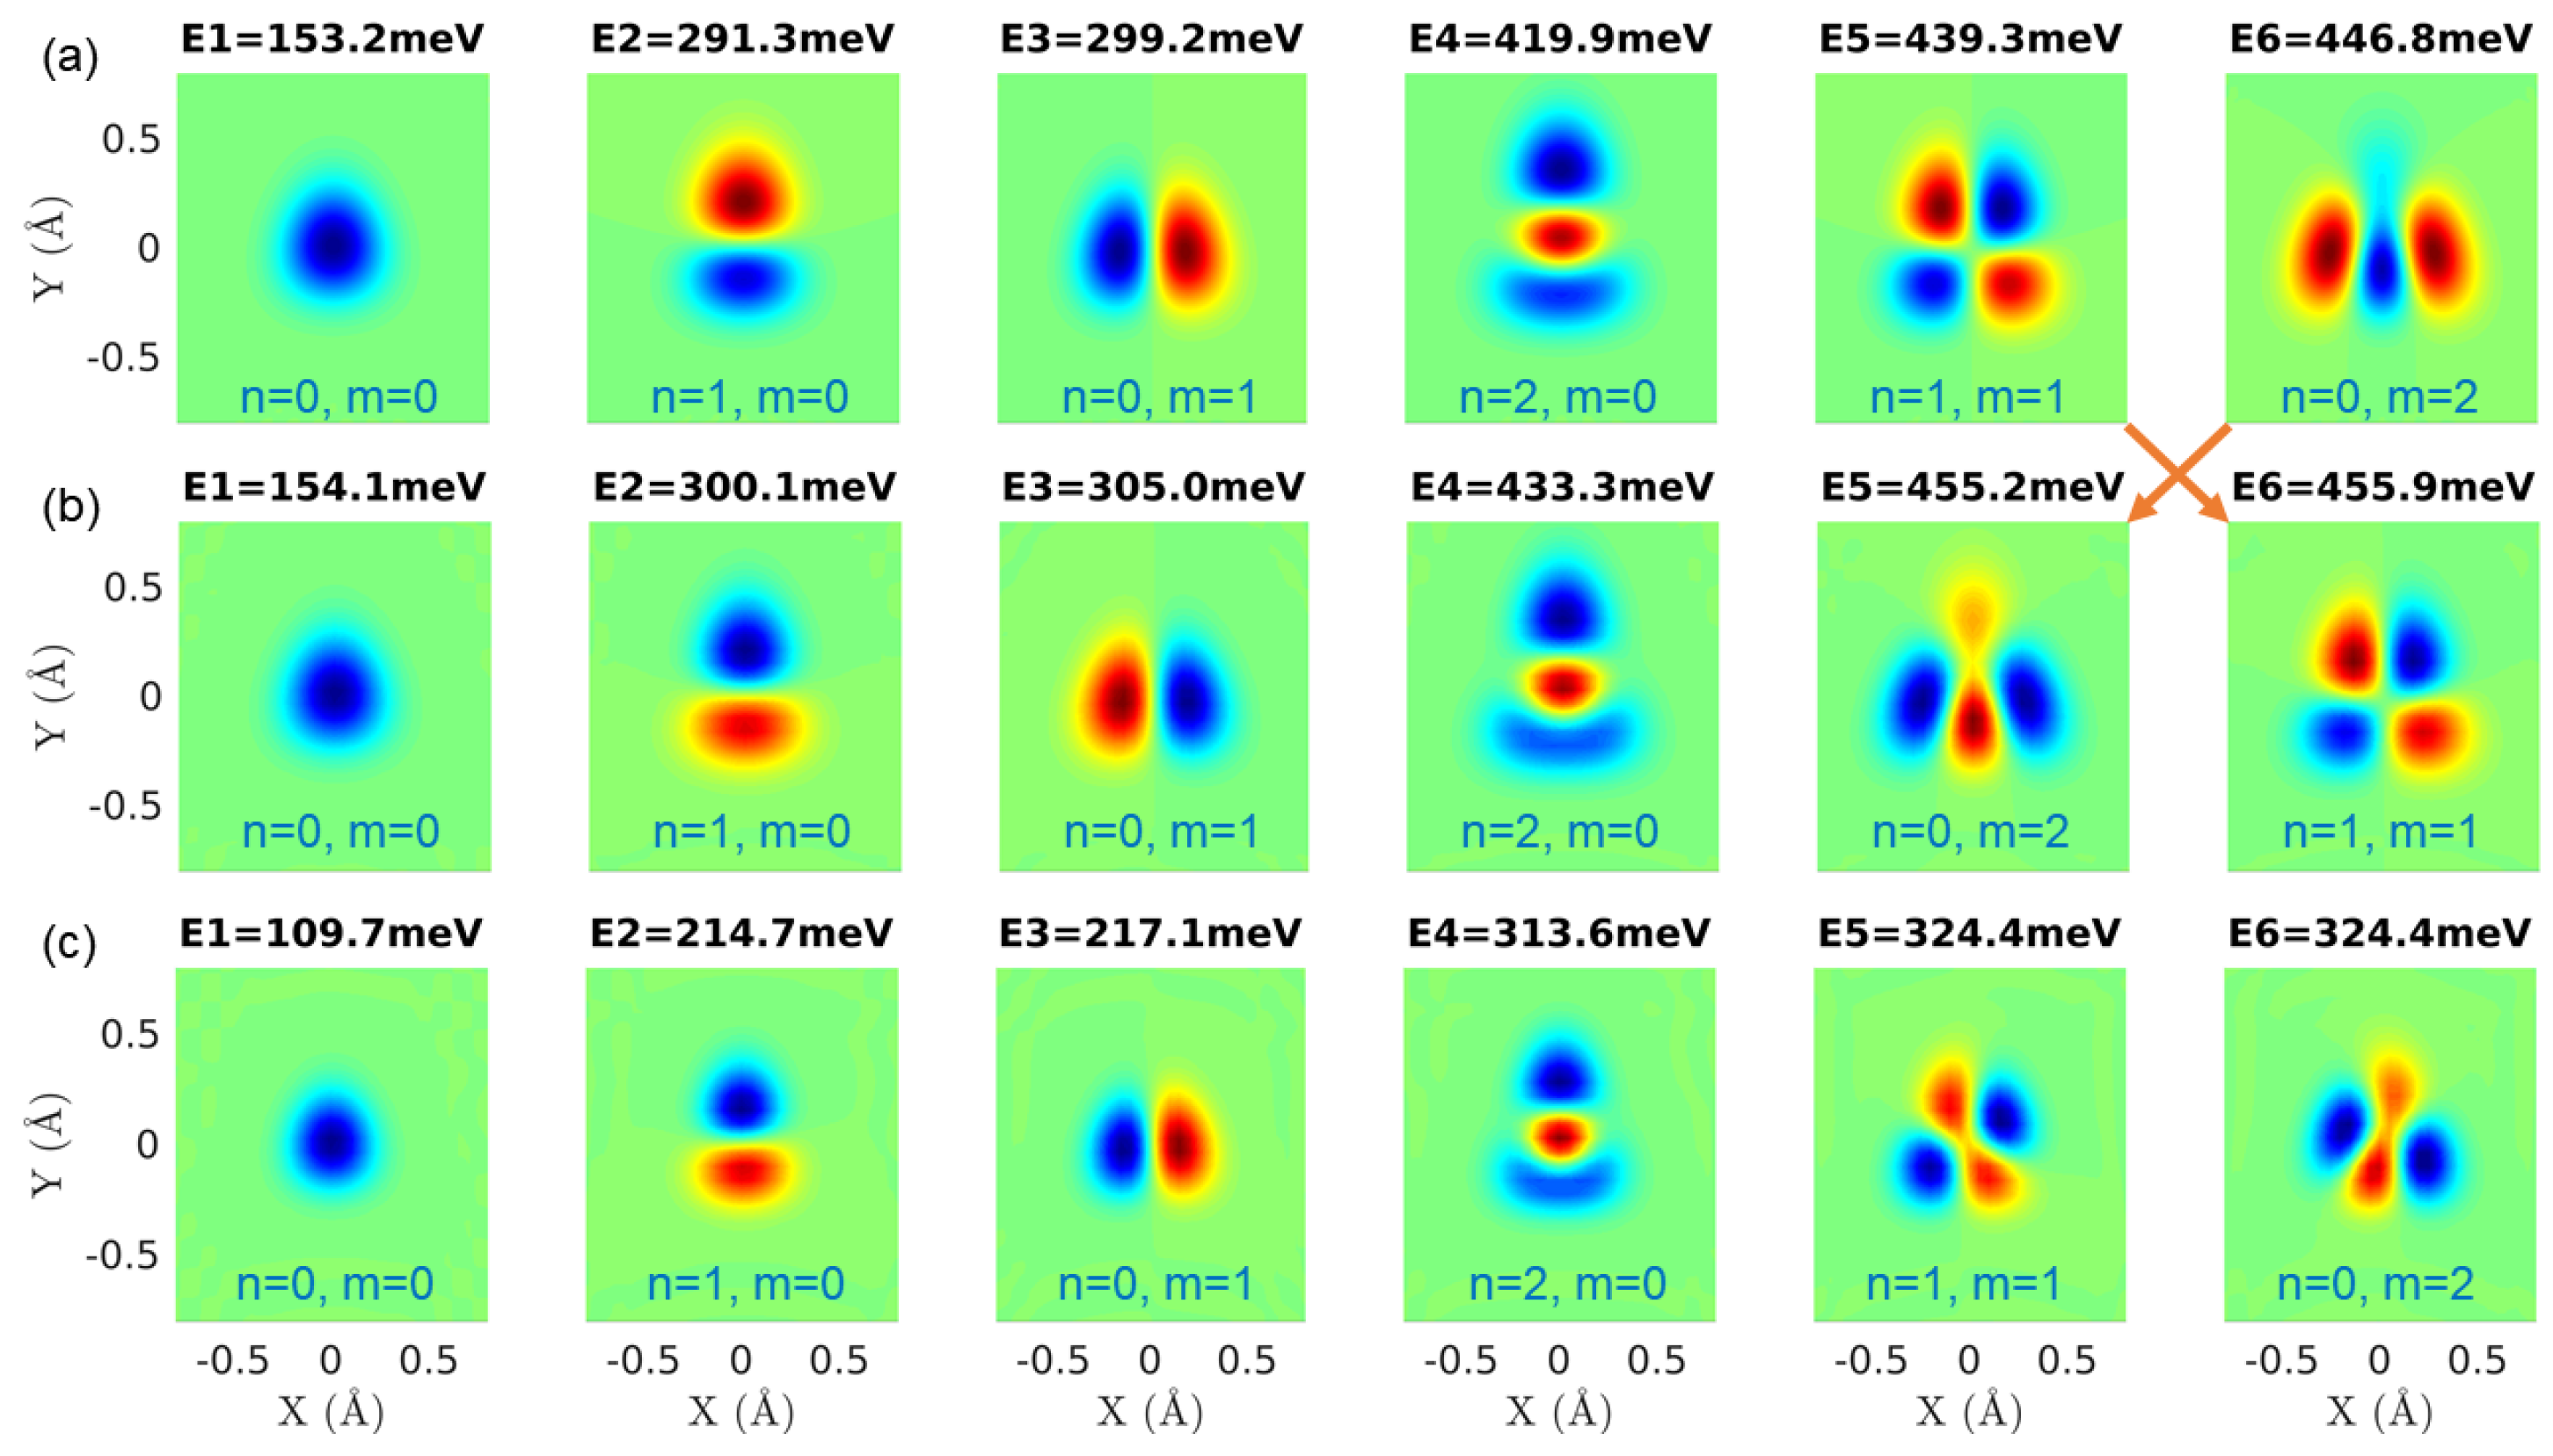
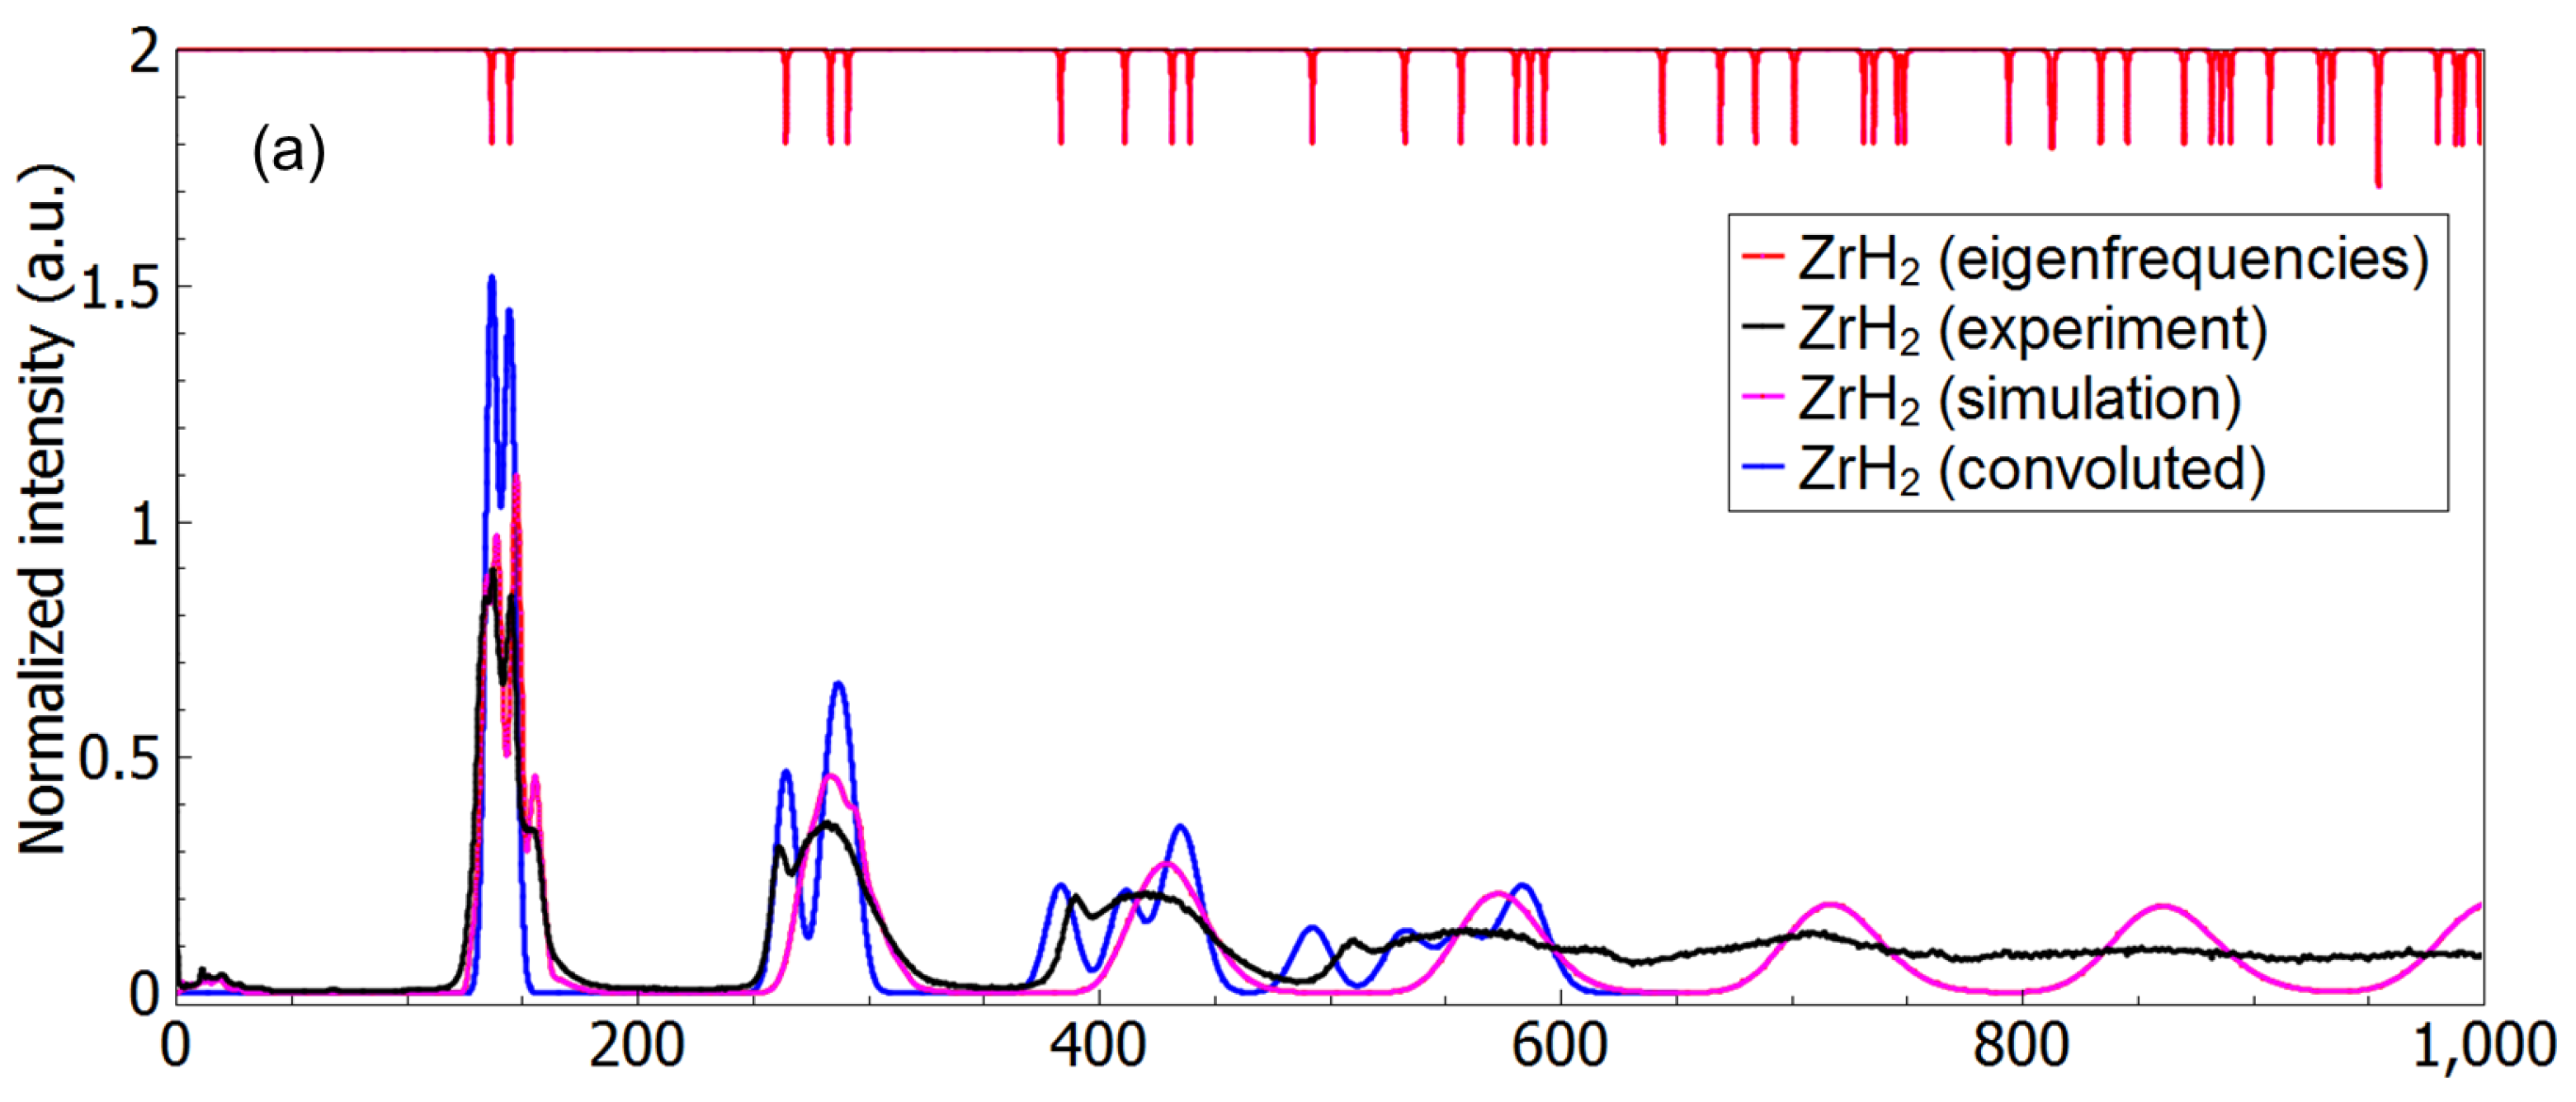
3.3. A Direct Method: Mapping Eigenfrequencies from Schrödinger Equations with the Simulated INS Spectra

To obtain accurate phonon frequencies, ideally one should treat the collective motion of nuclei in a full quantum approach, i.e., solving the many-body nuclear Schrödinger equation for vibrational excitations. However, this approach is computationally prohibitive: the Schrödinger equation may be easily solved for a single particle, but becomes impossible to solve as the system size significantly increases. In this case, we made three approximations to simplify the complex many-body problem to a single-particle problem.
First, we separate vibrations of H(D) atoms from Zr atoms. The justifications of this separation come from (1) PDOS comparison between γ-ZrH and γ-ZrD with scaled high-energy modes as shown in Figure 4. On the basis that the low-energy modes of γ-ZrD and γ-ZrH are almost identical (the theoretical ratio is 1.005 if Zr and H(D) move in-phase), while the high-energy modes differ by a scaling factor of 2 (which is close to the frequency ratio ω H / ω D = m D / m H = 1.4136 if we assume the H(D) and the Zr are almost independent harmonic oscillators), we conclude that Zr and H atoms are almost independent oscillators. This is consistent with the conclusion drawn by Olsson et al. in ϵ-ZrH2 and γ-ZrD2 [39]; (2) the charge densities of Zr and H in ϵ-ZrH2 have near-spherical distribution with slight deformations, which indicates the Zr-H bonds and their couplings are weak [40]; (3) the mean square displacement (MSD) of Zr is much smaller than H(D)’s, as calculated by [28] at 0 K:
u l 2 = 1 3 · 2.09 m l q w q ν | ϵ l ( q , ν ) | 2 ω q , ν
where l is the index of atom, ν is the index of phonon mode, q is the index of point in BZ, m l is lth atom’s mass in atomic units, ω q , ν is the vibrational frequency in the unit of meV, ϵ l ( q , ν ) is lth atom’s polarization vector of the ν th mode at point q, and w q is the normalized weight at point q. The prefactor of 1/3 arises from the powder sample averaging [28]. The MSD was calculated within the low-energy range (<60 meV, excluding the lowest three acoustic modes) and the high-energy range (>60 meV). As can be seen from the MSD calculation results listed in Table 1, in the low-energy range, Zr and H(D) atoms move with comparable amplitudes. However, in the high-energy range, the larger ratio of M S D ( H ) / M S D ( Z r ) indicates that H(D) atoms are moving with larger amplitudes than Zr atoms at the same frequency. Thus, from the above three results, it can be concluded that the vibrations of H(D) atoms can be viewed as fast degrees of freedom that are decoupled from the dynamics of Zr atoms.
Second, to simplify the problem, instead of looking into all H(D) atoms, we focus on a single H(D) atom, of which the Hamiltonian is
H = 2 2 m 2 + V ( r )
where 2 is the Laplacian operator on the H(D) atom’s wavefunctions, and V ( r ) is the potential energy at position r (a set of V ( r ) constitutes the potential energy surface, PES). In our calculations, V ( r ) are the DFT sampled potential energies of the H(D) atom with subtraction of its energy at the equilibrium position r 0 : V ( r ) = E D F T ( r ) E D F T ( r 0 ) . By checking the values of the MSD in Table 1, it can be seen that the H(D) atom is mostly vibrating within a sphere of radius 0.12 Å, which is much smaller (∼5%) than the nearest H-H distance (2.24 Å). In fact, interactions of the nearest H atoms are much weaker than the H-Zr interactions—the latter dominates the local potential energy profile and thus the anharmonic behavior of H.
Third, for the sake of simplicity and to present a simple yet robust explanation of the anharmonic effects, we use a 2D representation of V ( r ) and thus H in Equation (2). It is important to highlight that we do not intend to provide an entirely accurate solution to the anharmonic problem in ZrHx, but instead, we want to demonstrate the nature of anharmonicity of these systems in a qualitative and semi-quantitative way. The exact 3D many-body problem (for all H(D) atoms) is not only computationally prohibitive but also unnecessarily complicated; however, with the single-particle approximation in 2D, one can easily explore the anharmonicity by visualizing the potential energy surface, and more importantly, solve the single-particle Schrödinger equation and directly compare the result with experiments. Moreover, considering the orthogonality of basis vectors and small displacements of the H(D) atom, it is reasonable to approximate the 3D problem with 2D representations. Even though one may expect a qualitative explanation at best taking the above approximations into account, surprisingly, the results we obtained can semi-quantitatively describe the experiments, and thus validate the approximations made here, as will be further discussed below.
After checking the structure of ϵ-ZrH2, we decided to sample the (112) plane (shifted so that the equilibrium position of the H atom was included in the plane) as this is one of the planes with the highest symmetry, and involves the most representative shapes of hydrogen PES in ϵ-ZrH2 in 2D (it contains harmonic potentials in some directions and highly anharmonic potentials in others). The plane was sampled equidistantly with a mesh grid spacing around 0.005 Å (100 points per direction, 10,000 mesh grids totally). Based on the sampled grid, a finer grid with a dimension of 1200 × 1600 = 1,920,000 was generated using a linear interpolation method to build the Hamiltonian matrix according to Equation (2). A similar scheme has been applied to γ-ZrH and γ-ZrD. Figure 5 presents a view of the plane and the sampled PES.
By numerically solving the corresponding single-particle Schrödinger equation of the H(D) atom, we obtained the eigenfrequencies and wavefunctions, which represent the energy states of the atom, that can be displayed as in Figure 6. The eigenfrequencies of three materials have also been plotted in Figure S2 [41] in the Supplementary Material, and comparisons between eigenfrequencies and experimental spectra can be found in Figure 7. It is particularly important to point out that the eigenfrequencies here are indeed the numerically solved eigenfrequencies subtracted by the ground state frequency, to be comparable with the experimental INS spectra, which are measuring the excitations of phonons from the ground state to high energy states. It can be seen that the anharmonic peak positions in the experimental spectra can be reasonably described by eigenfrequencies for the first three overtones (higher-order overtones in experiments are indistinguishable). For example, in the case of ϵ-ZrH2 in Figure 7, the eigenfrequencies in red lines at around 264, 384, and 493 meV are below the harmonic multi-phonon bands in magenta lines, and thus correspond to the anharmonic peaks in experimental spectra in black lines. The eigenfrequency at 264 meV agrees well with the experimental value, and the eigenfrequencies at 384 and 493 meV have around 6 and 17 meV differences with the experimental values, respectively. In the cases of γ-ZrH and γ-ZrD, conclusions can be made that the agreements at low energies are pretty good (except for the ∼10 meV difference at around 280 meV in γ-ZrH). It must also be mentioned that in Figure 7c, the ZrD sample was contaminated with H, and thus introduced the extra low-frequency peaks, e.g., at around 140 meV.
The eigenfrequencies from the Schrödinger equation, which represent phonon properties at the gamma point in the reciprocal space, were then convoluted with the scaled energy resolution function of neutron spectrometers in order to better compare the calculations with the experimental spectrum:
S c o n v o l u t e d ( E ) = δ ( E e i g e n ) × σ ( E )
where σ ( E ) is the spectrometer resolution function, E is the energy transfer, E e i g e n are eigenfrequencies, and S c o n v o l u t e d ( E ) is the final convoluted spectrum incorporating anharmonicity from PES. For the indirect geometry instruments (VISION and TFXA) used in our experiments, the energy-dependent resolution function can be approximated by σ ( E ) = 0.3099 + 6.1988 × 10 4 E + 1.2398 × 10 8 E 2 , and both σ ( E ) and E are in the unit of meV. The convoluted results of ZrHx are shown in Figure 8.
It can be seen that the convoluted spectra for all materials show reasonable agreement with the experimental INS spectra. Specifically, we can see significant improvements in the prediction of anharmonic peak positions, as both the experimental and the convoluted spectra show similar peaks splitting below the multi-phonon bands. Although there are still some noticeable discrepancies, such as different broadening and intensities of the convoluted spectra compared to the experimental spectra, we think this accuracy is a considerable achievement, given the fact that three prior approximations were made. Moreover, we expect that the broadening and intensity discrepancies can be systematically decreased if we incorporate eigenfrequencies at other k-points than the gamma point into calculations, which, however, is beyond the scope of this work.
To mimic the contamination of the γ-ZrD sample with H in the experiments, H atoms of concentration 3.125 at.% (1 in 32 D atoms in the simulation box was substituted by an H atom) were also added to the pure γ-ZrD in our simulations. The calculation successfully reproduces the splitting of the hydrogen local mode peak at ∼150 meV into two peaks (double and single degenerate, according to the symmetry of the H position), and the absence of dispersion due to disorder of the H atoms in the lattice (random defects). Note that the relative higher intensity of low-energy modes in experimental γ-ZrD rather than simulated low-energy modes of γ-ZrD0.96875H0.03125 is mostly due to contributed low-energy modes by α-Zr [13].
Note that the exact knowledge of vibrational dynamics of different Zr-H materials is important not only from the fundamental physics and chemistry points of view, but also for practical applications in the nuclear field such as critical safety studies. Therefore the obtained results on the dynamics of γ-ZrHx materials in the current study, which describe the anharmonicity of the INS spectra at energies above 200 meV, can be very useful for criticality and neutron transport simulations of the reactors containing Zr-H materials at anticipated operational temperatures up to 1200 C (at which the first overtone level in Zr-H is ∼10% populated).

4. Conclusions

The anharmonicity phenomena in ϵ-ZrH2, γ-ZrH, and γ-ZrD have been identified and thoroughly studied with DFT and INS techniques. The anharmonicity is not apparent on the fundamental vibrations, and it becomes evident at higher energies. This effect is not appreciable around room temperature. However, γ-ZrHx has been considered as a neutron moderator material for nuclear reactors; in this case, the anharmonic effects cannot be ignored since neutrons with high energies will scatter from the hydrogen atoms and will experience deviations from the scattering kernel predictions based on the harmonic approximation. While the harmonic model failed to explain the split peaks shown in the experimental INS spectra, results of eigenfrequencies of the 2D Schrödinger equation convoluted with instrument resolution functions give a good description of the anharmonicity in these materials. One can see obvious anharmonic peaks beyond the harmonic overtones in the spectra, which are in qualitative agreement with the experimental data. The method proposed here, by combining DFT and solutions of the Schrödinger equation compared to INS, is a possible way to explain anharmonicity in materials beyond the harmonic regime. This work could shed light on further vibrational studies in anharmonic systems like TiHx, PdHx, and other metal-hydrogen systems.

Supplementary Materials

The following are available online at https://0-www-mdpi-com.brum.beds.ac.uk/article/10.3390/inorganics9050029/s1. Figure S1: First fifteen eigenfrequencies and wavefunctions of H(D) for (a) (112) plane of ϵ -ZrH 2 , (b) (−112) plane of ZrH, and (c) (−112) plane of ZrD. Figure S2: Comparisons of eigenfrequencies by solving Schrödinger equations for ZrH x in the energy range below 1000 meV. Figure S3: Unnormalized probability distributions of H atom in ZrH 2 in (112) plane along x (blue) and y (red) directions, where the dashed lines indicate full width at half maximum (FWHM).

Author Contributions

Conceptualization, J.Z., Y.C., A.I.K., J.B., W.L. and A.J.R.-C.; methodology, J.Z., Y.C., A.I.K. and A.J.R.-C.; software, J.Z.; writing—original draft preparation, J.Z.; writing—review and editing, J.Z., Y.C., A.I.K., J.B., W.L. and A.J.R.-C.; supervision, J.B., W.L. and A.J.R.-C. All authors have read and agreed to the published version of the manuscript.

Funding

This work was supported through Oak Ridge National Laboratory’s Graduate Opportunity (Go!) Program in the Neutron Scattering Division, ORNL. Neutron scattering experiments were conducted at the VISION beamline at ORNL’s Spallation Neutron Source, which is supported by the Scientific User Facilities Division, Office of Basic Energy Sciences (BES), U.S. Department of Energy (DOE), under Contract No. DE-AC0500OR22725 with UT Battelle, LLC. The computing resources were made available through the VirtuES and the ICEMAN projects, funded by the Laboratory Directed Research and Development program at ORNL.

Institutional Review Board Statement

Not applicable.

Informed Consent Statement

Not applicable.

Data Availability Statement

Not applicable.

Acknowledgments

J.Z. thanks Oak Ridge National Laboratory for the Go! Program and Emil Briggs for the discussion about DFT calculations. The authors thank Oak Ridge National Laboratory for computational facilities and neutron experiments.

Conflicts of Interest

The authors declare no conflict of interest.

Abbreviations

The following abbreviations are used in this manuscript:
DFTDensity functional theory
MDMolecular dynamics
INSInelastic neutron scattering
PDOSPhonon density of states
VACFVelocity autocorrelation function
TDEPTemperature-dependent effective potential
MSDMean square displacement
PESPotential energy surface

References

  1. Bickel, P.; Berlincourt, T. Electrical properties of hydrides and deuterides of zirconium. Phys. Rev. B 1970, 2, 4807. [Google Scholar] [CrossRef]
  2. Holliger, L.; Legris, A.; Besson, R. Hexagonal-based ordered phases in H-Zr. Phys. Rev. B 2009, 80, 094111. [Google Scholar] [CrossRef]
  3. Zuzek, E.; Abriata, J.; San-Martin, A.; Manchester, F. The H-Zr (hydrogen-zirconium) system. Bull. Alloy. Phase Diagrams 1990, 11, 385–395. [Google Scholar] [CrossRef]
  4. Setoyama, D.; Yamanaka, S. Phase diagram of Zr–O–H ternary system. J. Alloys Compd. 2004, 370, 144–148. [Google Scholar] [CrossRef]
  5. Dupin, N.; Ansara, I.; Servant, C.; Toffolon, C.; Lemaignan, C.; Brachet, J. A thermodynamic database for zirconium alloys. J. Nucl. Mater. 1999, 275, 287–295. [Google Scholar] [CrossRef]
  6. Zhao, Z.; Morniroli, J.P.; Legris, A.; Ambard, A.; Khin, Y.; Legras, L.; Blat-Yrieix, M. Identification and characterization of a new zirconium hydride. J. Microsc. 2008, 232, 410–421. [Google Scholar] [CrossRef]
  7. Weck, P.F.; Kim, E.; Tikare, V.; Mitchell, J.A. Mechanical properties of zirconium alloys and zirconium hydrides predicted from density functional perturbation theory. Dalton Trans. 2015, 44, 18769–18779. [Google Scholar] [CrossRef]
  8. Andersen, H.C. Molecular dynamics simulations at constant pressure and/or temperature. J. Chem. Phys. 1980, 72, 2384–2393. [Google Scholar] [CrossRef] [Green Version]
  9. Yamanaka, S.; Yoshioka, K.; Uno, M.; Katsura, M.; Anada, H.; Matsuda, T.; Kobayashi, S. Thermal and mechanical properties of zirconium hydride. J. Alloys Compd. 1999, 293, 23–29. [Google Scholar] [CrossRef]
  10. Ackland, G. Embrittlement and the bistable crystal structure of zirconium hydride. Phys. Rev. Lett. 1998, 80, 2233. [Google Scholar] [CrossRef]
  11. Elsässer, C.; Schweizer, S.; Fähnle, M. Hydrogen Vibration in Cubic Dihydrides MH 2 (M = Ti, Zr), and Localization in Cubic Laves Phases ZrM 2 H 1/2 (M = V, Cr, Fe, Co). MRS Online Proc. Libr. Arch. 1996, 453. [Google Scholar] [CrossRef]
  12. Ikeda, S.; Watanabe, N.; Kai, K. Crystal analyser TOF spectrometer (CAT). Physica B + C 1983, 120, 131–135. [Google Scholar] [CrossRef]
  13. Kolesnikov, A.; Bashkin, I.; Belushkin, A.; Ponyatovsky, E.; Prager, M. Inelastic neutron scattering study of ordered gamma-ZrH. J. Phys. Condens. Matter 1994, 6, 8989. [Google Scholar] [CrossRef]
  14. Kolesnikov, A.; Balagurov, A.; Bashkin, I.; Belushkin, A.; Ponyatovsky, E.; Prager, M. Neutron scattering studies of ordered gamma-ZrD. J. Phys. Condens. Matter 1994, 6, 8977. [Google Scholar] [CrossRef]
  15. Hellman, O.; Abrikosov, I.; Simak, S. Lattice dynamics of anharmonic solids from first principles. Phys. Rev. B 2011, 84, 180301. [Google Scholar] [CrossRef] [Green Version]
  16. Hellman, O.; Abrikosov, I.A. Temperature-dependent effective third-order interatomic force constants from first principles. Phys. Rev. B 2013, 88, 144301. [Google Scholar] [CrossRef] [Green Version]
  17. Kresse, G.; Hafner, J. Ab initio molecular dynamics for liquid metals. Phys. Rev. B 1993, 47, 558. [Google Scholar] [CrossRef]
  18. Kresse, G.; Furthmüller, J. Efficiency of ab-initio total energy calculations for metals and semiconductors using a plane-wave basis set. Comput. Mater. Sci. 1996, 6, 15–50. [Google Scholar] [CrossRef]
  19. RMG Website. Available online: https://www.rmgdft.org/ (accessed on 10 March 2021).
  20. Briggs, E.; Sullivan, D.; Bernholc, J. Real-space multigrid-based approach to large-scale electronic structure calculations. Phys. Rev. B 1996, 54, 14362. [Google Scholar] [CrossRef]
  21. Hodak, M.; Wang, S.; Lu, W.; Bernholc, J. Implementation of ultrasoft pseudopotentials in large-scale grid-based electronic structure calculations. Phys. Rev. B 2007, 76, 085108. [Google Scholar] [CrossRef] [Green Version]
  22. Kresse, G.; Joubert, D. From ultrasoft pseudopotentials to the projector augmented-wave method. Phys. Rev. B 1999, 59, 1758. [Google Scholar] [CrossRef]
  23. Perdew, J.P.; Chevary, J.A.; Vosko, S.H.; Jackson, K.A.; Pederson, M.R.; Singh, D.J.; Fiolhais, C. Atoms, molecules, solids, and surfaces: Applications of the generalized gradient approximation for exchange and correlation. Phys. Rev. B 1992, 46, 6671. [Google Scholar] [CrossRef]
  24. Perdew, J.P.; Burke, K.; Ernzerhof, M. Generalized gradient approximation made simple. Phys. Rev. Lett. 1996, 77, 3865. [Google Scholar] [CrossRef] [Green Version]
  25. Methfessel, M.; Paxton, A. High-precision sampling for Brillouin-zone integration in metals. Phys. Rev. B 1989, 40, 3616. [Google Scholar] [CrossRef] [Green Version]
  26. Zhang, J.; Cheng, Y.; Lu, W.; Briggs, E.; Ramirez-Cuesta, A.J.; Bernholc, J. Large-Scale Phonon Calculations Using the Real-Space Multigrid Method. J. Chem. Theory Comput. 2019, 15, 6859–6864. [Google Scholar] [CrossRef] [PubMed]
  27. Togo, A.; Tanaka, I. First principles phonon calculations in materials science. Scr. Mater. 2015, 108, 1–5. [Google Scholar] [CrossRef] [Green Version]
  28. Mitchell, P.C.H. Vibrational Spectroscopy with Neutrons: With Applications in Chemistry, Biology, Materials Science and Catalysis; World Scientific: Singapore, 2005; Volume 3. [Google Scholar]
  29. Ramirez-Cuesta, A. aCLIMAX 4.0. 1, The new version of the software for analyzing and interpreting INS spectra. Comput. Phys. Commun. 2004, 157, 226–238. [Google Scholar] [CrossRef]
  30. Cheng, Y.; Daemen, L.; Kolesnikov, A.; Ramirez-Cuesta, A. Simulation of inelastic neutron scattering spectra using OCLIMAX. J. Chem. Theory Comput. 2019, 15, 1974–1982. [Google Scholar] [CrossRef] [PubMed]
  31. Seeger, P.A.; Daemen, L.L.; Larese, J.Z. Resolution of VISION, a crystal-analyzer spectrometer. Nucl. Instrum. Methods Phys. Res. Sect. A 2009, 604, 719–728. [Google Scholar] [CrossRef]
  32. Goyal, P.S.; Penfold, J.; Tomkinson, J. Internal Rep. Technical Report, RAL-86-070; Rutherford Appleton Lab.: Chilton, UK, 1986. [Google Scholar]
  33. Penfold, J.; Tomkinson, J. Internal Rep. Technical Report, RAL-86-019; Rutherford Appleton Lab.: Chilton, UK, 1986. [Google Scholar]
  34. Rundle, R.; Shull, C.; Wollan, E.O. The crystal structure of thorium and zirconium dihydrides by X-ray and neutron diffraction. Acta Crystallogr. 1952, 5, 22–26. [Google Scholar] [CrossRef] [Green Version]
  35. Momma, K.; Izumi, F. VESTA 3 for three-dimensional visualization of crystal, volumetric and morphology data. J. Appl. Crystallogr. 2011, 44, 1272–1276. [Google Scholar] [CrossRef]
  36. Hinuma, Y.; Pizzi, G.; Kumagai, Y.; Oba, F.; Tanaka, I. Band structure diagram paths based on crystallography. Comput. Mater. Sci. 2017, 128, 140–184. [Google Scholar] [CrossRef] [Green Version]
  37. Arnold, O.; Bilheux, J.C.; Borreguero, J.; Buts, A.; Campbell, S.I.; Chapon, L.; Doucet, M.; Draper, N.; Leal, R.F.; Gigg, M.; et al. Mantid—Data analysis and visualization package for neutron scattering and μ SR experiments. Nucl. Instrum. Methods Phys. Res. Sect. A 2014, 764, 156–166. [Google Scholar] [CrossRef] [Green Version]
  38. Ackland, G.; Warren, M.; Clark, S. Practical methods in ab initio lattice dynamics. J. Phys. Condens. Matter 1997, 9, 7861. [Google Scholar] [CrossRef] [Green Version]
  39. Olsson, P.; Massih, A.; Blomqvist, J.; Holston, A.M.A.; Bjerkén, C. Ab initio thermodynamics of zirconium hydrides and deuterides. Comput. Mater. Sci. 2014, 86, 211–222. [Google Scholar] [CrossRef]
  40. Zhang, P.; Wang, B.T.; He, C.H.; Zhang, P. First-principles study of ground state properties of ZrH2. Comput. Mater. Sci. 2011, 50, 3297–3302. [Google Scholar] [CrossRef]
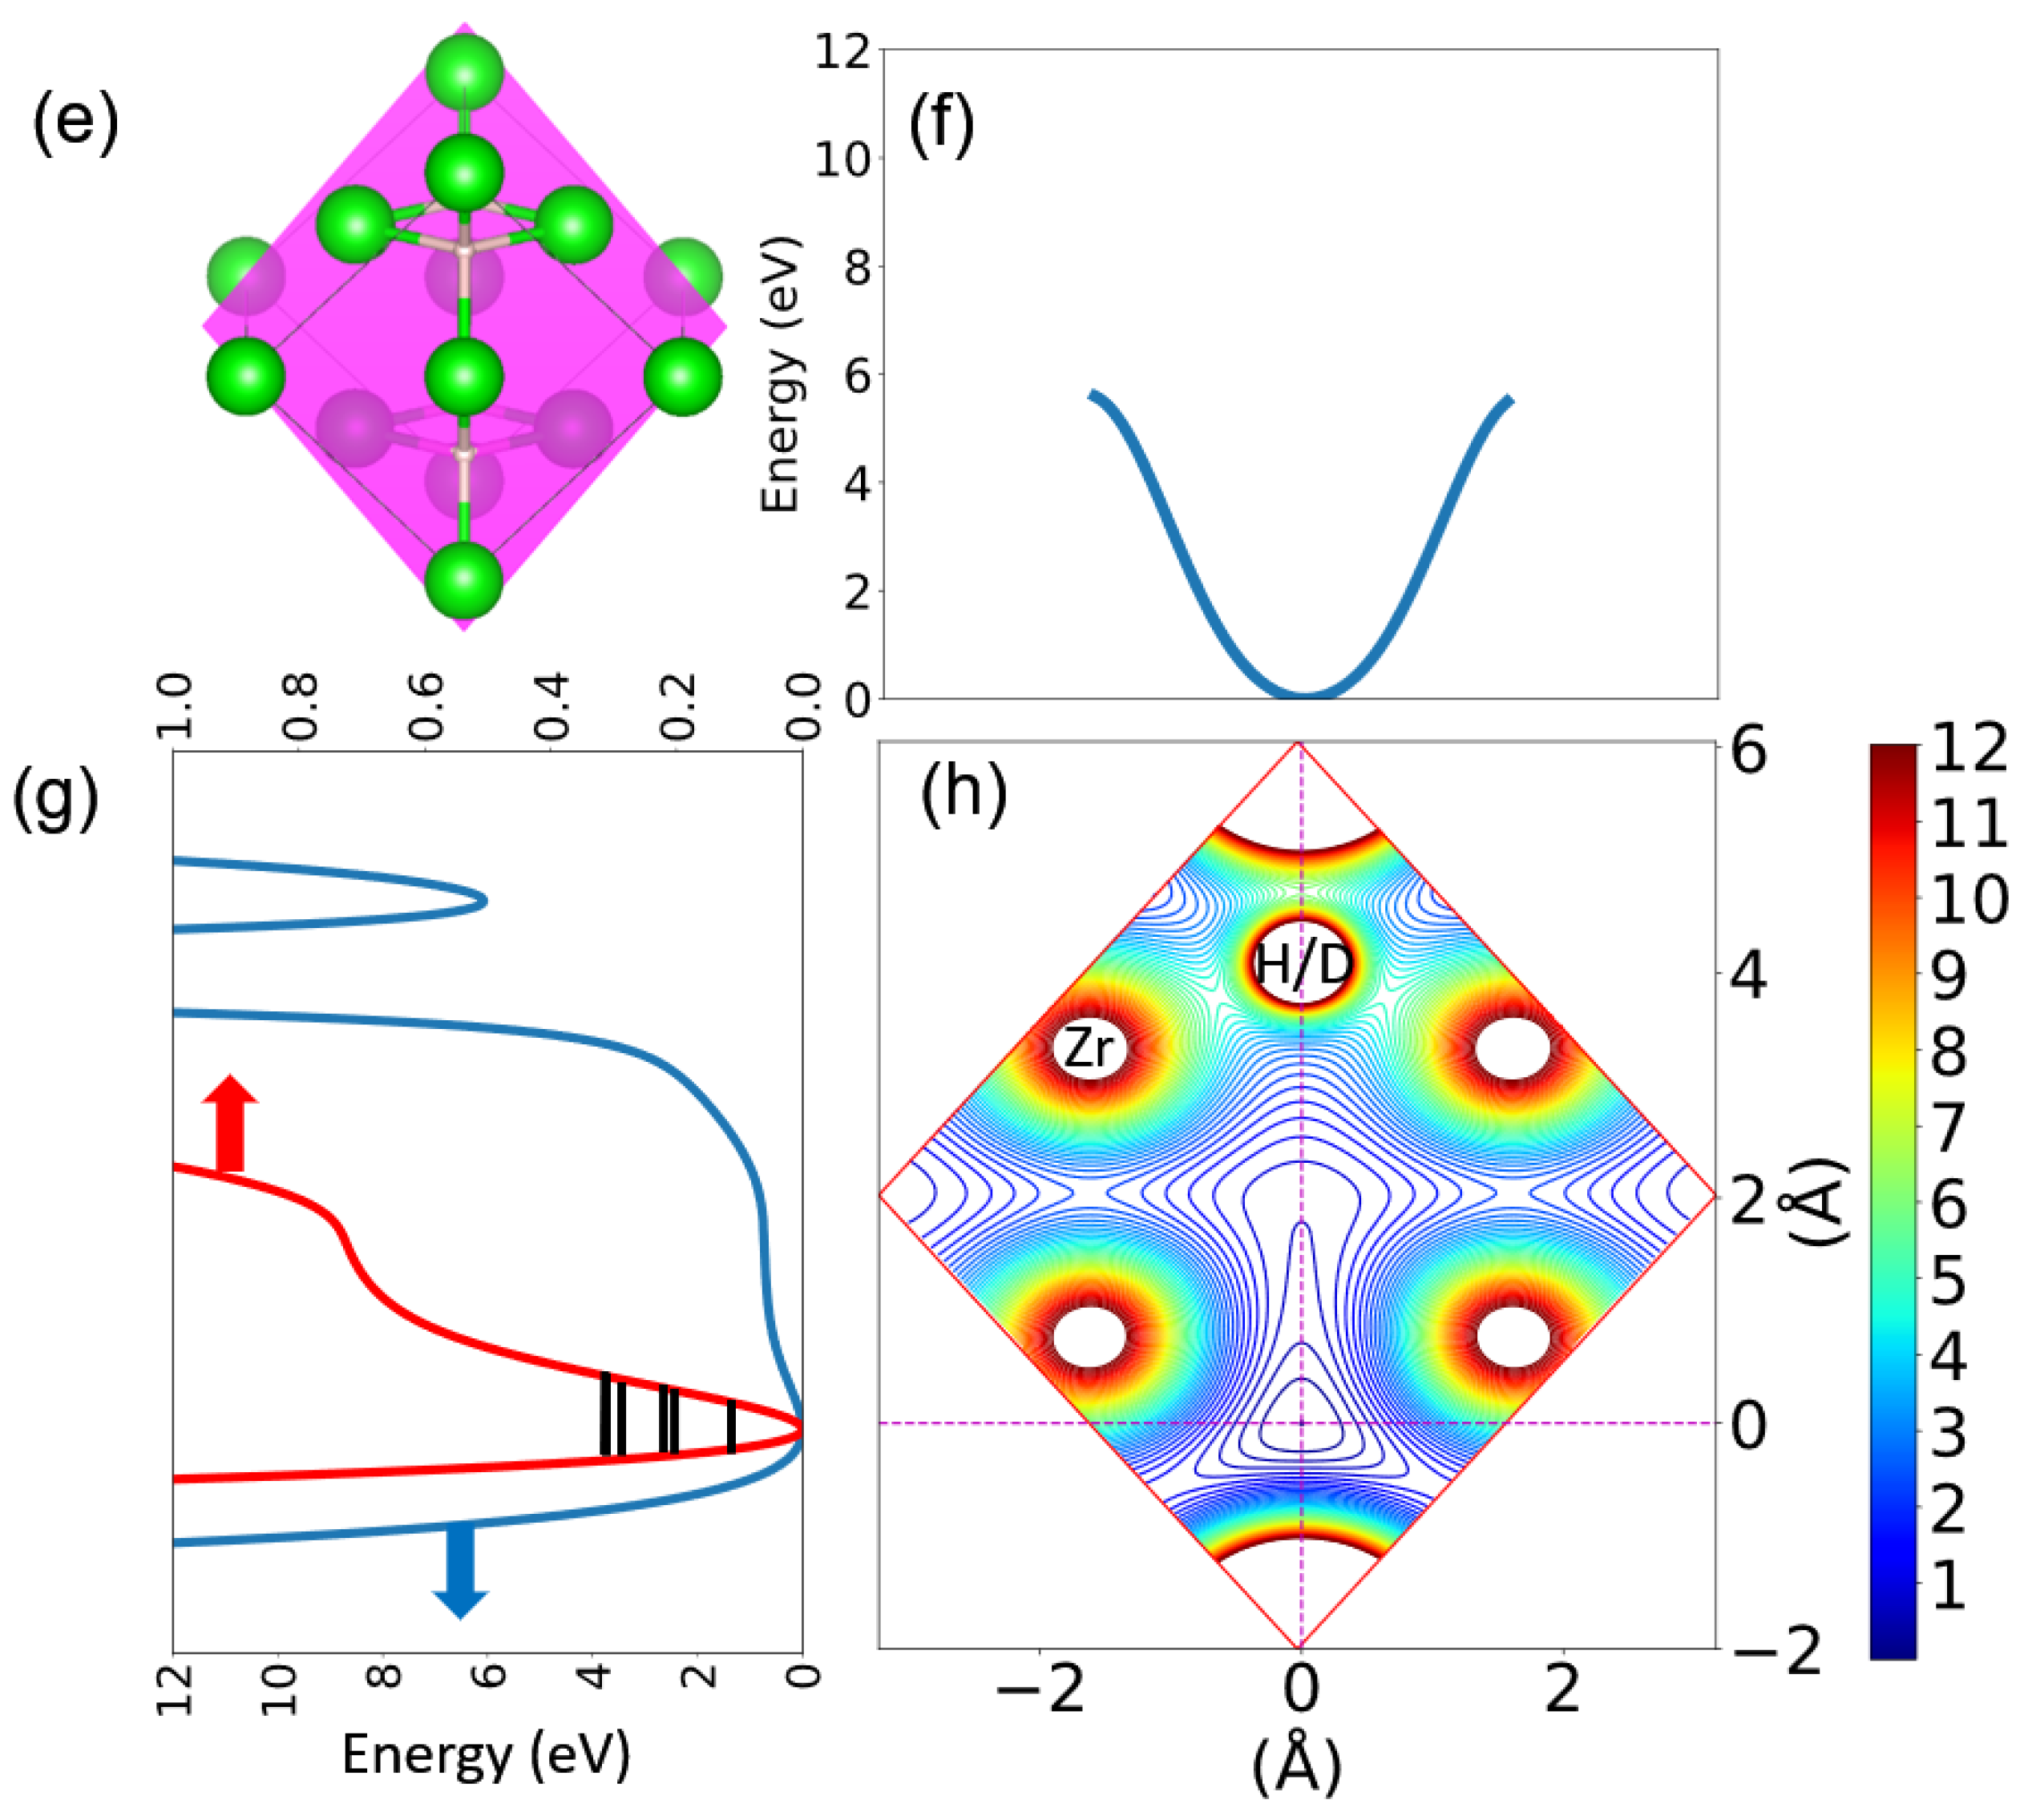
  41. See Supplementary Materials for details of structural parameters of ZrHx, and wavefunctions and their comparisons for H/D in selected planes.
  42. Nevou, L. 2D Time Indep. Schroedinger Equ. Solver. Available online: https://github.com/LaurentNevou/Q_Schrodinger2D_demo/ (accessed on 10 March 2021).
Figure 1. (a) Crystal unit cells for ϵ-ZrH2 (space group I4/mmm), γ-ZrH, and γ-ZrD (both are of space group Cccm), where Zr atoms are in green, H(D) atoms in red exist in all structures, and H(D) atoms in black only exist in ϵ-ZrH2. It should be pointed out that lattice constants are different between ϵ-ZrH2 and γ-ZrD(H). Figures were drawn using the VESTA program [35]. (bd) are calculated phonon dispersions and PDOS for the primitive cells of γ-ZrD, γ-ZrH, and ϵ-ZrH2, respectively. Note that the number of low energy bands in γ-ZrH and γ-ZrD is twice that of ϵ-ZrH2 because the primitive cells are Zr2H2, Zr2D2, and ZrH2 for γ-ZrH, γ-ZrD, and ϵ-ZrH2, respectively. The BZ paths and notation are adopted from [36].
Inorganics 09 00029 g001
Figure 2. The INS spectra for ϵ-ZrH2 measured with the VISION instrument at 5 K (blue), γ-ZrH (red) at 4.5 K, and γ-ZrD (black) at 30 K, both measured with the TFXA spectrometer. Spectra have been normalized to the same maximum value of the fundamental peaks. It must also be mentioned that the γ-ZrD sample has been contaminated by ∼1 at.% H, and also contained α - and δ -phases [13], with the actual ratio of Zr atoms in the different phases as 0.718(α-ZrD0.001) + 0.269(γ-ZrD0.98) + 0.013(δ-ZrD1.2), which results in extra peaks at ∼140 meV and higher intensity of the lattice modes (<30 meV) compared to the expected spectrum for pure γ-ZrD. Figures were drawn using the Mantid program [37].
Inorganics 09 00029 g002
Figure 3. The VISION INS spectrum (red) at 5 K and the simulated spectra with RMG (green) and VASP (blue) at 0 K for ϵ-ZrH2. Spectra are normalized with respect to their area under the fundamental curve. Black arrows are marking peaks resulting from anharmonic effects (split peaks), which do not exist in the simulated spectra in the harmonic approximation.
Inorganics 09 00029 g003
Figure 4. PDOS comparisons between γ-ZrD (black), γ-ZrD with scaled high energy modes (magenta), γ-ZrH (red), and ϵ-ZrH2 (blue). The high-energy modes of γ-ZrD are scaled by a factor of 2 in energy, and to keep total DOS unchanged, they are also scaled by 1 / 2 in intensity. The scaling procedure is represented by the black arrow. Low-energy modes are almost identical between γ-ZrH and γ-ZrD, and high-energy modes are nearly identical after scaling.
Inorganics 09 00029 g004
Figure 5. Crystal unit cells with sampling plane (a,e), contour plots (d,h) and sectional views of PES (b,c,f,g) for ZrH x . (ad): plane (112) of ϵ -ZrH 2 ; (eh): plane (−112) of γ -ZrH and γ -ZrD. Color scheme: Zr, green; H, white; sampling plane, pink. 50 equidistant energy levels within (0, 12) eV are used in contour plots, with minimum energies of 0 all located at (0, 0). Red lines in (c,g) are enlarged plots in vertical directions within the energy range of (0, 1) eV, and black lines indicate the lowest six eigenfrequencies (see Figure 6 for corresponding wavefunctions) from the Schrödinger equations of ϵ -ZrH 2 and γ -ZrD.
Inorganics 09 00029 g005aInorganics 09 00029 g005b
Figure 6. Lowest six eigenfrequencies and wavefunctions plotted in the range [−0.8, 0.8] Å × [−0.8, 0.8] Å by solving the Schrödinger equation for (a) (112) plane of ϵ -ZrH 2 , (b) (−112) plane of γ -ZrH, and (c) (−112) plane of γ -ZrD. Corresponding quantum numbers are denoted in [ n , m ] , where n is in the Y direction and m is in the X direction. Another interesting finding is that a crossover (marked by orange arrows) happens between the quantum numbers of ϵ -ZrH 2 and γ -ZrH, which are marked by orange arrows. The last two energy levels in γ -ZrD are degenerate. The Schrödinger equations were solved using [42].
Inorganics 09 00029 g006
Figure 7. Comparisons between eigenfrequencies and experimental INS spectra for (a) ϵ -ZrH 2 , (b) γ -ZrH, and (c) γ -ZrD. Eigenfrequencies from the Schrödinger equation are in red lines, experimental INS spectra are in solid black lines, INS spectra simulated in harmonic approximation are in magenta lines, and the dashed black lines are for eye guidance of comparisons between eigenfrequencies and anharmonic peaks for the first three overtones.
Inorganics 09 00029 g007
Figure 8. The INS spectra for (a) ϵ -ZrH 2 , (b) γ -ZrH, and (c) γ -ZrD. Eigenfrequencies from the Schrödinger equation are in red lines, the experimental INS spectra are in black lines, the INS spectra simulated in the harmonic approximation are in magenta lines, blue lines represent the spectra of eigenfrequencies convoluted with spectrometer resolution functions, and cyan lines in (c) are the simulated spectrum of contaminated γ -ZrD. Spectra were normalized with respect to their area under the fundamental spectra curve. A convolution procedure was applied up to the third overtones. The ratio of the neutron scattering cross-section of H and D is 82.02/7.64 = 10.74, and m ( D ) / m ( H ) = 2 , therefore the fundamental mode intensity ratio of 1% H to 99% D should be ∼10.74 × 2 × 0.01/0.99 = 0.22 (without corrections for the Debye–Waller factor).
Inorganics 09 00029 g008aInorganics 09 00029 g008b
Table 1. The calculated MSD and M S D (in brackets) of Zr at (0, 0, 0) and H(D) at ( 3 / 4 , 1 / 4 , 3 / 4 ) for ZrH x in different energy ranges. Units are in Å 2 for MSD and Å for M S D . In γ -ZrH( γ -ZrD), MSD(Zr) varies slightly (within 3%) between different Zr positions.
Property<60 meV>60 meV
ϵ -ZrH 2
MSD(H)0.00063 (0.025)0.0144 (0.12)
MSD(Zr)0.0014 (0.037)0.00000132 (0.00115)
M S D ( H ) M S D ( Z r ) 0.45 (0.67)10,909.09 (104.45)
γ -ZrH
MSD(H)0.0008 (0.0283)0.0136 (0.1166)
MSD(Zr)0.0015 (0.0387)0.00000079 (0.00089)
M S D ( H ) M S D ( Z r ) 0.53 (0.73)17,215.19 (131.21)
γ -ZrD
MSD(D)0.0008 (0.0283)0.0095 (0.0976)
MSD(Zr)0.0015 (0.0387)0.000002245 (0.001498)
M S D ( D ) M S D ( Z r ) 0.53 (0.73)4231.63 (65.05)
Publisher’s Note: MDPI stays neutral with regard to jurisdictional claims in published maps and institutional affiliations.

