
Volumetrics of Hydrogen Storage by Physical Adsorption


1
Department of Physics, Indian Institute of Technology Madras, Chennai 600036, India
2
Department of Chemistry & Biochemistry, Montana State University, Bozeman, MT 59717, USA
*
Author to whom correspondence should be addressed.
Inorganics 2021, 9(6), 45; https://0-doi-org.brum.beds.ac.uk/10.3390/inorganics9060045
Submission received: 20 April 2021
/
Revised: 12 May 2021
/
Accepted: 16 May 2021
/
Published: 4 June 2021
(This article belongs to the Special Issue Metal Hydrogen Systems: Fundamental Properties and Current Applications for Energy Storage and Conversion)
Abstract
:Physical adsorption remains a promising method for achieving fast, reversible hydrogen storage at both ambient and cryogenic conditions. Research in this area has recently shifted to focus primarily on the volumetric (H2 stored/delivered per volume) gains achieved within an adsorptive storage system over that of pure H2 compression; however, the methodology for estimating a volumetric stored or delivered amount requires several assumptions related to the ultimate packing of the adsorbent material into an actual storage system volume. In this work, we critically review the different assumptions commonly employed, and thereby categorize and compare the volumetric storage and delivery across numerous different porous materials including benchmark metal-organic frameworks, porous carbons, and zeolites. In several cases, there is a significant gain in both storage and delivery by the addition of an adsorbent to the high-pressure H2 storage system over that of pure compression, even at room temperature. Lightweight, low-density materials remain the optimal adsorbents at low temperature, while higher density, open metal-containing frameworks are necessary for high-density room temperature storage and delivery.

1. Introduction
After over eight decades [1] of dedicated research, the state-of-the art in compact, lightweight, and affordable hydrogen storage remains pure compression of H2 at ambient temperature [2]. In modern Type-IV carbon fibre reinforced high-pressure vessels, the amount of hydrogen stored per unit mass at 700 bar corresponds to 5.33 ± 0.14 MJ kg−1 [3]; far below the theoretical lower heating value (LHV) of 120 MJ kg−1 of pure hydrogen (without a container) but substantially higher than the energy density of a lithium-ion battery (≤1 MJ kg−1). The volumetric storage capacity of hydrogen compression, on the other hand, remains modest: 2.99 ± 0.04 MJ L−1 (compared to ~2.6 MJ L−1 for benchmark commercial lithium-ion batteries). For mobility applications, the key priority is to increase the volumetric energy density of the hydrogen storage system, while maintaining safety and ease of use. The 2025 target set by the United States Department of Energy (DOE) is 4.8 MJ L−1 (1.3 kWh L−1), which corresponds to 40 g L−1 of H2 that is deliverable to the power plant (e.g., a fuel cell) based on its LHV at 298 K. The primary distinction between total hydrogen capacity and deliverable hydrogen capacity, as it relates to storage at elevated pressures, is the minimum delivery pressure of 5 bar absolute (0.5 MPa), a limit below which a typical power plant cannot maintain optimal function [4].
Physisorption of hydrogen on the surface of a porous adsorbent material provides a means for the volumetric densification of hydrogen without causing a prohibitive change in the thermodynamics or kinetics of storage at elevated pressures [5,6]. This effect is increased at low temperatures, and a vast number of traditional as well as novel, purpose-designed adsorbents have been investigated and are shown to exhibit appreciable densification [7,8] of H2 at 77 K, the normal boiling point of liquid nitrogen (a readily available coolant). The relatively light weight of hydrogen initially led to a focus on the gravimetric hydrogen storage capacities of adsorbents for comparison to alternative liquid- and solid-state storage concepts, but this focus has recently been shifted toward volumetric optimization [9,10,11,12].
Interestingly, adsorbent materials which are designed to optimize for gravimetric capacity do not necessarily optimize for volumetric capacity owing to fundamental packing limitations (high surface area being correlated with low packing density). This is well-exemplified by a series of isoreticular MOFs based on highly stable zirconium-oxo/hydroxo nodes which exhibit highly different gravimetric to volumetric hydrogen storage densities [13]. Numerous studies show that while increasing the gravimetric surface area of the sorbent leads to an increase in the gravimetric hydrogen storage amount (at 77 K, this relation is commonly referred to as Chahine’s rule [14]), volumetric H2 storage reaches a maximum beyond which increasing gravimetric surface area leads to no further improvement or even a decrease in volumetric storage [15,16,17]. Hence, to optimize total H2 storage at 77 K, a material with moderate density (reported variously as = ~0.5 g mL−1 or = ~0.75) and high surface area must be identified. The total gravimetric and volumetric hydrogen capacity is ultimately optimized in materials showing a volumetric surface area between 1500 and 2250 m2 mL−1 [11]. Complications arise when optimizing for hydrogen delivery (the amount stored above the 5 bar minimum usable pressure) at 77 K, a major focus of this review. Optimization for volumetric storage at room temperature as opposed to 77 K calls for different structural parameters, namely smaller pores [18] and a significant presence of open metal sites [17]. At room temperature, the density and nature of unsaturated metal sites within the porous framework correlate directly with increased hydrogen delivery, as is well-exemplified by Ni2(m-dobdc), the current apparent champion material for hydrogen storage and delivery at 298 K.
Of particular interest within this review is the fact that while the role of open metal sites is clear for improving room temperature hydrogen storage and delivery, the role of metals within metal-organic frameworks is not obviously established for 77 K delivery applications. A higher binding affinity toward H2 (commonly observed near unsaturated metal centers in MOFs [7]) could very well be detrimental to delivery above 5 bar. A judicious comparison of metal-free carbons and MOFs toward ultimate hydrogen storage limitations is warranted, where idealized models of carbon-based sorbent crystals should be compared in an apples-to-apples fashion with MOFs.
In this work, we critically review the literature in order to determine universal trends in volumetric hydrogen storage and delivery across three prominent classes of adsorptive storage materials in order to clarify best practices for the measuring and reporting of hydrogen adsorption volumetrics, and to identify ultimate storage and delivery limits of systems based on the adsorptive storage mechanism (if such limits exist). The majority of the literature in this area has focused on metal-organic frameworks (MOFs), a class of permanently porous compounds that emerged in the 1990s which are both highly diverse in terms of structure and composition as well as highly crystalline (allowing for atomistic modeling of their adsorptive storage behaviours) [19]. Several benchmark MOFs have been investigated with respect to densification [20] and preparation of high-density pellets and monoliths [21]. Zeolites, perhaps the archetypical class of crystalline porous framework materials, have rightly received much less attention owing to their heavier weight (per unit surface area or pore volume) in addition to their lower overall porosity (fraction of crystalline density accessible to molecular guests such as H2). Nevertheless, we exploit several well-known zeolites in this work for comparison to MOFs in the low surface area and high-density limit. Lastly, porous carbons, while widely adopted in practical adsorption applications, remain less commonly compared directly to MOFs and zeolites; this is mainly owed to a lack of crystalline structure of carbon materials, seeming to preclude the possibility of an apples-to-apples atomistic understanding of their ultimate H2 storage limitations. Herein, we highlight zeolite-templated carbon (ZTC) [22] as a class of porous carbons with defined atomistic structure [23] as well as a well-established synthesis at a large enough scale to permit accurate measurement of their properties, as both powders and densified, monolithic pellets.
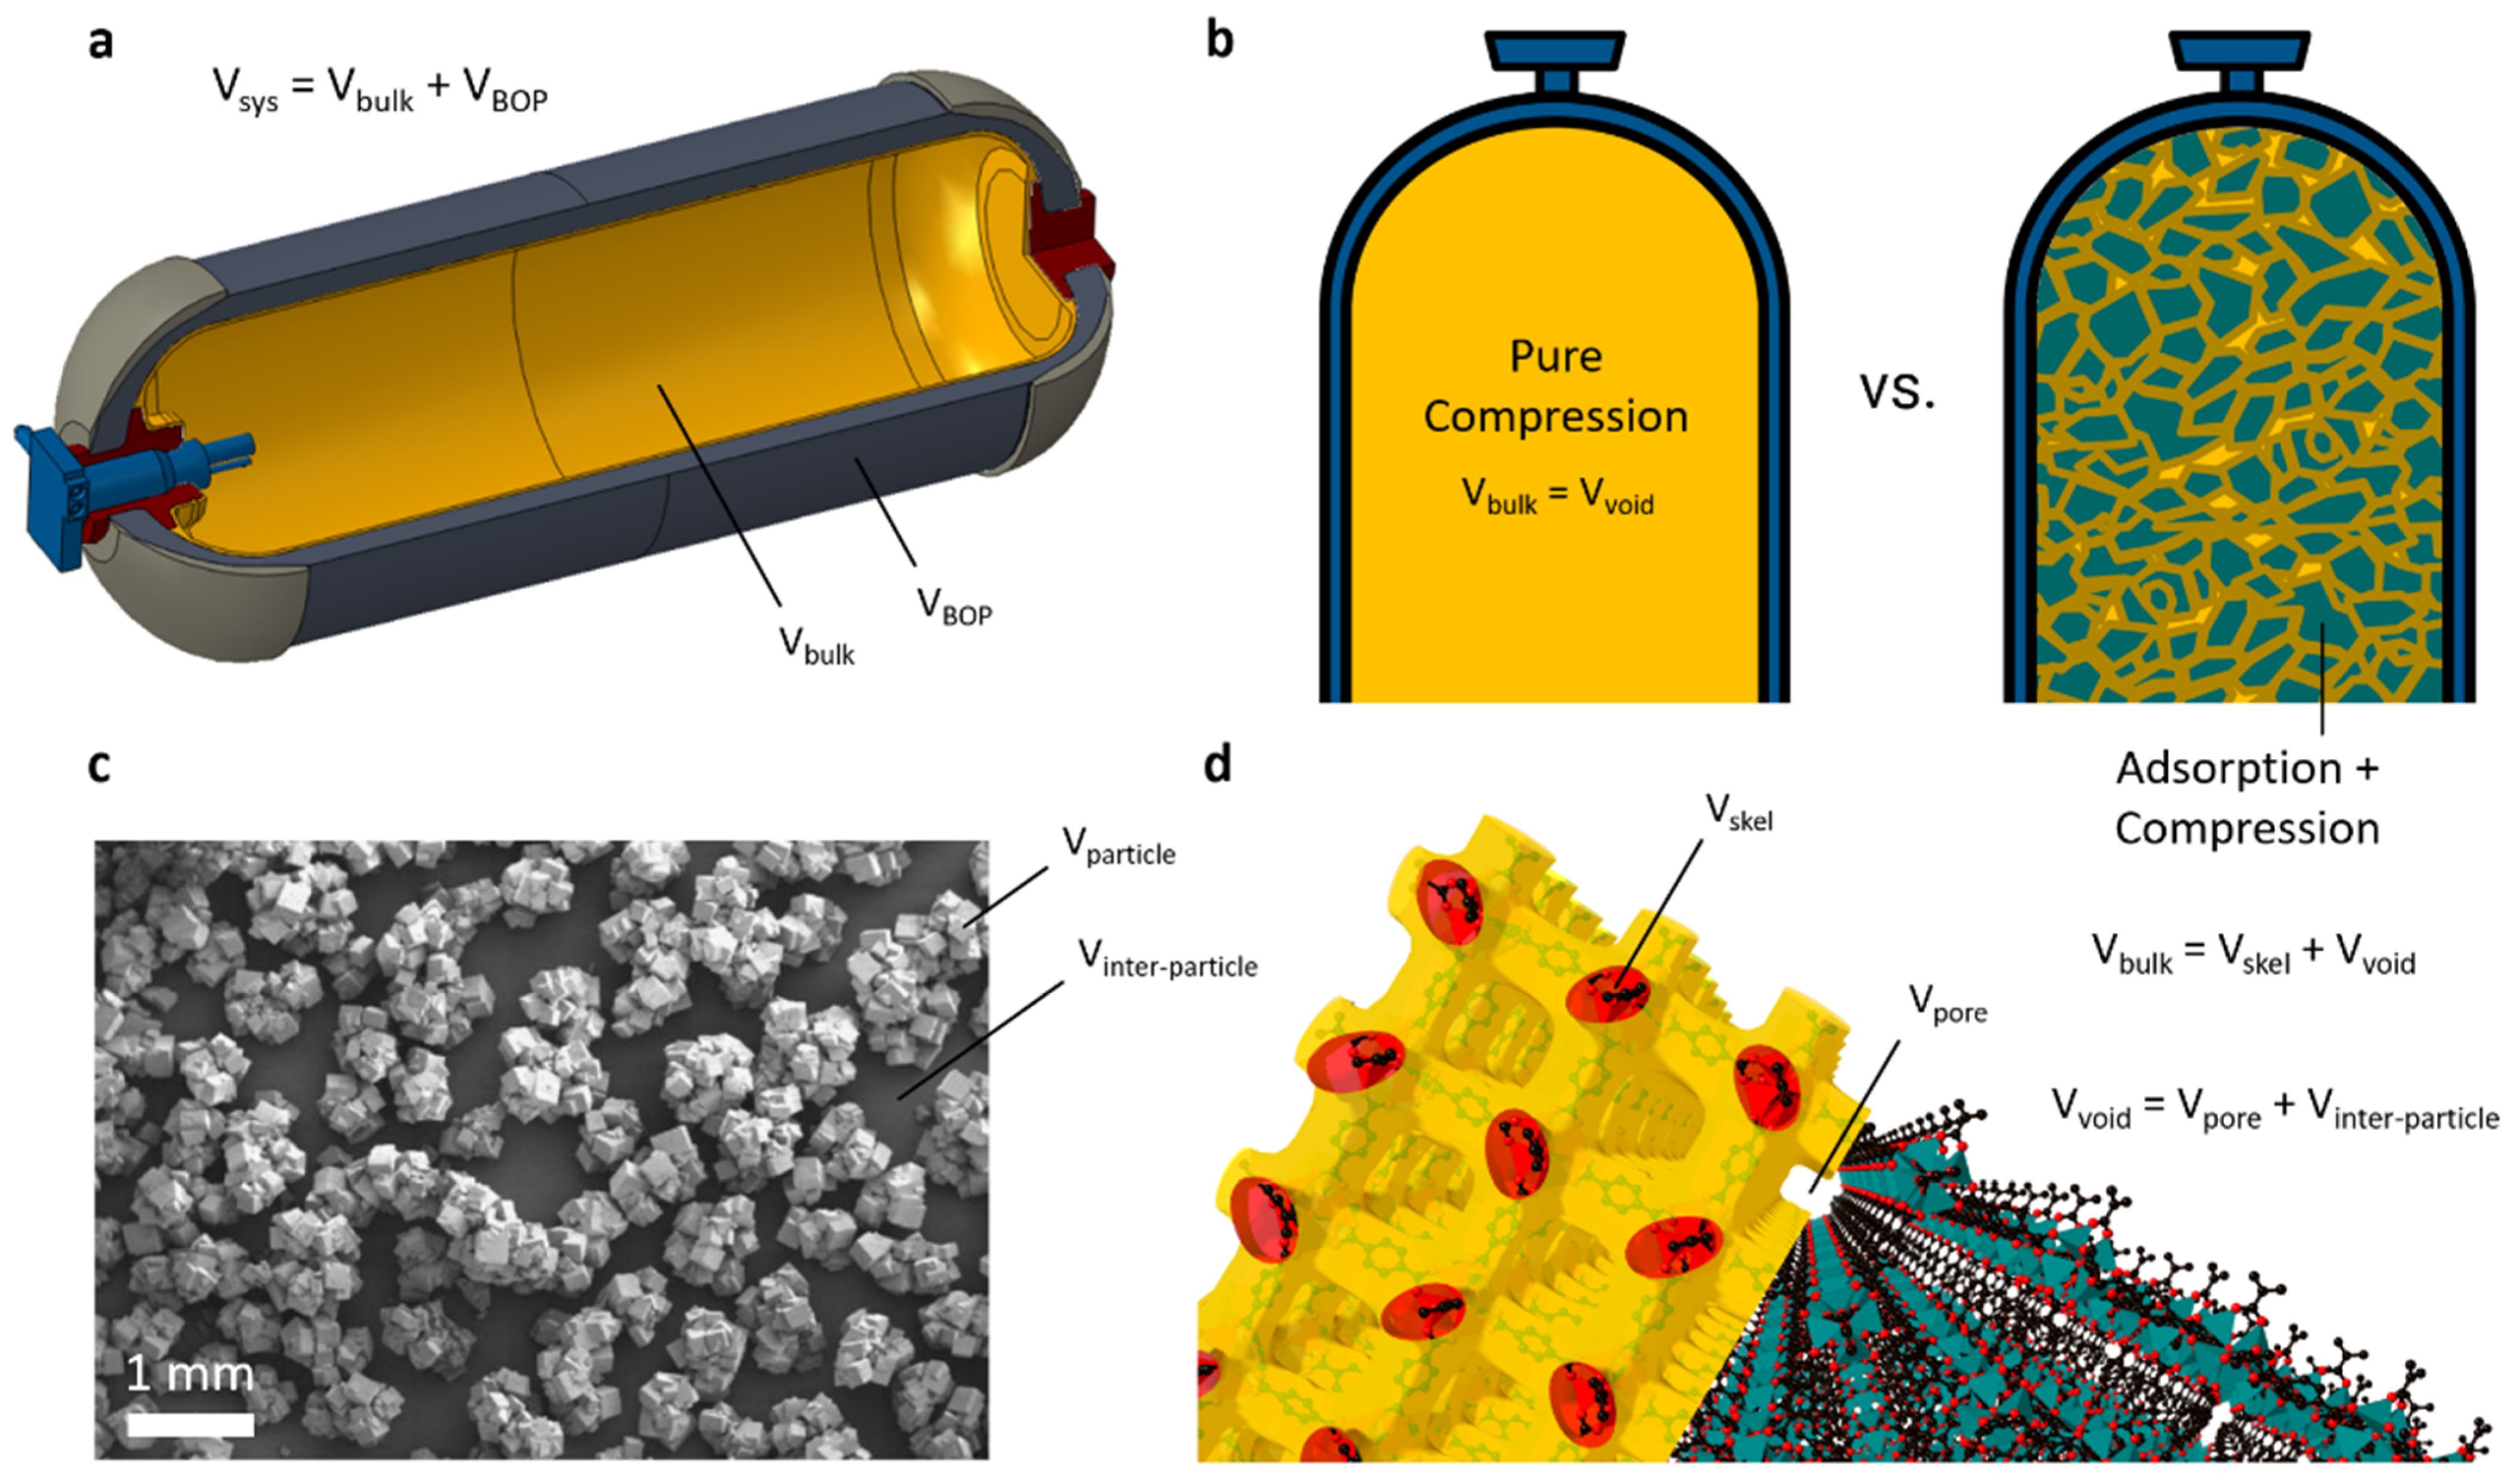
Lastly, after a selective review of the materials-level limits on adsorptive hydrogen storage, we present a modest analysis of the penalties in system weight, cost, complexity, and thermal management imposed by the addition of adsorbent. The state-of-the-art in pure compression is H2 storage at 298 K and 700 bar in Type-IV pressure vessels with a polymer liner, overwrapped with a carbon fibre and resin composite (Figure 1a). A representative such vessel contains 147 L of void volume, actually takes up 226 L of system volume, and weighs 121 kg (when empty); the maximum capacity is 5.8 kg of H2, or 5.6 kg of H2 deliverable to a fuel cell [3]. Hence, the state of the art in volumetric hydrogen storage corresponds to 24.8 g L−1 system, or 38.1 g L−1 of volume available for replacement by a sorbent. We focus on the latter metric within this review, in order to determine whether adsorption-based storage can out-perform pure compression.
A review of the current state of knowledge of the volumetric adsorptive hydrogen storage limitations of MOFs, carbons, and zeolites between 77 and 298 K and between 5 and 100 bar follows herein. This review focuses on materials that can be reproducibly prepared across multiple laboratories and in large enough quantity for accurate hydrogen sorption characterization. Existing reports of densification and compaction into monolithic pellets are strongly emphasized. It is shown that several actual monolithic materials can meet the 40 g L−1 DOE target under temperature-pressure swing conditions between 77 and 298 K, but no real-world material yet meets this target under isothermal pressure swing at either 77 or 298 K. Simple guiding principles for materials design and the limits of adsorption-based hydrogen storage are given in the summarizing conclusions.
2. Adsorption Fundamentals
2.1. Adsorption Measurements
Hydrogen adsorption equilibria are typically measured under isothermal conditions using either the gravimetric (with a balance) or volumetric (with a Sieverts apparatus) technique; the method chosen has no bearing on the type or quality of data obtained. The raw data obtained in either type of experiment is the excess amount of hydrogen adsorbed (e.g., in mmol or in g), , and is typically normalized per mass of the adsorbent sample (e.g., in g). This yields the common units of mmol g−1 (most preferred herein) and g kg−1, among numerous others. In some cases, it is normalized per mass of the adsorbent plus hydrogen adsorbed, yielding a true “final” weight percent uptake upon adsorption. Therefore, when reporting the excess adsorption uptake as a weight percent (wt.%), it is crucial to indicate whether the denominator is taken to be the mass of the initial adsorbent or that of the adsorbent plus adsorbed H2. We caution all researchers to be clear about the definition of wt.% employed, and recommend against its use in favour of mmol g−1 (which always refers to grams of sorbent material alone).
Specific considerations to ensure the highest possible accuracy and reproducibility of the reported results must be taken [24,25]. In particular, additional precautions must be exercised in measuring high-pressure (>20 bar) H2 adsorption equilibria owing to the difficulty in achieving thermal equilibration and stability as well as in preventing leaks and performing accurate volume calibrations [26].
Regardless of the method employed, to assess either the buoyancy of the apparatus (as in the gravimetric method) or the gas-accessible inner volume of the apparatus (as in the volumetric method), the skeletal density of the sample, , must be determined. This is typically performed using helium pycnometry at elevated pressures and room temperature, although it has been recognized that helium adsorption at room temperature may be a non-negligible effect [27], causing the measured skeletal density to be higher than the actual skeletal density. This can lead to large errors in skeletal density measurements while the error in the practical quantity needed for adsorption measurements (actual buoyancy or inner volume) is significantly smaller. To mitigate these errors, it is recommended to perform helium pycnometry at elevated temperatures, as high as 673 K [28] where the effect of helium adsorption is negligible. The measured skeletal densities of MOFs, in particular, seem to be largely underestimated compared to theoretical values (by comparison of Tables S1 and S4).
Accordingly, the careful experimentalist is yielded two types of information about a solid adsorbent upon the measurement of adsorption equilibria: the pressure-excess uptake isotherm at the desired temperature, and the skeletal density (i.e., the gas-inaccessible volume of the sample, ). Unfortunately, many experimentalists do not report the skeletal density information along with the adsorption isotherm equilibria. We attest that it should be standard practice to report both the adsorption equilibria and the skeletal density (along with the specific measurement techniques employed) for every report of H2 storage by physisorption on a porous solid, especially for new materials of unique chemical composition and structure.
2.2. Adsorption Analysis
While various adsorption quantities are of interest to the hydrogen storage researcher (e.g., “net adsorption” [29] or “absolute adsorption” [30]), the measured “excess” adsorption quantity is the only quantity needed for practical assessment of volumetric storage and delivery. The so-called “total” amount of H2 stored within a given overall system volume, , is the quantity of practical interest for mobility applications [11]. The total adsorption uptake, , should always be directly calculated from the excess quantity of adsorption; it is equal to the excess uptake plus the amount of hydrogen that would occupy the entirety of the gas-accessible volume of the system, , in the absence of any adsorption taking place (see Figure 1) based on the bulk fluid density, :
Herein, we ignore any contribution to the system volume by the thickness of the pressure vessel walls or any “balance of plant” components (all lumped into the term as shown in Figure 1a). Therefore, for simplicity within this review (and which should generally be employed by researchers in the materials development community) the relevant total volume, referred to as , is precisely equal to the void volume (accessible to H2) plus the skeletal volume of the adsorbent (inaccessible to H2):
Hence, the total gravimetric H2 uptake quantity can be converted to a volumetric quantity by assessment of the fraction of the bulk volume taken up by the skeleton of the adsorbent:
where the void fraction of the system is defined as:
The quantity determined in Equation (3) is referred to herein as the “stored amount” or the “volumetric capacity” and represents the ultimate amount of H2 contained within the confines of a pressure vessel containing adsorbent (for direct comparison to the pure compression density of H2). We note that this quantity is inherently measurable (with some complications [31], as explored in Section 2.3) and is not model-dependent.
The metric of “deliverable” (i.e., usable) total H2 uptake is calculated by subtraction of the total stored amount remaining under “spent” or “ineffective” conditions, typically taken as the amount stored at below the minimum storage pressure, . The minimum pressure considered in this review is 5 bar, at either 77 or 298 K (as specified in the current DOE H2 storage targets) [4]. Thus, if the delivery is considered under isothermal “pressure swing” (PS) conditions:
To permit more efficient use of the total H2 capacity of an adsorption-based storage system, a combined “temperature-pressure swing” (TPS) condition can be implemented, which calls for warming of the pressure vessel in its depleted state to a higher final temperature ().
A practical maximum temperature to ensure energy efficiency as well as optimal H2 delivery has been noted to be 160 K [32]. For the purposes of this review, owing to limited data reported across diverse adsorbent materials at 160 K, analysis of TPS delivery was only performed between the pressure of interest at 77 K and the minimum usable pressure of 5 bar at = 298 K.
Figure 1.
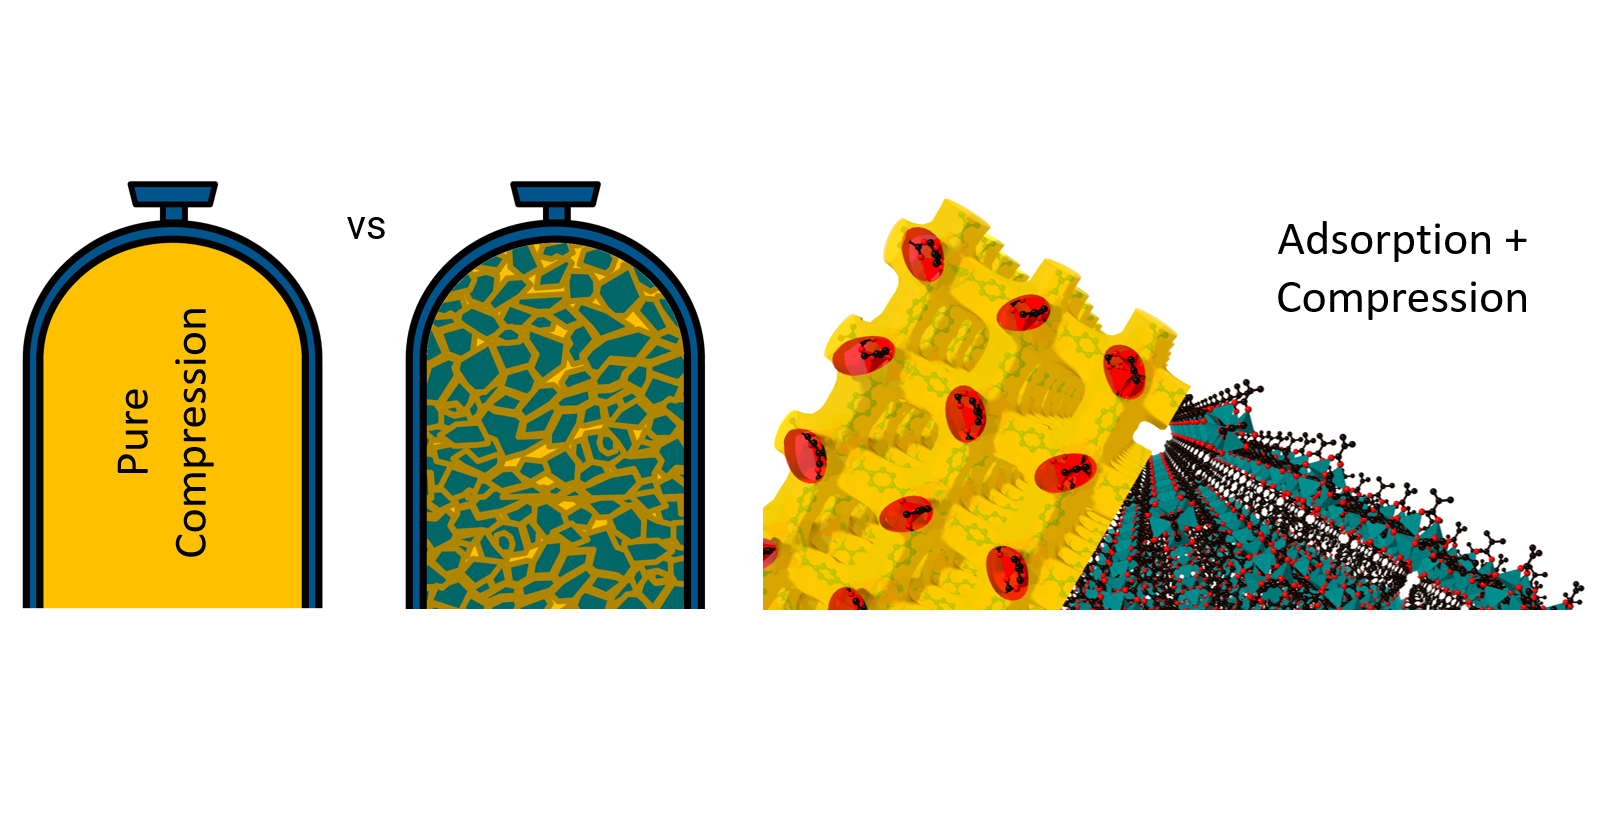
Adsorptive Hydrogen Storage Volumetric Concepts. (a) Type-IV composite overwrapped hydrogen compression cylinder [33]. (Adapted from ref. [33]. Copyright 2017 Process Modeling Group, Nuclear Engineering Division, Argonne National Lab (ANL)) (b) Schematic depiction of pure hydrogen compression versus adsorptive hydrogen storage, showing both H2 densification as well as volume exclusion by the solid adsorbent. (c) Scanning electron micrograph of high-quality MOF-5 crystals synthesized at laboratory scale (50–150 μm in size) [34]. (Adapted with permission from ref. [34]. Copyright 2006 Royal Society of Chemistry) (d) Atomistic depiction of crystal volume, skeletal volume, and void volume of perfect MOF-5 crystals.
Figure 1.
Adsorptive Hydrogen Storage Volumetric Concepts. (a) Type-IV composite overwrapped hydrogen compression cylinder [33]. (Adapted from ref. [33]. Copyright 2017 Process Modeling Group, Nuclear Engineering Division, Argonne National Lab (ANL)) (b) Schematic depiction of pure hydrogen compression versus adsorptive hydrogen storage, showing both H2 densification as well as volume exclusion by the solid adsorbent. (c) Scanning electron micrograph of high-quality MOF-5 crystals synthesized at laboratory scale (50–150 μm in size) [34]. (Adapted with permission from ref. [34]. Copyright 2006 Royal Society of Chemistry) (d) Atomistic depiction of crystal volume, skeletal volume, and void volume of perfect MOF-5 crystals.

2.3. Assessments of System, Skeletal, and Void Volumes
Two of the three volumes (, , and ) necessary to define the adsorption system must be measured or otherwise obtained prior to evaluation of the total volumetric storage (as in Equation (3)) or delivery (as in Equations (5) and (6)). The third of the three volumes/densities can then be determined, in principle, by Equation (2). Effectively, the researcher must obtain the relationship between the mass and volume of the sample, as well as the fraction of that volume that is accessible to gaseous H2, . The gas-phase density and the excess adsorbed amount (as measured by either gravimetry or using a Sieverts apparatus) can then be combined to determine the total stored amount. Since all three volumes can be measured independently, but only two need to be combined to determine the total storage capacity, three unique methods can be employed, as summarized below. Each method only needs information gathered from two independent measurements, and the source of the two measurements determines which method is employed.
The raw H2 adsorption equilibria (excess gravimetric uptake, , as a function of temperature and pressure) must first be converted to a volumetric quantity representing the total amount of hydrogen in a pressurized vessel filled with adsorbent. This total volumetric quantity is the sum of the excess amount adsorbed and the amount of hydrogen that would be present in the same fraction of the total volume accessible to H2 (the void fraction, ) having the following general definition:
Here, the tilde indicates a volumetric quantity (in dimensions of amount per volume) and is the fluid density of pure compressed hydrogen under the temperature and pressure conditions of adsorption. The fluid density should be obtained via the modified Benedict–Webb–Rubin (mBWR) equation of state for normal hydrogen, implemented herein by the NIST Refprop software package (version 10.0) [35]. Use of the ideal gas law introduces ~6% error at 298 K and 100 bar and should not be used [30].
In the first calculation method, referred to herein as the “common” approximation, the bulk density (typically measured by hand tapping for a powder or by the physical dimensions for a pellet), , and total pore volume (typically measured by single-point analysis of the N2 adsorption uptake upon pore filling at 77 K and P/P0 0.95), , are combined to determine the total volumetric uptake as follows:
In the second calculation method, referred to herein as the “skeletal” approximation, the bulk density (typically measured by hand tapping for a powder or by the physical dimensions for a pellet), , and skeletal density (typically measured by helium pycnometry at 298 K), , are combined instead as follows:
In the third calculation method, referred to herein as the “swollen” approximation, the total pore volume (typically measured by single-point analysis of the N2 adsorption uptake upon pore filling at 77 K and P/P0 0.95), , and skeletal density (typically measured by helium pycnometry at 298 K), , are combined instead as follows:
If the three experimentally determined volumes (, , and ) are internally consistent, then the results of Equations (8)–(10) are equal. However, the nature of the three measurements being independent and subject to different experimental assumptions generally gives rise to variations in the determined results; this discrepancy is most notable for powders, as shown in Figure 2b,c and Table 1, and less grievous for pellets and monoliths, as shown in Figures S27 and S28. For all estimations of volumetric H2 storage and delivery, on powders or pellets, the skeletal approximation is preferred (Figure 2e,f).
To determine the theoretical limit of the volumetric uptake quantity on a given material, the raw gravimetric excess adsorption equilibria measured on a pristine powder (prior to densification) may be converted using the ideal crystalline properties of both and . In this case, all three methods described above yield the same result since a single porosity calculation provides a self-consistent relationship between the total volume of the unit cell, the volume accessible to the probe molecule, and the volume inaccessible to the probe molecule. The “crystalline” total volumetric uptake is thus defined as follows:
For this review, and were independently determined for each crystalline material under identical conditions (see Section S3 in the Supplementary Materials for details).
2.4. System Performance Metrics
System-level performance is dependent on numerous factors out of the purview of the materials design/characterization researcher such as the overall size, specific application, and even the precise definition of “system” [38]. Nevertheless, a simple estimate for adsorptive system performance can be achieved by comparison to pure compression in an existing pressure vessel designed for use under the same temperature and pressure conditions. Two representative 5.6 kg H2 delivery “systems” are used for a simple such analysis in this review: a Type-IV pressure vessel [33] for room temperature storage (121 kg, 226 L) and a 77 K Type-I cryo-compression vessel [39] for 77 K storage (109 kg, 246 L) which achieve 24.8 g L−1 and 22.8 g L−1 H2 delivery, respectively, via pure compression. The actual void volume in each system is 147 L and 180 L, respectively; on this basis, the “material-specific” metric for the comparison of adsorptive delivery to pure compression is 38.1 g L−1 and 31.1 g L−1, respectively. We conclude that this corresponds to a reduction in volumetric delivery due to consideration of the system components by 35% and 27% at 298 K and 77 K, respectively.
3. Density and Densification
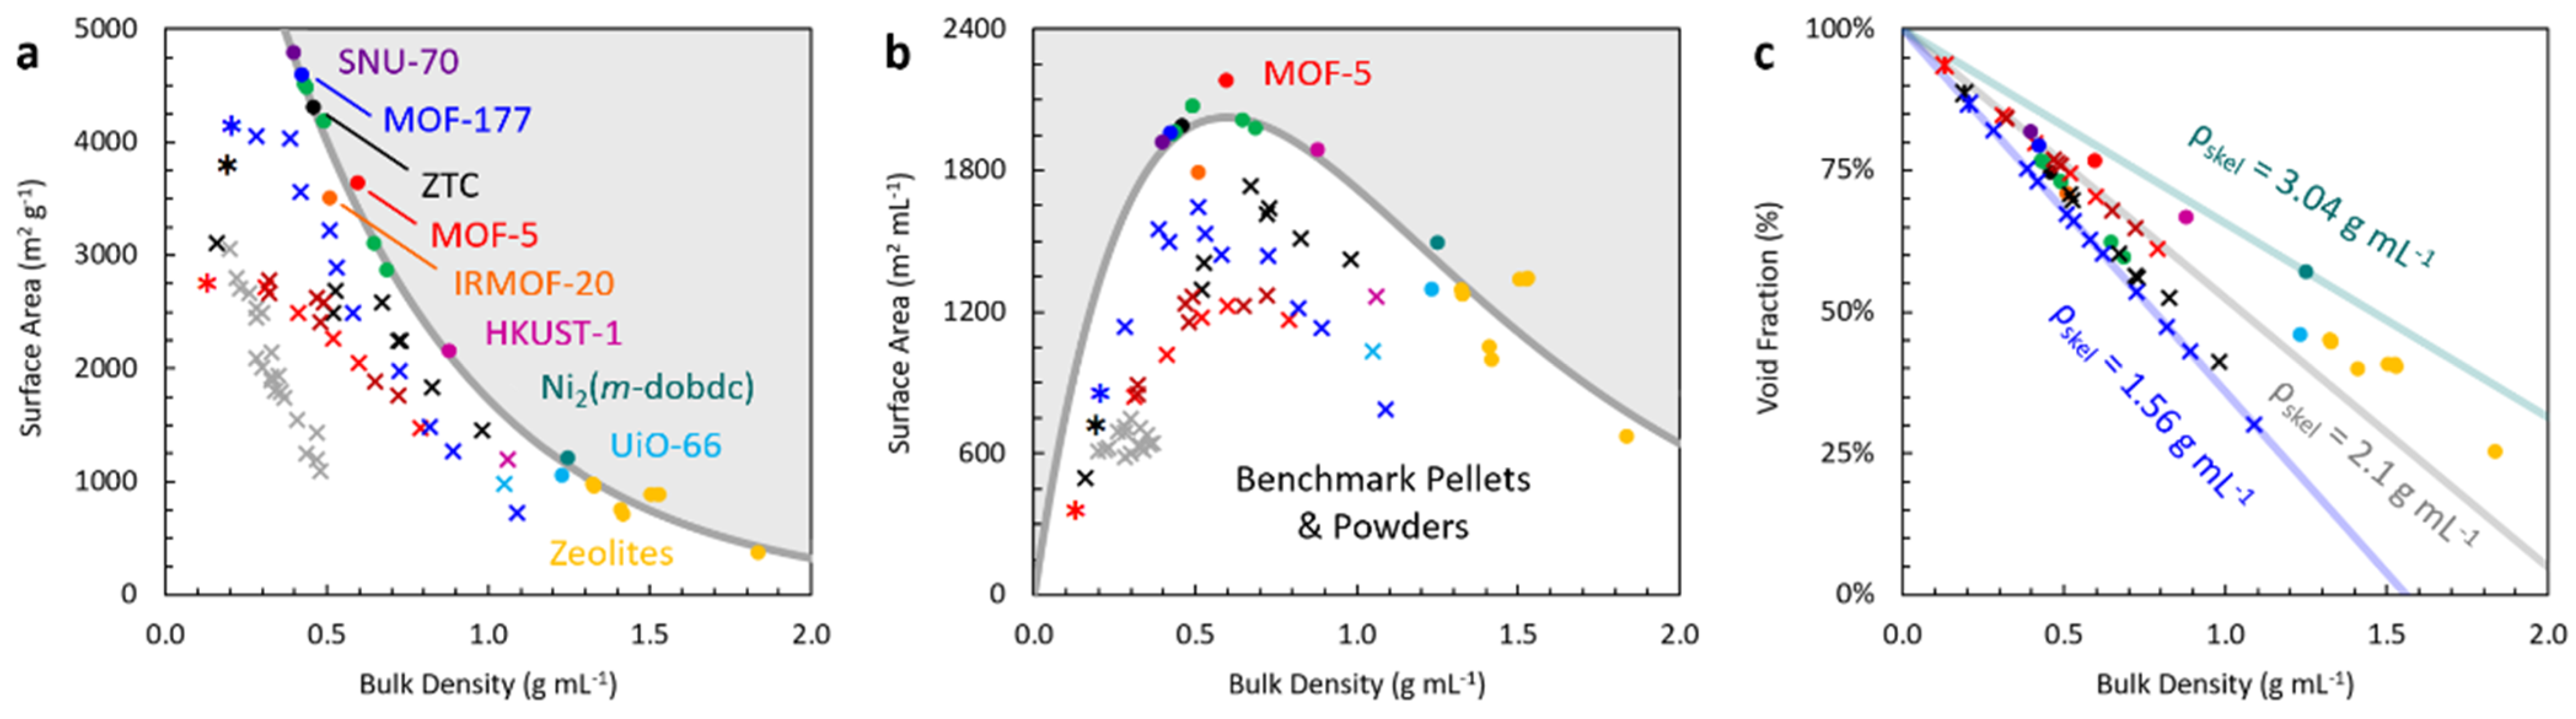
The apparent density of a porous adsorbent plays a crucial role in its volumetric storage properties; its ultimate density is limited both intrinsically (as a function of the ideal density of the crystal and its mechanical properties) and as a function of packing. Adsorptive energy storage is a surface-based phenomenon, and therefore the amount of surface that is packable within a given three-dimensional volume is of high importance in adsorbent design toward high volumetric storage and delivery. Guiding relationships between the properties related to the compaction of free-standing, three-dimensional porous solids are shown in Figure 3 and Table 2. By inspection of Figure 3a, the gravimetric surface area monotonically increases with decreasing density, approximately exponentially. An experimental study of porous carbons derived from coconut shells prepared by physical activation under varying conditions within a rotary kiln under CO2 atmosphere also shows that higher density corresponds to lower gravimetric surface area (shown as grey × s in Figure 3a) [40]. Several other benchmark series of pellets and powders reveal intricate trends dependent on materials stability; the precise trend within a given series depends on the nature of the three-dimensional geometry. As shown in Figure 3b, a maximum in volumetric surface area for crystals persists at a bulk density of ~0.6 g mL−1 (the results presented herein are based on a small subset of known materials, but are consistent with large-scale computational screening of real [16] and hypothetical [41] materials). This density can be seen as an optimal packing density of “surface” within three-dimensional porous media, from a materials design perspective.
Porous materials prepared using conventional synthesis methods are in the form of powders; the presence of large void spaces between the individual crystallites results in packing densities that are generally a factor of 2–10 lower than their single crystal densities. In general, the apparent density and ultimate compaction density of a substance depend on factors such as crystal size, shape, and friction [42,43]. Manual agitation (“tapping”) of the powder is the simplest method of densification. High-quality MOF-5 powder, for example, can typically reach a hand-tapped density of 0.13 g mL−1 (compared to its single-crystal density of 0.599 g mL−1) [32]. This reduction in density has the effect of reducing the total volumetric storage density at 77 K and 100 bar by 36% and, more importantly, the total volumetric delivery (5–100 bar, 77 K) by 10% (Figure 2e,f). The latter reduction is nearly the entirety of the gain realized by adding MOF-5 to the container (13% over pure compression for crystalline MOF-5). Therefore, the use of appropriate densification methods to obtain structurally coherent and robust morphologies with high packing densities is necessary for their application in adsorption-based hydrogen storage systems.
Densification can be accomplished by manual agitation (tapping), mechanically assisted agitation (e.g., “jolting”), mechanical compaction in a press, pelletization via the use of a binder, hot-pressing, or dedicated bottom-up synthesis methods, in addition to more exotic techniques. In this review, we differentiate between monoliths and pellets by the following distinction: monoliths have a continuous, homogeneous morphology whereas pellets are characterized by distinct morphological regions, typically owing to the presence of a dissimilar active material and binder [21]. Monoliths typically have higher mechanical stability than pellets; overall, the stability and cohesion characteristics of the native crystals give rise to different characteristics toward densification, often favouring zeolites and carbon-based powders over MOFs. A notable example is that of HKUST-1, which significantly decomposes under moderately severe compaction conditions [44]. Lastly, while increasing density is important for achieving high hydrogen storage and delivery, the use of a densified adsorbent as the storage medium requires considerations of thermal conductivity [20,37], outside the scope of this review.
3.1. Tapping and Jolting
The increase in density of a powder by the mechanical striking of a container holding it is referred to herein as “tapping.” When persistent (typically automated) assistance is provided by a mechanical tapping device, we refer to this method herein as “jolting.” The same physical process is occurring in both cases, but the former is used to refer to the human-controlled process of dropping a container from a constant height (typically within a graduated cylinder or known volume container) whereas the latter is performed by a device such as a jolting volumeter [36] to obtain a more standardized result. It is also often the case that automated jolting results in a higher measured density owing to the larger number of eventual taps possible.
A study of porous carbons derived from coconut shells prepared by physical activation under CO2 atmosphere shows that higher density (under standard tapping conditions) corresponds to lower gravimetric surface area in the random pore networks of activated carbon (shown as grey × s in Figure 3a) [40]. However, densification is also possible for a given material while keeping the gravimetric surface area constant. For MOF-5, jolting resulted in a significant increase in bulk density from 0.13 to 0.22 g mL−1 [36]. This indicates a very significant improvement in volumetric storage and delivery (Figure 2e,f) of 70% (by comparison to pure compression). This effect needs further investigation across a wider range of porous materials, especially for high surface area and low-density powders such as ZTC, MOF-177, and SNU-70.
We note that tapping or jolting densities may be applied as the bulk density, , of any powder sample without further justification, which is not the case for the more severe methods of densification described below. In other words, measurements of H2 uptake on a loose powder can be directly used to determine the volumetric quantity by applying the skeletal approximation (Equation (9)) together with the skeletal density and the highest tapping or jolting density achieved, whether measured before or after the adsorption experiments themselves.
3.2. Mechanical Compaction
Mechanical compaction is a commonly used powder densification method, in two distinct categories: light compaction (e.g., in a syringe or press under low compacting pressures of <10 MPa) or heavy compaction (e.g., in a hydraulic press at >10 MPa). In general, the maximum density achievable upon mechanical compaction depends on particle shape and size, as well as mechanical and chemical properties of the crystal (e.g., hardness [45]). In general, issues of instability do not plague carbons or zeolites [46], where the latter usually requires several GPa of compaction pressure to undergo pore collapse [47]. The low mechanical stability of some MOFs, however, can severely restrict the range of allowable compaction pressures; such destruction of the porous structure has very significant effects on the subsequent adsorption properties of the material. This effect is well-known in the case of HKUST-1 [44,48]. The porous fidelity of several other MOFs has been reported to significantly degrade upon compaction to densities >50% of the crystalline density (at pressures up to ~80 MPa) [32]. However, for MOFs with better mechanical strength, such as UiO-66 and its analogues, a less severe degradation occurs [49]. We note that such effects have a strong dependence on the purity and crystallinity of the material. There are numerous reports on the severe mechanical compaction of MOFs and the stability limits thereof [49,50,51,52].
In a representative study, densified MOF-177 was prepared by uniaxial compression in a cylindrical die between 0 and 980 MPa to obtain neat monoliths with densities between 0.39 and 1.4 g mL−1 (compared to a crystalline density of 0.43 g mL−1) [53]. This range of densities allowed for a broad survey of hydrogen storage and delivery as a function of structural properties, well beyond the range accessible by tapping or jolting. In such studies, the reduction in surface area and pore volume is crucial to the final results, and materials properties specific to each monolith or densified powder must be reported in combination with dedicated hydrogen uptake measurements. In this review, we ultimately focus on the pellet of lowest density (0.39 g mL−1) as the contender for highest PS delivery at 77 K.
Furthermore, mechanical compaction at elevated temperatures (i.e., hot-pressing) can be used for the effective densification of low-density porous materials. In a representative study, zeolite-templated carbon (ZTC) was densified up to 0.89 g mL−1 at 573 K and 147 MPa [54]. Under such severe conditions, the pore size distribution was significantly altered upon densification, but reasonable mechanical integrity of the pellets and very high volumetric surface areas could be achieved (up to 1340 m2 mL−1).
Other routes to high-density powders include template synthesis within pre-compacted (pelletized) templates [55] and mechanical compression prior to activation (i.e., “compactivation” [56]). By the former approach, the density of ZTC could be increased to 0.88 g mL−1 (roughly double that of “pristine ZTC”), and volumetric surface areas up to 1670 m2 mL−1 were reported [55]. Importantly, the native structure of the zeolite was preserved upon its pelletization (prior to template carbonization), indicating preservation of the isotropic structure of the resulting dense ZTC powder (in contrast to dense ZTC monoliths, which exhibited a loss in pore-to-pore regularity perpendicular to the direction of pressing [57]).
While it is common for researchers to compact a material after measuring its adsorption properties as a loose powder [58,59,60], estimates of volumetric H2 storage and delivery based on the mechanically compacted density should not be reported this way. Both “light” and “heavy” mechanical compaction should be treated in the same way; H2 uptake measurements must be made on the material after compaction and measurement of the compaction density. Mechanical compaction and density measurement directly within the adsorption sample cell is a rare but practical alternative to ex situ density determination, when the preparation of a monolithic sample is not possible [32].
3.3. Binders/Pelletization
Additives can be used for numerous reasons to assist in the densification process of low-density porous powders, and especially to obtain free-standing pellets or monoliths. Commonly used binders include polytetrafluoroethylene (PTFE), polyvinylidene fluoride (PVDF), polyvinyl alcohol (PVA), and cellulose esters. A key design feature of pelletization in the presence of binder is to minimize obstruction of the permanent porosity of the active material. The specific relationship between a given material and binder must typically be empirically optimized, an effort-intensive process. In general, smaller particles sizes and larger pore sizes are more adversely affected by the inclusion of polymeric binders [61]. Numerous examples of such studies exist, across porous carbons [62,63,64,65] and MOFs [66,67,68,69]. We note that the preparation of small pellet sizes or non-space-filling pellet shapes (e.g., spheres [70]) is somewhat less effective for predicting overall system volumetrics, since pellet packing could once again lead to significant inter-pellet void volume.
A representative example of the rational design of binder-particle interactions is in the hot-pressing of small particles (~200 nm) of ZTC with judiciously-sized connective sheets (~1 μm) of reduced graphene oxide (rGO) as a binder [57]. The rGO binder fills the inter-particle void space and tightly binds the ZTC particles while still providing access to the inner particle pore network; density was reported to be tunable over a wide range (up to 0.98 g mL−1), providing mechanically robust monoliths of pure graphene-like carbon.
Additives may also be included for other purposes than binding, for example to improve thermal conductivity. In a representative example, MOF-5 pellets were prepared with varying concentrations of expanded natural graphite (ENG) by mechanical compaction up to ~0.5 g mL−1 [37]. The same range of bulk density could be achieved for both neat pellets and ENG-containing pellets. Interestingly, while the addition of ENG caused a reduction in total volumetric H2 capacity for comparable pellets, a similar delivery among ENG-containing and neat pellets could be achieved (as shown in Figure 2d,e).
3.4. Direct Monolith Synthesis
The use of binders to aid in the densification of porous materials can cause pore-blockage, reducing the accessibility of the pore network to gas molecules; densification methods that do not involve the use of a secondary component are therefore preferable for hydrogen storage applications. In principle, large single crystals with space filling shapes (e.g., cubes) would be the optimal hydrogen storage medium. While the largest synthetic crystals of some higher density zeolites can reach up to >1 cm in size (e.g., sodalite [71]), single crystals of larger pore zeolites [72] and all MOFs [73,74] are currently restricted to the millimeter scale. Conventional synthesis yields nano- to micro-size crystals or particles; for example, the average crystal size in MOF-5 powder is ~0.4 μm [36] but can also be readily produced up to the sub-mm size (see Figure 1c). Therefore, measurements of gas adsorption on macroscopic single crystals of zeolites and MOFs (with hand-measured external dimensions) is still not possible.
Strategies to synthesize polycrystalline MOFs as homogeneous monoliths fall into two categories: conversion of an existing monolith (i.e., coordination replication) or via a sol-gel approach [21]. The former approach leverages acid-base reactions to directly convert a preformed, three-dimensional metal oxide/hydroxide/oxyhydroxide monolith into an analogous MOF monolith. A representative example is that of mechanically robust HKUST-1 monoliths derived from a copper hydroxide replica [75]. In this case, a reduced surface area of only 1315 m2 g−1 could be achieved, roughly half that of powder HKUST-1, and monolith density was not reported. Early work in this area has not focused on the goal of increasing monolith density.
By leveraging the viscoelastic properties of their precursor gels, robust monoliths of numerous MOFs have also been prepared by a sol-gel approach [76]. By removing the solvent from a rationally designed gel, dense monoliths (even exceeding the crystalline density) can be prepared in a diversity of mold shapes and sizes while minimizing pore blocking of the product. Three contributing factors to the success of the sol-gel approach are the size of the native particles in the gel, the speed of nucleation and crystal growth processes, and the severity of the drying process. Typically, mild drying conditions are favoured to achieve monolithic morphologies; high-density HKUST-1 monoliths of ~1 mL in volume were prepared by drying at 313 K [77] while similar UiO-66 monoliths (~7 mm in size) were prepared by drying at 303 K [78]. In both cases, a very large enhancement in volumetric methane storage was reported. Recently, a ligand-assisted approach was applied in the preparation of ZIF-8 monoliths on the millimeter scale with up to >1 g mL−1 in density and ~90% of the gravimetric surface area of the powder [79].
4. Volumetric Hydrogen Storage
Gravimetric hydrogen storage equilibria have been reported on a vast number of adsorptive materials, roughly categorized as silicates (e.g., zeolites), porous carbons (including activated carbons, templated carbons, carbon aerogels, polymers, porous aromatic frameworks, and covalent-organic frameworks), metal-organic frameworks (MOFs), and “beyond” traditional framework materials (e.g., porous organic and metal-organic cages). For the purposes of this review, the main criteria for inclusion of data were: a high-quality set of excess H2 uptake measured at 77 K and/or 298 K up to 100 bar, and a high-quality crystal structure or periodic model of the material for crystalline analysis and comparison to experimental powders and pellets. Many promising adsorptive storage materials have only been investigated at pressures well below 100 bar, or without analysis of powder or pellet densities, precluding their analysis herein. Likewise, a large number of disordered materials (e.g., activated carbons) may exhibit exceptional H2 storage or delivery, but the lack of a fundamental link between these results and the structure or chemistry of the porous framework prevents insightful apples-to-apples analysis. The three subclasses of materials reviewed herein are: zeolites, porous carbons (with a focus on templated carbons), and MOFs.
4.1. Zeolites
Zeolites are crystalline tectoaluminosilicate materials with low framework densities, permitting the presence of molecularly accessible pores with well-defined structure and chemistry [80]. In principle, high-density H2 storage in zeolites (especially those with narrow pores and low framework volume) seems like a viable strategy. The presence of aluminum in the crystal structure of many synthetic zeolites gives rise to the presence of a counterion (e.g., Na+), and hence hydrogen uptake is dependent on the type and number of cations. Very generally, binding energies of H2 toward silica are similar as toward carbon [81]; however, the framework weight is higher (~SiO2 as opposed to ~C) and the crystalline void fraction, , is much lower (see Table S1). Little attention has been paid to zeolites as reasonable candidates for H2 storage, likely owing to very low gravimetric and volumetric uptake, but a direct comparison to porous carbons and MOFs is informative.
In order to assess the viability of zeolites as hydrogen storage media in apples-to-apples comparison with porous carbons and MOFs, high-pressure adsorption equilibria (up to 100 bar) at both 298 K and 77 K are necessary. Unfortunately, such data are rarely reported; even higher pressure studies are mostly limited to modest pressures (e.g., <20 bar [82]). Two exceptions are the report of H2 uptake on LTA and FAU-type zeolites at 77 K up to 70 bar [83], and the report of H2 uptake on an FAU-type zeolite at 298 K up to 35 bar [84]. These data reveal that despite the high volumetric density of micropores, FAU-type zeolites exhibit poor total volumetric hydrogen uptake and delivery at both 298 K and 77 K, in comparison to porous carbons and MOFs (as shown below).
4.2. Porous Carbons
A vast majority of porous carbon materials that serve as candidates for volumetric hydrogen storage/delivery are non-crystalline. While this does not diminish the practical outlook for such disordered materials, it proves difficult for the reviewer to discern between anomalous reports and physically insightful (rationally designable) strategies for application and comparison of these materials to crystalline zeolites and MOFs. To this end, we focus herein on zeolite-templated carbon (ZTC), a locally disordered high-surface area carbon framework that retains the pore-to-pore ordering of its native template (e.g., an FAU-type zeolite). The long-range order imparted by the zeolite template, combined with a myriad of measured experimental properties gives rise to a highly accurate periodic model of faujasite-type ZTC (Nishihara Model II [85]), which can be directly compared to crystal structures measured for MOFs. A further improvement on Modell II accounts for the presence of oxygen-bearing functional groups, and their typical relative composition within ZTC [86]; this periodic model of composition C0.71H0.24O0.05, serving as the most accurate structural and chemical model of experimentally synthesized ZTC, was employed for the crystalline approximation herein (shown in Figure 4d).
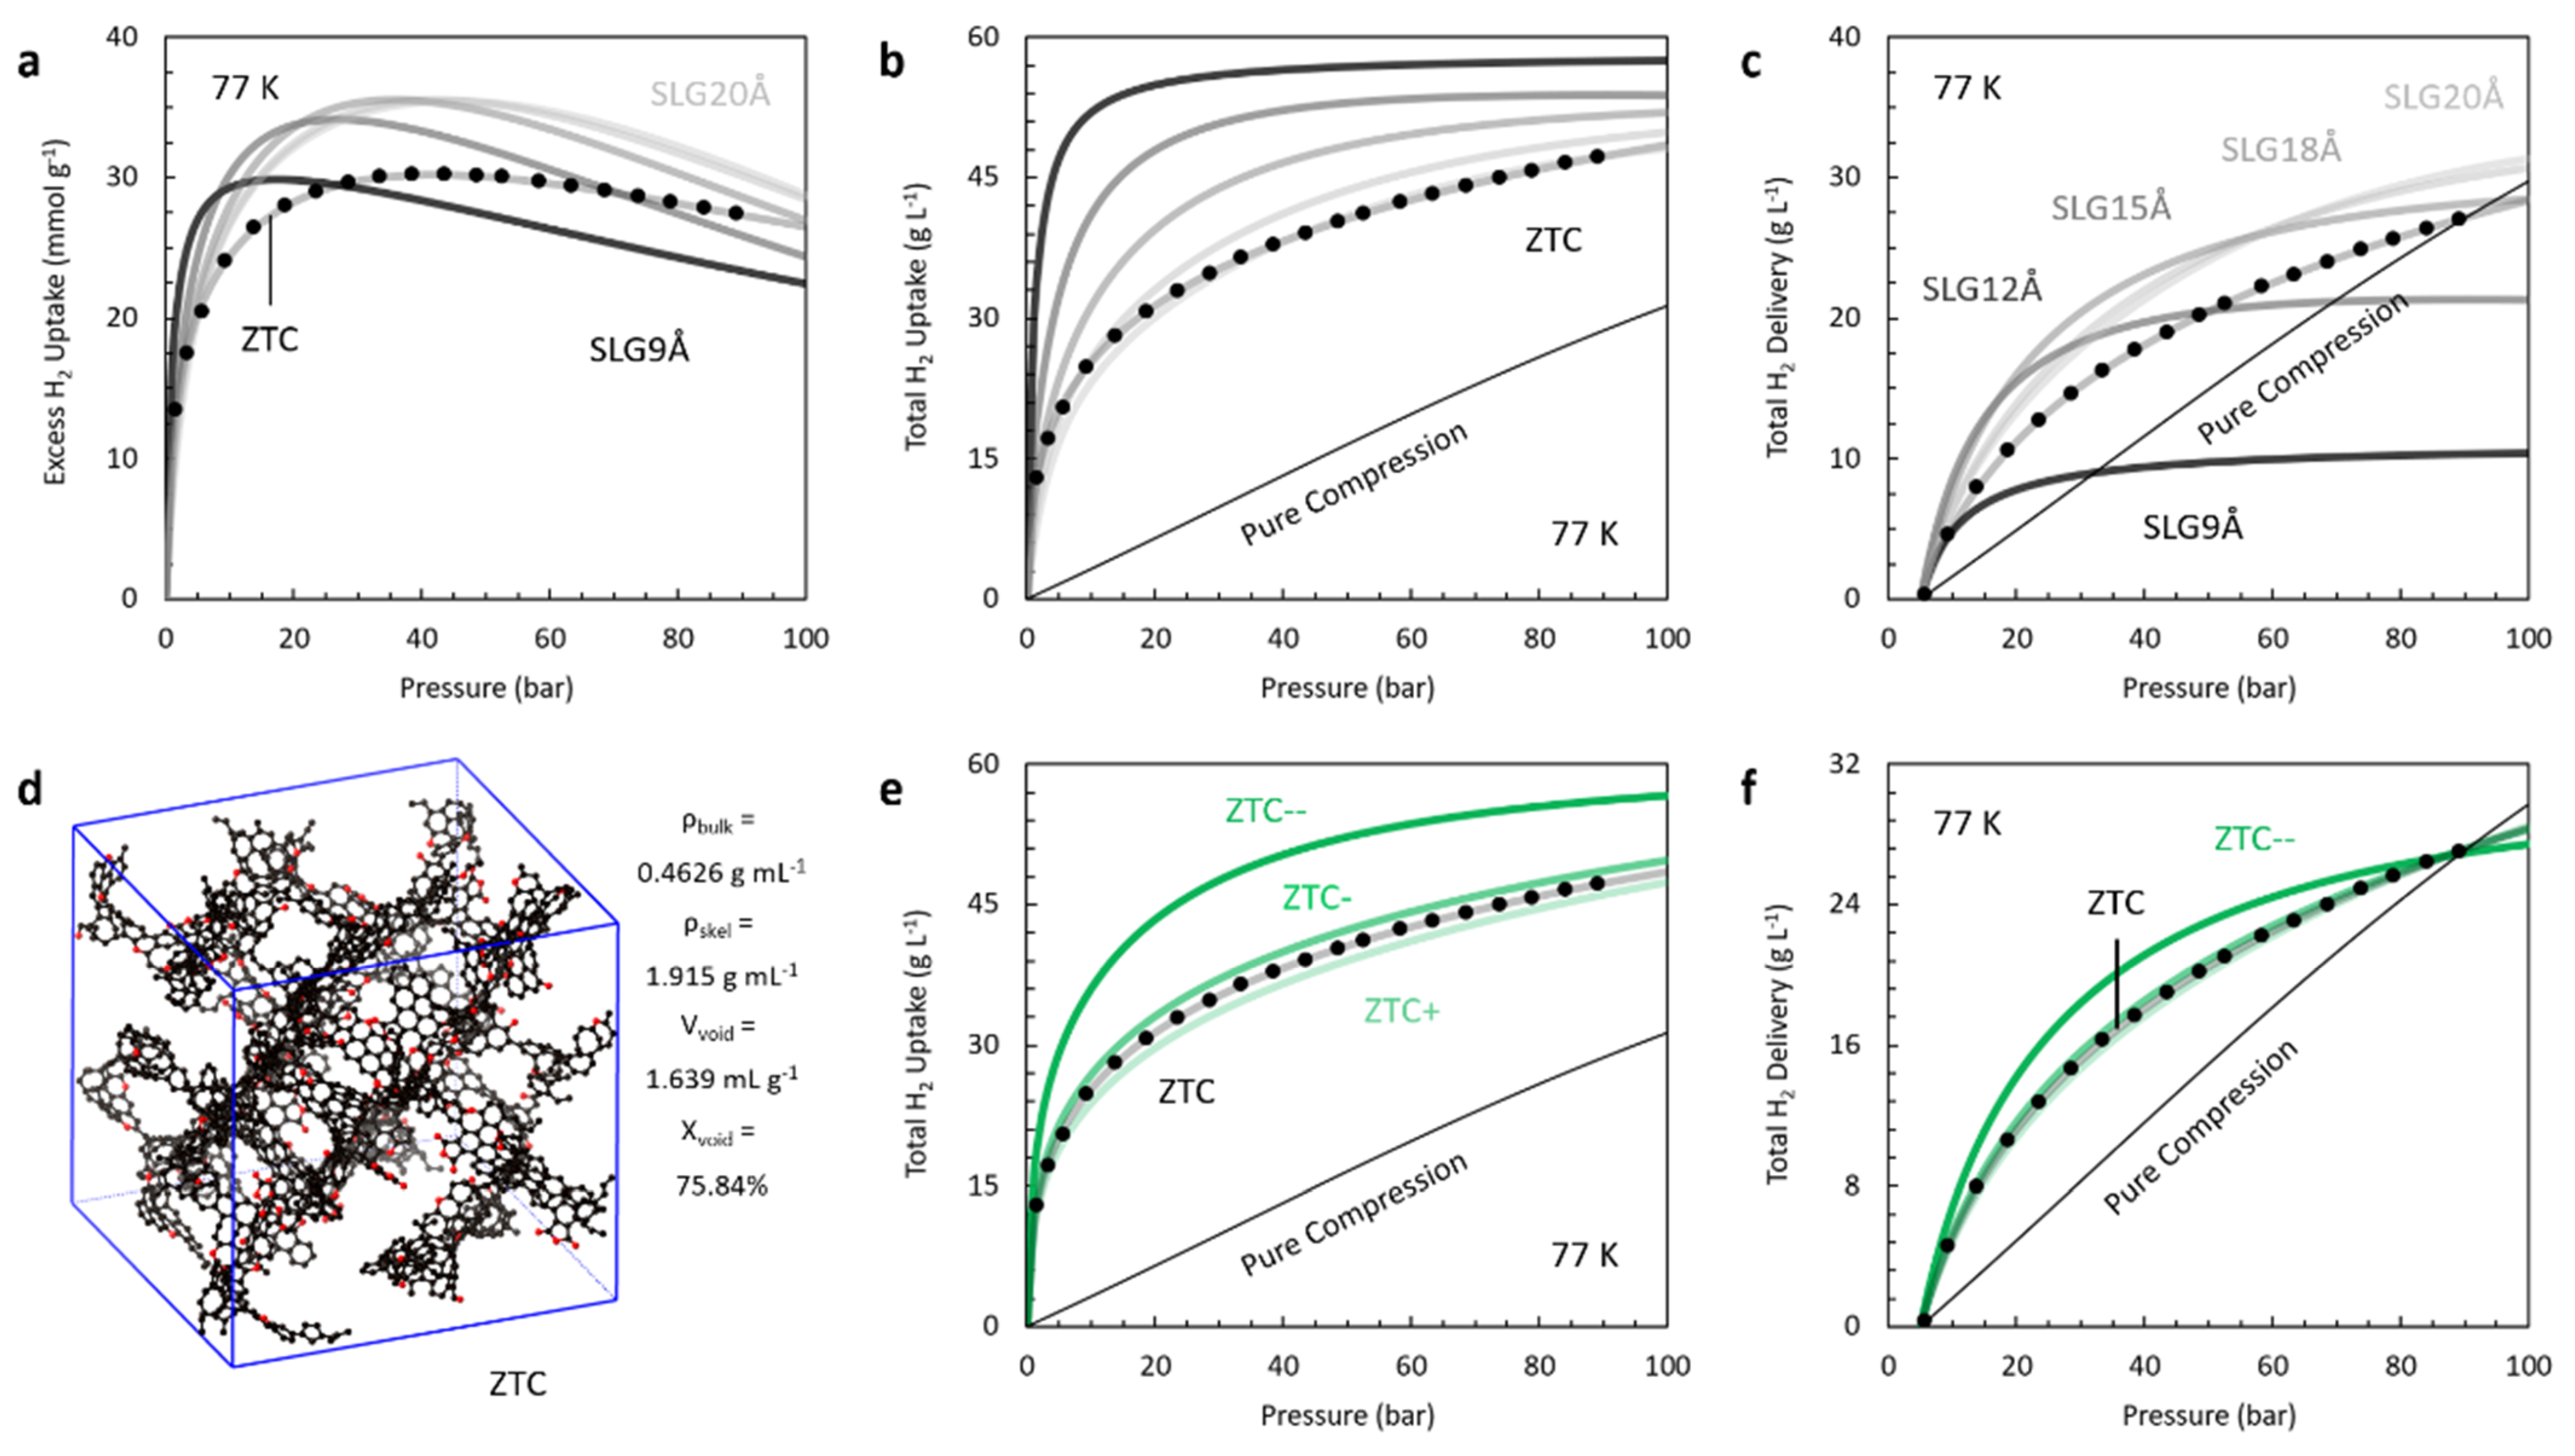
Gravimetric excess H2 uptake on archetypical ZTC has been measured across numerous laboratories; a representative set of data between 0 and 100 bar at 77 K is shown in Figure 4a. The crystalline limit of volumetric H2 storage and delivery are shown in Figure 4b,c. The measured pore-size distribution of ZTC is highly homogeneous, and centered at a width of 12 Å (corresponding to a pore-to-pore spacing of 14 Å). At low pressures, the H2 delivery on crystalline ZTC is significantly greater than that of pure compression, with a maximum difference at 30 bar (Figure 4c). However, delivery at higher pressures wanes in comparison to pure compression, and intersects the pure compression line at 90 bar; above this pressure, the experimental data reveal that even a single crystal of pristine ZTC would not deliver more H2 than an empty vessel of the same volume at 77 K.
For comparison, simulations [87] of H2 adsorption at 77 K on idealized single-layer graphene (SLG) slit pore crystals held at different lattice spacings between 9 and 20 Å are also shown in Figure 4a–c. Several guiding trends arise for these idealized crystalline porous carbons: narrower slit pores lead to a higher volumetric storage at lower pressure, and therefore vastly lower volumetric delivery at practical pressures. Since total volumetric uptake effectively plateaus at similar maximum hydrogen densities for each model (slight differences arise owing to the presence of more or less carbon in the system), the ultimate H2 delivery plateaus at very different quantities owing to the different low-pressure behaviour of each model. The intersection of the H2 delivery curve with the pure compression line occurs at higher pressures for less dense SLG carbons (Figure 4c). While delivery is highest at low pressures for the slit pores spaced at 12–15 Å (corresponding to ~9–12 Å effective pore widths), delivery above 100 bar is maximized by the widest spaced model (20 Å spacing, exhibiting a ~17 Å effective pore width). Crystalline ZTC intersects the pure compression line at 90 bar, remarkably consistent with its ~12 Å homogenous pore spacing. The difference in curvature between the SLG models and ZTC might be attributable to inherent differences in two- as opposed to three-dimensional pore structure, respectively. We note that all of the SLG models are purely hypothetical, but lend very significant insight into H2 storage and delivery in three-dimensional porous carbons of similar effective pore width. Other lower dimensional models (such as carbon chains [88]) and higher dimensional models (such as carbon foams [89], pillared grapheme [90], and schwarzites [91]) should be further investigated to elucidate the effects of dimensionality on ultimate adsorptive storage and delivery limits.
Lastly, to investigate the fundamental effects of isotropic expansion and contraction of a crystalline, three-dimensional framework material, H2 storage and delivery on native ZTC is compared to that on three hypothetical models (ZTC+, ZTC-, and ZTC--), assuming that the same excess uptake would be measured regardless of volumetric density (see Figure 4e,f). The properties of these models are shown in Table 3; the bulk density varies from 0.43 (ZTC+) to 0.46 (ZTC), 0.50 (ZTC-), and finally 0.69 (ZTC--) g mL−1, the widest range within which stable, three-connected porous models could be obtained. While total volumetric storage is directly proportional to density, delivery is increased with increased density at <90 bar, but decreased with increased density at >90 bar, the pressure at which H2 delivery intersects the pure compression line. In other words, isotropic compaction of ZTC, should it be possible, is always beneficial to H2 delivery up to the point of intersection of the native (uncompressed) model with the pure compression line.
While not the focus of this review, we note that it has been emphasized that high-surface area activated carbons, owing to their mechanical stability under compression as well as their abundance and cost-effective synthesis, are promising candidates for volumetric gas storage and delivery applications over MOFs [92]. Hydrogen uptake on several benchmark porous carbon powders has been measured at high pressures (up to 500 bar): ZTC3806 [57], CA3771 [60], AX2664, MSC3476, KUA2887, and ZTC3035 [93], MSC3420 [94], MSC3244 and ZTC3591 [95], MSC2680 and ZTC3800 [96], MSC3305, MSP2363, and SA2204 [97], and CAC3711 and ZTC3751 [98], the latter of which is referred to herein simply as ZTC. Assuming equivalent packed powder density and skeletal density across all of the porous carbons reviewed, the maximum H2 delivery at 100 bar is ~34 g L−1 at 77 K (a ~17% improvement over pure compression) and ~9 g L−1 at 298 K (a ~19% improvement over pure compression), as shown in Figures S29 and S30. In general, the volumetric H2 capacity and delivery at 77 K is similar to the best-performing MOFs, indicating no crucial role for the metal sites under cryogenic conditions. We further note that the mechanical stability of carbons allows for robust and dense compaction without a disruption of the native porosity, keeping porous carbons among the strongest candidates for adsorptive hydrogen storage and delivery in practical applications.
Figure 4.
Trends in volumetric H2 storage and delivery on idealized (crystalline) porous carbon models at 77 K. (a) Excess H2 uptake on ZTC powder compared to a series of single-layer graphene (SLG) slit pore models. The crystalline assumption is employed for ZTC using a periodic model [86]. (b,c) Total H2 uptake and delivery on ZTC and SLGs under the crystalline assumption. (d) Periodic model of ZTC and calculated structural parameters (2.4 Å diameter probe). (e,f) Total H2 uptake and delivery on ZTC and three expanded/contracted models of ZTC: 22% expanded (ZTC+), 22% contracted (ZTC-), and 69% contracted (ZTC--), all under the crystalline assumption. Excess H2 adsorption data were obtained from the following references: ZTC [98] and SLG slit pore models [87] (see Supplementary Materials).


Table 3.
Volumetric H2 storage calculations on idealized (crystalline) porous carbon models at 77 K (as shown in Figure 4).
Table 3.
Volumetric H2 storage calculations on idealized (crystalline) porous carbon models at 77 K (as shown in Figure 4).
| Model | Spacing (Å) | Pore Width (Å) | (g L−1) | Ref | ||
|---|---|---|---|---|---|---|
| 5 bar | 50 bar | 100 bar | ||||
| SLG9Å | 9.0 | 5.8 2 | 47.1 | 56.9 | 57.6 | [87] |
| SLG12Å | 12 | 8.7 2 | 32.5 | 53.0 | 53.8 | [87] |
| SLG15Å | 15 | 11.7 2 | 23.5 | 48.4 | 51.9 | [87] |
| SLG18Å | 18 | 14.7 2 | 19.1 | 43.6 | 49.8 | [87] |
| SLG20Å | 20 | 16.7 2 | 16.8 | 40.9 | 48.2 | [87] |
| ZTC [86] | 13.9 1 | 11.3 2 | 20.1 | 40.6 | 48.5 | [98] |
| ZTC+ | 14.2 1 | 12.3 2 | 18.9 | 39.0 | 47.4 | 3 |
| ZTC- | 13.6 1 | 11.7 2 | 21.4 | 42.3 | 49.8 | 3 |
| ZTC-- | 12.2 1 | 10.3 2 | 29.2 | 52.3 | 56.7 | 3 |
1 Calculated directly from the CIF; 2 Calculated from the CIF using Zeo++. 3 Calculated based on the adsorption data for ZTC [98].
4.3. Metal-Organic Frameworks
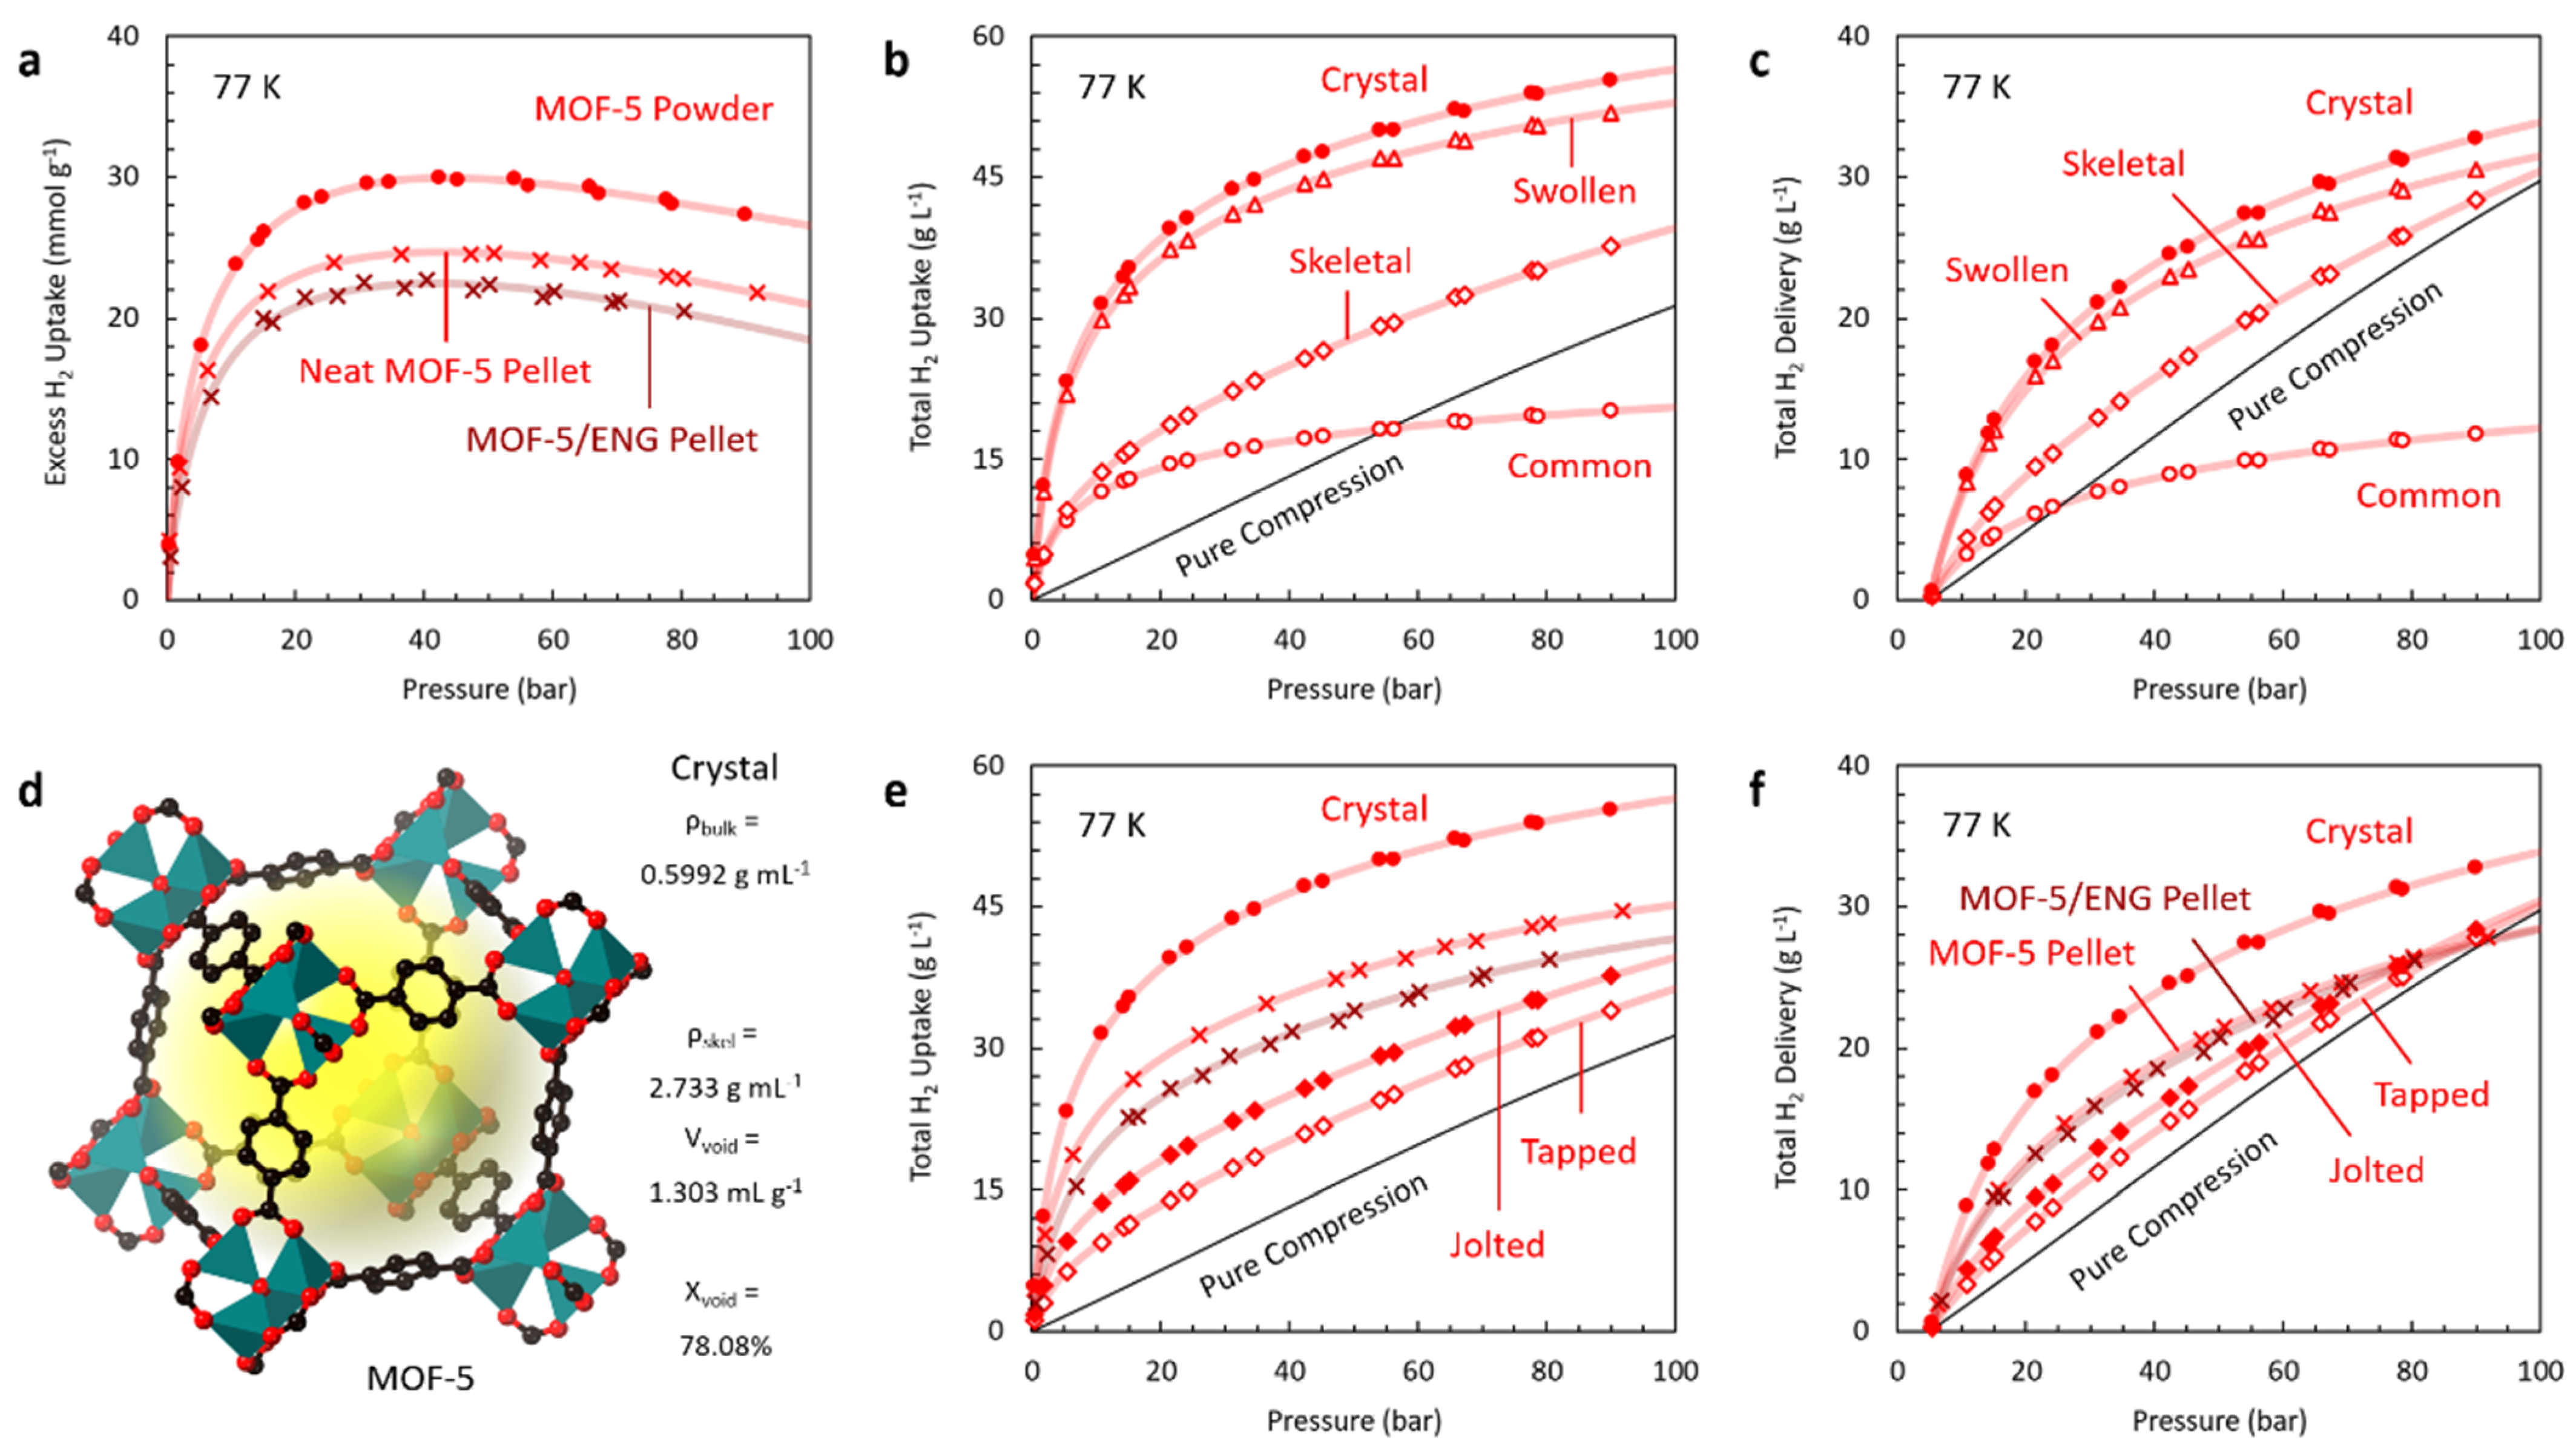
Metal-organic frameworks (MOFs) have been studied extensively with respect to their ultimate and practical H2 storage capacities [10,15,16,18,32,99]. For the purposes of this review, we focus on a selection of benchmark materials that satisfy the previously mentioned criteria of having high-quality H2 adsorption equilibria up to 100 bar and well-established crystal structures, while also requiring well-established synthesis procedures across multiple laboratories and with an emphasis on measurements of bulk density and densified variants (i.e., mechanically compacted powders, pellets, or monoliths). Minor variations in synthesis and processing can contribute to differences in the measured gravimetric excess H2 uptake on MOFs, in addition to errors in measurement. For example, Figure S1 shows five different adsorption isotherms for excess H2 uptake on the benchmark compound MOF-5, prepared by different groups using different starting materials and preparation conditions. In this case, the data reported by Ming and coworkers [36] were selected owing to their consistency with other reports at low pressures (where errors due to adsorption measurements are minimized) and physically sound behaviour at high pressures (exhibiting a clear excess maximum and subsequent nearly linear decrease), while the higher uptake reported by Kaye and coworkers [100] has never been reproduced. In this way, a single isotherm best representing each benchmark MOF was selected for further review herein.
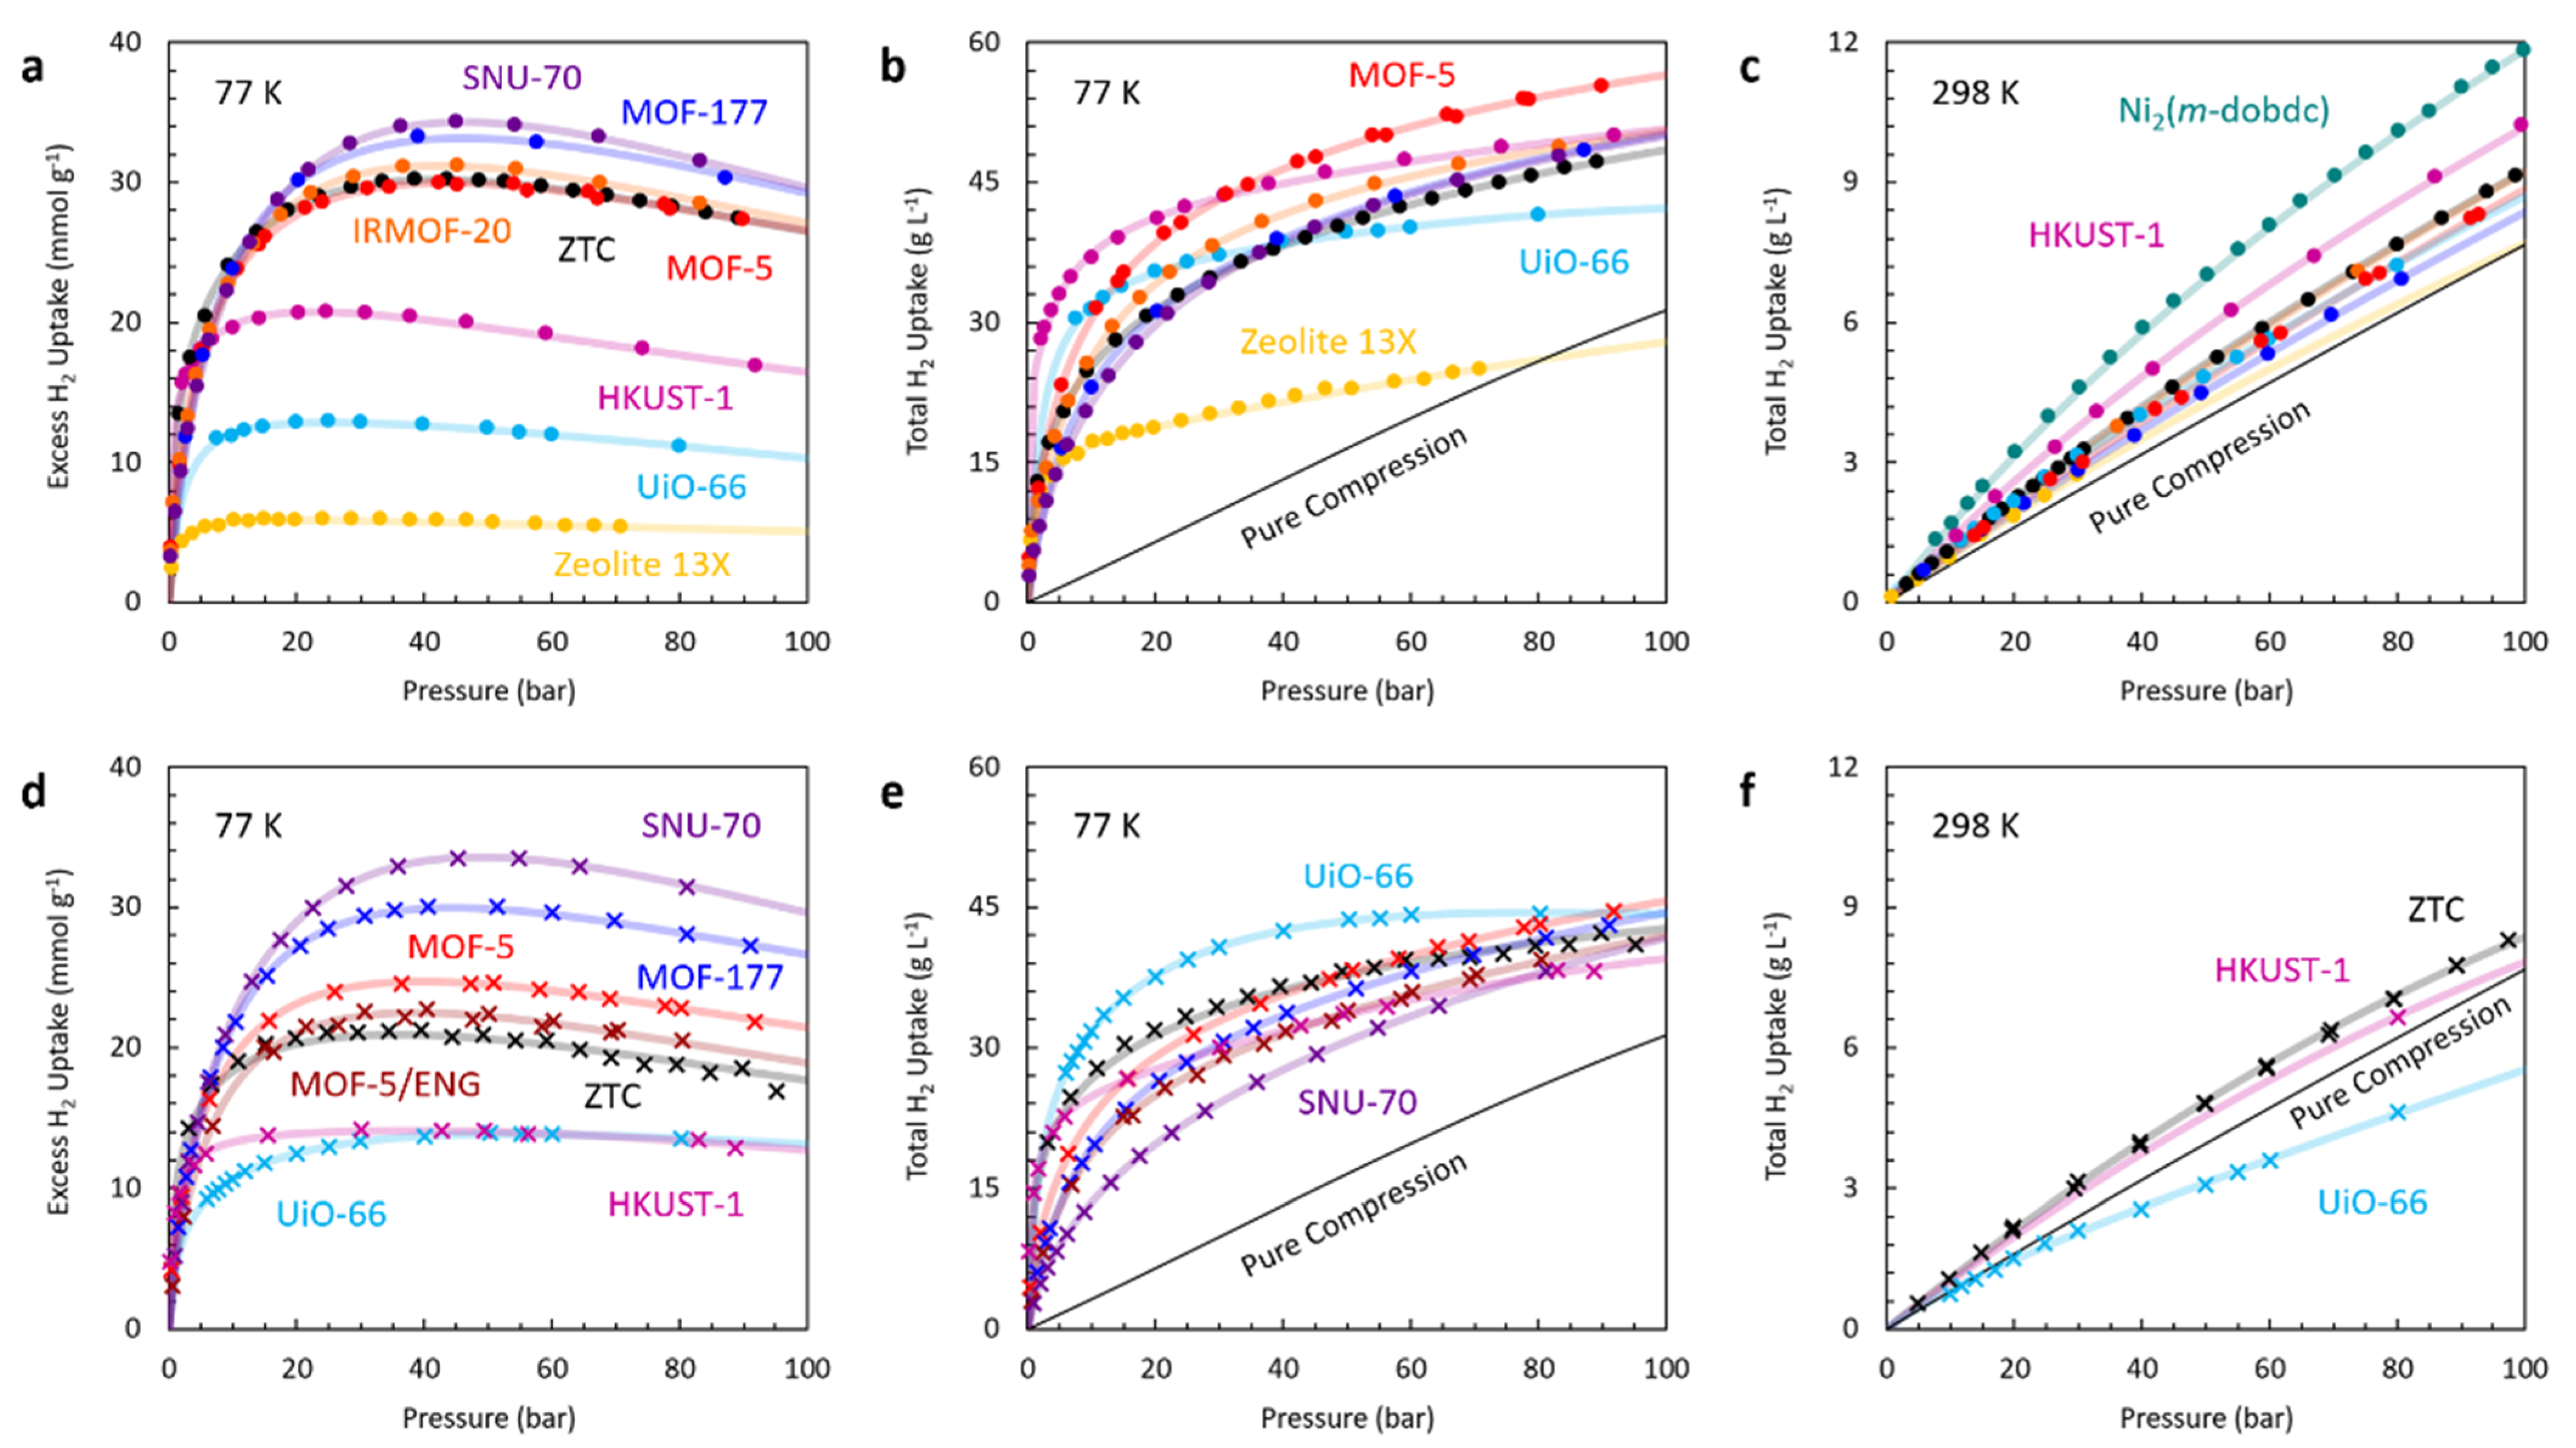
Calculations of the total volumetric storage capacity of seven benchmark MOFs at 77 K and 298 K are shown in Figure 5, under the crystalline assumption (based on powder samples, Figure 5a–c) and under the skeletal assumption (based on actual pelletized samples, Figure 5d–f). It is notable that the same trends among the crystalline materials are seen among the experimentally realized pellets, albeit at lower total uptake. A notable exception is that of pelletized UiO-66 [101] at 77 K (Figure 5e); however, judgement herein suggests this may be an erroneous result, owing to an unphysically low void fraction of 19% (a major outlier among other pelletized porous solids in this review). In general, adsorption leads to a remarkable increase in total volumetric H2 capacity at 77 K (up to 3.0× pure compression at 50 bar) and a modest increase at 298 K (up to 1.5× pure compression at 100 bar), in the crystalline limit. In actual pelletized samples, these figures are reduced to 2.3× at 77 K and 50 bar and 1.1× at 298 K and 100 bar, the latter of which suffers greatly from the lack of an actual pelletized or densified variant of Ni2(m-dobdc) (the current record material for free-standing pellets at 298 K is ZTC/rGO monoliths [57]).
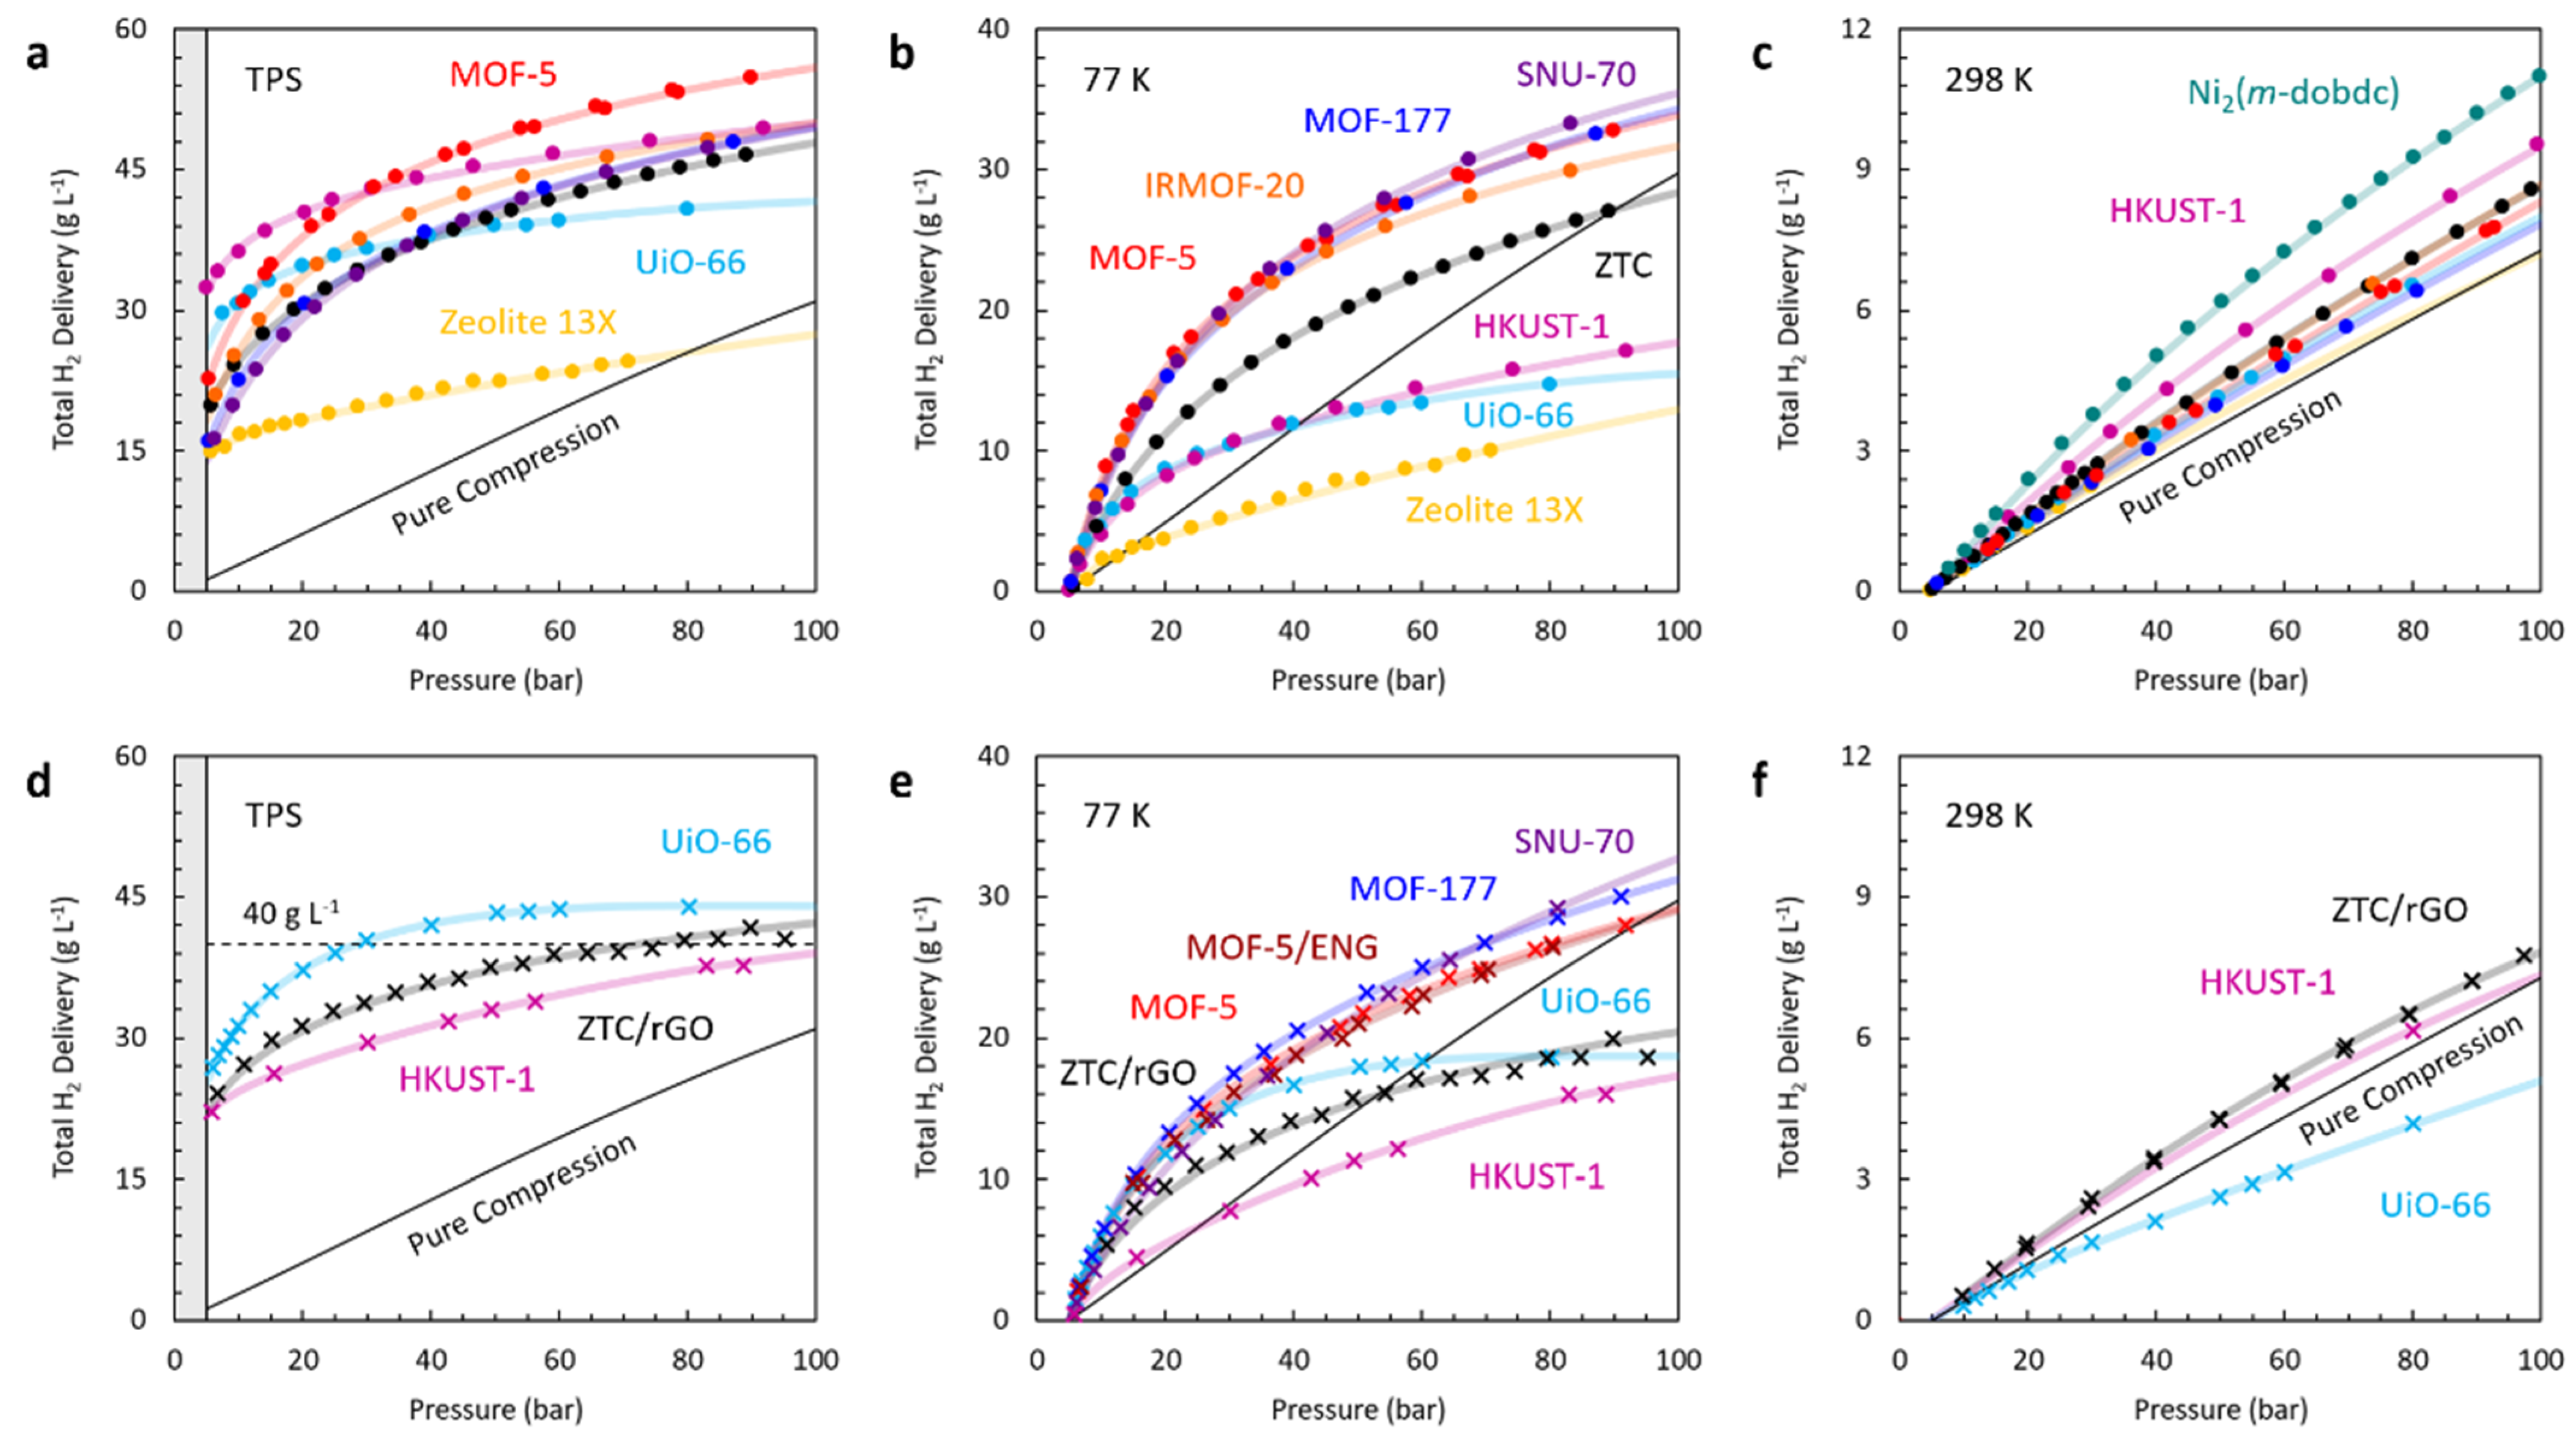
The corresponding calculations of total volumetric delivery of the same seven benchmark MOFs at 77 K and 298 K (based on Table 4) are shown in Figure 6, under the crystalline assumption (based on powder samples, Figure 6a–c) and under the skeletal assumption (based on actual pelletized samples, Figure 6d–f). As for total H2 capacity in Figure 5, the total H2 delivery in Figure 6 follows similar trends among crystals as among pellets/monoliths, though with even more significant reduction upon pelletization. Crucially, the pressure at which the PS H2 delivery at 77 K intersects the pure compression line is below 100 bar for all but the two best candidate pellets/monoliths: SNU-70 and MOF-177. The lightly pelletized/compacted SNU-70 variant exhibits the highest H2 PS delivery at 77 K and 100 bar in this review: ~33 g mL−1, a ~10% improvement over pure compression [32]. This value is remarkably consistent with the maximum improvement reported for any pelletized or compacted material under PS delivery at 298 K and 100 bar: ~8% over pure compression, in ZTC/rGO monolithic pellets [57]. While more significant improvement over pure compression can be achieved by adsorption under PS delivery at 77 K and 50 bar (e.g., ~23 g mL−1 on lightly pelletized/compacted MOF-177, ~53% over pure compression), delivery under PS at 298 K yields (to date) at most 22% improvement over pure compression at 50 bar.
As previously mentioned, a modest analysis of TPS delivery is also performed on the same benchmark MOFs between 77 and 298 K. While such a wide temperature range may not be directly practical, TPS storage/delivery between 77 and 160 K is considered a feasible [32,99] alternative to solely PS storage/delivery, but less high-pressure adsorption data exist at 160 K. Therefore, 298–77 K TPS delivery is a stand-in for “maximum delivery” based on adsorptive H2 storage within this review, and the results are shown in Figure 6a,d. Surprisingly, MOF-5 (the archetypical MOF), first synthesized by Yaghi and coworkers in 1999, remains to this day as the most promising candidate for maximum H2 delivery between 77 and 298 K: crystalline MOF-5 exhibits 56 g L−1 H2 delivery under TPS up to 100 bar, an 81% improvement over pure compression. The irony of this fact has been previously noted by Ahmed and coworkers [9]; a further peculiarity is the high performance of MOF-5 on both a gravimetric and volumetric basis, even among the thousands of real and hypothetical MOFs that have been computationally screened in the >20 years since its discovery [15].
The general effects of densification are aptly represented by measurements of hydrogen adsorption on MOF-5 powder and densified variants at 77 K, as shown in Figure 2. It is evident that the total volumetric uptake, , of the pellets is higher than that of pristine MOF-5 powder, at both tap density and at maximum powder (jolting) density. Relative to the neat MOF-5 pellets of equal density, the addition of ENG produces only a small decrease in . The penalty on the total volumetric hydrogen uptake is higher with the addition of ENG as a heat conductive additive. The PS H2 delivery of the benchmark (medium density, ~0.5 g mL−1) pellets of MOF-5 and MOF-5/ENG at 77 K are shown in Figure 6e. H2 delivery, ~21 g L−1 at 50 bar and ~29 g L−1 at 100 bar, is remarkably similar on both pellets, despite the lower total capacity of the MOF-5/ENG composite. These values fall short of the crystalline estimates for MOF-5 (shown in Figure 6b) by only ~14%, but it is enough to nullify any advantage of the pelletized MOF-5 adsorbent at 100 bar.
In general, the effect of pelletization seems to be an increase in total volumetric capacity over the loose powder, but a decrease in the pressure of intersection with the pure compression line (see Figure 2f). This effect is mimicked by the results obtained from idealized SLG porous carbon models (see Figure 4c) where larger pores exhibit lower delivery at low pressures, but higher delivery at high pressures. This effect is not appreciable at 298 K (see Figure 6c,f), within the pressure range explored herein (up to 100 bar); however, such effects are indeed expected to occur at pressures of 400–500 bar [93].
5. Guiding Principles
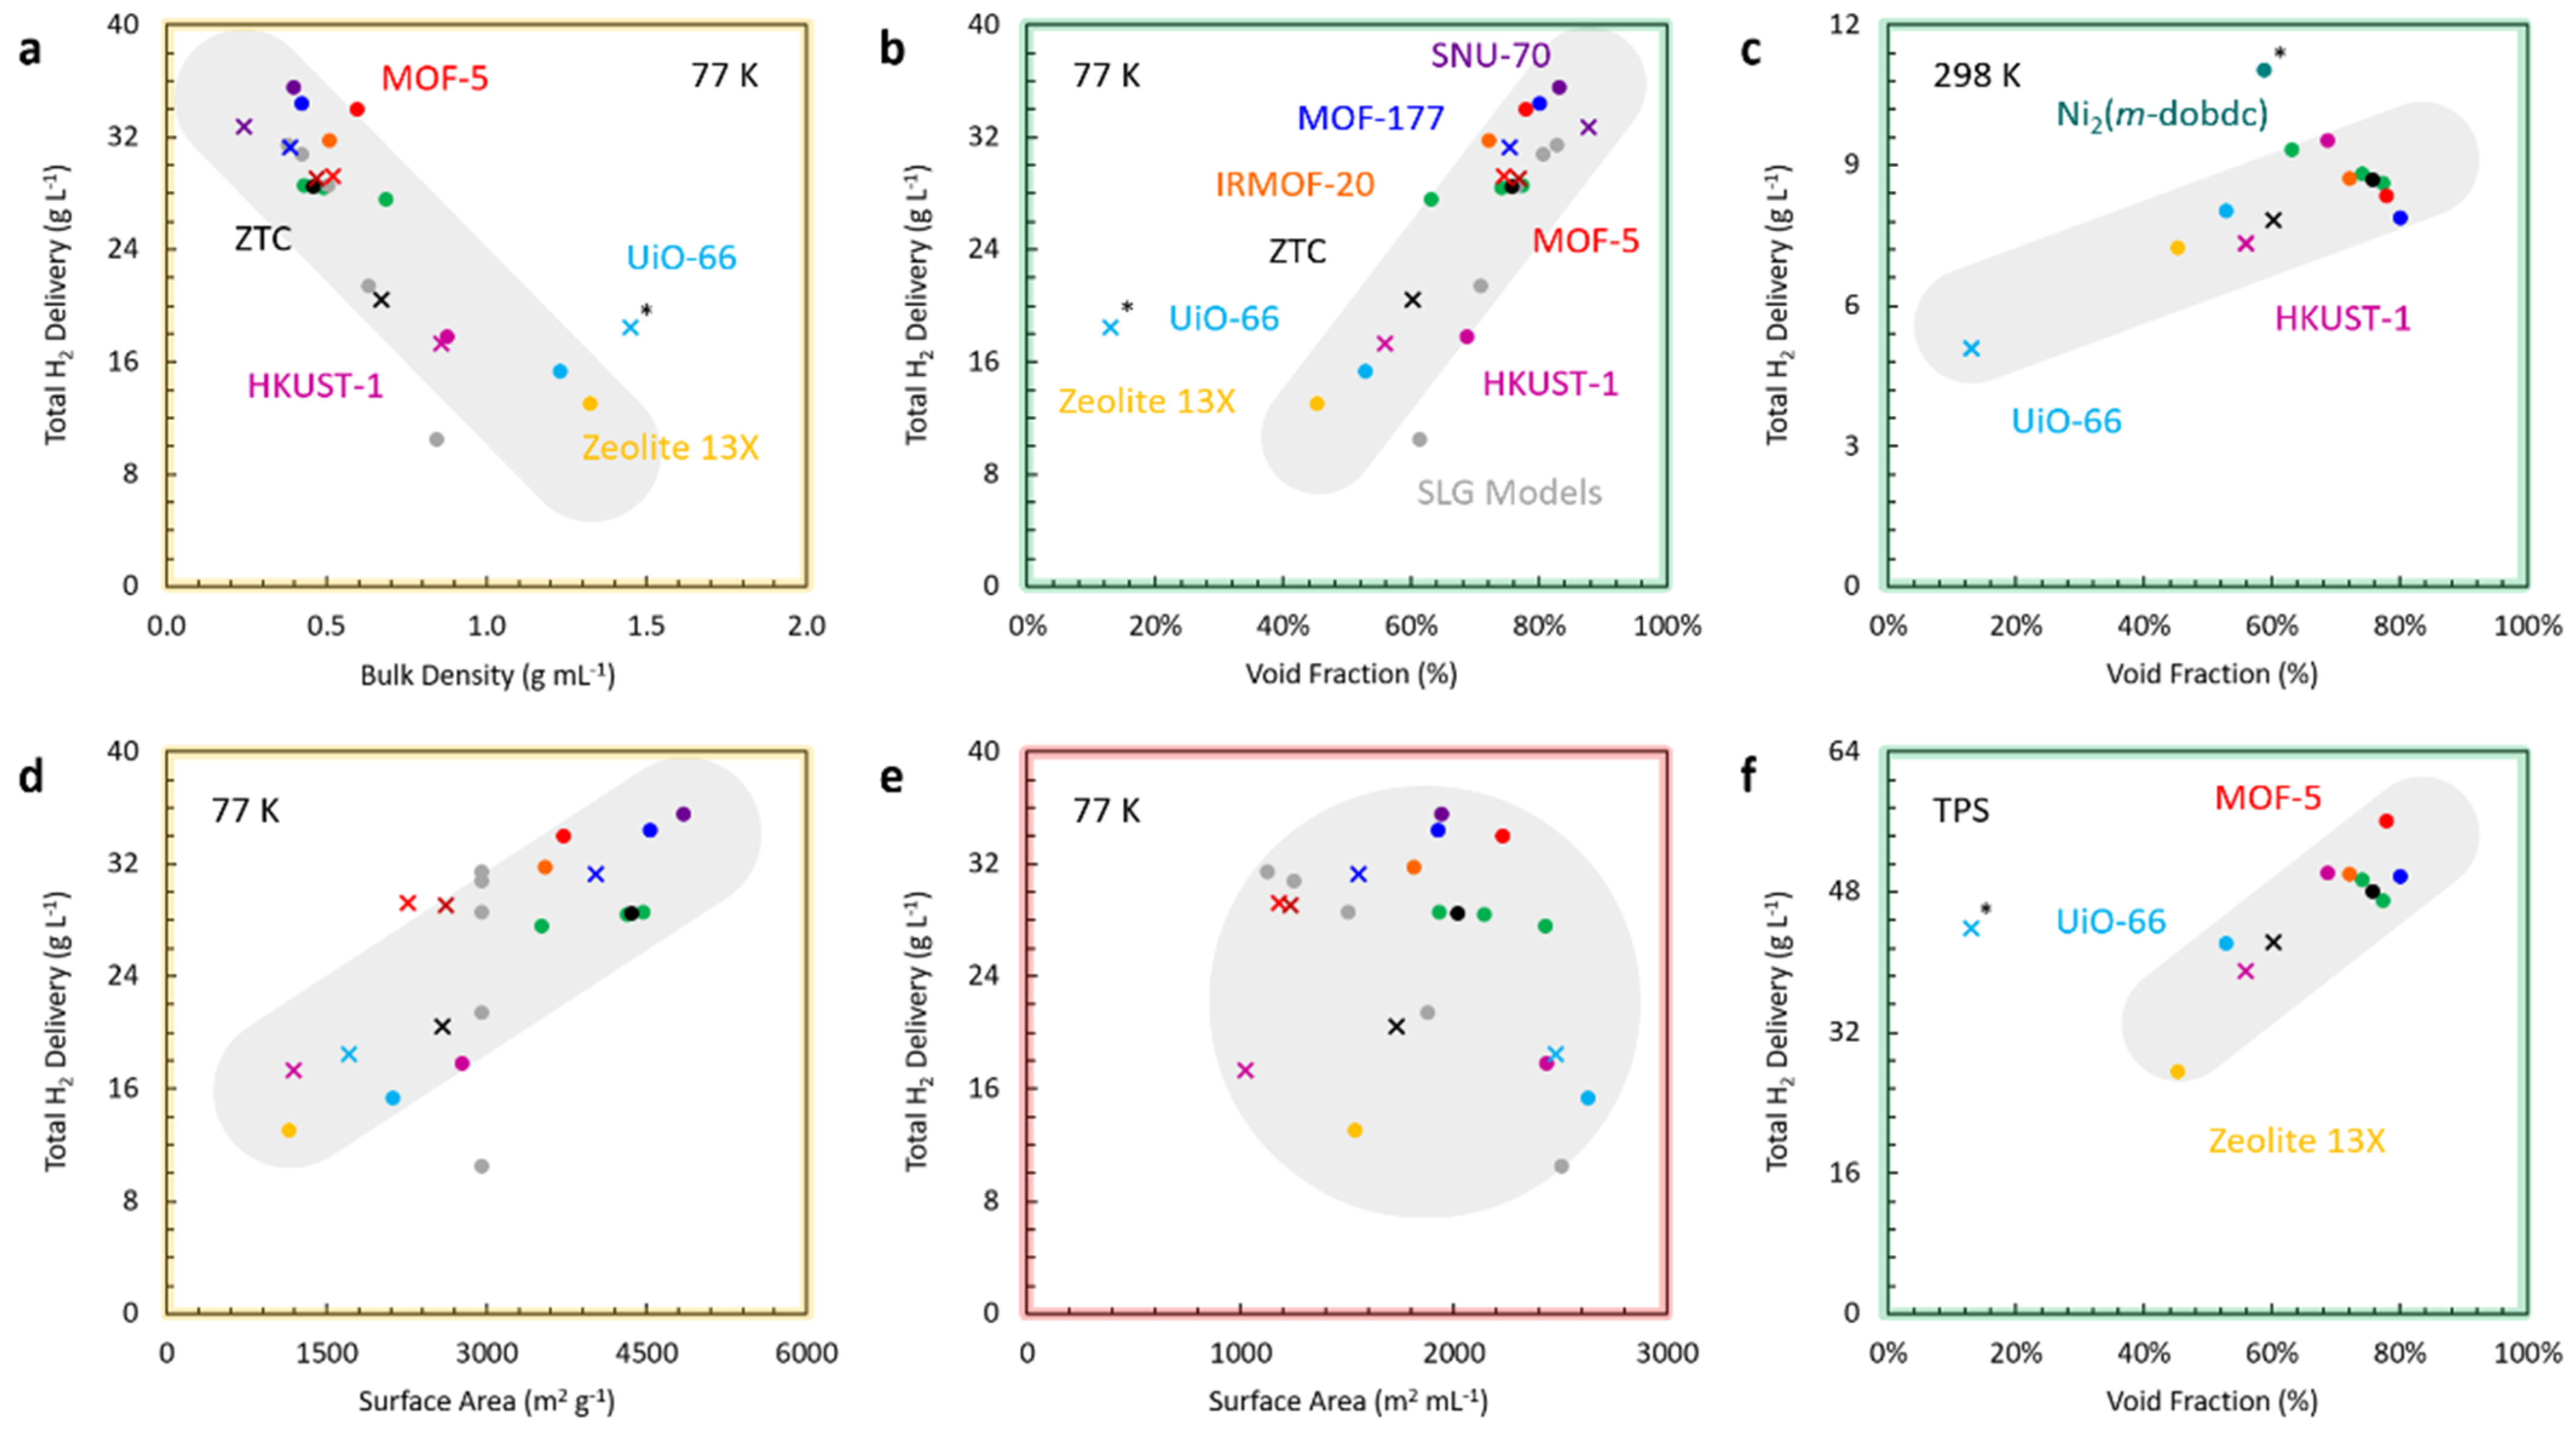
Three guiding findings are central to the results presented in Figure 6: PS delivery at 77 K is optimized in materials of low density (<0.5 g mL−1) and high void fraction (~80%), PS delivery at 298 K is optimized in materials containing open metal sites (e.g., Ni2(m-dobdc) and HKUST-1), and TPS delivery is optimized in materials of moderate density (~0.6 g mL−1) and high void fraction (~80%). These findings are summarized in Figure 7. While the presence of (open) metal sites does not play a significant role at 77 K, metal coordinative bonding assists in rigidly forming carbon-based frameworks with ultralow density in three dimensions, and several MOFs out-perform the model porous carbon reviewed in this work (ZTC). We note that these findings are generally consistent with recent large-scale computational screenings of MOFs [15] as well as an experimental review of volumetric H2 storage and delivery in benchmark MOFs [10], but differ in an important way. As shown by the red outline in Figure 7e, counterintuitively, the volumetric surface area of an adsorbent does not seem to be correlated with volumetric hydrogen delivery. In fact, the gravimetric surface area (Figure 7d) is a much better predictor for volumetric H2 delivery; delivery is directly correlated with PS delivery at 77 K with a slope of ~5 g L−1 delivery per 1000 m2 g−1, and only achieves parity with pure compression at ~4000 m2 g−1. The best predictor for PS delivery at 77 K is the (intrinsic) void fraction, which is also counterintuitive; the highest void fraction of the materials reviewed herein is 83% (SNU-70), the crystal that exhibits the highest H2 delivery under PS conditions. The results herein are more closely consistent with those recently presented by García-Holley and coworkers where gravimetric surface area (or total pore volume, a strongly correlated property) was found to be the best predictor for hydrogen delivery; the MOFs NU-125, NU-1000, and UiO-68-Ant were identified therein as important candidate materials for further investigation [99]. We also conclude that densification and compaction of such materials should be carried out in future work.
Based on the two hydrogen storage systems described in Section 2.4, a simplistic system-level analysis can be performed on the best candidate materials for adsorptive H2 storage as identified in this review. For ambient temperature storage and delivery, a representative system [33] (121 kg, 226 L) completely filled with a single crystal of Ni2(m-dobdc) in its 147 L inner volume would add 184 kg in weight due to the adsorbent alone. The H2 PS delivery at 298 K and 100 bar would be 1.62 kg, compared to 1.07 kg for pure compression, a 51% improvement. The gravimetric penalty would be severe (the empty adsorption system would weigh 2.5× that of the empty pure compression system). The system-level deliverable energy density would be very low compared to pure compression systems at 700 bar (or even commercial lithium-ion batteries): 0.86 MJ L−1 (0.64 MJ kg−1). We concede that this Type-IV pressure vessel is designed for delivery at 700 bar, where any improvement in H2 delivery from the addition of adsorbent remains highly dubious [93,104]. A lower weight, purpose-designed pressure vessel for 100 bar delivery would perform better in comparison to pure compression at that pressure, and would likely also benefit from better conformability, cheaper construction, and/or increased safety. However, ambient temperature hydrogen storage and delivery seem to favour pure compression at maximum pressure (within safety and energy-cost limitations).
For hydrogen storage and delivery at 77 K, a representative system [39] (109 kg, 246 L) completely filled with a single crystal of SNU-70 in its 180 L inner volume would add 72 kg in weight due to the adsorbent alone. The H2 PS delivery at 77 K and 100 bar would be 6.39 kg, compared to 5.35 kg for pure compression, a 19% improvement. The gravimetric penalty would be significant (the empty adsorption system would be 1.7× heavier) but the system-level deliverable energy density would be appreciable at 100 bar: 3.1 MJ L−1 (4.2 MJ kg−1). A benchmark compacted variant of SNU-70 (0.24 g mL−1 in bulk density) would add 43 kg in weight, and the H2 PS delivery at 77 K and 100 bar would be 5.90 kg, a 10% improvement over pure compression; this would yield an energy density of 2.9 MJ L−1 (4.7 MJ kg−1). While this energy density remains far lower than the DOE target of 4.8 MJ L−1, it is effectively equal to that of pure compression at ambient temperature and 700 bar. Further discussion of optimization of system-level energy density at cryogenic temperatures is provided by Purewal and coworkers elsewhere [32].
6. Conclusions
Hydrogen storage by adsorption on a porous solid remains an active area of research owing to the gains that such systems promise (especially in pressure reduction) compared to pure H2 compression, while forfeiting very few compromises (to cyclability, kinetics, and cost). In this review, it is shown that such gains are offset by considerations of delivery above a minimum pressure (typically 5 bar) below which any stored hydrogen is not useful. Temperature swing in addition to pressure swing (i.e., TPS) can very effectively combat this accommodation, especially if the storage vessel is cycled between 77 and 298 K (a wider range than typically considered).
Several key recommendations are presented:
- i.
- researchers should accurately measure and report the skeletal density of all adsorbents investigated,
- ii.
- researchers should accurately measure and report the apparent density of all adsorbents investigated, prior to performing adsorption measurements,
- iii.
- automated tapping (jolting) is a key strategy to increasing H2 PS delivery at any temperature,
- iv.
- light mechanical compaction (e.g., as performed for SNU-70 [32]) can result in very high volumetric capacity and delivery gains over a loose powder,
- v.
- volumetric H2 storage and delivery should be reported based on the “skeletal approximation” (Equation (9)), especially but not only for powders, and
- vi.
- novel adsorbents should be designed with large void volume, high gravimetric surface area, and a dense, well-organized skeletal framework with a primary focus on improving H2 delivery at cryogenic conditions, where current system-level energy densities clearly outperform commercial batteries.
While a modest gain in delivery can be achieved by powders at 298 K and 100–200 bar [93], as recently demonstrated in well-designed monolithic pellets [57], no gain is expected over pure compression beyond 400 bar at 298 K [93,104]. Hence, we conclude that adsorption-based hydrogen storage at room temperature has very questionable advantages over pure compression, especially considering the added complexity, weight, and cost.
Supplementary Materials
The following are available online at https://0-www-mdpi-com.brum.beds.ac.uk/article/10.3390/inorganics9060045/s1, Section S1: Data Analysis Methodology, Section S2 (Figures S1–S26): Benchmark Excess H2 Adsorption Data, Section S3 (Tables S1–S3): Crystal Properties, Section S4 (Tables S4 and S5): Powder and Pellet Properties, Section S5 (Figures S27 and S28): Volumetric Approximations, and Section S6 (Figures S29–S32): Porous Carbon Comparison.
Author Contributions
S.S.S. and N.P.S. contributed equally to collecting and analyzing previously reported data, and writing the manuscript. S.T.P. assisted with research, data analysis, and writing. All authors have read and agreed to the published version of the manuscript.
Funding
This work was supported by the U.S. Department of Energy’s Office of Energy Efficiency and Renewable Energy (EERE) under the Hydrogen and Fuel Cell Technologies and Vehicle Technologies Offices under Award Number DE-EE0008815.
Data Availability Statement
The fits of all data reviewed in this work can be found in the Supplementary Materials.
Acknowledgments
We thank Justin Purewal, Richard Chahine, and Bob Bowman for insightful discussions. We also thank Gabriela Blanita, Renju Zacharia, and Anne Streb for providing previously reported data. We thank Robert Szilagyi for providing the ZTC+, ZTC- and ZTC-- models, and Erin Taylor for performing the Zeo++ calculations.
Conflicts of Interest
The authors declare no conflict of interest. The funders had no role in the design of the study, in the collection, analyses, or interpretation of data, in the writing of the manuscript, or in the decision to publish the results.
References
- Bowman, R.C., Jr.; (Frankin, OH, USA). Private Communication, 2021.
- Rivard, E.; Trudeau, M.; Zaghib, K. Hydrogen storage for mobility: A review. Materials 2019, 12, 1973. [Google Scholar] [CrossRef] [Green Version]
- Adams, J.; Houchins, C.; Ahluwalia, R. Onboard Type IV Compressed Hydrogen Storage System Cost and Performance Status. In DOE Hydrogen and Fuel Cells Program Record 19008; US Department of Energy, 2019. Available online: https://www.hydrogen.energy.gov/pdfs/19008_onboard_storage_cost_performance_status.pdf (accessed on 16 May 2021).
- DOE Technical Targets for Onboard Hydrogen Storage for Light-Duty Vehicles; Hydrogen and Fuel Cell Technologies Office, 2020. Available online: https://www.energy.gov/eere/fuelcells/doe-technical-targets-onboard-hydrogen-storage-light-duty-vehicles (accessed on 16 May 2021).
- Hirscher, M.; Yartys, V.A.; Baricco, M.; von Colbe, J.B.; Blanchard, D.; Bowman, R.C., Jr.; Broom, D.P.; Buckley, C.E.; Chang, F.; Chen, P. Materials for hydrogen-based energy storage–past, recent progress and future outlook. J. Alloys Compd. 2020, 827, 153548. [Google Scholar] [CrossRef]
- Paggiaro, R.; Bénard, P.; Polifke, W. Cryo-adsorptive hydrogen storage on activated carbon. I: Thermodynamic analysis of adsorption vessels and comparison with liquid and compressed gas hydrogen storage. Int. J. Hydroen Energy 2010, 35, 638–647. [Google Scholar] [CrossRef]
- Liu, Y.; Kabbour, H.; Brown, C.M.; Neumann, D.A.; Ahn, C.C. Increasing the density of adsorbed hydrogen with coordinatively unsaturated metal centers in metal-organic frameworks. Langmuir 2008, 24, 4772–4777. [Google Scholar] [CrossRef] [PubMed]
- Gallego, N.C.; He, L.; Saha, D.; Contescu, C.I.; Melnichenko, Y.B. Hydrogen confinement in carbon nanopores: Extreme densification at ambient temperature. J. Am. Chem. Soc. 2011, 133, 13794–13797. [Google Scholar] [CrossRef] [PubMed]
- Ahmed, A.; Liu, Y.; Purewal, J.; Tran, L.D.; Wong-Foy, A.G.; Veenstra, M.; Matzger, A.J.; Siegel, D.J. Balancing gravimetric and volumetric hydrogen density in MOFs. Energy Environ. Sci. 2017, 10, 2459–2471. [Google Scholar] [CrossRef]
- Balderas-Xicohténcatl, R.; Schlichtenmayer, M.; Hirscher, M. Volumetric hydrogen storage capacity in metal–organic frameworks. Energy Technol. 2018, 6, 578–582. [Google Scholar] [CrossRef] [Green Version]
- Allendorf, M.D.; Hulvey, Z.; Gennett, T.; Ahmed, A.; Autrey, T.; Camp, J.; Cho, E.S.; Furukawa, H.; Haranczy, M.; Head-Gordon, M.; et al. An assessment of strategies for the development of solid-state adsorbents for vehicular hydrogen storage. Energy Environ. Sci. 2018, 11, 2784–2812. [Google Scholar] [CrossRef] [Green Version]
- Hurst, K.E.; Gennett, T.; Adams, J.; Allendorf, M.D.; Balderas-Xicohténcatl, R.; Bielewski, M.; Edwards, B.; Espinal, L.; Fultz, B.; Hirscher, M. An international laboratory comparison study of volumetric and gravimetric hydrogen adsorption measurements. ChemPhysChem 2019, 20, 1997–2009. [Google Scholar] [CrossRef] [Green Version]
- Gómez-Gualdrón, D.A.; Wang, T.C.; García-Holley, P.; Sawelewa, R.M.; Argueta, E.; Snurr, R.Q.; Hupp, J.T.; Yildirim, T.; Farha, O.K. Understanding volumetric and gravimetric hydrogen adsorption trade-off in metal–organic frameworks. ACS Appl. Mater. Inter. 2017, 9, 33419–33428. [Google Scholar] [CrossRef] [PubMed]
- Chahine, R.; Bose, T.K. Characterization and optimization of adsorbents for hydrogen storage. Hydrog. Energy Prog. XI 1996, 2, 1259–1264. [Google Scholar]
- Ahmed, A.; Seth, S.; Purewal, J.; Wong-Foy, A.G.; Veenstra, M.; Matzger, A.J.; Siegel, D.J. Exceptional hydrogen storage achieved by screening nearly half a million metal-organic frameworks. Nat. Commun. 2019, 10, 1–9. [Google Scholar] [CrossRef] [PubMed] [Green Version]
- Goldsmith, J.; Wong-Foy, A.G.; Cafarella, M.J.; Siegel, D.J. Theoretical limits of hydrogen storage in metal–organic frameworks: Opportunities and trade-offs. Chem. Mater. 2013, 25, 3373–3382. [Google Scholar] [CrossRef]
- Colón, Y.J.; Fairen-Jimenez, D.; Wilmer, C.E.; Snurr, R.Q. High-throughput screening of porous crystalline materials for hydrogen storage capacity near room temperature. J. Phys. Chem. C 2014, 118, 5383–5389. [Google Scholar] [CrossRef]
- Thornton, A.W.; Simon, C.M.; Kim, J.; Kwon, O.; Deeg, K.S.; Konstas, K.; Pas, S.J.; Hill, M.R.; Winkler, D.A.; Haranczyk, M. Materials genome in action: Identifying the performance limits of physical hydrogen storage. Chem. Mater. 2017, 29, 2844–2854. [Google Scholar] [CrossRef]
- Zhou, H.-C.; Long, J.R.; Yaghi, O.M. Introduction to metal–organic frameworks. Chem. Rev. 2012, 112, 673–674. [Google Scholar] [CrossRef]
- Purewal, J.; Liu, D.; Yang, J.; Sudik, A.; Siegel, D.; Maurer, S.; Müller, U. Increased volumetric hydrogen uptake of MOF-5 by powder densification. Int. J. Hydroen Energy 2012, 37, 2723–2727. [Google Scholar] [CrossRef]
- Hou, J.; Sapnik, A.F.; Bennett, T.D. Metal–organic framework gels and monoliths. Chem. Sci. 2020, 11, 310–323. [Google Scholar] [CrossRef] [PubMed] [Green Version]
- Nishihara, H.; Kyotani, T. Zeolite-templated carbons—Three-dimensional microporous graphene frameworks. Chem. Commun. 2018, 54, 5648–5673. [Google Scholar] [CrossRef]
- Taylor, E.E.; Garman, K.; Stadie, N.P. Atomistic Structures of Zeolite-Templated Carbon. Chem. Mater. 2020, 32, 2742–2752. [Google Scholar] [CrossRef]
- Broom, D.P.; Hirscher, M. Irreproducibility in hydrogen storage material research. Energy Environ. Sci. 2016, 9, 3368–3380. [Google Scholar] [CrossRef] [Green Version]
- Broom, D.; Webb, C. Pitfalls in the characterisation of the hydrogen sorption properties of materials. Int. J. Hydroen Energy 2017, 42, 29320–29343. [Google Scholar] [CrossRef]
- Blach, T.P.; Gray, E.M. Sieverts apparatus and methodology for accurate determination of hydrogen uptake by light-atom hosts. J. Alloys Compd. 2007, 446–447, 692–697. [Google Scholar] [CrossRef]
- Sircar, S. Role of helium void measurement in estimation of Gibbsian surface excess. Proc. Fundam. Adsorpt. 2002, 7, 656–663. [Google Scholar]
- Malbrunot, P.; Vidal, D.; Vermesse, J.; Chahine, R.; Bose, T. Adsorbent helium density measurement and its effect on adsorption isotherms at high pressure. Langmuir 1997, 13, 539–544. [Google Scholar] [CrossRef]
- Talu, O. Net Adsorption of Gas/Vapor Mixtures in Microporous Solids. J. Phys. Chem. C 2013, 117, 13059–13071. [Google Scholar] [CrossRef]
- Stadie, N.P. Synthesis and Thermodynamic Studies of Physisorptive Energy Storage Materials. Ph.D. Thesis, California Institute of Technology, Pasadena, CA, USA, 2013. [Google Scholar]
- Parilla, P.A.; Gross, K.; Hurst, K.; Gennett, T. Recommended volumetric capacity definitions and protocols for accurate, standardized and unambiguous metrics for hydrogen storage materials. Appl. Phys. A 2016, 122, 201. [Google Scholar] [CrossRef]
- Purewal, J.; Veenstra, M.; Tamburello, D.; Ahmed, A.; Matzger, A.J.; Wong-Foy, A.G.; Seth, S.; Liu, Y.; Siegel, D.J. Estimation of system-level hydrogen storage for metal-organic frameworks with high volumetric storage density. Int. J. Hydrogen Energy 2019, 44, 15135–15145. [Google Scholar] [CrossRef]
- Hydrogen Storage. DOE Fact Sheet DOE/EE-1552; Hydrogen and Fuel Cell Technologies Office, 2017. Available online: https://www.energy.gov/sites/prod/files/2017/03/f34/fcto-h2-storage-fact-sheet.pdf (accessed on 16 May 2021).
- Mueller, U.; Schubert, M.; Teich, F.; Puetter, H.; Schierle-Arndt, K.; Pastré, J. Metal–organic frameworks—prospective industrial applications. J. Mater. Chem. 2006, 16, 626–636. [Google Scholar] [CrossRef]
- Lemmon, E.W.; Huber, M.L.; McLinden, M.O. NIST Standard Reference Database 23: Reference Fluid Thermodynamic and Transport Properties—REFPROP; National Institute of Standards and Technology: Gaithersburg, MD, USA, 2007; Number Version 8.0 in Standard Reference Data Program.
- Ming, Y.; Purewal, J.; Sudik, A.; Xu, C.; Yang, J.; Veenstra, M.; Rhodes, K.; Soltis, R.; Warner, J.; Gaab, M. Thermophysical properties of MOF-5 powders. Microporous Mesoporous Mater. 2014, 185, 235–244. [Google Scholar] [CrossRef]
- Purewal, J.; Liu, D.; Sudik, A.; Veenstra, M.; Yang, J.; Maurer, S.; Müller, U.; Siegel, D.J. Improved hydrogen storage and thermal conductivity in high-density MOF-5 composites. J. Phys. Chem. C 2012, 116, 20199–20212. [Google Scholar] [CrossRef]
- Yang, J.; Sudik, A.; Wolverton, C.; Siegel, D.J. High capacity hydrogen storage materials: Attributes for automotive applications and techniques for materials discovery. Chem. Soc. Rev. 2010, 39, 656–675. [Google Scholar] [CrossRef] [Green Version]
- Tamburello, D.; Hardy, B.; Corgnale, C.; Sulic, M.; Anton, D. Cryo-Adsorbent Hydrogen Storage Systems For Fuel Cell Vehicles. In Proceedings of the ASME 2017 Fluids Engineering Division Summer Meeting, Waikoloa, HI, USA, 30 July–3 August 2017. [Google Scholar] [CrossRef]
- Chahine, R.; (Rio Tinto, London, UK). Private Communication, 2021.
- Wilmer, C.E.; Leaf, M.; Lee, C.Y.; Farha, O.K.; Hauser, B.G.; Hupp, J.T.; Snurr, R.Q. Large-scale screening of hypothetical metal–organic frameworks. Nat. Chem. 2012, 4, 83. [Google Scholar] [CrossRef]
- Hausner, H.H. Friction Conditions in a Mass of Metal Powder; Polytechnic Institute of Brooklyn; University of California, Los Angeles: Los Angeles, CA, USA, 1967. [Google Scholar]
- Santomaso, A.; Lazzaro, P.; Canu, P. Powder flowability and density ratios: The impact of granules packing. Chem. Eng. Sci. 2003, 58, 2857–2874. [Google Scholar] [CrossRef]
- Peng, Y.; Krungleviciute, V.; Eryazici, I.; Hupp, J.T.; Farha, O.K.; Yildirim, T. Methane Storage in Metal−Organic Frameworks: Current Records, Surprise Findings, and Challenges. J. Am. Chem. Soc. 2013, 135, 11887–11894. [Google Scholar] [CrossRef] [Green Version]
- Cooper, A., Jr.; Eaton, L. Compaction behavior of several ceramic powders. J. Am. Ceram. Soc. 1962, 45, 97–101. [Google Scholar] [CrossRef]
- Alcaniz-Monge, J.; Trautwein, G.; Pérez-Cadenas, M.; Roman-Martinez, M. Effects of compression on the textural properties of porous solids. Microporous Mesoporous Mater. 2009, 126, 291–301. [Google Scholar] [CrossRef]
- Vezzalini, G.; Arletti, R.; Quartieri, S. High-pressure-induced structural changes, amorphization and molecule penetration in MFI microporous materials: A review. Acta Cryst. B 2014, 70, 444–451. [Google Scholar] [CrossRef] [Green Version]
- Bazer-Bachi, D.; Assié, L.; Lecocq, V.; Harbuzaru, B.; Falk, V. Towards industrial use of metal-organic framework: Impact of shaping on the MOF properties. Powder Technol. 2014, 255, 52–59. [Google Scholar] [CrossRef]
- Dhainaut, J.; Avci-Camur, C.; Troyano, J.; Legrand, A.; Canivet, J.; Imaz, I.; Maspoch, D.; Reinsch, H.; Farrusseng, D. Systematic study of the impact of MOF densification into tablets on textural and mechanical properties. CrystEngComm 2017, 19, 4211–4218. [Google Scholar] [CrossRef]
- Ardelean, O.; Blanita, G.; Borodi, G.; Lazar, M.D.; Misan, I.; Coldea, I.; Lupu, D. Volumetric hydrogen adsorption capacity of densified MIL-101 monoliths. Int. J. Hydroen Energy 2013, 38, 7046–7055. [Google Scholar] [CrossRef]
- Nandasiri, M.I.; Jambovane, S.R.; McGrail, B.P.; Schaef, H.T.; Nune, S.K. Adsorption, separation, and catalytic properties of densified metal-organic frameworks. Coord. Chem. Rev. 2016, 311, 38–52. [Google Scholar] [CrossRef] [Green Version]
- Wang, T.C.; White, J.L.; Bie, B.; Deng, H.; Edgington, J.; Sugar, J.D.; Stavila, V.; Allendorf, M.D. Design Rules for Metal-Organic Framework Stability in High-Pressure Hydrogen Environments. ChemPhysChem 2019, 20, 1305–1310. [Google Scholar] [CrossRef]
- Zacharia, R.; Cossement, D.; Lafi, L.; Chahine, R. Volumetric hydrogen sorption capacity of monoliths prepared by mechanical densification of MOF-177. J. Mater. Chem. 2010, 20, 2145. [Google Scholar] [CrossRef]
- Hou, P.-X.; Orikasa, H.; Itoi, H.; Nishihara, H.; Kyotani, T. Densification of ordered microporous carbons and controlling their micropore size by hot-pressing. Carbon 2007, 45, 2011–2016. [Google Scholar] [CrossRef]
- Balahmar, N.; Lowbridge, A.M.; Mokaya, R. Templating of carbon in zeolites under pressure: Synthesis of pelletized zeolite templated carbons with improved porosity and packing density for superior gas (CO2 and H2) uptake properties. J. Mater. Chem. A 2016, 4, 14254–14266. [Google Scholar] [CrossRef]
- Adeniran, B.; Mokaya, R. Compactivation: A mechanochemical approach to carbons with superior porosity and exceptional performance for hydrogen and CO2 storage. Nano Energy 2015, 16, 173–185. [Google Scholar] [CrossRef]
- Gabe, A.; Ouzzine, M.; Taylor, E.E.; Stadie, N.P.; Uchiyama, N.; Kanai, T.; Nishina, Y.; Tanaka, H.; Pan, Z.-Z.; Kyotani, T.; et al. High-density monolithic pellets of double-sided graphene fragments based on zeolite-templated carbon. J. Mater. Chem. A 2021, 9, 7503–7507. [Google Scholar] [CrossRef]
- Juan-Juan, J.; Marco-Lozar, J.; Suarez-Garcia, F.; Cazorla-Amorós, D.; Linares-Solano, A. A comparison of hydrogen storage in activated carbons and a metal–organic framework (MOF-5). Carbon 2010, 48, 2906–2909. [Google Scholar] [CrossRef]
- Masika, E.; Mokaya, R. Exceptional gravimetric and volumetric hydrogen storage for densified zeolite templated carbons with high mechanical stability. Energy Environ. Sci. 2013, 7, 427–434. [Google Scholar] [CrossRef]
- Blankenship, T.S.; Mokaya, R. Cigarette butt-derived carbons have ultra-high surface area and unprecedented hydrogen storage capacity. Energy Environ. Sci. 2017, 10, 2552–2562. [Google Scholar] [CrossRef]
- Singer, J.; Mayergoyz, A.; Portet, C.; Schneider, E.; Gogotsi, Y.; Fischer, J. Enhanced volumetric hydrogen storage capacity of porous carbon powders by forming peels or pellets. Microporous Mesoporous Mater. 2008, 116, 469–472. [Google Scholar] [CrossRef]
- Biloe, S.; Goetz, V.; Mauran, S. Characterization of adsorbent composite blocks for methane storage. Carbon 2001, 39, 1653–1662. [Google Scholar] [CrossRef]
- Lozano-Castelló, D.; Cazorla-Amorós, D.; Linares-Solano, A.; Quinn, D. Activated carbon monoliths for methane storage: Influence of binder. Carbon 2002, 40, 2817–2825. [Google Scholar] [CrossRef]
- Balathanigaimani, M.; Shim, W.-G.; Lee, J.-W.; Moon, H. Adsorption of methane on novel corn grain-based carbon monoliths. Microporous Mesoporous Mater. 2009, 119, 47–52. [Google Scholar] [CrossRef]
- Machnikowski, J.; Kierzek, K.; Torchała, K. Adsorption capacity enhancement by activation with CO2 of monolithic adsorbents made of KOH-activated carbon and polymer-derived binder. Energy Fuels 2012, 26, 3697–3702. [Google Scholar] [CrossRef]
- Valekar, A.H.; Cho, K.-H.; Lee, U.-H.; Lee, J.S.; Yoon, J.W.; Hwang, Y.K.; Lee, S.G.; Cho, S.J.; Chang, J.-S. Shaping of porous metal–organic framework granules using mesoporous ρ-alumina as a binder. RSC Adv. 2017, 7, 55767–55777. [Google Scholar] [CrossRef] [Green Version]
- Mallick, A.; Mouchaham, G.; Bhatt, P.M.; Liang, W.; Belmabkhout, Y.; Adil, K.; Jamal, A.; Eddaoudi, M. Advances in Shaping of Metal–Organic Frameworks for CO2 Capture: Understanding the Effect of Rubbery and Glassy Polymeric Binders. Ind. Eng. Chem. Res. 2018, 57, 16897–16902. [Google Scholar] [CrossRef]
- Hastürk, E.; Höfert, S.-P.; Topalli, B.; Schlüsener, C.; Janiak, C. Shaping of MOFs via freeze-casting method with hydrophilic polymers and their effect on textural properties. Microporous Mesoporous Mater. 2020, 295, 109907. [Google Scholar] [CrossRef]
- Liu, X.-M.; Xie, L.-H.; Wu, Y. Recent advances in the shaping of metal–organic frameworks. Inorg. Chem. Front. 2020, 7, 2840–2866. [Google Scholar] [CrossRef]
- Ren, J.; Musyoka, N.M.; Langmi, H.W.; Swartbooi, A.; North, B.C.; Mathe, M. A more efficient way to shape metal-organic framework (MOF) powder materials for hydrogen storage applications. Int. J. Hydrogen Energy 2015, 40, 4617–4622. [Google Scholar] [CrossRef]
- Bye, K.; White, E. Hydrothermal growth of sodalite single crystals. J. Cryst. Growth 1970, 6, 355–356. [Google Scholar] [CrossRef]
- Lethbridge, Z.A.; Williams, J.J.; Walton, R.I.; Evans, K.E.; Smith, C.W. Methods for the synthesis of large crystals of silicate zeolites. Microporous Mesoporous Mater. 2005, 79, 339–352. [Google Scholar] [CrossRef]
- Sorrenti, A.; Jones, L.; Sevim, S.; Cao, X.; DeMello, A.J.; Martí-Gastaldo, C.; Puigmartí-Luis, J. Growing and Shaping Metal–Organic Framework Single Crystals at the Millimeter Scale. J. Am. Chem. Soc. 2020, 142, 9372–9381. [Google Scholar] [CrossRef]
- Tovar, T.M.; Zhao, J.; Nunn, W.T.; Barton, H.F.; Peterson, G.W.; Parsons, G.N.; LeVan, M.D. Diffusion of CO2 in large crystals of Cu-BTC MOF. J. Am. Chem. Soc. 2016, 138, 11449–11452. [Google Scholar] [CrossRef]
- Moitra, N.; Fukumoto, S.; Reboul, J.; Sumida, K.; Zhu, Y.; Nakanishi, K.; Furukawa, S.; Kitagawa, S.; Kanamori, K. Mechanically stable, hierarchically porous Cu 3 (btc) 2 (HKUST-1) monoliths via direct conversion of copper (ii) hydroxide-based monoliths. Chem. Commun. 2015, 51, 3511–3514. [Google Scholar] [CrossRef] [PubMed] [Green Version]
- Connolly, B.M.; Madden, D.G.; Wheatley, A.E.; Fairen-Jimenez, D. Shaping the future of fuel: Monolithic metal–organic frameworks for high-density gas storage. J. Am. Chem. Soc. 2020, 142, 8541–8549. [Google Scholar] [CrossRef]
- Tian, T.; Zeng, Z.; Vulpe, D.; Casco, M.E.; Divitini, G.; Midgley, P.A.; Silvestre-Albero, J.; Tan, J.-C.; Moghadam, P.Z.; Fairen-Jimenez, D. A sol–gel monolithic metal–organic framework with enhanced methane uptake. Nat. Mater. 2018, 17, 174. [Google Scholar] [CrossRef]
- Connolly, B.M.; Aragones-Anglada, M.; Gandara-Loe, J.; Danaf, N.A.; Lamb, D.C.; Mehta, J.P.; Vulpe, D.; Wuttke, S.; Silvestre-Albero, J.; Moghadam, P.Z. Tuning porosity in macroscopic monolithic metal-organic frameworks for exceptional natural gas storage. Nat. Commun. 2019, 10, 1–11. [Google Scholar] [CrossRef]
- Hunter-Sellars, E.; Saenz-Cavazos, P.A.; Houghton, A.R.; McIntyre, S.R.; Parkin, I.P.; Williams, D.R. Sol–Gel Synthesis of High-Density Zeolitic Imidazolate Framework Monoliths via Ligand Assisted Methods: Exceptional Porosity, Hydrophobicity, and Applications in Vapor Adsorption. Adv. Funct. Mater. 2021, 31, 2008357. [Google Scholar] [CrossRef]
- Baerlocher, C.; McCusker, L.B. Database of Zeolite Structures. Available online: http://www.iza-structure.org/databases/ (accessed on 16 May 2021).
- Lopes, F.V.; Grande, C.A.; Ribeiro, A.M.; Loureiro, J.M.; Evaggelos, O.; Nikolakis, V.; Rodrigues, A.E. Adsorption of H2, CO2, CH4, CO, N2 and H2O in activated carbon and zeolite for hydrogen production. Sep. Sci. Technol. 2009, 44, 1045–1073. [Google Scholar] [CrossRef]
- Langmi, H.; Walton, A.; Al-Mamouri, M.; Johnson, S.; Book, D.; Speight, J.; Edwards, P.; Gameson, I.; Anderson, P.; Harris, I. Hydrogen adsorption in zeolites A, X, Y and RHO. J. Alloys Compd. 2003, 356, 710–715. [Google Scholar] [CrossRef]
- Chahine, R.; Bose, T. Low-pressure adsorption storage of hydrogen. Int. J. Hydroen Energy 1994, 19, 161–164. [Google Scholar] [CrossRef]
- Streb, A.; Mazzotti, M. Adsorption for efficient low carbon hydrogen production: Part 1—adsorption equilibrium and breakthrough studies for H2/CO2/CH4 on zeolite 13X. Adsorption 2021, 1–18. [Google Scholar] [CrossRef]
- Nishihara, H.; Fujimoto, H.; Itoi, H.; Nomura, K.; Tanaka, H.; Miyahara, M.T.; Bonnaud, P.A.; Miura, R.; Suzuki, A.; Miyamoto, N. Graphene-based ordered framework with a diverse range of carbon polygons formed in zeolite nanochannels. Carbon 2018, 129, 854–862. [Google Scholar] [CrossRef]
- Nomura, K.; Nishihara, H.; Yamamoto, M.; Gabe, A.; Ito, M.; Uchimura, M.; Nishina, Y.; Tanaka, H.; Miyahara, M.T.; Kyotani, T. Force-driven reversible liquid–gas phase transition mediated by elastic nanosponges. Nat. Commun. 2019, 10, 2559. [Google Scholar] [CrossRef] [PubMed] [Green Version]
- Bénard, P.; Chahine, R.; Chandonia, P.; Cossement, D.; Dorval-Douville, G.; Lafi, L.; Lachance, P.; Paggiaro, R.; Poirier, E. Comparison of hydrogen adsorption on nanoporous materials. J. Alloys Compd. 2007, 446, 380–384. [Google Scholar] [CrossRef]
- Gómez-Gualdrón, D.A.; Wilmer, C.E.; Farha, O.K.; Hupp, J.T.; Snurr, R.Q. Exploring the limits of methane storage and delivery in nanoporous materials. J. Phys. Chem. C 2014, 118, 6941–6951. [Google Scholar] [CrossRef]
- Martínez-Mesa, A.; Zhechkov, L.; Yurchenko, S.; Heine, T.; Seifert, G.; Rubayo-Soneira, J. Hydrogen physisorption on carbon foams upon inclusion of many-body and quantum delocalization effects. J. Phys. Chem. C 2012, 116, 19543–19553. [Google Scholar] [CrossRef]
- Dimitrakakis, G.K.; Tylianakis, E.; Froudakis, G.E. Pillared graphene: A new 3-D network nanostructure for enhanced hydrogen storage. Nano Lett. 2008, 8, 3166–3170. [Google Scholar] [CrossRef] [PubMed]
- Krasnov, P.O.; Shkaberina, G.S.; Kuzubov, A.A.; Kovaleva, E.A. Molecular hydrogen sorption capacity of D-shwarzites. Appl. Surf. Sci. 2017, 416, 766–771. [Google Scholar] [CrossRef] [Green Version]
- Casco, M.E.; Martínez-Escandell, M.; Gadea-Ramos, E.; Kaneko, K.; Silvestre-Albero, J.; Rodriguez-Reinoso, F. High-Pressure Methane Storage in Porous Materials: Are Carbon Materials in the Pole Position? Chem. Mater. 2015. [Google Scholar] [CrossRef] [Green Version]
- Voskuilen, T.; Pourpoint, T.; Dailly, A. Hydrogen adsorption on microporous materials at ambient temperatures and pressures up to 50 MPa. Adsorption 2012, 18, 239–249. [Google Scholar] [CrossRef]
- Stadie, N.P.; Purewal, J.J.; Ahn, C.C.; Fultz, B. Measurements of hydrogen spillover in platinum doped superactivated carbon. Langmuir 2010, 26, 15481–15485. [Google Scholar] [CrossRef] [Green Version]
- Stadie, N.P.; Vajo, J.J.; Cumberland, R.W.; Wilson, A.A.; Ahn, C.C.; Fultz, B. Zeolite-templated carbon materials for high-pressure hydrogen storage. Langmuir 2012, 28, 10057–10063. [Google Scholar] [CrossRef] [Green Version]
- Nishihara, H.; Hou, P.X.; Li, L.X.; Ito, M.; Uchiyama, M.; Kaburagi, T.; Ikura, A.; Katamura, J.; Kawarada, T.; Mizuuchi, K.; et al. High-pressure hydrogen storage in zeolite-templated carbon. J. Phys. Chem. C 2009, 113, 3189–3196. [Google Scholar] [CrossRef]
- Ramirez-Vidal, P.; Canevesi, R.L.; Sdanghi, G.; Schaefer, S.; Maranzana, G.; Celzard, A.; Fierro, V. A Step Forward in Understanding the Hydrogen Adsorption and Compression on Activated Carbons. ACS Appl. Mater. Inter. 2021, 13, 12562–12574. [Google Scholar] [CrossRef]
- Geng, Z.; Zhang, C.; Wang, D.; Zhou, X.; Cai, M. Pore size effects of nanoporous carbons with ultra-high surface area on high-pressure hydrogen storage. J. Energy Chem. 2015, 24, 1–8. [Google Scholar] [CrossRef]
- García-Holley, P.; Schweitzer, B.; Islamoglu, T.; Liu, Y.; Lin, L.; Rodriguez, S.; Weston, M.H.; Hupp, J.T.; Gómez-Gualdrón, D.A.; Yildirim, T. Benchmark study of hydrogen storage in metal–organic frameworks under temperature and pressure swing conditions. ACS Energy Lett. 2018, 3, 748–754. [Google Scholar] [CrossRef] [Green Version]
- Kaye, S.S.; Dailly, A.; Yaghi, O.M.; Long, J.R. Impact of preparation and handling on the hydrogen storage properties of Zn4O (1, 4-benzenedicarboxylate) 3 (MOF-5). J. Am. Chem. Soc. 2007, 129, 14176–14177. [Google Scholar] [CrossRef] [PubMed]
- Bambalaza, S.E.; Langmi, H.W.; Mokaya, R.; Musyoka, N.M.; Ren, J.; Khotseng, L.E. Compaction of a zirconium metal–organic framework (UiO-66) for high density hydrogen storage applications. J. Mater. Chem. A 2018, 6, 23569–23577. [Google Scholar] [CrossRef] [Green Version]
- Kapelewski, M.T.; Runčevski, T.e.; Tarver, J.D.; Jiang, H.Z.; Hurst, K.E.; Parilla, P.A.; Ayala, A.; Gennett, T.; FitzGerald, S.A.; Brown, C.M. Record High Hydrogen Storage Capacity in the Metal–Organic Framework Ni2 (m-dobdc) at Near-Ambient Temperatures. Chem. Mater. 2018, 30, 8179–8189. [Google Scholar] [CrossRef]
- Blanita, G.; Mihet, M.; Borodi, G.; Misan, I.; Coldea, I.; Lupu, D. Ball milling and compression effects on hydrogen adsorption by MOF:Pt/carbon mixtures. Microporous Mesoporous Mater. 2015, 203, 195–201. [Google Scholar] [CrossRef]
- Beckner, M.; Dailly, A. Adsorption enthalpy calculations of hydrogen adsorption at ambient temperature and pressures exceeding 300 bar. Am. J. Anal. Chem. 2013, 4, 8–16. [Google Scholar] [CrossRef] [Green Version]
Figure 2.
Representative measurements and methods of calculation of volumetric H2 storage via physical adsorption. (a) Excess H2 uptake on MOF-5 at 77 K: loose powder (used for crystal, tapped powder, and jolted powder analysis) compared to two representative pellets. (b,c) Total H2 uptake and delivery on jolted MOF-5 powder under three different assumptions: common, skeletal, and swollen. The crystalline assumption is shown for comparison. (d) Crystal structure of MOF-5 and calculated structural parameters (2.4 Å diameter probe). (e,f) Total H2 uptake and delivery on densified variants of MOF-5: tapped powder, jolted powder, and two representative pellets, all under the skeletal assumption. The crystalline assumption is shown for comparison. Excess H2 adsorption data were obtained from the following references: MOF-5 powder [36], neat pellet (0.52 g mL−1) [37], and MOF-5/ENG pellet (5% ENG, 0.47 g mL−1) [37].

Figure 3.
Structural trends across select porous carbons, zeolites, and MOFs. (a) Gravimetric BET surface area, (b) volumetric BET surface area, and (c) void fraction, Xvoid, as a function of bulk density for ideal single crystals (●), laboratory powders (✱), and laboratory-densified materials (×). Select zeolites shown in yellow, MOFs in orange, MOF-5 in red, MOF-177 in blue, ZTC in black, and expanded/compressed ZTCs in green. The lines in (a,b) correspond to an exponential fit to all crystalline materials. The lines in (c) correspond to constant skeletal densities: 1.56 (blue), 2.10 (grey), and 3.04 (turquoise) g mL−1. See Section S3 in the Supplementary Materials.

Figure 5.
Equilibrium H2 adsorption uptake on (a–c) benchmark crystals and (d–f) benchmark pellets/monoliths at 77 and 298 K. Excess H2 adsorption data were obtained from the following references: ZTC [98], MOF-5 [36], MOF-177 [53], IRMOF-20 [32], SNU-70 [32], UiO-66 [101], HKUST-1 [99], Ni2(m-dobdc) [102], and zeolite 13× [87] powders, and ZTC/rGO pellet (0.67 g mL−1) [57], MOF-5 neat pellet (0.52 g mL−1) [37], MOF-5/ENG pellet (5% ENG, 0.47 g mL−1) [37], MOF-177 pellet (0.39 g mL−1) [53], SNU-70 compact (0.24 g mL−1) [32], HKUST-1 pellet (0.86 g mL−1) [103], and UiO-66 pellet (1.45 g mL−1) [101]. The crystalline assumption was employed for all crystals (a–c), the skeletal assumption for all pellets (d–f).

Figure 6.
Total deliverable H2 adsorption uptake on (a,b) benchmark crystals and (d–f) benchmark pellets/monoliths under (a,d) 5–100 bar TPS between 298–77 K (b,e) 5–100 bar PS at 77 K, or (c,f) 5–100 bar PS at 298 K. Excess H2 adsorption data were obtained from the same references as in Figure 5 (see Supplementary Materials). The crystalline assumption was employed for all crystals (a–c), the skeletal assumption for all pellets (d–f).

Figure 7.
Total deliverable H2 adsorption uptake on benchmark crystals and pellets/monoliths under (a,b,d,e) 5–100 bar PS at 77 K, (c) 5–100 bar PS at 298 K, or (f) 5–100 bar TPS between 298 and 77 K. Excess H2 adsorption data were obtained from the same references as in Figure 5 and Figure 6 (see Supplementary Materials). The crystalline assumption was employed for all crystals (●) and the skeletal assumption for all pellets (×). Outliers are indicated with an asterisk. The outline of each plot indicates the goodness of fit based on linear regression analysis.

Table 1.
Representative measurements and methods of calculation of volumetric H2 storage calculations on MOF-5 (as shown in Figure 2).
Table 1.
Representative measurements and methods of calculation of volumetric H2 storage calculations on MOF-5 (as shown in Figure 2).
| Material | Form | Calculation | (g L−1) | Ref | ||
|---|---|---|---|---|---|---|
| 5 bar | 50 bar | 100 bar | ||||
| MOF-5 | Powder 2,5 | (Equation (8)) | 8.3 | 17.8 | 20.5 | [36] |
| Powder 2,4 | (Equation (9)) | 9.3 | 27.9 | 39.7 | [36] | |
| Powder 4,5 | (Equation (10)) | 21.4 | 46.0 | 52.9 | [36] | |
| Powder 6 | (Equation (11)) | 22.6 | 48.9 | 56.5 | [36] | |
| MOF-5 | Powder 1 | (Equation (9)) | 6.1 | 23.3 | 36.3 | [36] |
| Powder 2 | (Equation (9)) | 9.3 | 27.9 | 39.7 | [36] | |
| Pellet 3 | (Equation (9)) | 16.7 | 38.0 | 45.2 | [37] | |
| MOF-5/ENG | Pellet 3 | (Equation (9)) | 13.2 | 33.9 | 41.5 | [37] |
1 Bulk density measured by manual tapping [36,37]; 2 Bulk density measured by jolting volumetry [36]; 3 Bulk density measured by calipers or ruler [37]; 4 Skeletal density measured by He pycnometry at 298 K [20]; 5 Pore volume measured by N2 adsorption at 77 K [20]; 6 Bulk density and calculated from the CIF using Zeo++.
Table 2.
Structural properties of selected MOFs, porous carbons, and zeolites (a more complete list is shown in Tables S4 and S5).
Table 2.
Structural properties of selected MOFs, porous carbons, and zeolites (a more complete list is shown in Tables S4 and S5).
| Material | Form | (g mL−1) | (g mL−1) | (mL g−1) | SA 5 (m2 g−1) | SA (m2 mL−1) | (%) |
|---|---|---|---|---|---|---|---|
| MOF-5 | powder | 0.13 1 | 2.03 | 1.27 | 2763 | 359 | 94% |
| MOF-5 | powder | 0.22 2 | 2.03 | 1.27 | 2763 | 608 | 89% |
| MOF-5 | pellet | 0.52 3 | 2.03 | 1.12 | 2263 | 1177 | 74% |
| MOF-5/ENG | pellet | 0.47 3 | 2.03 | 1.14 | 2623 | 1233 | 77% |
| MOF-177 | powder | 0.21 1 | 1.56 | 1.74 | 4143 | 858 | 87% |
| MOF-177 | pellet | 0.39 3 | 1.56 | 1.62 | 4029 | 1551 | 75% |
| SNU-70 | powder | 0.20 1 | 1.95 | 2.03 | 4944 | 989 | 90% |
| SNU-70 | pellet | 0.243 | 1.95 | NR | NR | NR | 88% |
| ZTC | powder | 0.19 1 | 1.75 | 1.70 | 3792 | 720 | 89% |
| ZTC/rGO | pellet | 0.67 3 | 1.69 | 1.35 | 2585 | 1732 | 60% |
| Zeolite 13X | powder | 0.595 1 | 2.36 4 | NR | NR | NR | 75% |
1 Measured by tapping; 2 Measured by jolting volumetry; 3 Measured by calipers or ruler; 4 Measured by He pycnometry at 298 K; 5 Measured by N2 adsorption at 77 K; 6 Calculated by skeletal approximation; NR—not reported.
Table 4.
Volumetric H2 storage calculations on selected MOFs, porous carbons, and zeolites at 77–298 K (as shown in Figure 5 and Figure 6).
| T (K) | Material | Form | Calculation | (g L−1) | Ref | ||
|---|---|---|---|---|---|---|---|
| 5 bar | 50 bar | 100 bar | |||||
| 77 | MOF-5 | crystal | 1 | 22.6 | 48.9 | 56.5 | [36] |
| MOF-5 | pellet | 2,3 | 16.5 | 37.9 | 45.7 | [37] | |
| MOF-5/ENG | pellet | 2,3 | 12.9 | 33.7 | 42.0 | [37] | |
| MOF-177 | crystal | 1 | 15.9 | 41.7 | 50.2 | [53] | |
| MOF-177 | pellet | 2,3 | 13.1 | 35.9 | 44.4 | [53] | |
| SNU-70 | crystal | 1 | 14.5 | 41.4 | 50.0 | [32] | |
| SNU-70 | compact | 2,3 | 9.0 | 30.7 | 41.8 | [32] | |
| ZTC | “crystal” | 1 | 20.1 | 40.6 | 48.5 | [37] | |
| ZTC/rGO | pellet | 2,3 | 22.4 | 37.8 | 42.8 | SI | |
| Zeolite 13X | crystal | 1 | 15.0 | 22.7 | 27.9 | [87] | |
| 298 | MOF-5 | crystal | 1 | 0.5 | 4.8 | 8.9 | [36] |
| IRMOF-20 | crystal | 1 | 0.6 | 5.0 | 9.2 | [32] | |
| HKUST-1 | crystal | 1 | 0.7 | 5.9 | 10.2 | [99] | |
| HKUST-1 | pellet | 2,3 | 0.5 | 4.6 | 7.8 | [103] | |
| Ni2(m-dobdc) | crystal | 1 | 0.8 | 6.9 | 11.8 | [102] | |
| ZTC | “crystal” | 1 | 0.6 | 5.1 | 9.2 | [57] | |
| ZTC/rGO | pellet | 2,3 | 0.5 | 4.9 | 8.4 | [57] | |
| Zeolite 13X | crystal | 1 | 0.5 | 4.3 | 7.7 | [84] | |
1 Bulk density and calculated from the CIF using Zeo++; 2 Bulk density measured by calipers or ruler; 3 Skeletal density measured by He pycnometry at 298 K.
Publisher’s Note: MDPI stays neutral with regard to jurisdictional claims in published maps and institutional affiliations. |
© 2021 by the authors. Licensee MDPI, Basel, Switzerland. This article is an open access article distributed under the terms and conditions of the Creative Commons Attribution (CC BY) license (https://creativecommons.org/licenses/by/4.0/).
Share and Cite
MDPI and ACS Style
Samantaray, S.S.; Putnam, S.T.; Stadie, N.P. Volumetrics of Hydrogen Storage by Physical Adsorption. Inorganics 2021, 9, 45. https://0-doi-org.brum.beds.ac.uk/10.3390/inorganics9060045
AMA Style
Samantaray SS, Putnam ST, Stadie NP. Volumetrics of Hydrogen Storage by Physical Adsorption. Inorganics. 2021; 9(6):45. https://0-doi-org.brum.beds.ac.uk/10.3390/inorganics9060045
Chicago/Turabian StyleSamantaray, Sai Smruti, Seth T. Putnam, and Nicholas P. Stadie. 2021. "Volumetrics of Hydrogen Storage by Physical Adsorption" Inorganics 9, no. 6: 45. https://0-doi-org.brum.beds.ac.uk/10.3390/inorganics9060045
Note that from the first issue of 2016, this journal uses article numbers instead of page numbers. See further details here.