Article

Chiral or Luminescent Lanthanide Single-Molecule Magnets Involving Bridging Redox Active Triad Ligand

by
Bertrand Lefeuvre
,
Jessica Flores Gonzalez
,
Carlo Andrea Mattei
,
Vincent Dorcet
,
Olivier Cador
and
Fabrice Pointillart
*
ISCR (Institut des Sciences Chimiques de Rennes)—UMR-CNRS 6226, Université de Rennes, 35000 Rennes, France
*
Author to whom correspondence should be addressed.
Submission received: 3 June 2021 / Revised: 18 June 2021 / Accepted: 19 June 2021 / Published: 23 June 2021
(This article belongs to the Special Issue Lanthanide Single-Molecule Magnets)

Abstract

:
The reactions between the bis(1,10-phenantro[5,6-b])tetrathiafulvalene triad (L) and the metallo-precursors Yb(hfac)3(H2O)2 (hfac = 1,1,1,5,5,5-hexafluoroacetylacetonato anion) and Dy(facam)3 (facam = 3-trifluoro-acetyl-(+)-camphorato anion) lead to the formation of two dinuclear complexes of formula [Yb2(hfac)6(L)]·2(C7H16) ((1)·2(C7H16)) and [Dy2((+)facam)6(L)]·2(C6H14) ((2)·2(C6H14)). The X-ray structures reveal that the L triad bridges two terminal Yb(hfac)3 or Dy(facam)3 units. (1)·2(C7H16) behaved as a near infrared YbIII centered emitter and a field-induced Single-Molecule Magnet (SMM) while (2)·2(C6H14) displayed SMM behavior in both zero- and in-dc field. The magnetization mainly relaxes through a Raman process for both complexes under an optimal applied magnetic field.

Graphical Abstract

1. Introduction

Lanthanide ions are playing a crucial role in the design of Single-Molecule Magnets (SMM) thanks to their strong magnetic anisotropy and high magnetic moment [1,2,3,4,5,6,7,8,9,10]. The ideal adequacy between the nature of the used lanthanide and crystal field environment allowed chemists to elaborate SMMs displaying magnetic memory at a temperature up to 80 K [11,12]. Thus, such molecular objects are back in the race for potential applications in data storage as well as quantum computing [13,14]. Lanthanide elements are well-known to be highly luminescent [15,16] pushing up both chemist and physicist communities for having an interest in the design of luminescent SMMs for which magneto-optical correlation could be performed [17,18,19,20]. In a general manner, the addition of one or more physical properties to the SMM behavior paves the way to the design of multi-properties SMM as well as the study of a possible synergy between the different properties. Moreover, when chirality is added to the (luminescent) SMM behavior [21,22,23,24,25,26,27,28], chiral SMM [29], ferroelectric SMM [30] as well as chiral luminescent SMM [31,32,33,34,35,36] and magneto-chiral SMM [37,38] can be obtained. To these three properties, the introduction of redox-active ligands is of interest because it could permit to switch both optical and magnetic properties depending on the oxidation state of the ligand [39,40,41,42,43,44,45,46]. One of the most used redox-active ligands is made from the tetrathiafulvalene (TTF) core because of its two mono radical and dicationic stable states which are easily accessible by chemical ways and because it can be easily decorated with one to four substituted groups able to coordinate transition metal and lanthanide ions [18,47,48,49]. Among the plethora of chemical substituents [50,51], the 1,10-phenanthroline (phen) is a remarkable choice to design donor-acceptor dyads (called also push-pull ligands) [52,53,54,55] or acceptor-donor-acceptor triads [56,57]. Once associated with metallic precursors, auspicious optical and magnetic properties are observed highlighted by the recent design of a redox-active chiral luminescent SMM displaying circularly polarized luminescence [58].
In the last example, the bis(1,10-phenantro[5,6-b])tetrathiafulvalene triad (L) was employed. The following lines propose to select this triad to bridge two Yb(hfac)3(H2O)2 (hfac- = 1,1,1,5,5,5-hexafluoroacetylacetonato anion) and two Dy(facam)3 (facam = 3-trifluoro-acetyl-(+)-camphorato anion). Thus the two dinuclear complexes of formula [Yb2(hfac)6(L)]·2(C7H16) ((1)·2(C7H16)) and [Dy2((+)facam)6(L)]·2(C6H14) ((2)·2(C6H14)) have been obtained. Their single crystal structure, magnetic and optical properties have been investigated.

2. Results and Discussion

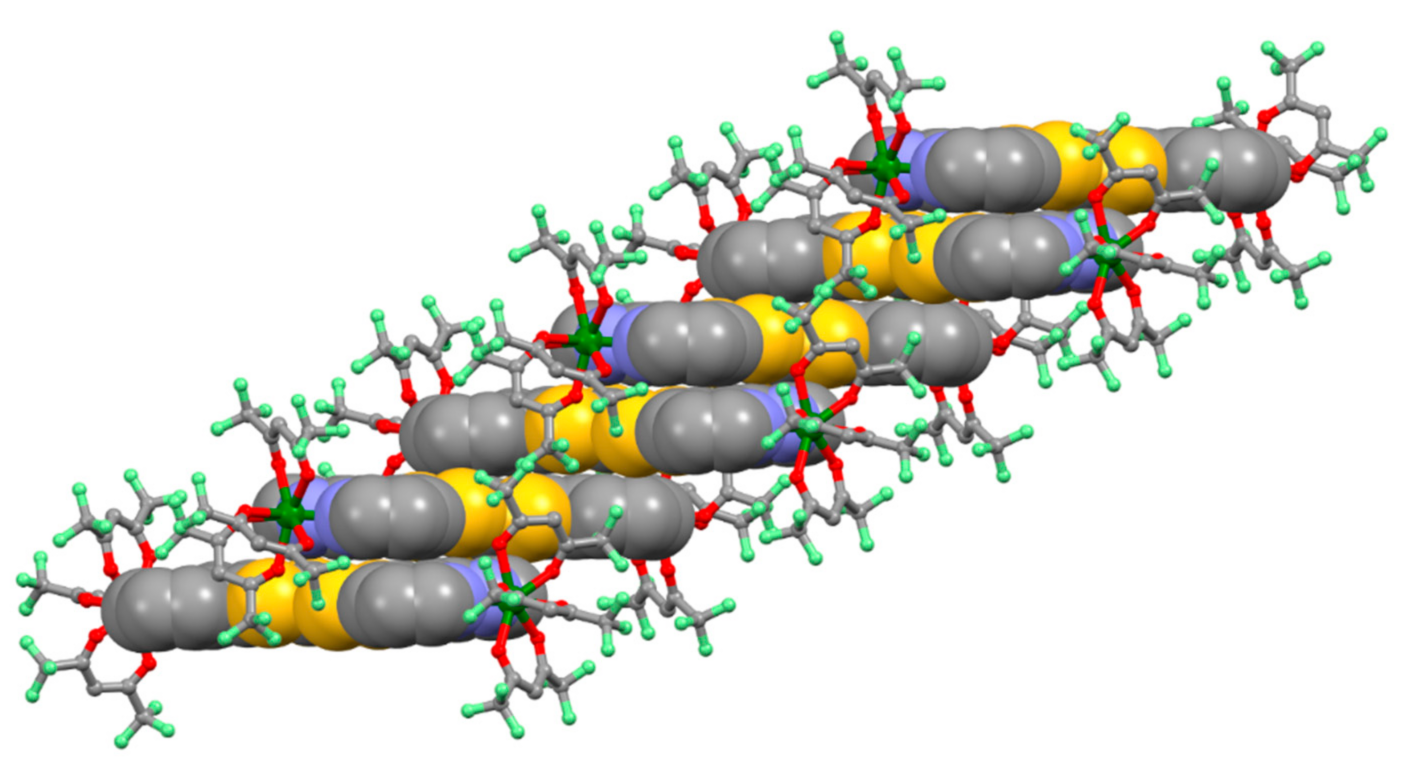
2.1. Crystal Structure Description of [Yb2(hfac)6(L)]·2(C7H16) ((1)·2(C7H16))

(1)·2(C7H16) crystallizes in the P-1 (N°2) triclinic space group. The X-ray crystallographic data for compound (1)·2(C7H16) are given in Table S1. The asymmetric unit is composed of two half dinuclear complexes of formula [Yb2(hfac)6(L)] and two n-heptane molecules of crystallization. Thus, two crystallographically independent YbIII centers are present in the molecular structure (Figure S1). At this point, it is worth noticing that the use of n-heptane instead of n-hexane induces the reduction of crystallographically independent metal centers from six to two [59]. All the YbIII centers are linked to three hfac anions and one L ligand giving an N2O6 surrounding with a D2d symmetry (triangular dodecahedron) for Yb1 and D4d symmetry (square antiprism) for Yb2 (Figure 1, Table S2). The distortion from ideal symmetry can be explained by the Yb-O bond lengths (2.285 Å) shorter than the Yb-N ones (2.481 Å) (Table S3) and it is visualized by continuous shape measures performed with SHAPE 2.1 (Table S2) [60]. The two 1,10-phenantroline coordination sites are occupied by Yb(hfac)3 units and L plays the role of bridge between two Yb(hfac)3 units (Figure 1). The bridging triads L are planar and the average C=C central distances (1.340 Å) agree with the neutral form of L [61,62]. Finally, the crystal packing highlighted the one-dimensional stacking of dinuclear complexes through π-π interactions (Figure 2). No significant S···S short contacts are present since the shortest S···S distance has been identified equally to 3.955 Å. The shortest intramolecular and intermolecular Yb-Yb distances are 17.742 Å and 9.489 Å respectively.

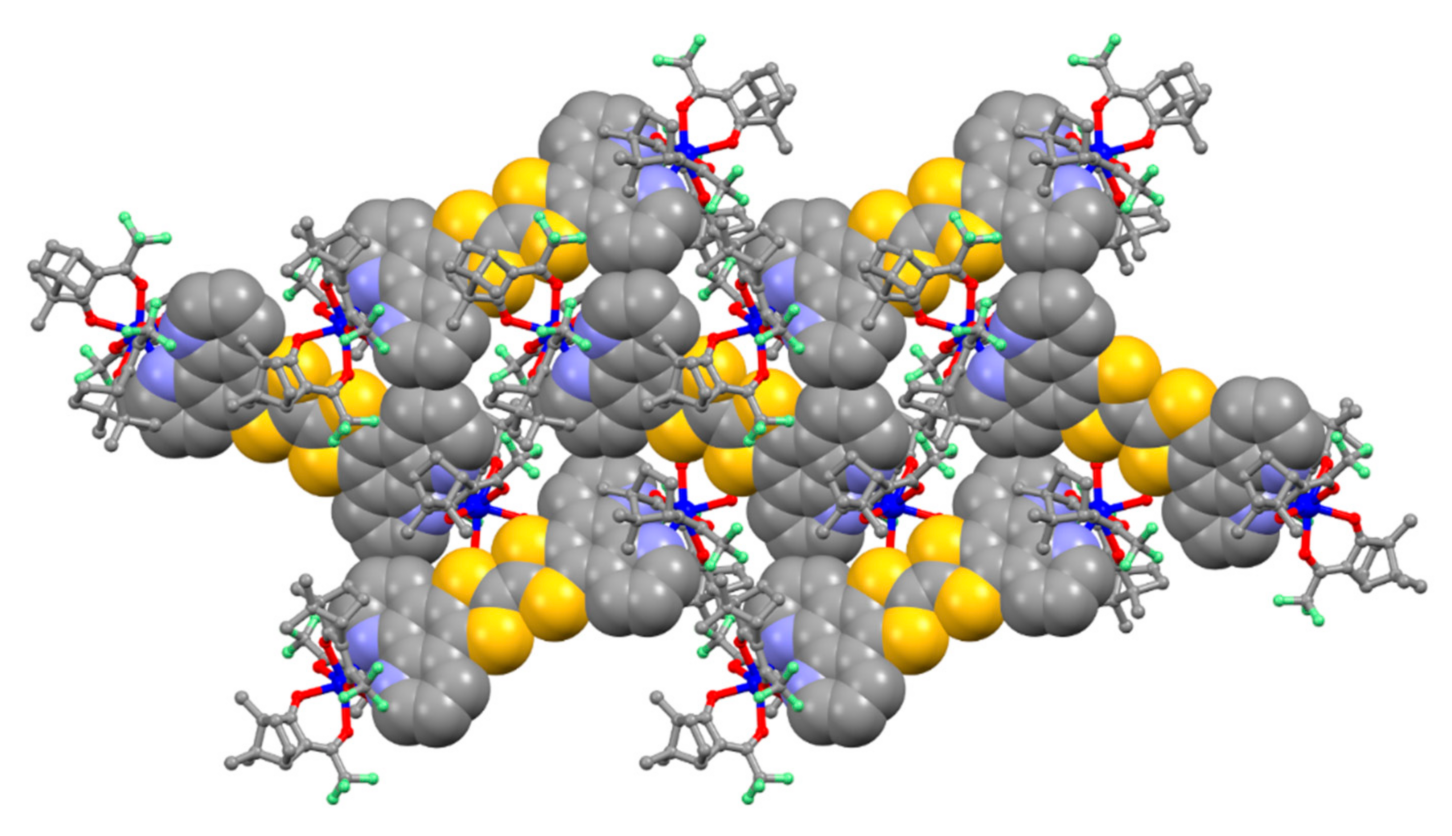
2.2. Crystal Structure Description of [Dy2((+)facam)6(L)]·2(C6H14) ((2)·2(C6H14))

(2)·2(C6H14) crystallizes in the C2 (N°5) monoclinic chiral space group. The X-ray crystallographic data for compound (2)·2(C6H14) are given in Table S1. This compound has been found isostructural to the YbIII analog recently published by some of us [57]. The asymmetric unit consists of one dinuclear complex of formula [Dy2(facam)6(L)] and two n-hexane molecules of crystallization. Thus, two crystallographically independent DyIII centers are present in the molecular structure (Figure S1). Both DyIII centers are linked to three facam anions and one L ligand giving an N2O6 surrounding with a D4d symmetry (square antiprism, Table S2) (Figure 1). The Dy-O bond lengths (2.285 Å) are shorter than the Dy-N ones (2.481 Å) (Table S3). One could remark that three short Dy-O and three longer Dy-O bond lengths for each DyIII center are observed due to the dissymmetric nature of the facam ancillary ligand. The short Dy-O distance involves the oxygen atom of the carbonyl group linked to the CF3 moiety (Table S3). The two Dy(facam)3 units are bridged by a triad L which is not rigorously planar (Figure 1). The average C=C central distances (1.331 Å) agree with the neutral form of L [61,62].
Finally, the crystal packing did not show any significant π-π stacking or S···S short contact (Figure 3) on contrary to what is observed in the X-ray structure of the achiral analog [59]. The higher steric hindrance of the facam anions compared to hfac could explain this difference. Nevertheless, short S2···O3 contacts (3.115 and 3.183 Å) between the TTF core and one facam ligand of the neighboring molecule ensure the coherence of the crystal packing. The shortest intramolecular and intermolecular Dy-Dy distances are 17.867 Å and 10.211 Å, respectively.

2.3. Electrochemical Properties

The two complexes 1 and 2 displayed two monoelectronic oxidations respectively determined at 0.87 V/1.22 V and 0.83 V/1.17 V (vs. SCE) (Figures S3 and S4, Table S4) and attributed to the formation of the radical cation and dication species of the TTF core. These potential values are in line with those observed for their analogs previously published [58,59]. Cyclic voltammetry demonstrated the reversible redox-activity of the two triad-based complexes.

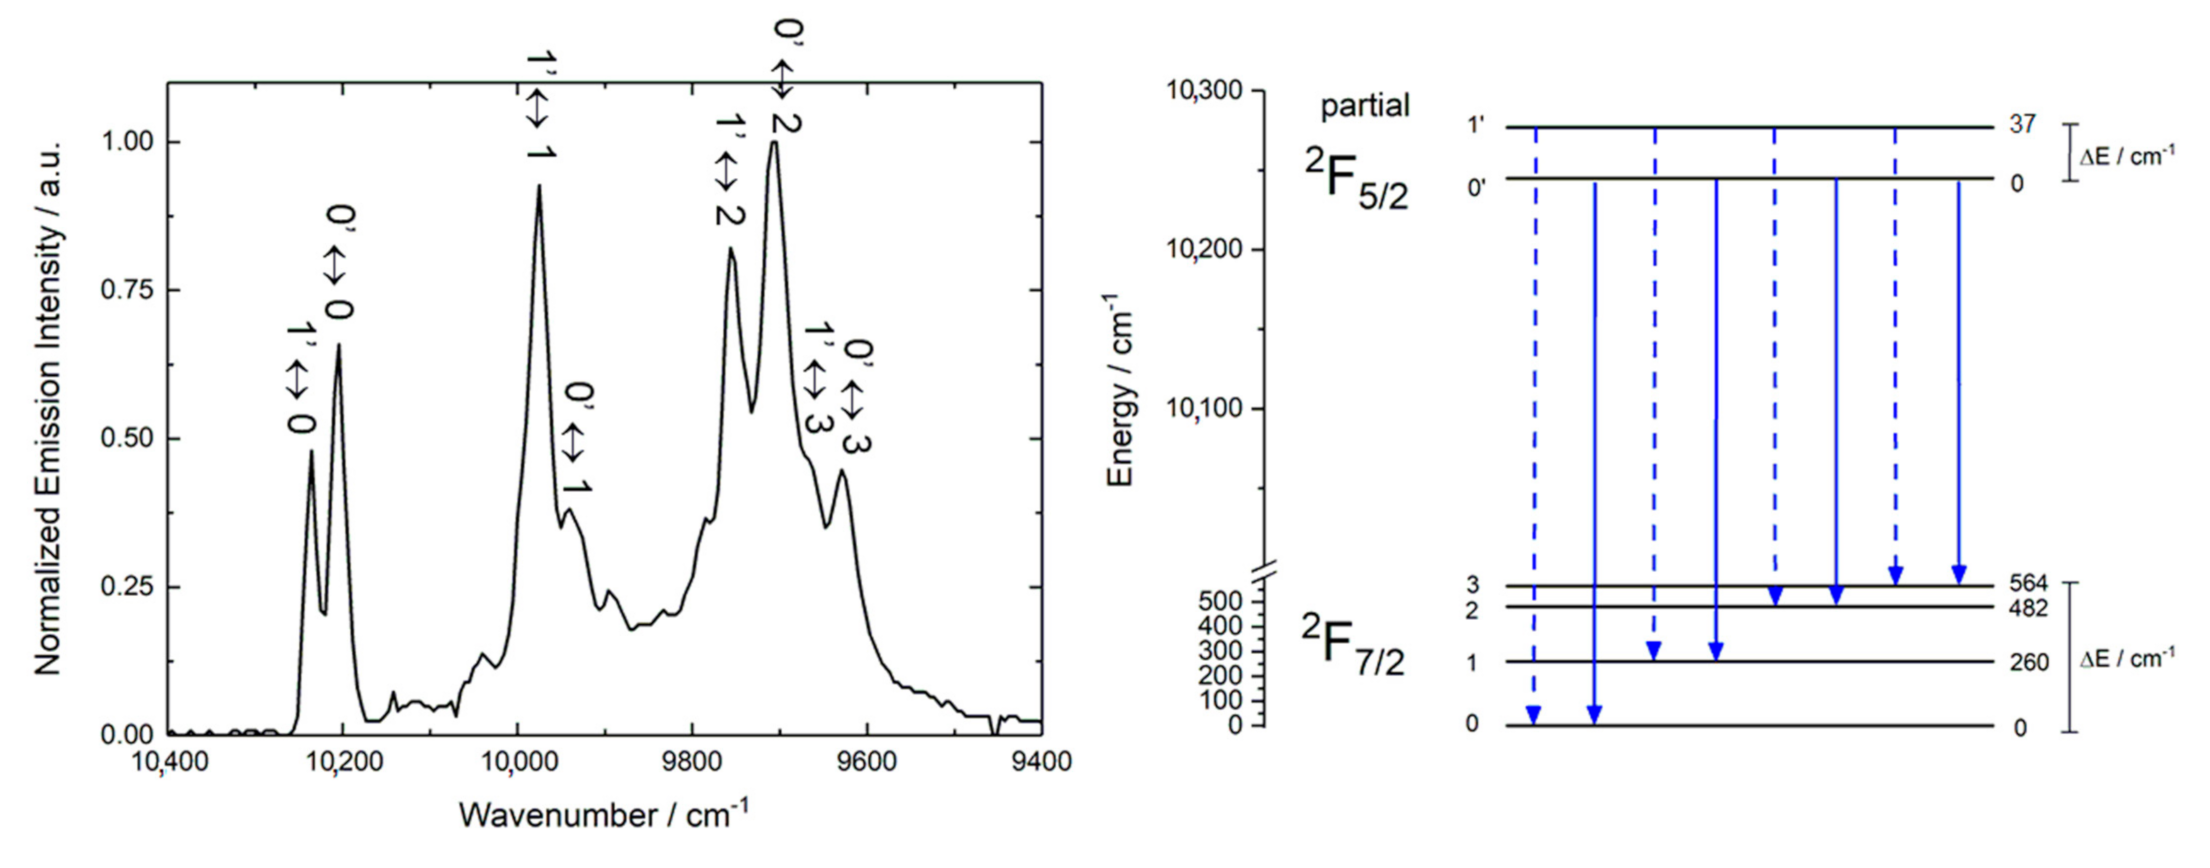
2.4. Photophysical Properties

Irradiation of the HOMO → LUMO Intra-Ligand Charge Transfer (ILCT) of L (Figures S5 and S6) [57] at 22,220 cm−1 (450 nm) in complex 1 induced a Near InfraRed (NIR) emission centered at 9900 cm−1 in the solid-state at 10 K (Figure 4). Such NIR signal is attributed to the YbIII centered 2F5/22F7/2 emission. The TTF-centered dyads or triads have been demonstrated to be efficient chromophores for the sensitization of NIR lanthanide luminescence through the antenna process [18,58]. Such efficiency for 1 is proven by the absence of residual ligand-centered emission which attests to a rather efficient energy transfer from the triad L to the YbIII ion. The low-temperature measurement allowed us to observe a well-resolved emission spectrum with several emission contributions in the energy range of 10,300–9700 cm−1. At least eight contributions could be identified with maxima at 10,235, 10,204, 9975, 9940, 9753, 9711, 9671, and 9629 cm−1 which is more than the four expected sub-states due to the splitting of the 2F7/2 ground state under the crystal field effect [63,64]. Moreover, one could remark that the energy difference between two consecutive transitions is about 37(5) cm−1 leading to the suspicion that the four additional transitions may originate from the second crystal field sublevel of the excited 2F5/2 state as proposed on the right part of Figure 4 [65,66]. These so-called “hot bands” usually disappear upon the lowering of the temperature that depopulates upper excited states [28,67,68,69]. Consequently, these “hot bands” as well as other contributions of weak intensities that appeared in the emission spectrum may be also attributed to the vibronic coupling between electronic transitions and low energy vibrational modes as recently suggested for such YbIII ion in molecular systems [38,70].
Similar light excitation into the ILCT at 22,220 cm−1 (Figure S4) for 2 cannot give the visible DyIII centered emission because of the too low-energy absorption band of L.

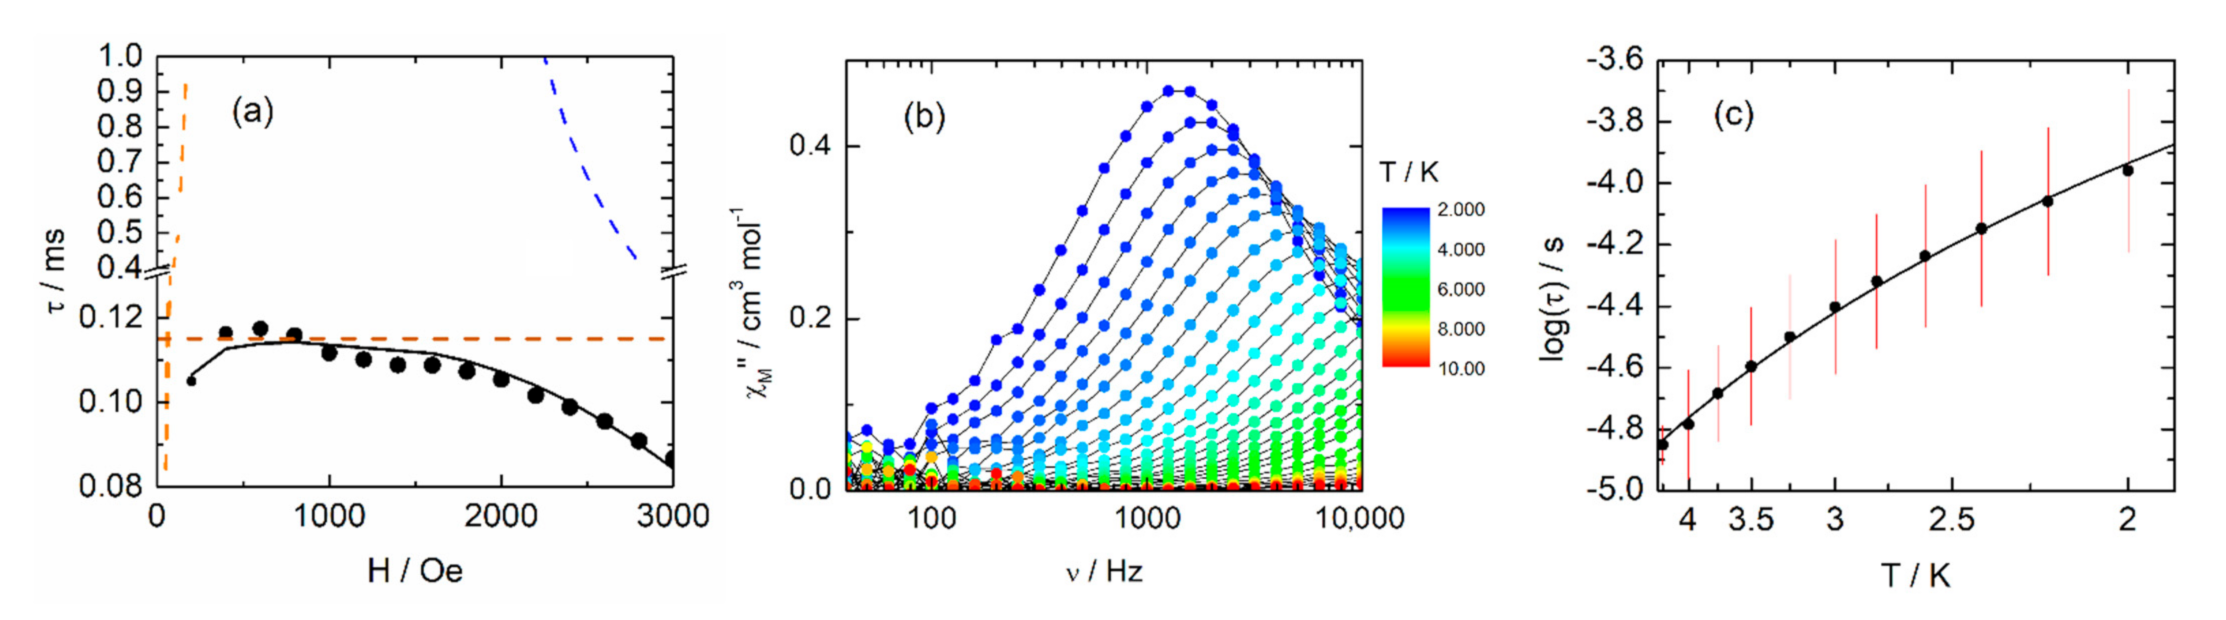
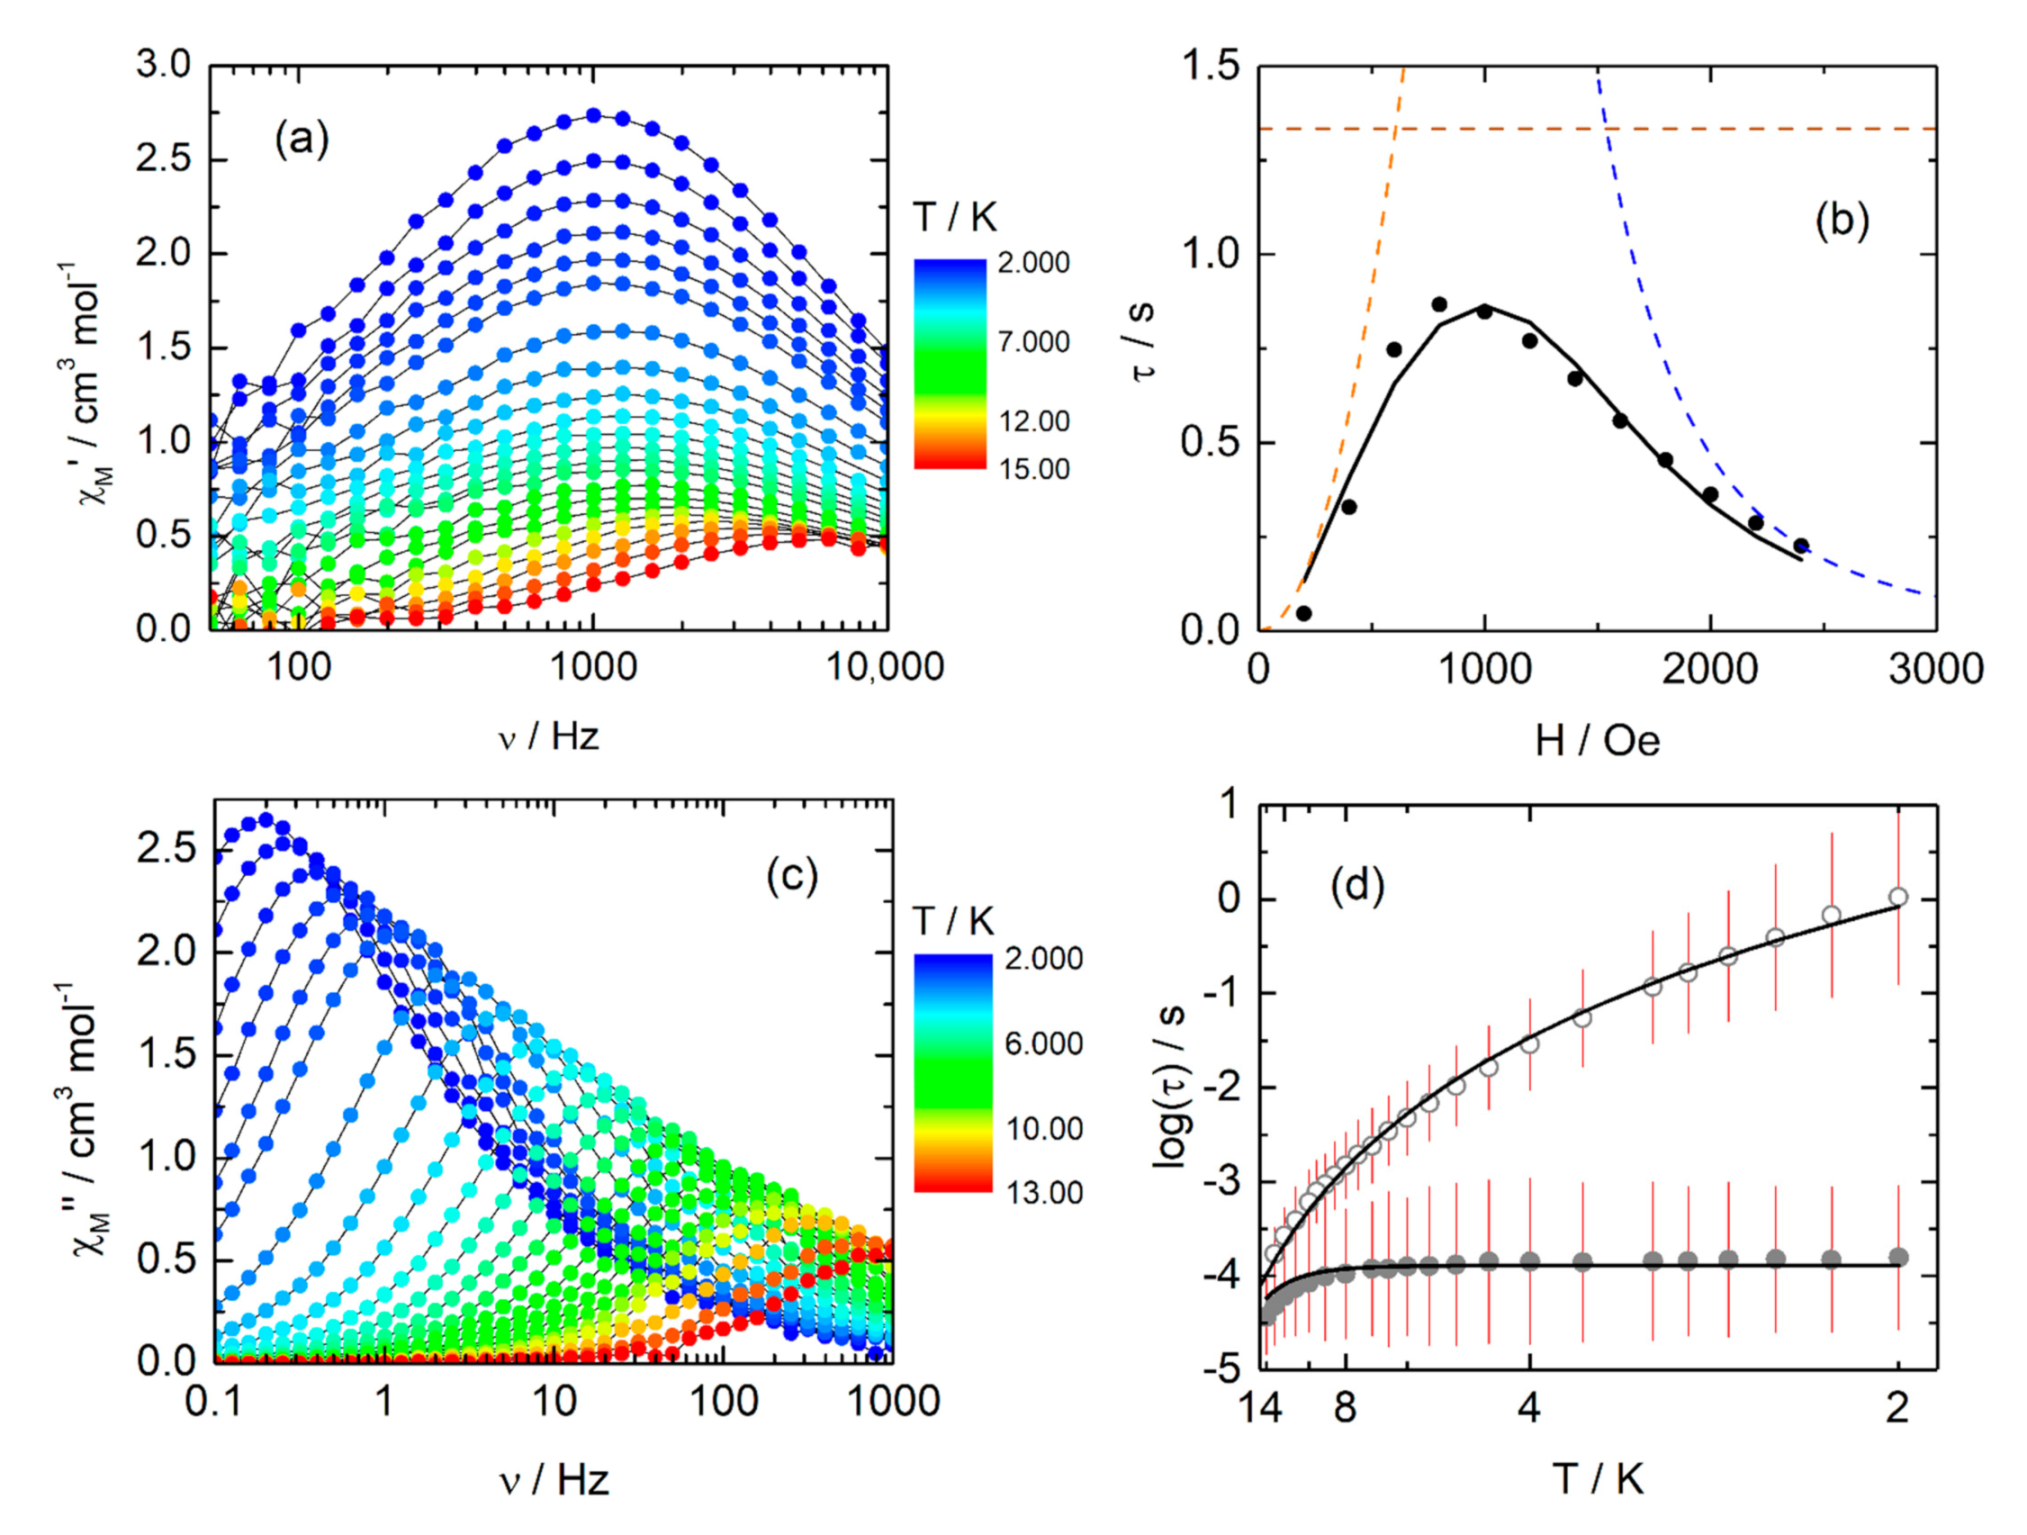
2.5. Magnetic Properties

The thermal dependence of the magnetic susceptibility (χM) and the field dependence of the magnetization (M) are given for two YbIII and DyIII centers for 1 (Figure S7) and 2 (Figure S8), respectively. The room temperature values of the χMT product are 4.97 cm3 K mol−1 for 1 and 27.47 cm3 K mol−1 for 2 in agreement with the expected values for two YbIII ions (5.14 cm3 K mol−1, 2F7/2 ground state multiplet) and two DyIII ions (28.56 cm3 K mol−1, 6H15/2 ground state multiplet) [71]. Upon cooling, χMT decreases monotonically down to 2.34 cm3 K mol−1 for 1 and 20.27 cm3 K mol−1 at 2 K. The decrease of the χMT products can be mainly attributed to the thermal depopulation of the MJ state even if the intermolecular dipolar interaction effect cannot be ruled out in case of 2. Both compounds exhibited classical magnetization for YbIII and DyIII ions in N2O6 environment with experimental values of 3.26 Nβ for 1 and 9.58 Nβ for 2 for the saturation values sign of significant magnetic anisotropy.
1 does not show any out-of-phase component of the ac susceptibility in zero external dc fields (Figure S9). Fast relaxation through Quantum Tunneling of the Magnetization (QTM) could be the origin of the lack of SMM behavior in zero fields. Nevertheless, it is well known that QTM can be canceled by applying an external dc field. Thus, the field dependence of the ac magnetic susceptibility was performed (Figure S9). The application of a moderate external dc field (0–3000 Oe) induces an out-of-phase signal in the frequency window (40–10,000 Hz) that does not significantly shift with the applied field but grows in amplitude (Figure S9). The optimum field value was determined from the τ vs. H plot as the value at which the best compromise between slow relaxing fraction, τ value and maximum amplitude are reached (Figure 5a). The τ vs. H curve was fitted with the equation 1 for the 0–3000 Oe field range (Figure 5a) [45,72].
τ 1 = B 1 1 + B 2 H 2 + 2 B 3 H m + B 4
The three terms correspond respectively to the QTM, Direct, and field-independent magnetic relaxation processes (Raman and Orbach). The best fit was obtained for B1 = 2.53 × 10⁶ s−1; B2 = 0.11 Oe−2; B3 = 1.83(19) × 10−11 s−1 K−1 Oe−4 (m fixed to 4) and B4 = 8804(114) s−1 leading at 1000 Oe to τ1 (QTM) = 23.0 s−1 (dashed orange line on Figure 5a), τ−1 (Direct) = 36.6 s−1 (dashed blue line on Figure 5a) and τ−1 (Raman + Orbach) = 8804 s−1 (dashed brown line on Figure 5a). Thus, at 1000 Oe field value, both QTM and Direct processes could be discarded while the thermal variation of the magnetic relaxation times could be fitted by using a combination of Orbach and Raman processes.
At such a field, the variation of the ac susceptibility (Figure 5b and Figure S10) with the oscillation frequency of the magnetic field can be quantitatively analyzed in the framework of the extended Debye model (Figure S11). The slowly relaxing fraction of the magnetic susceptibility represents almost the entire sample (90–95%) which means that the vast majority of the magnetic moments are involved in the relaxation process and can be visualized from the Cole–Cole plot (Figure S12). The α parameter ranges from 0.01 and 0.09 between 2 and 4.25 K (Table S6) which is in agreement with a single relaxation time. From these indications, one could conclude that both crystallographically independent YbIII displayed indistinguishable ac magnetic dynamics. The high-temperature part of the thermal variation of the relaxation time (Figure 5c) can be fitted leading to an Orbach process (τ−1 = τ0−1 exp(Δ/T) characterized by τ0 = 7(2) × 10−7 s and Δ = 12(1) K (Figure S13). The value of the effective energy barrier is much smaller than the energy gap given by the luminescence spectrum of 1 at 10 K (264 cm−1 (380 K)) which is a strong indication of the involvement of the under-energy barrier process in magnetic relaxation. Attempt to fit the log(τ) vs. T plot with combinations of Orbach + Raman process (τ−1 = τ0−1 exp(Δ/T) + CTn) led to the following parameters τ0 = 2.97(78) × 10−7 s and Δ = 21(2) K and C = 1957(220) s−1 K−n with n = 2.21(16) (Figure S14). The Orbach process appeared too slow to contribute to the magnetic relaxation in agreement with the discrepancy between the effective energy barrier and emission spectrum. As the ac magnetic susceptibility measurements have been performed under an applied dc field, the Direct process should contribute to the magnetic relaxation nevertheless the best fit of the log(τ) vs. T plot with combinations of Raman + Direct processes (τ−1 = CTn + AH4T) gave the following parameters C = 369(47) s−1 K−n with n = 3.53(8) and A = 2.44(18) × 10−9 s−1 Oe−4 K−1 (Figure S15) demonstrating that the Direct process could be involved in the magnetic relaxation at the lowest temperature (2 K). Consequently, the most reasonable fit of the thermal dependence of the relaxation time was obtained by using a Raman process only (τ−1 = CTn) with the parameters C = 1279(70) s−1 K−n with n = 2.75(5) (Figure 5c). The value of n is initially predicted equal to 9 for Kramers ions [74] when the Raman process operating through acoustic phonons (lattice vibrations) but can be found between 2 and 7 [75,76,77] because of the presence of optical phonons (molecular vibrations) [12,14].
2 shows a frequency dependence of the ac susceptibility in zero external dc fields with a non-zero out-of-phase component (χM”) (Figure 6a). The variation of the ac susceptibility (Figure 6a and Figure S16) with the oscillation frequency of the magnetic field can be quantitatively analyzed in the framework of the extended Debye model (Figure S17). The normalized Cole–Cole plot (Figure S18) allowed us to determine that the non-relaxing fraction is about 10% of the sample meaning that the measured out-of-phase component (χM”) represents almost the entire compound. The α parameter ranges from 0.18 to 0.42 between 2 and 14 K (Table S7) which is in agreement with a wide range of relaxation time due to the involvement of several relaxation processes at zero applied field. From the thermal dependence of the relaxation time (Figure 6d), one could remark that the magnetic performances of 2 are limited due to a thermally independent behavior of log(τ) vs. T attributed to the QTM. The latter could be canceled by applying an external dc field. Thus field dependence of the magnetic susceptibility was performed (Figure S19). The application of a moderate external dc field (0–3000 Oe) induces a shift to lower frequency of the out-of-phase signal from 1000 Hz at 0 Oe to about 0.2 Hz for H > 600 Oe (Figure S19). Significant dipolar intermolecular interactions are present as double contributions at 200 Oe was observed for the out-of-phase signal. The optimum field value of 1200 Oe was determined from the τ vs. H plot curve which was fitted with the equation 1 for the 0–3000 Oe field range (Figure 6b). The best fit was obtained for B1 = 6043.6 s−1; B2 = 2.23 × 10⁻² Oe−2; B3 = 6.77 × 10⁻¹⁴ s−1 K−1 Oe−4 (m fixed to 4) and B4 = 0.75 s−1 leading at 1200 Oe to τ1 (QTM) = 0.19 s−1 (dashed orange line on Figure 5a), τ−1 (Direct) = 0.28 s−1 (dashed blue line on Figure 5a) and τ−1 (Raman + Orbach) = 0.75 s−1 (dashed brown line on Figure 5a). Thus, at 1200 Oe field value, both QTM and Direct processes might be discarded while the thermal variation of the magnetic relaxation times could be fitted by using a combination of Orbach and Raman processes. At such a field, the variation of the ac susceptibility (Figure 6c and Figure S20) with the oscillation frequency of the magnetic field can be quantitatively analyzed in the framework of the extended Debye model (Figure S21). One more time the slowly relaxing fraction can be determined from the normalized Cole–Cole (about 90%) (Figure S22) and the α parameter at 1200 Oe are close to the values found at 0 Oe (from 0.10 to 0.44) (Table S9). One could notice that applying a dc magnetic field should not modify the thermally activated relaxation processes such as Orbach (τ−1 = τ0−1 exp(Δ/T) and Raman (τ−1 = CTn) processes. Consequently, Orbach and Raman parameters for thermal variation of the relaxation times at 0 Oe and 1200 Oe should be shared. The effective energy barrier was first determined from the fit of the high-temperature region of log(τ) vs. T plot of 2 at 1200 Oe using an Orbach process only (Figure S23). The best fit was obtained for τ0 = 3.2(7) × 10−6 s and Δ = 53(2) K parameters which are used to simultaneously fit the log(τ) vs. T plots at 0 Oe and 1200 Oe with shared Raman parameters and additional QTM process in zero fields. It is worth noticing that this effective energy barrier is close to the value of 55.1 K found in a similar dinuclear complex involving the simple 2,2′bipyrimidine bridging ligand instead of L [78]. The best simultaneous fit was obtained for τ0 = 3.2 × 10⁻⁶ s (fixed) and Δ = 53 K (fixed), C = 0.10(2) s−1 K−n with n = 3.94(15) and τTI = 1.30(8) × 10−4 s (Figure S24). One more time the Raman contribution at a given temperature (5 K) are of the same order of magnitude in the present and published examples. From the previous fit, it could be concluded that the Orbach process only weakly contributes in the temperature range of 2–14 K. Thus a simultaneous fit could be performed by using a combination of Raman and QTM (H = 0 Oe) and Raman only (H = 1200 Oe) processes for which the Raman parameters are shared. The best fit is depicted in Figure 6d with the following parameters C = 0.049(5) s−1 K−n with n = 4.6(6) and τTI = 1.30(5) × 10−4 s. Importantly, τTI fitted from thermal variation matches the zero-field limit of Equation (1) (B1−1) obtained from field variations.
The Raman process operates through both acoustic phonons (lattice vibrations) and optical phonons (molecular vibrations) since the n value is weaker than the one expected (n = 9) for a pure acoustic phonon-assisted Raman relaxation.
One could remark that changing the ancillary hfac with the facam ligand enhanced the magnetic performances for both DyIII and YbIII. Indeed, at 2 K, 1 displayed a χM” peak centered at 1500 Hz while [Yb(facam)3(L)]2 displayed a χM” peak centered at 100 Hz [58]. Similarly, 2 displayed a χM” peak centered at 1000 Hz (H = 0 Oe) and 0.2 Hz (H = 1200 Oe) while [Dy(hfac)3(L)]2·CH2Cl2·C6H14 displayed no SMM behavior at 0 Oe and a χM” peak centered at 2 Hz at 1000 Oe [59].

3. Experimental Section

3.1. Synthesis of [Yb2(hfac)6(L)]·2(C7H16) ((1)·2(C7H16))

The precursor Yb(hfac)3(H2O)2 (hfac = 1,1,1,5,5,5-hexafluoroacetylacetonate) [79], Dy((+)facam)3 (facam = 3-trifluoro-acetyl-(+)-camphorato anion) [58] and the bis(1,10-phenantro[5,6-b])tetrathiafulvalene ligand [57] were synthesized by following previously reported methods. All other reagents were purchased from Aldrich Co., Ltd. (St. Louis, MO, USA) used without further purification. All solid-state characterization studies (elementary analysis, IR, photo-physical and magnetic susceptibility measurements) were performed on dried samples and are considered without solvent of crystallization.

3.2. Synthesis of Complex {[Dy(hfac)3(L)]·2C6H14}n 1

11 mg of L (0.022 mmol) were added to 20 mL of 1,2-dichloroethane. The suspension was heated to reflux and then a solution of 10 mL of 1,2-dichloroethane containing 36.1 mg of Yb(hfac)3(H2O)2 (0.044 mmol) was added. After 6 h of reflux, the 1,2-dichloroethane was eliminated under vacuum and the residue was dissolved in CH2Cl2. n-heptane was layered on the CH2Cl2 solution of 1 in the dark to give red single crystals suitable for X-ray diffraction study. Yield 37.5 mg (73%) for 1. I.R. bands (KBr): 2970, 1650, 1564, 1538, 1498, 1465, 1255, 1218, 1147, 1098, 801, 662, and 587 cm−1. Anal. Calcd (%) for C60H18Yb6F108N12O36S12 (1): C 33.64, H 1.51, N 2.49; found: C 33.71, H 1.66 N, 2.37.

3.3. Synthesis of [Dy2((+)facam)6(L)]·2(C6H14) ((2)·2(C6H14))

11 mg of L (0.022 mmol) were added to 20 mL of 1,2-dichloroethane. The suspension was heated to reflux and then a solution of 10 mL of 1,2-dichloroethane containing 39.6 mg of Dy((+)facam)3 (0.044 mmol) was added. After 6 h of reflux, the 1,2-dichloroethane was eliminated under vacuum and the residue was dissolved in CH2Cl2. n-hexane was layered on the CH2Cl2 solution of 2 in the dark to give red single crystals. Yield 41.3 mg (81%) for 2. I.R. bands (KBr): 2969, 1649, 1564, 1537, 1501, 1464, 1260, 1216, 1147, 1100, 801, 660, and 590 cm−1. Anal. Calcd (%) for 2 C98H96Dy2F18N4O12S4: C 50.76, H 4.14, N 2.42; found: C 51.07, H 4.19 N, 2.34.

3.4. Crystallography

Single crystal of (1)·2(C7H16) and (2)·2(C6H14) were mounted on a D8 VENTURE Bruker-AXS diffractometer for data collection (MoKα radiation source, λ = 0.71073 Å), from the Centre de Diffractométrie X (CDIFX), Université de Rennes 1, France. The structure was solved with a direct method using the SHELXT program [80] and refined with a full-matrix least-squares method on F2 using the SHELXL-14/7 program [81]. A SQUEEZE procedure of PLATON [82] was performed as the structures for (1)·2(C7H16) and (2)·2(C6H14) contain large solvent-accessible voids in which residual peaks of diffraction were observed. Crystallographic data are summarized in Table S1. Complete crystal structure results as a CIF file (CCDC 2,086,542 for (1)·2(C7H16) and CCDC 2,086,543 for (2)·2(C6H14)) including bond lengths, angles, and atomic coordinates are deposited as Supplementary Materials.

3.5. Physical Measurements

The elementary analyses of the compounds were performed at the Centre Régional de Mesures Physiques de l’Ouest, Rennes.
Cyclic voltammetry was carried out in dried and degassed CH2Cl2 solution, containing 0.1M N(C4H9)4PF6 as supporting electrolyte. Voltammograms were recorded at 100 mVs−1 at a platinum disk electrode. The potentials were measured vs. a saturated calomel electrode (SCE).
Absorption spectra were recorded on a JASCO V-650 spectrophotometer in diluted solution, using spectrophotometric grade solvents.
Solid-state emission and excitation spectra were measured using a Horiba Jobin Yvon Fluorolog-3® spectrofluorimeter, equipped with a three slit double grating excitation and emission monochromator with the dispersion of 2.1 nm mm−1 (1200 grooves mm−1). The steady-state luminescence was excited by unpolarized light from a 450 W xenon CW lamp and detected at an angle of 90° by a liquid nitrogen-cooled InGAs detector. Spectra were reference corrected for both the excitation intensity variation and the emission spectral response. Solid sample was placed in a 0.5 mm diameter quartz tube that was set into an Oxford Instrument cryostat (Optistat CF2) insert directly in the sample chamber of the spectrofluorimeter. The interference signals due to scattered excitation light were suppressed by a 780 nm high pass filter placed at the entry of the emission monochromator.
The dc magnetic susceptibility measurements were performed on a solid polycrystalline sample with a Quantum Design MPMS-XL SQUID magnetometer between 2 and 300 K in the applied magnetic field of 0.2 T for temperatures of 2–20 K, 1 T for temperatures of 20–300 K for 1 while 0.02 T for temperatures of 2–20 K, 0.2 T for temperatures of 20–80 K and 1 T for temperatures of 80–300 K were used for 2. The ac magnetic susceptibility measurements were performed using a Quantum Design MPMS-XL SQUID for frequencies between 1 and 1000 Hz and Quantum Design PPMS magnetometers for frequencies between 50 and 10,000 Hz. These measurements were all corrected for the diamagnetic contribution as calculated with Pascal’s constants.

4. Conclusions and Outlook

Two dinuclear complexes of formula [Yb2(hfac)6(L)]·2(C7H16) and [Dy2((+)facam)6(L)]·2(C6H14) were obtained using the bridging bis(1,10-phenantro[5,6-b])tetrathiafulvalene triad and their structural properties determined by X-ray diffraction on single crystal. Both compounds displayed field-induced Single-Molecule Magnet behavior with the magnetization mainly relaxing through a Raman process. The DyIII derivative displayed also a slow magnetic relaxation of its magnetization in zero applied dc field with a Quantum Tunneling of the Magnetization identified at low temperature. Light irradiation of the visible HUMO→LUMO intra-ligand charge transfer of the YbIII derivative induced Near-Infrared emission of the metal center. The energy gap between the two lowest energy emissive contributions (260 cm−1) confirmed the non-significant Orbach process in the magnetic relaxation. In both compounds, the TTF-based bridging triad is in its neutral form nevertheless its redox-activity opens the route to redox switching of the optical and magnetic properties.

Supplementary Materials

The following are available online at https://0-www-mdpi-com.brum.beds.ac.uk/article/10.3390/inorganics9070050/s1: CIF and CIF-checked file; Figure S1: ORTEP view of the asymmetric unit for (1)·2(C7H16). Thermal ellipsoids are drawn at 30% probability. Hydrogen atoms and solvent molecules of crystallization are omitted for clarity; Figure S2: ORTEP view of the asymmetric unit for (2)·2(C6H14). Thermal ellipsoids are drawn at 30% probability. Hydrogen atoms and solvent molecules of crystallization are omitted for clarity; Figure S3: Cyclic voltammograms of 1 in CH2Cl2 at a scan rate of 100 mV·s−1. The potentials were measured vs. a saturated calomel electrode (SCE) with Pt wires as working and counter electrodes; Figure S4: Cyclic voltammetry of 2 in CH2Cl2 at a scan rate of 100 mV.s−1. The potentials were measured versus a saturated calomel electrode (SCE) with Pt wire as the counter electrodes; Figure S5: Experimental UV-visible absorption spectrum at room temperature of 1 in CH2Cl2 solution (C = 4 × 10⁻⁵ mol L−1); Figure S6: Experimental UV-visible absorption spectrum at room temperature of 2 in CH2Cl2 solution (C = 4 × 10⁻⁵ mol L−1); Figure S7: Thermal dependence of the χMT product between 2 and 300 K for 1. In the inset, the field dependence of the magnetization at 2 K for 1; Figure S8: Thermal dependence of the χMT product between 2 and 300 K for 2. In the inset, the field dependence of the magnetization at 2 K for 2; Figure S9: In-phase (left) and out-of-phase (right) components of the ac magnetic susceptibility for 1 at 2 K under a DC magnetic field from 0 to 3000 Oe; Figure S10: Frequency dependence of the in-phase component of the magnetic susceptibility under an applied magnetic field of 1000 Oe between 2 and 10 K for 1; Figure S11: Frequency dependence of the in-phase (χM’) and out-of-phase (χM”) components of the ac susceptibility measured on powder at 2 K and 1000 Oe with the best-fitted curves (red lines) for 1; Figure S12: Normalized Cole–Cole plot for 1 at several temperatures between 2 and 4.25 K under an applied magnetic field of 1000 Oe. Black lines are the best-fitted curves; Figure S13: Temperature dependence of the relaxation time for 1 at 1000 Oe in the temperature range 2–4.25 K. Green dashed lines corresponds to the thermally activated contribution (Orbach process with the parameters given in the main text); Figure S14: Temperature dependence of the relaxation time for 1 at 1000 Oe in the temperature range of 2–4.25 K with the best-fitted curve (full black line) with the combination Orbach + Raman processes. The Orbach and Raman contributions to the relaxation time are respectively represented in dashed green line and dashed red line (the parameters are given in the main text); Figure S15: Temperature dependence of the relaxation time for 1 at 1000 Oe in the temperature range of 2–4.25 K with the best-fitted curve (full black line) with the combination Raman + Direct processes. The Raman and Direct contributions to the relaxation time are respectively represented in dashed red line and dashed blue line (the parameters are given in the main text); Figure S16: Frequency dependence of the in-phase component of the magnetic susceptibility under a zero applied magnetic field between 2 and 15 K for 2; Figure S17: Frequency dependence of the in-phase (χM’) and out-of-phase (χM") components of the ac susceptibility measured on powder at 2 K in zero applied dc field with the best-fitted curves (red lines) for 2; Figure S18: Normalized Cole–Cole plot for 2 at several temperatures between 2 and 15 K under a zero applied magnetic field. Black lines are the best-fitted curves; Figure S19: In-phase (left) and out-of-phase (right) components of the ac magnetic susceptibility for 2 at 2 K under a DC magnetic field from 0 to 2400 Oe; Figure S20: Frequency dependence of the in-phase component of the magnetic susceptibility under a 1200 Oe applied magnetic field between 2 and 13 K for 2; Figure S21: Frequency dependence of the in-phase (χM’) and out-of-phase (χM”) components of the ac susceptibility measured on powder at 2 K and 1200 Oe with the best-fitted curves (red lines) for 2; Figure S22: Normalized Cole–Cole plot for 2 at several temperatures between 2 and 13 K under a 1200 Oe applied magnetic field. Black lines are the best-fitted curves; Figure S23: Temperature dependence of the relaxation time for 2 at 1200 Oe in the temperature range 2–13 K. Greenline corresponds to the thermally activated contribution (Orbach process with the parameters given in the main text). Figure S24: Temperature dependence of the relaxation time for 2 at 0 Oe (full gray circles) and 1200 Oe (open gray circles) in the temperature range of 2–15 K with the best-fitted curve (full black line) with the combination Orbach + Raman + QTM (for H = 0 Oe) processes. The Orbach, Raman, and QTM contributions to the relaxation time are respectively represented in the dashed green line, dashed red line, and dashed orange line (the parameters are given in the main text). Table S1: X-ray crystallographic data for (1)·2(C7H16) and (2)·2(C6H14); Table S2: SHAPE analysis of the coordination polyhedra around the lanthanide in the polymeric compounds; Table S3: Selected bond lengths for (1)·2(C7H16) and (2)·2(C6H14) in Å; Table S4: Oxidation potentials of the complexes 1 and 2 (V vs. SCE, nBu4NPF6, 0.1 M in CH2Cl2 at 100 mV.s−1); Table S5: Best fitted parameters (χT, χS, τ and α) with the extended Debye model for compound 1 at 2 K in the magnetic field range 200–3000 Oe; Table S6: Best fitted parameters (χT, χS, τ and α) with the extended Debye model for compound 1 at 1000 Oe in the temperature range 2–4.25 K; Table S7: Best fitted parameters (χT, χS, τ and α) with the extended Debye model for compound 2 at 0 Oe in the temperature range 2–14 K; Table S8: Best fitted parameters (χT, χS, τ and α) with the extended Debye model for compound 2 at 2 K in the magnetic field range 200–2400 Oe; Table S9: Best fitted parameters (χT, χS, τ and α) with the extended Debye model for compound 2 at 1200 Oe in the temperature range 2–13 K.

Author Contributions

B.L. made the synthesis, J.F.G., C.A.M., and O.C. performed the magnetic measurements and interpreted them, V.D. performed the single-crystal X-ray diffraction study, F.P. elaborated and supervised the project, O.C. and F.P. participated in the writing process of the manuscript. All authors have read and agreed to the published version of the manuscript.

Funding

This work was supported by the CNRS through the France-Russia MULTISWITCH PRC Grant (N°227606), Université de Rennes 1, and European Commission through the ERC-CoG 725184 MULTIPROSMM (Project N°725184).

Institutional Review Board Statement

Not applicable.

Informed Consent Statement

Not applicable.

Data Availability Statement

Not applicable.

Acknowledgments

Authors thank François Riobé and Olivier Maury (ENS Lyon) for help in the acquisition of the luminescence spectra and Boris Le Guennic for scientific discussion.

Conflicts of Interest

The authors declare no conflict of interest.

Abbreviations

The following abbreviations are used in this manuscript
SMMSingle-Molecule Magnet
QTMQuantum Tunneling of the Magnetization
Hfac1,1,1,5,5,5-hexafluoroacetylacetonato anion
Facam3-trifluoro-acetyl-(+)-camphorato anion
Phen1,10-phenantroline
TTFTetrathiafulvalene
HOMOHighest Occupied Molecular Orbital
LUMOLowest Unoccupied Molecular Orbital
ILCTIntra-Ligand Charge Transfer
CH2Cl2dichloromethane

References

  1. Sessoli, R.; Powell, A.K. Strategies towards single molecule magnets based on lanthanide ions. Coord. Chem. Rev. 2009, 253, 2328–2341. [Google Scholar] [CrossRef]
  2. Woodruff, D.N.; Winpenny, R.E.P.; Layfield, R.A. Lanthanide single-molecule magnets. Chem. Rev. 2013, 113, 5110–5148. [Google Scholar] [CrossRef] [PubMed]
  3. Zhang, P.; Guo, Y.-N.; Tang, J. Recent advances in dysprosium-based single molecule magnets: Structural overview and synthetic strategies. Coord. Chem. Rev. 2013, 257, 1728–1763. [Google Scholar] [CrossRef]
  4. Ungur, L.; Lin, S.-Y.; Tang, J.; Chibotaru, L.F. Single-molecule toroics in Ising-type lanthanide molecular clusters. Chem. Soc. Rev. 2014, 43, 6894–6905. [Google Scholar] [CrossRef] [PubMed]
  5. Feltham, H.L.C.; Brooker, S. Review of purely 4f and mixed-metal nd-4f single-molecule magnets containing only one lanthanide ion. Coord. Chem. Rev. 2014, 276, 1–33. [Google Scholar] [CrossRef]
  6. Liddle, S.T.; Van Slageren, J. Improving f-element single molecule magnets. Chem. Soc. Rev. 2015, 44, 6655–6669. [Google Scholar] [CrossRef] [Green Version]
  7. Gupta, S.K.; Murugavel, R. Enriching lanthanide single-ion magnetism through symmetry and axiality. Chem. Commun. 2018, 54, 3685–3696. [Google Scholar] [CrossRef]
  8. Liu, J.-L.; Chen, Y.-C.; Tong, M.-L. Symmetry strategies for high performance lanthanide-based single-molecule magnets. Chem. Soc. Rev. 2018, 47, 2431–2453. [Google Scholar] [CrossRef]
  9. Zhu, Z.; Guo, M.; Li, X.-L.; Tang, J. Molecular magnetism of lanthanide: Advances and perspectives. Coord. Chem. Rev. 2019, 378, 350–364. [Google Scholar] [CrossRef]
  10. Parmar, V.S.; Mills, D.P.; Winpenny, R.E.P. Mononuclear Dysprosium Alkoxide and Aryloxide Single-Molecule Magnets. Chem. Eur. J. 2021, 27, 7625–7645. [Google Scholar] [CrossRef]
  11. Goodwin, C.A.P.; Ortu, F.; Reta, D.; Chilton, N.F.; Mills, D.P. Molecular magnetic hysteresis at 60 kelvin in dysprocenium. Nature 2017, 548, 439–442. [Google Scholar] [CrossRef]
  12. Guo, F.-S.; Day, B.M.; Chen, Y.-C.; Tong, M.-L.; Mansikkamäki, A.; Layfield, R.A. Magnetic hysteresis up to 80 kelvin in a dysprosium metallocene single-molecule magnet. Science 2018, 362, 1400–1403. [Google Scholar] [CrossRef] [Green Version]
  13. Aromi, G.; Aguila, D.; Gamez, P.; Luis, F.; Roubeau, O. Design of magnetic coordination complexes for quantum computing. Chem. Soc. Rev. 2012, 41, 537–546. [Google Scholar] [CrossRef] [PubMed]
  14. Thiele, S.; Balestro, F.; Ballou, R.; Klyatskaya, S.; Ruben, M.; Wernsdorfer, W. Electrically driven nuclear spin reconance in single-molecule magnets. Science 2014, 344, 1135–1138. [Google Scholar] [CrossRef]
  15. Piguet, C.; Bünzli, J.-C.G. Mono-and polymetallic lanthanide-containing functional assemblies: A field between tradition and novelty. Chem. Soc. Rev. 1999, 28, 347–358. [Google Scholar] [CrossRef]
  16. Comby, S.; Bünzli, J.-C.G. Handbook on the Physics and Chemistry of Rare Earths; Elsevier BV: Amsterdam, The Netherlands, 2007. [Google Scholar]
  17. Cucinotta, G.; Perfetti, M.; Luzon, J.; Etienne, M.; Car, P.-E.; Caneschi, A.; Calvez, G.; Bernot, K.; Sessoli, R. Magnetic Anisotropy in a Dysprosium/DOTA Single-Molecule Magnet: Beyond Simple Magneto-Structural Correlations. Angew. Chem. Int. Ed. 2012, 51, 1606–1610. [Google Scholar] [CrossRef]
  18. Pointillart, F.; Le Guennic, B.; Cador, O.; Maury, O.; Ouahab, L. Lanthanide Ion and Tetrathiafulvalene-Based Ligand as a “magic” Couple toward Luminescence, Single-Molecule Magnets, and Magnetostructural Correlations. Acc. Chem. Res. 2015, 48, 2834–2842. [Google Scholar] [CrossRef]
  19. Jia, J.-H.; Li, Q.-W.; Chen, Y.-C.; Liu, J.-L.; Tong, M.-L. Luminescent single-molecule magnets based on lanthanides: Design strategies, recent advances and magneto-luminescent studies. Coord. Chem. Rev. 2019, 378, 365–381. [Google Scholar] [CrossRef]
  20. Gendron, F.; Di Pietro, S.; Galan, L.A.; Riobé, F.; Placide, V.; Guy, L.; Zinna, F.; Di Bari, L.; Bensalah-Ledoux, A.; Guyot, Y.; et al. Luminescence, chiroptical, magnetic and ab initio crystal-field characterizations of an enantiopure helicoidal Yb(III) complex. Inorg. Chem. Front. 2021, 8, 914–926. [Google Scholar] [CrossRef]
  21. Li, X.-J.; Chen, C.-L.; Xiao, H.-P.; Wang, A.-L.; Liu, C.-M.; Zheng, X.; Gao, L.-J.; Yanga, X.-G.; Fang, S.-M. Luminescent, magnetic and ferroelectric properties of noncentrosymmetric chain-like complexes composed of ninecoordinate lanthanide ions. Dalton Trans. 2013, 42, 15317–15325. [Google Scholar] [CrossRef]
  22. Long, J.; Vallat, R.; Ferreira, R.A.S.; Carlos, L.D.; Almeida Paz, F.A.; Guari, Y.; Larionova, J. A bifunctional luminescent single-ion magnet: Towards correlation between luminescence studies and magnetic slow relaxation processes. Chem. Commun. 2012, 48, 9974–9976. [Google Scholar] [CrossRef] [PubMed]
  23. Pointillart, F.; Le Guennic, B.; Cauchy, T.; Golhen, S.; Cador, O.; Maury, O.; Ouahab, L. A Series of Tetrathiafulvalene-Based Lanthanide Complexes Displaying Either Single Molecule Magnet or Luminescence-Direct Magnetic and Photo-Physical Correlations in the Ytterbium Analogue. Inorg. Chem. 2013, 52, 5978–5990. [Google Scholar] [CrossRef] [PubMed]
  24. Ren, M.; Bao, S.; Wang, B.-W.; Ferreira, R.A.S.; Zheng, L.-M.; Carlos, L.D. Lanthanide phosphonates with pseudo-D5 h local symmetry exhibiting magnetic and luminescence bifunctional properties. Inorg. Chem. Front. 2015, 2, 558–566. [Google Scholar] [CrossRef]
  25. Long, J.; Mamontova, E.; Freitas, V.; Luneau, D.; Vieru, V.; Chibotaru, L.F.; Ferreira, R.A.S.; Félix, G.; Guari, Y.; Carlos, L.D.; et al. Study of the influence of magnetic dilution over relaxation processes in a Zn/Dy single-ion magnet by correlation between luminescence and magnetism. RSC Adv. 2016, 6, 108810–108818. [Google Scholar] [CrossRef]
  26. Brunet, G.; Marin, R.; Monk, M.; Resch-Genger, U.; Galico, D.A.; Sigoli, F.A.; Suturina, E.A.; Hemmer, E.; Murugesu, M. Exploring the dual functionality of an ytterbium complex for luminescence thermometry and slow magnetic relaxation. Chem. Sci. 2019, 10, 6799–6808. [Google Scholar] [CrossRef]
  27. Marin, R.; Brunet, G.; Murugesu, M. Shining New Light on Multifunctional Lanthanide Single-Molecule Magnets. Angew. Chem. Int. Ed. 2021, 60, 1728–1746. [Google Scholar] [CrossRef]
  28. Guettas, D.; Gendron, F.; Fernandez Garcia, G.; Riobé, F.; Roisnel, T.; Maury, O.; Pilet, G.; Cador, O.; Le Guennic, B. Luminescence-Driven Electronic Structure Determination in a Textbook Dimeric Dy(III)-based Single Molecule Magnet. Chem. Eur. J. 2020, 26, 4389–4395. [Google Scholar] [CrossRef]
  29. Casanovas, B.; Speed, S.; El Fallah, M.S.; Vicente, R.; Font-Bardia, M.; Zinna, F.; Di Bari, L. Chiral dinuclear Ln(III) complexes derived from S-and R-2-(6-methoxy-2-naphthyl) propionate. Optical and magnetic properties. Dalton Trans. 2019, 48, 2059–2067. [Google Scholar] [CrossRef]
  30. Li, D.-P.; Wang, T.-W.; Li, C.-H.; Liu, D.-S.; Li, Y.-Z.; You, X.-Z. Single-ion magnets based on mononuclear lanthanide complexes with chiral Schiff base ligands [Ln(FTA)3L] (Ln = Sm, Eu, Gd, Tb and Dy). Chem. Commun. 2010, 46, 2929–2931. [Google Scholar] [CrossRef]
  31. Li, X.-L.; Chen, C.-L.; Gao, Y.-L.; Liu, C.-M.; Feng, X.-L.; Gui, Y.-H.; Fang, S.-M. Modulation of Homochiral DyIII Complexes: Single-Molecule Magnets with Ferroelectric Properties. Chem. Eur. J. 2012, 18, 14632–14637. [Google Scholar] [CrossRef]
  32. Long, J.; Ivanov, M.; Khomchenko, V.; Mamontova, E.; Thibaud, J.-M.; Rouquette, J.; Beaudhuin, M.; Granier, D.; Ferreira, R.A.S.; Carlos, L.; et al. Room temperature magnetoelectric coupling in a molecular ferroelectric ytterbium(III) complex. Science 2020, 367, 671–676. [Google Scholar] [CrossRef]
  33. Long, J.; Rouquette, J.; Thibaud, J.-M.; Ferreira, R.A.R.; Carlos, L.D.; Donnadieu, B.; Vieru, V.; Chibotaru, L.F.; Konczewicz, L.; Haines, J.; et al. A High—Temperature Molecular Ferroelectric Zn/Dy Complex Exhibiting Single-Ion-Magnet Behavior and Lanthanide Luminescence. Angew. Chem. Int. Ed. 2015, 54, 2236–2240. [Google Scholar] [CrossRef]
  34. Li, X.-L.; Hu, M.; Yin, Z.; Zhu, C.; Liu, C.-M.; Xiao, H.-P.; Fang, S. Enhancement single-ion magnetic and ferroelectric properties of mononuclear Dy(III) enantiomeric pairs through the coordination role of chiral ligands. Chem. Commun. 2017, 53, 3998–4001. [Google Scholar] [CrossRef]
  35. Mattei, C.A.; Montigaud, V.; Gendron, F.; Denis-Quanquin, S.; Dorcet, V.; Giraud, N.; Riobé, F.; Argouarch, G.; Maury, O.; Le Guennic, B.; et al. Solid-state versus solution investigation of a luminescent chiral BINOL-derived bisphosphate single-molecule magnet. Inorg. Chem. Front. 2021, 8, 947–962. [Google Scholar] [CrossRef]
  36. Mattei, C.A.; Montigaud, V.; Dorcet, V.; Riobé, F.; Argouarch, G.; Maury, O.; Le Guennic, B.; Cador, O.; Lalli, C.; Pointillart, F. Luminescent dysprosium single-molecule magnets made from designed chiral BINOL-derived bisphosphate ligands. Inorg. Chem. Front. 2021, 8, 963–976. [Google Scholar] [CrossRef]
  37. Wang, K.; Zeng, S.; Wang, H.; Dou, J.; Jiang, J. Magnetochiral dichroism in chiral mixed (phthalocyaninato)(porphyrinato) rare earth triple-decker SMMs. Inorg. Chem. Front. 2014, 1, 167–171. [Google Scholar] [CrossRef]
  38. Atzori, M.; Dhbaibi, K.; Douib, H.; Grasser, M.; Dorcet, V.; Breslavetz, I.; Paillot, K.; Cador, O.; Rikken, G.L.J.A.; Le Guennic, B.; et al. Helicene-Based Ligands Enable Strong Magneto-Chiral Dichroism in a Chiral Ytterbium Complex. J. Am. Chem. Soc. 2021, 143, 2671–2675. [Google Scholar] [CrossRef]
  39. Zhang, P.; Perfetti, M.; Kern, M.; Hallmen, P.P.; Ungur, L.; Lenz, S.; Ringenberg, M.R.; Frey, W.; Stoll, H.; Rauhut, G.; et al. Exchange coupling and single molecule magnetism in redox-active tetraoxolene-bridged dilanthanide complexes. Chem. Sci. 2018, 9, 1221–1230. [Google Scholar] [CrossRef] [Green Version]
  40. Dolinar, B.S.; Gomez-Coca, S.; Alexandropoulos, D.I.; Dunbar, K.R. An air stable radical-bridged dysprosium single molecule magnet and its neutral counterpart: Redox switching of magnetic relaxation dynamics. Chem. Commun. 2017, 53, 2283–2286. [Google Scholar] [CrossRef]
  41. Ivanov, A.V.; Zhukov, P.A.; Tomilova, L.G.; Zefirov, N.S. New diphthalocyanine complexes of rare-earth metals based on 4,5-isopropylidenedioxyphthalonitrile. Russ. Chem. Bull. 2006, 55, 281–286. [Google Scholar] [CrossRef]
  42. Takamatsu, S.; Isikawa, T.; Koshihara, S.-Y.; Ishikawa, N. Significant increase of the barrier energy for magnetization reversal of a single-4f-ionic single-molecule magnet by a longitudinal contraction of the coordination space. Inorg. Chem. 2007, 46, 7250–7252. [Google Scholar] [CrossRef] [PubMed]
  43. Cador, O.; Le Guennic, B.; Pointillart, F. Electro-activity and magnetic switching in lanthanide-based single-molecule magnets. Inorg. Chem. Front. 2019, 6, 3398–3417. [Google Scholar] [CrossRef] [Green Version]
  44. Lefeuvre, B.; Flores Gonzalez, J.; Gendron, F.; Dorcet, V.; Riobé, F.; Cherkasov, V.; Maury, O.; Le Guennic, B.; Cador, O.; Kuropatov, V.; et al. Redox-Modulations of Photophysical and Single-Molecule Magnet Properties in Ytterbium Complexes Involving Extended-TTF Triads. Molecules 2020, 25, 492. [Google Scholar] [CrossRef] [PubMed] [Green Version]
  45. Pointillart, F.; Flores Gonzalez, J.; Montigaud, V.; Tesi, L.; Cherkasov, V.; Le Guennic, B.; Cador, O.; Ouahab, L.; Sessoli, R.; Kuropatov, V. Redox- and solvato-magnetic switching in a tetrathiafulvalene-based triad single-molecule magnet. Inorg. Chem. Front. 2020, 7, 2322–2334. [Google Scholar] [CrossRef]
  46. Tiaouinine, S.; Flores Gonzalez, J.; Montigaud, V.; Mattei, C.A.; Dorcet, V.; Kaboub, L.; Cherkasov, V.; Cador, O.; Le Guennic, B.; Ouahab, L.; et al. Redox Modulation of Field-Induced Tetrathiafulvalene-Based Single-Molecule Magnets of Dysprosium. Magnetochemistry 2020, 6, 34. [Google Scholar] [CrossRef]
  47. Lorcy, D.; Bellec, N.; Fourmigué, M.; Avarvari, N. tetrathiafulvalene-based group XV ligands: Synthesis, coordination chemistry and radical cation salts. Coord. Chem. Rev. 2009, 253, 1398–1438. [Google Scholar] [CrossRef]
  48. Pointillart, F.; Golhen, S.; Cador, O.; Ouahab, L. 3d and 4d coordination complexes and coordination polymers involving electroactive tetrathiafulvalene containing ligands. C. R. Chimie 2013, 16, 679–687. [Google Scholar] [CrossRef] [Green Version]
  49. Pointillart, F.; Golhen, S.; Cador, O.; Ouahab, L. Paramagnetic 3d coordination complexes involving redox-active tetrathiafulvalene derivatives: An efficient approach to elaborate multi-properties materials. Dalton Trans. 2013, 42, 1949–1960. [Google Scholar] [CrossRef]
  50. Kuropatov, V.; Klementieva, S.; Fukin, G.; Mitin, A.; Ketkov, S.; Budnikova, Y.; Cherkasov, V.; Abakumov, G. Novel method for the synthesis of functionalized tetrathiafulvalenes, an acceptor–donor–acceptor molecule comprising of two o-quinone moieties linked by a TTF bridge. Tetrahedron 2010, 66, 7605–7611. [Google Scholar] [CrossRef]
  51. Pointillart, F.; Klementieva, S.; Kuropatov, V.; Le Gal, Y.; Golhen, S.; Cador, O.; Cherkasov, V.; Ouahab, L. A single molecule magnet behaviour in a D3h symmetry Dy(III) complex involving a quinone–tetrathiafulvalene–quinone bridge. Chem. Commun. 2012, 48, 714–716. [Google Scholar] [CrossRef]
  52. Jia, C.; Liu, S.X.; Tanner, C.; Leiggener, C.; Neels, A.; Sanguinet, L.; Levillain, E.; Leutwyler, S.; Hauser, A.; Decurtins, S. An experimental and computational study on intramolecular charge transfer: A tetrathiafulvalene-fused dipyridophenazine molecule. Chem. Eur. J. 2007, 13, 3804–3812. [Google Scholar] [CrossRef] [PubMed] [Green Version]
  53. Keniley, L., Jr.; Ray, L.; Kovnir, K.A.; Shatruk, M. TTF-annulated phenanthroline and unexpected oxidation cleavage of the C=C bond in its ruthenium(II) complex. Inorg. Chem. 2010, 49, 1307–1309. [Google Scholar] [CrossRef] [PubMed]
  54. Keniley, L., Jr.; Dupont, N.; Ray, L.; Ding, J.; Kovnir, K.; Hoyt, M.J.; Hauser, A.; Shatruk, M. Complexes with redox-active ligands: Synthesis, structure, and electrochemical and photophysical behavior of the Ru(II) complex with TTF-annulated phenanthroline. Inorg. Chem. 2013, 52, 8040–8052. [Google Scholar] [CrossRef]
  55. Qin, J.; Hu, L.; Li, G.N.; Wang, X.S.; Xu, Y.; Zuo, J.-L.; You, X.-Z. Synthesis, characterization, and properties of rhenium(I). tricarbonyl complexes with tetrathiafulvalene-fused phenanthroline ligands. Organometallics 2011, 30, 2173–2179. [Google Scholar] [CrossRef]
  56. Jia, H.; Ding, J.; Hauser, A.; Decurtins, S.; Liu, S.-X. Large p-conjugated chromophores derived from tetrathiafulvalene. Asian J. Org. Chem. 2014, 3, 198–202. [Google Scholar] [CrossRef]
  57. Chen, B.; Lv, Z.-P.; Hua, C.F.; Leong, C.; Tuna, F.M.; D’Alessandro, D.; Collison, D.; Zuo, J.-L. Dinuclear ruthenium complex based on a p-extended bridging ligand with redox-active tetrathiafulvalene and 1,10-phenanthroline units. Inorg. Chem. 2016, 55, 4606–4615. [Google Scholar] [CrossRef]
  58. Lefeuvre, B.; Mattei, C.A.; Flores Gonzalez, J.; Gendron, F.; Dorcet, V.; Riobé, F.; Lalli, C.; Le Guennic, B.; Cador, O.; Maury, O.; et al. Solid-State Near-Infrared Circularly Polarized Luminescence from Chiral YbIII-Single-Molecule Magnet. Chem. Eur. J. 2021, 27, 7362–7366. [Google Scholar] [CrossRef]
  59. Lefeuvre, B.; Galangau, O.; Flores Gonzalez, J.; Montigaud, V.; Dorcet, V.; Ouahab, L.; Le Guennic, B.; Cador, O.; Pointillart, F. Field-Induced Dysprosium Single-Molecule Magnet Based on a Redox-Active Fused 1,10-Phenantroline-Tetrathiafulavlene-1,10-Phannatroline Bridging Triad. Front. Chem. 2018, 6, 552–561. [Google Scholar] [CrossRef] [Green Version]
  60. Llunell, M.; Casanova, D.; Cirera, J.; Alemany, P.; Alvarez, S. SHAPE Program for the Stereochemical Analysis of Molecular Fragments by Means of Continuous Shape Measures and Associated Tools; Departament de Quimica Fisica, Departament de Quimica Inorganica, and Institut de Quimica Teorica i Computacional—Universitat dè Barcelona: Barcelona, Spain, 2013. [Google Scholar]
  61. Jones, A.E.; Christensen, C.A.; Perepichka, D.F.; Batsanov, A.S.; Beeby, A.; Low, P.J.; Bryce, M.R.; Parker, A.W. Photochemistry of the pi-extended 9,10-bis (1,3-dithiol-2-ylidene)-9,10-dihydroanthracene system: Generation and characterization of the radical cation, dication, and derived products. Chem. Eur. J. 2001, 7, 973–978. [Google Scholar] [CrossRef]
  62. Ellern, A.; Bernstein, J.; Becker, J.Y.; Zamir, S.; Shahal, L.; Cohen, S. A New Polymorphic Modification of Tetrathiafulvalene. Crystal Structure, Lattice Energy and Intermolecular Interactions. Chem. Mater. 1994, 6, 1378–1385. [Google Scholar] [CrossRef]
  63. Bünzli, J.C.G. Benefiting from the Unique properties of Lanthanide Ions. Acc. Chem. Res. 2006, 39, 53–61. [Google Scholar] [CrossRef] [PubMed]
  64. Rinehart, J.D.; Long, J.R. Exploiting single-ion anisotropy in the design of f-element single-molecule magnets. Chem. Sci. 2011, 2, 2078–2085. [Google Scholar] [CrossRef]
  65. Goldner, P.; Pellé, F.; Meichenin, D.; Auzel, F. Cooperative luminescence in ytterbium-doped CsCdBr3. J. Lumin. 1997, 71, 137–150. [Google Scholar] [CrossRef]
  66. Yi, X.; Bernot, K.; Le Corre, V.; Calvez, G.; Pointillart, F.; Cador, O.; Le Guennic, B.; Jung, J.; Maury, O.; Placide, V.; et al. Unraveling the Crystal Structure of Lanthanide-Murexide Complexes: Use of an Ancient Complexometry Indicator as a Near-Infrared-Emitting Single-Ion Magnet. Chem. Eur. J. 2014, 20, 1569–1576. [Google Scholar] [CrossRef]
  67. Shavaleev, N.M.; Scopelliti, R.; Gumy, F.; Bünzli, J.-C.G. Surprisingly Bright Near-Infrared Luminescence and Short Radiative Lifetimes of Ytterbium in Hetero-Binuclear Yb-Na Chelates. Inorg. Chem. 2009, 48, 7937–7946. [Google Scholar] [CrossRef]
  68. Pedersen, K.S.; Dreiser, J.; Weihe, H.; Sibille, R.; Johannesen, H.V.; Sorensen, M.A.; Nielsen, B.E.; Sigrist, M.; Mutka, H.; Rols, S.; et al. Design of Single-Molecule Magnets: Insufficiency of the Anisotropy Barrier as the Sole Criterion. Inorg. Chem. 2015, 54, 7600–7606. [Google Scholar] [CrossRef]
  69. Guégan, F.; Jung, J.; Le Guennic, B.; Riobé, F.; Maury, O.; Gillon, B.; Jasquot, Y.; Guyot, Y.; Morell, C.; Luneau, D. Evidencing under-barrier phenomena in a Yb(III) SMM: A joint luminescence/neutron diffraction/SQUID study. Inorg. Chem. Front. 2019, 6, 3152–3157. [Google Scholar] [CrossRef]
  70. Marbey, J.; Kragskow, J.G.; Buch, C.D.; Nehrkorn, J.; Ozerov, M.; Piligkos, S.; Hill, S.; Chilton, N. Vibronic Coupling in a Molecular 4f Qubit. ChemRxiv Prepr. 2021. [Google Scholar] [CrossRef]
  71. Kahn, O. Molecular Magnetism; VCH: Weinhem, Germany, 1993. [Google Scholar]
  72. Car, P.-E.; Perfetti, M.; Mannini, M.; Favre, A.; Caneschi, A.; Sessoli, R. Giant field dependence of the low temperature relaxation of the magnetization in a dysprosium(iii)–DOTA complex. Chem. Commun. 2011, 47, 3751–3753. [Google Scholar] [CrossRef]
  73. Reta, D.; Chilton, N.F. Uncertainty estimates for magnetic relaxation times and magnetic relaxation parameters. Phys. Chem. Chem. Phys. 2019, 21, 23567–23575. [Google Scholar] [CrossRef]
  74. Abragam, A.; Bleaney, B. Electron Paramagnetic Resonance of Transition Ions; Clarendon Press: Oxford, UK, 1970. [Google Scholar]
  75. Singh, A.; Shrivastava, K.N. Optical-acoustic two-phonon relaxation in spin systems. Phys. Status Solidi B 1979, 95, 273. [Google Scholar] [CrossRef]
  76. Shirivastava, K.N. Theory of Spin-Lattice Relaxation. Phys. Status Solidi B 1983, 177, 437. [Google Scholar] [CrossRef]
  77. Evans, P.; Reta, D.; Whitehead, G.F.S.; Chilton, N.F.; Mills, D.P. Bis-Monophospholyl Dysprosium Cation Showing Magnetic Hysteresis at 48 K. J. Am. Chem. Soc. 2019, 141, 19935–19940. [Google Scholar] [CrossRef] [PubMed] [Green Version]
  78. Diaz-Ortega, I.F.; Herrera, J.M.; Carmona, A.R.; Galan-Mascaros, J.R.; Dey, S.; Nojiri, H.; Rajaraman, G.; Colacio, E. A Chiral Bipyrimidine-Bridged Dy2 SMM: A Comparative Experimental and Theoretical Study of the Correlation Between the Distortion of the DyO6N2 Coordination Sphere and the Anisotropy Barrier. Front. Chem. 2018, 6, 537–554. [Google Scholar] [CrossRef]
  79. Richardson, M.F.; Wagner, W.F.; Sands, D.E. Rare-earth trishexafluoroacetylacetonates and related compounds. J. Inorg. Nucl. Chem. 1968, 30, 1275–1289. [Google Scholar] [CrossRef]
  80. Sheldrick, G.M. SHELXT—Integrated space-group and crystal-structure determination. Acta Crystallogr. Sect. A Found. Adv. 2015, 71, 3–8. [Google Scholar] [CrossRef] [Green Version]
  81. Sheldrick, G.M. Crystal structure refinement with SHELXL. Acta Crystallogr. Sect. C Struct. Chem. 2015, 71, 3–8. [Google Scholar] [CrossRef]
  82. Spek, A.L. Single-crystal structure validation with the program PLATON. J. Appl. Crystallogr. 2003, 36, 7–13. [Google Scholar] [CrossRef] [Green Version]
Figure 1. Coordination reactions between L and Yb(hfac)3(H2O)2 and Dy(facam)3 as well as molecular structures of [Yb2(hfac)6(L)]·2(C7H16) ((1)·2(C7H16)) and [Dy2((+)facam)6(L)]·2(C6H14) ((2)·2(C6H14)).
Inorganics 09 00050 g001
Figure 2. Crystal packing of (1)·2(C7H16) highlighting the 1D stacking of L (spacefill representation). The Yb(hfac)3 units are represented by balls and sticks.
Inorganics 09 00050 g002
Figure 3. Crystal packing of (2)·2(C6H14) with the triads L and Dy(facam)3 units drawn respectively in spacefill and ball and sticks representation.
Inorganics 09 00050 g003
Figure 4. (Left) Solid-state emission spectrum of 1 recorded at 10 K under excitation of 22,220 cm−1 (450 nm) with the proposed transitions between the crystal field sublevels of the 2F5/22F7/2 emission band. (Right) Energy diagram of the 2F5/2 excited state and 2F7/2 ground state obtained from the solid-state emission spectrum measured at 10 K.
Inorganics 09 00050 g004
Figure 5. (a) Field dependence of the relaxation time at 2 K in the field range of 0–3000 Oe for 1 (size of the black dot is proportional to the slow relaxing fraction) with the best-fitted curve (full black line) with the combination Orbach + Raman (dashed brown line), QTM (dashed orange line) and direct (dashed blue line) processes. (b) frequency dependence of χM” for 1 at 1000 Oe in the temperature range 2–10 K; (c) temperature dependence of the relaxation time for 1 at 1000 Oe in the temperature range 2–4.25 K with the best-fitted curve (full black line) with Raman process only. Error lines are calculated using the log-normal distribution model at the 1σ level [73].
Inorganics 09 00050 g005
Figure 6. (a) Frequency dependence of χM” for 2 at 0 Oe in the temperature range 2–15 K (b) Field dependence of the relaxation time at 2 K in the field range of 0–3000 Oe for 2 with the best-fitted curve (full black line) with the combination Orbach + Raman (dashed brown line), QTM (dashed orange line) and Direct (dashed blue line) processes; (c) frequency dependence of χM” for 1 at 1200 Oe in the temperature range 2–13 K; (d) temperature dependence of the relaxation time for 2 at 0 Oe (open grey circles) and 1000 Oe (full grey circles) in the temperature range 2–14 K with the best-fitted curve (full black lines) with Raman process only at 1200 Oe and a combination of Raman and QTM processes at 0 Oe. Error lines are calculated using the log-normal distribution model at the 1σ level [73].
Inorganics 09 00050 g006
Publisher’s Note: MDPI stays neutral with regard to jurisdictional claims in published maps and institutional affiliations.

