Article

Testing the Efficacy of the Synthesis of Iron Antimony Sulfide Powders from Single Source Precursors

1
Department of Materials, The University of Manchester, Oxford Road, Manchester M13 9PL, UK
2
Photon Science Institute, The University of Manchester, Oxford Road, Manchester M13 9PL, UK
3
Department of Chemistry, The University of Manchester, Oxford Road, Manchester M13 9PL, UK
*
Author to whom correspondence should be addressed.
Submission received: 5 July 2021 / Revised: 20 July 2021 / Accepted: 21 July 2021 / Published: 2 August 2021

Abstract

:

Simple Summary

The phase diagram of the Fe-Sb-S system predicts that phase separation should occur at synthesis temperatures below 540 °C. In this paper we test the efficacy of alloying Fe into Sb2S3 using a molecular precursor approach which may be able to produce Fe-Sb-S alloys with a single pure phase. We find that whilst we do see a large degree of phase separation as predicted, we also find that there is some evidence that incorporation of Fe into the Sb2S3 host lattice occurs from this approach which could be a way to produce new magnetic materials.

Abstract

The antimony-iron sulfide system in general does not produce alloys below 540 °C from traditional solid-state methods. However, single source precursors have been known to produce unexpected products that arise from kinetically trapped polymorphs. In this paper, we test the efficacy of this approach toward the Fe-Sb-S system. Antimony and iron diethyldithiocarbamate complexes of the form Sb[S2CN(Et2)]3 (1) and Fe[S2CN(Et2)]3 (2) were synthesised, characterised, and used as single-source precursors for the preparation of Sb2S3, FexSy, and mixed iron antimony sulfide Sb2(1−x)Fe2xS3 (0 ≥ x ≥ 1) powders using the solvent-less thermolysis method at different temperatures ranging from 300 to 475 °C. The effect of different mole fractions of the iron precursor was evaluated on morphology, shape, and optical and magnetic properties of Sb2(1−x)Fe2xS3 (0 ≥ x ≥ 1). The obtained powders were characterized by X-ray diffraction (XRD), Raman spectroscopy scanning electron microscopy (SEM), energy dispersive X-ray (EDX) spectroscopy, magnetometer measurement, and UV/vis/NIR spectroscopy. The results demonstrated that the crystalline structure, morphology, and elemental composition of the samples changed with the mole fraction of the precursor. There was significant phase separation between Sb and Fe sulfides noted from EDX spectroscopic mapping, yet an optoelectronic study monitoring the direct band gap energy of antimony sulfide shows that the band gap energy increases as a function of Fe content, which suggests limited alloying is possible from the single source route.

1. Introduction

In the past few decades, semiconductor nanocrystals have gained considerable interest in electronics, energy, and catalysis owing to their non-linear optical, magnetic, thermoelectric, and ferroelectric properties [1,2,3]. The advantages of semiconducting nanostructures include a large absorption coefficient, a tunable energy band gap (Eg) due to the quantum size effect, and multiple exciton generation (MEG) by a single high energy photon (hv > 2 Eg) [4,5]. Most of the established single junction photovoltaic technologies face numerous challenges, for example, use of toxic elements, long-term stability, cost of raw materials, and power conversion efficiency limitations. These all are the most relevant considerations that must be taken into account in order to look towards an era of terawatt solar photovoltaic power generation. Keeping the limitations of these mature technologies in mind, there is an urgent need to look for emerging photovoltaic solar cell absorbers including chalcogenides (sulphides, selenides, and tellurides) [6]. Binary chalcogenide semiconductors including antimony and iron chalcogenides have attracted much attention thanks to their potential photovoltaic applications [7,8,9]. Stibnite (Sb2S3) crystallizes in the orthorhombic system and has a direct bandgap of 1.5–2.5 eV that covers the visible and near-infrared region of the electromagnetic spectrum [10,11]. Some recent applications of Sb2S3 are in solar energy conversion, [12] television cameras, [13] microwave devices [14], and switching devices [15]. Recently, low dimensional absorber systems have attracted great attention because of their simple and earth abundant composition and improved performance; for example, quasi-1D antimony-based chalcogenide solar cells are nontoxic, stable, and have achieved respectable power-conversion efficiencies (PCEs) of 7–10% [16]. In photovoltaic devices, stibnite Sb2S3 is a promising candidate thanks to its respectable power-conversion efficiencies (PCEs), which are a result of its bandgap commensurate in energy with solar flux and large absorption coefficients, as well as having beneficial features such as the earth abundance of its constituent elements and stability with low toxicity [17,18,19,20].
Sb2S3 thin films are employed as absorbing materials and semiconductors with a smaller bandgap in CdS/Sb2S3 heterojunctions [21]. They are also used in Grätzel solar cells as a light sensitizer [22]. Magnetic iron chalcogenides nanocrystals are important because of their use in magnetic data storage devices and as magnetic resonance imaging (MRI) contrast agents [23,24,25]. Berthierite (FeSb2S4) is an iron antimony sulfide mineral with interesting magnetic properties [26].
A large number of methods are reported for the preparation of metal chalcogenides such as wet-chemical synthesis (hydrothermal, ion-exchange, hot injection, and self-assembly), chemical vapour deposition (CVD)-based epitaxial growth, thermolysis, and solid-phase chemical synthesis [27]. Multi-component methods have some inherent disadvantages of changing composition, which varies from batch to batch, leading to poor reproducibility. Besides, multi-component precursor synthesis methods require a longer time, higher temperature, and high cost. Single source precursors (SSPs) offer specific benefits of stability, volatility, precise composition with fewer defects, and stoichiometry [28,29]. SSP-based synthesis methods are the preferred choice over multi-component source methods for the preparation of binary, ternary, and quaternary metal chalcogenide and thin films [30]. This method is potentially beneficial over others because of its simplicity, high purity, and ability to yield high-quality materials with better control over composition [31,32]. Recently, the use of metal dithiocarbamates for the synthesis of metal sulfides is being investigated thanks to their low decomposition temperature, clean decomposition, ease of synthesis, and solubility in many organic solvents [33].
Iron and antimony dithiocarbamates single-source precursors have previously been used for the preparation of pure binary sulfides [34,35]. Moreover, ternary and quaternary sulfides are also synthesized using metal dithiocarbamates complexes [36]. For example, flower-like Sb2−xBixS3 (x = 0.4, 1.0) nanostructures have been synthesized using both antimony diethyldithiocarbamate (Sb(DDTC)3) and bismuth diethyldithiocarbamate (Bi(DDTC)3) by a solvothermal method [36]. Similarly, ternary copper-antimony sulfide nanocrystals are prepared using copper diethyldithiocarbamate trihydrate (Cu(DDTC)2) and antimony diethyldithiocarbamate trihydrate (Sb(DDTC)3) using a facile one-pot thermo-decomposition dual-precursor strategy [37].
Solvent-less thermolysis is a low-cost and simple solid-state method that involves the decomposition of precursors under thermal stress. Metal chalcogenides with different morphologies such as cubic nanoparticles, [38] nano disks [39], and nanorods are prepared using the pyrolysis method [40]. Compared with other methods, the solvent-less method has several advantages such as being solvent-free, cost-effective, environment-friendly, high yield, and easy control of reaction parameters [41]. It has also been shown that, by this type of route, unexpected products can be isolated; for example, the production of various polymorphs of the W-Mo-S system [42] that are kinetically locked in because the decomposition of precursors is rapid compared with the timescales required for ions to move through the lattice at low temperatures. The antimony-iron sulfide system is interesting in this respect as, below ca. 540 °C, the phases are separate [43]. However, if the use of precursors could circumvent phase separation, then we may be able to unlock new antimony sulfides with bespoke properties; e.g., iron-doping for magnetic materials. This work presents the attempted synthesis of Sb-Fe-S systems using different precursor stoichiometries using a mixture of metal dithiocarbamates (Sb[S2CNEt2]3 and Fe[S2CNEt2]3) by the solvent-less thermolysis method at 450 °C. Sb2(1−x)Fe2xS3 (x = 0, 0.2, 0.4, 0.6, 0.8, and 1) samples prepared are characterized by powder X-ray diffraction (p-XRD), scanning electron microscopy (SEM), energy-dispersive X-ray spectroscopy (EDX) technique, Raman spectroscopy, and UV/vis/NIR spectroscopy and SQUID magentometry.

2. Experimental

2.1. Chemicals

Sodium diethyldithiocarbamate trihydrate ((C2H5)2NCS2Na·3H2O, ≥99.0%), antimony trichloride (SbCl3, ≥99.5%), iron(III) chloride anhydrous (FeCl3, ≥99.99%), methanol (CH3OH, ≥99.8%), absolute ethanol (CH3CH2OH, ≥99.5%), chloroform (CHCl3, ≥99%), and isopropyl alcohol ((CH3)2CHOH, ≥99.7%) were purchased from Sigma-Aldrich and used without further purification. The synthesis of all precursors was carried out in the air and no special handling was required.

2.2. Instrumentation

Elemental analysis (EA) was carried out in the micro-analytical laboratory at the Department of Chemistry, University of Manchester. TGA data were obtained using Perkin Elmer TGA 4000 in the temperature range of 30 to 800 °C with a heating rate of 10 °C min−1 under N2. The XRD patterns were recorded using PANalytical X’Pert Pro theta-theta diffractometer (435 mm diameter, Malvern, UK). The data were collected using detector scans at a grazing incidence angle of 3°, and were undertaken with a scan range from 5° to 85° with 0.03° step and 8 s/step. SEM imaging was performed using FEI 200 Quanta 3D SEM for imaging and EDX analysis using an accelerating voltage of 20 kV. Magnetic data were measured using a MPMS XL SQUID magnetometer prepared with a 7 T magnet.

2.3. Synthesis of Antimony(III) Diethyldithiocarbamate, [Sb(S2CN(Et)2)3] (1)

The synthesis of precursor (1) was adapted from the method reported in the literature [37,44,45]. Briefly, sodium diethyldithiocarbamate trihydrate (6.76 g, 30 mmol) was dissolved in 100 mL of methanol and stirred. A solution of antimony (III) chloride (2.26 g, 10 mmol) was prepared in 25 mL of methanol and added dropwise to the sodium salt solution with constant stirring. The reaction mixture was further stirred for 30 min at room temperature. A yellow precipitate was obtained, which was filtered and washed several times using deionized water and finally with methanol. The product was dried overnight at room temperature in the open air, resulting in a clear yellow solid. Yield: 4.3 g (86%); elemental analysis found: C, 31.35%; H, 5.19%; N, 7.25%; S, 33.22%; Calc. C, 31.81%; H, 5.34%; N, 7.42%; S, 33.90%. IR (solid, νmax/cm−1): 2966–2867ν(N–H); 1485 ν(C–N); 980 ν(C–S).

2.4. Synthesis of Iron(III) Diethyldithiocarbamate, [Fe(S2CN(Et)2)3] (2)

For the synthesis of precursor (2), sodium diethyldithiocarbamate trihydrate (5 g, 22.2 mmol) was dissolved in 100 mL of methanol and stirred, followed by the addition of iron (III) chloride anhydrous (1.19 g, 7.3 mmol) solution in 25 mL of methanol dropwise with constant stirring for 30 min. The resulting black precipitate was filtered and dried at room temperature. Yield: 3.4 g (92%); elemental analysis found: C, 35.61%; H, 6.01%; N, 8.25%; S, 38.34% Calc. C, 36.01%; H, 6.05%; N, 8.40; S, 38.37%. IR (solid, νmax/cm−1): 2973–2866 ν(N–H); 1490 ν(C–N); 993 ν(C–S).

2.5. Synthesis of the Sb2S3 System by Solvent-Less Thermolysis

Solvent-less thermolysis was used for the synthesis of Sb2S3 using single-source precursors (1). A measured amount (0.40 mmol) of the precursors was placed into a ceramic boat inside a tube furnace and annealed at 300 °C, 400 °C, 425 °C, 450 °C, and 475 °C, respectively, for one hour under nitrogen flow, resulting in a black coloured residue. Samples were collected after cooling to room temperature for characterization (Figure S1).

2.6. Synthesis of Fe-Sb-S System by Solvent-Less Thermolysis Method

The antimony-iron sulfide (Sb2(1−x)Fe2xS3) system was prepared by the solvent-less thermolysis method using a mixture of precursors (1) and (2) with various molar ratios, as shown in Table S1. The complexes were dissolved in 10 mL of chloroform to form a homogeneous mixture. Subsequently, the solvent was evaporated and a complex mixture was obtained. The uniform mixture was then placed into a ceramic boat for heating inside a tube furnace at 450 °C for 1 h under nitrogen. Finally, the obtained black product was cooled to room temperature and stored in a vacuum for characterization.

3. Results and Discussion

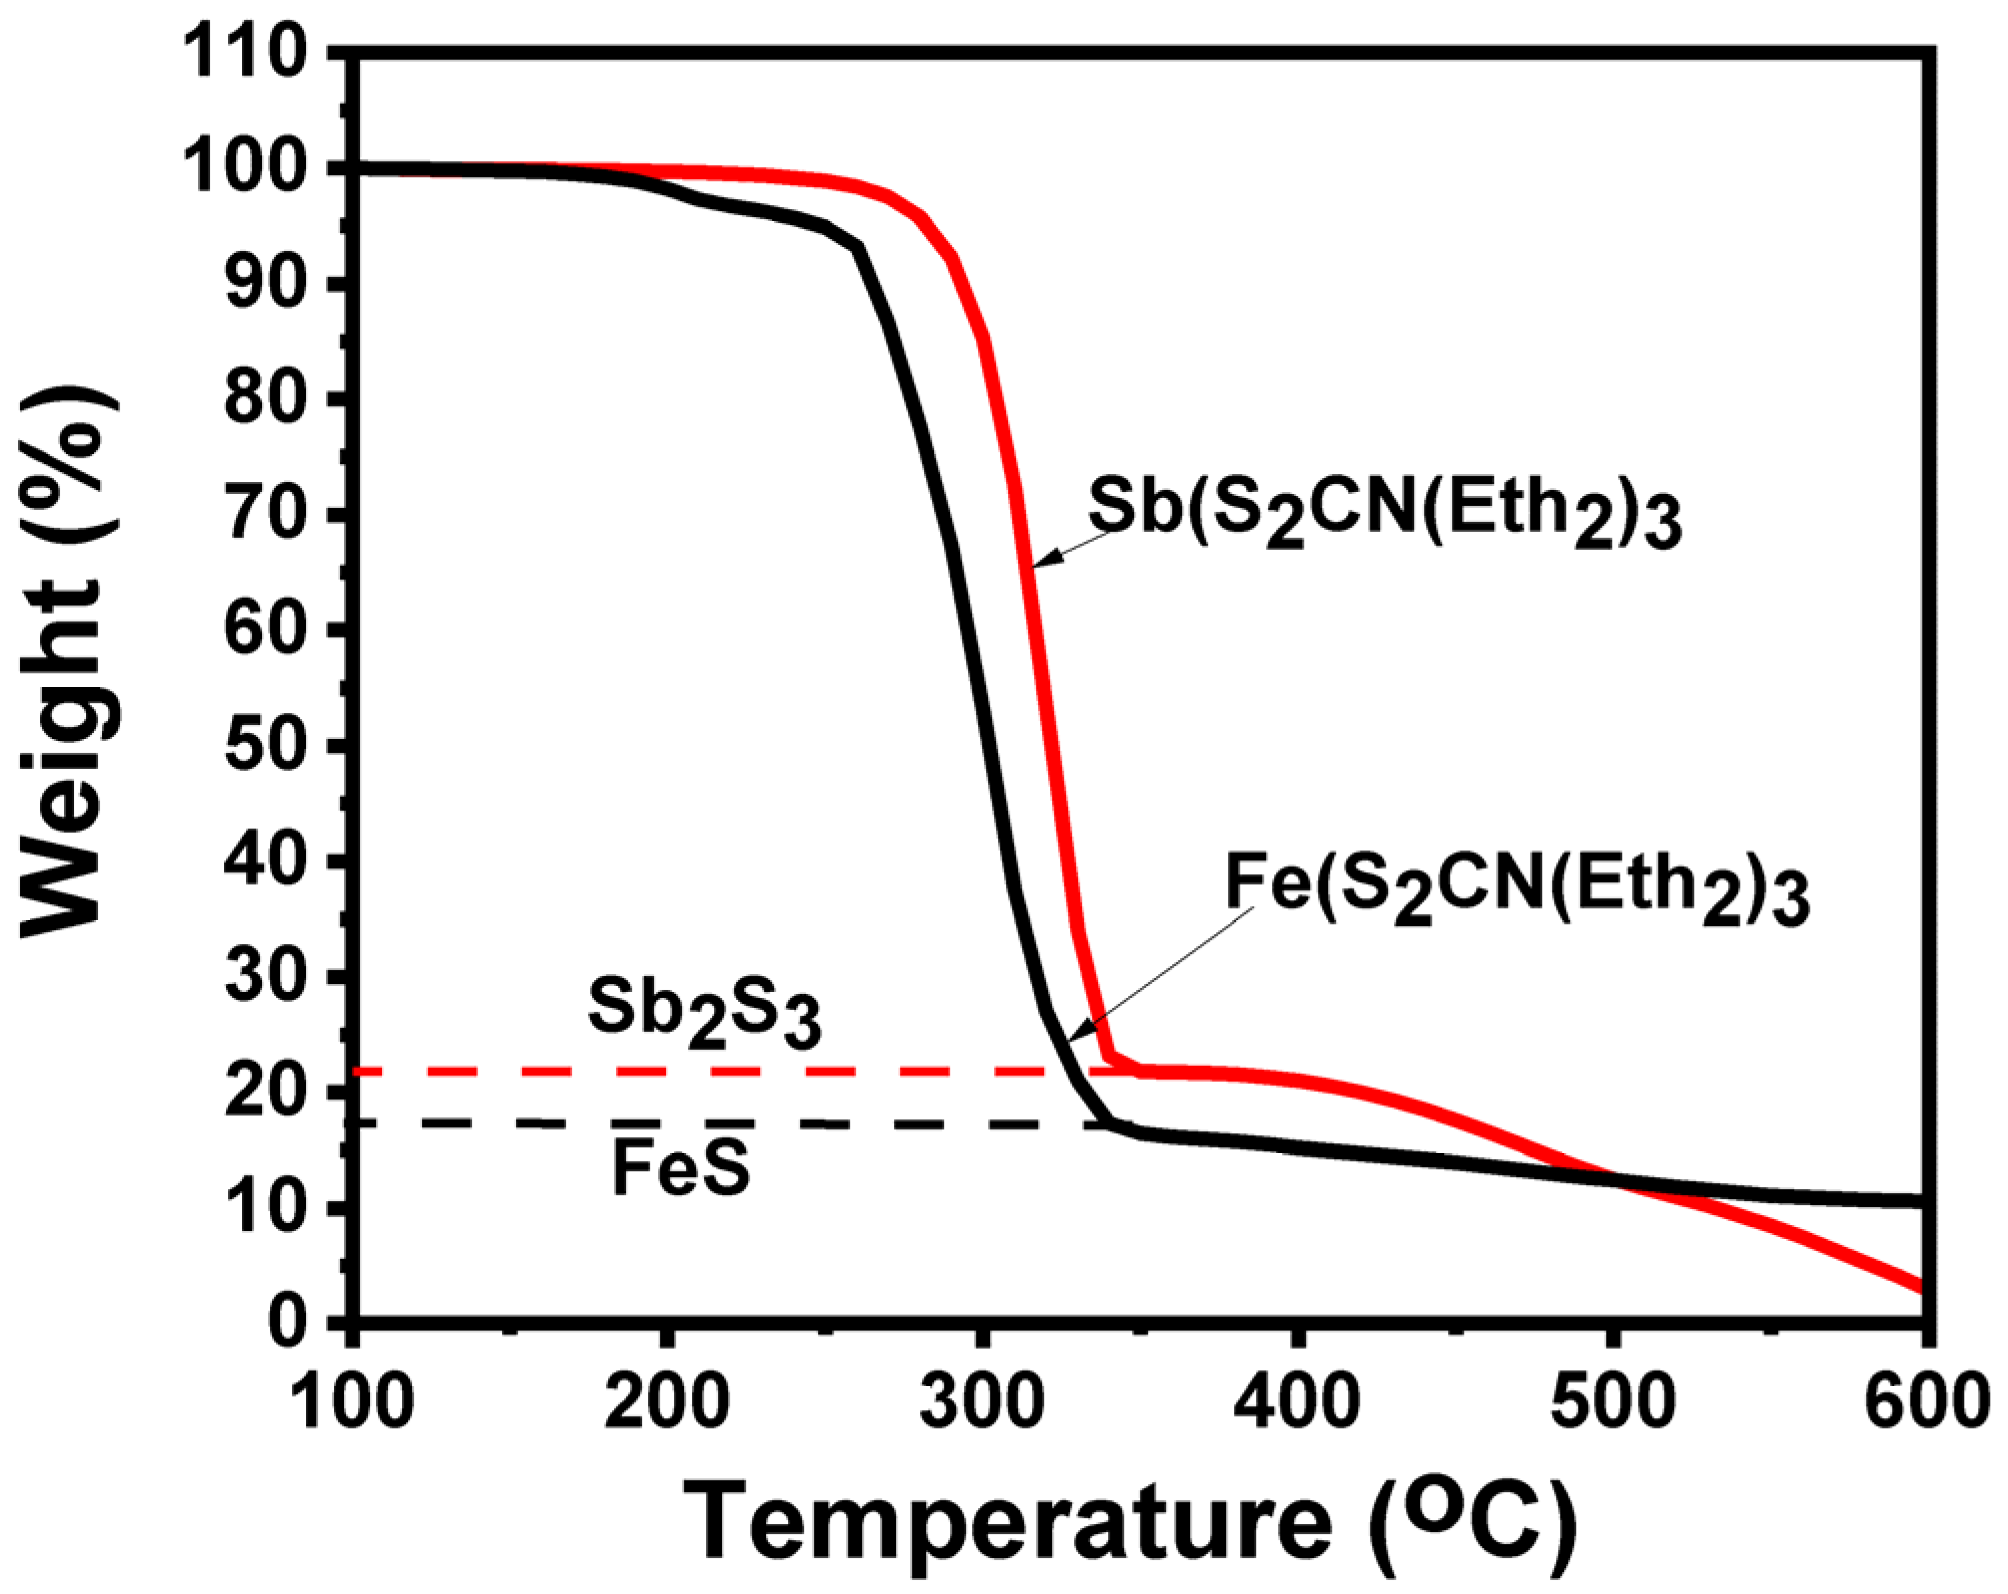
3.1. Thermogravimetric Analysis (TGA)

The thermal decomposition behaviour of the precursors was studied using TGA under nitrogen at a temperature ranging from 30 to 600 °C. TGA of the complexes Sb[S2CNEt2]3 (1) and Fe[S2CNEt2]3 (2) indicated single step decomposition with a rapid weight loss between 275 and 340 °C and 260 and 340 °C, respectively. Complex (1) showed a sharp loss (74%) in the first step followed by a gradual loss after 450 °C corresponding to the loss of further sulfur atoms. The percentage residue of complex (1) was 23%, which was close to the calculated value for Sb2S3 (29%). On the other hand, the weight loss percentage for complex (2) was 17%, which is in good agreement with the calculated value of 17.5% for FeS. Compared with complex (2), the lower percentage for precursor (1) might be due to the loss of sulfur atoms at higher temperatures [46]. The TGA results of the two complexes indicated that both precursors decompose to their metal sulfide at a similar range of temperatures. The TGA results and the theoretical value of weight loss for the residues obtained from precursors are shown in Figure 1.
Following the successful synthesis of binary antimony and iron sulfide powders from their respective metal dithiocarbamates (see Figures S1 and S2 for analysis of these by powder XRD), both precursors were then investigated for their ability to synthesize the Sb2(1−x)Fe2xS3 system. The TGA results indicated that these complexes decomposed to their corresponding metal sulfide in a similar temperature range. Furthermore, both metals (iron and antimony) carried similar charges (+3). Accordingly, a mixture of these complexes was applied for the attempted synthesis of the Sb2(1−x)Fe2xS3 systems at different molar ratios of Fe.

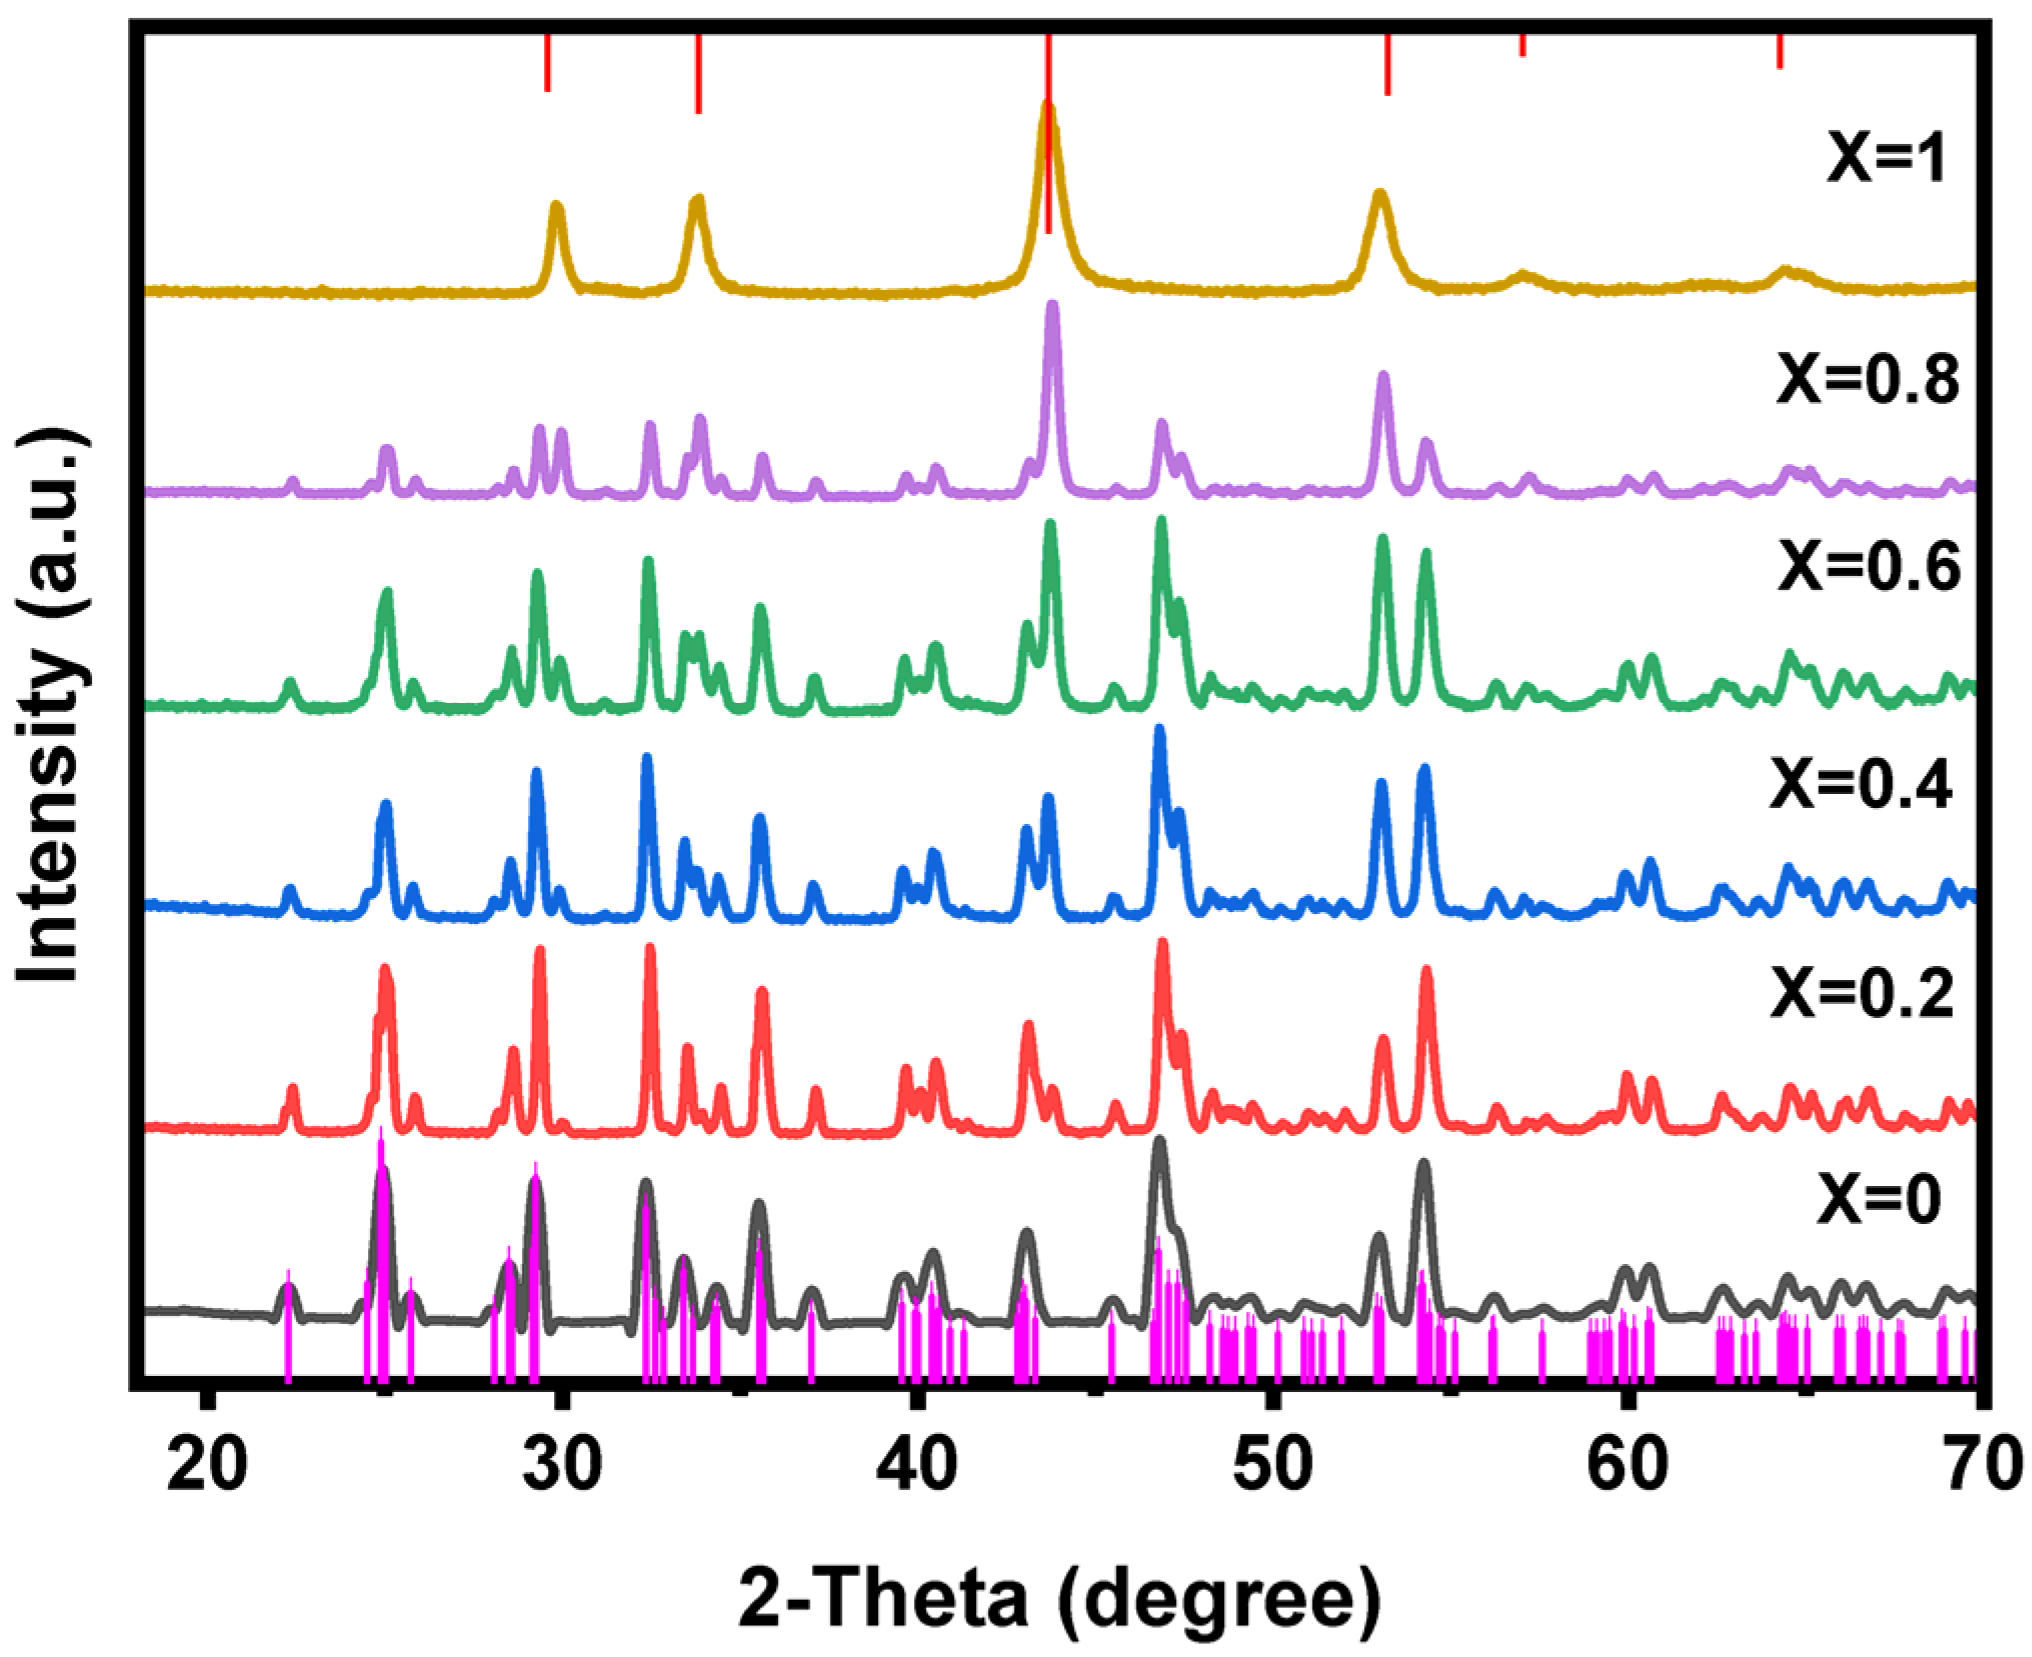
3.2. X-ray Diffraction (XRD)

Figure 2 illustrates the XRD patterns of Sb2(1−x)Fe2xS3 powder where x is the molar fraction of Fe synthesized by the solvent-less thermolysis method at 450 °C using a mixture of precursors (1) and (2). The XRD peaks for the prepared samples indicated the pure orthorhombic phase of Sb2S3 at x = 0 with lattice parameters of a = 11.313 Å, b = 3.833 Å, and c =11.225 Å, which were in agreement with the reported values in the literature (ICDD: 01-073-0393), and pure hexagonal pyrrhotite Fe1.05S0.95 at x = 1 with lattice parameters of a = 3.4303 Å, b = 3.4303 Å, and c = 5.6802 Å, which were also in agreement with the reported literature (ICDD:01-075-0600). A mole fraction of iron x = 0.2 resulted in diffraction peaks similar to Sb2S3 with some evidence of a small shift to a larger angle, implying the contraction of the lattice for the antimony peaks. Increasing the molar fraction to x = 0.4 resulted in a small reduction in the peak intensity (Figure 2). The peaks at 22°, 25°, 28°, 36°, 37°, 40°, 46°, 54°,60°, 61°, and 63° shifted to higher angles with less intensity as the x value increased to x = 0.4, 0.6, and 0.8, representing the iron addition into the Sb2S3 samples. P-XRD analysis showed concentration-dependent phase changes at different concentrations of Fe (x = 0.2, 0.4, 0.6, and 0.8) and the majority of crystalline materials matched the pattern of orthorhombic Sb2S3 with Fe1.05S0.95. This indicates, as expected, some degree of phase separation as per the phase diagram, but also some evidence that the approach is successful in doping in some iron into the antimony sulfide structure.

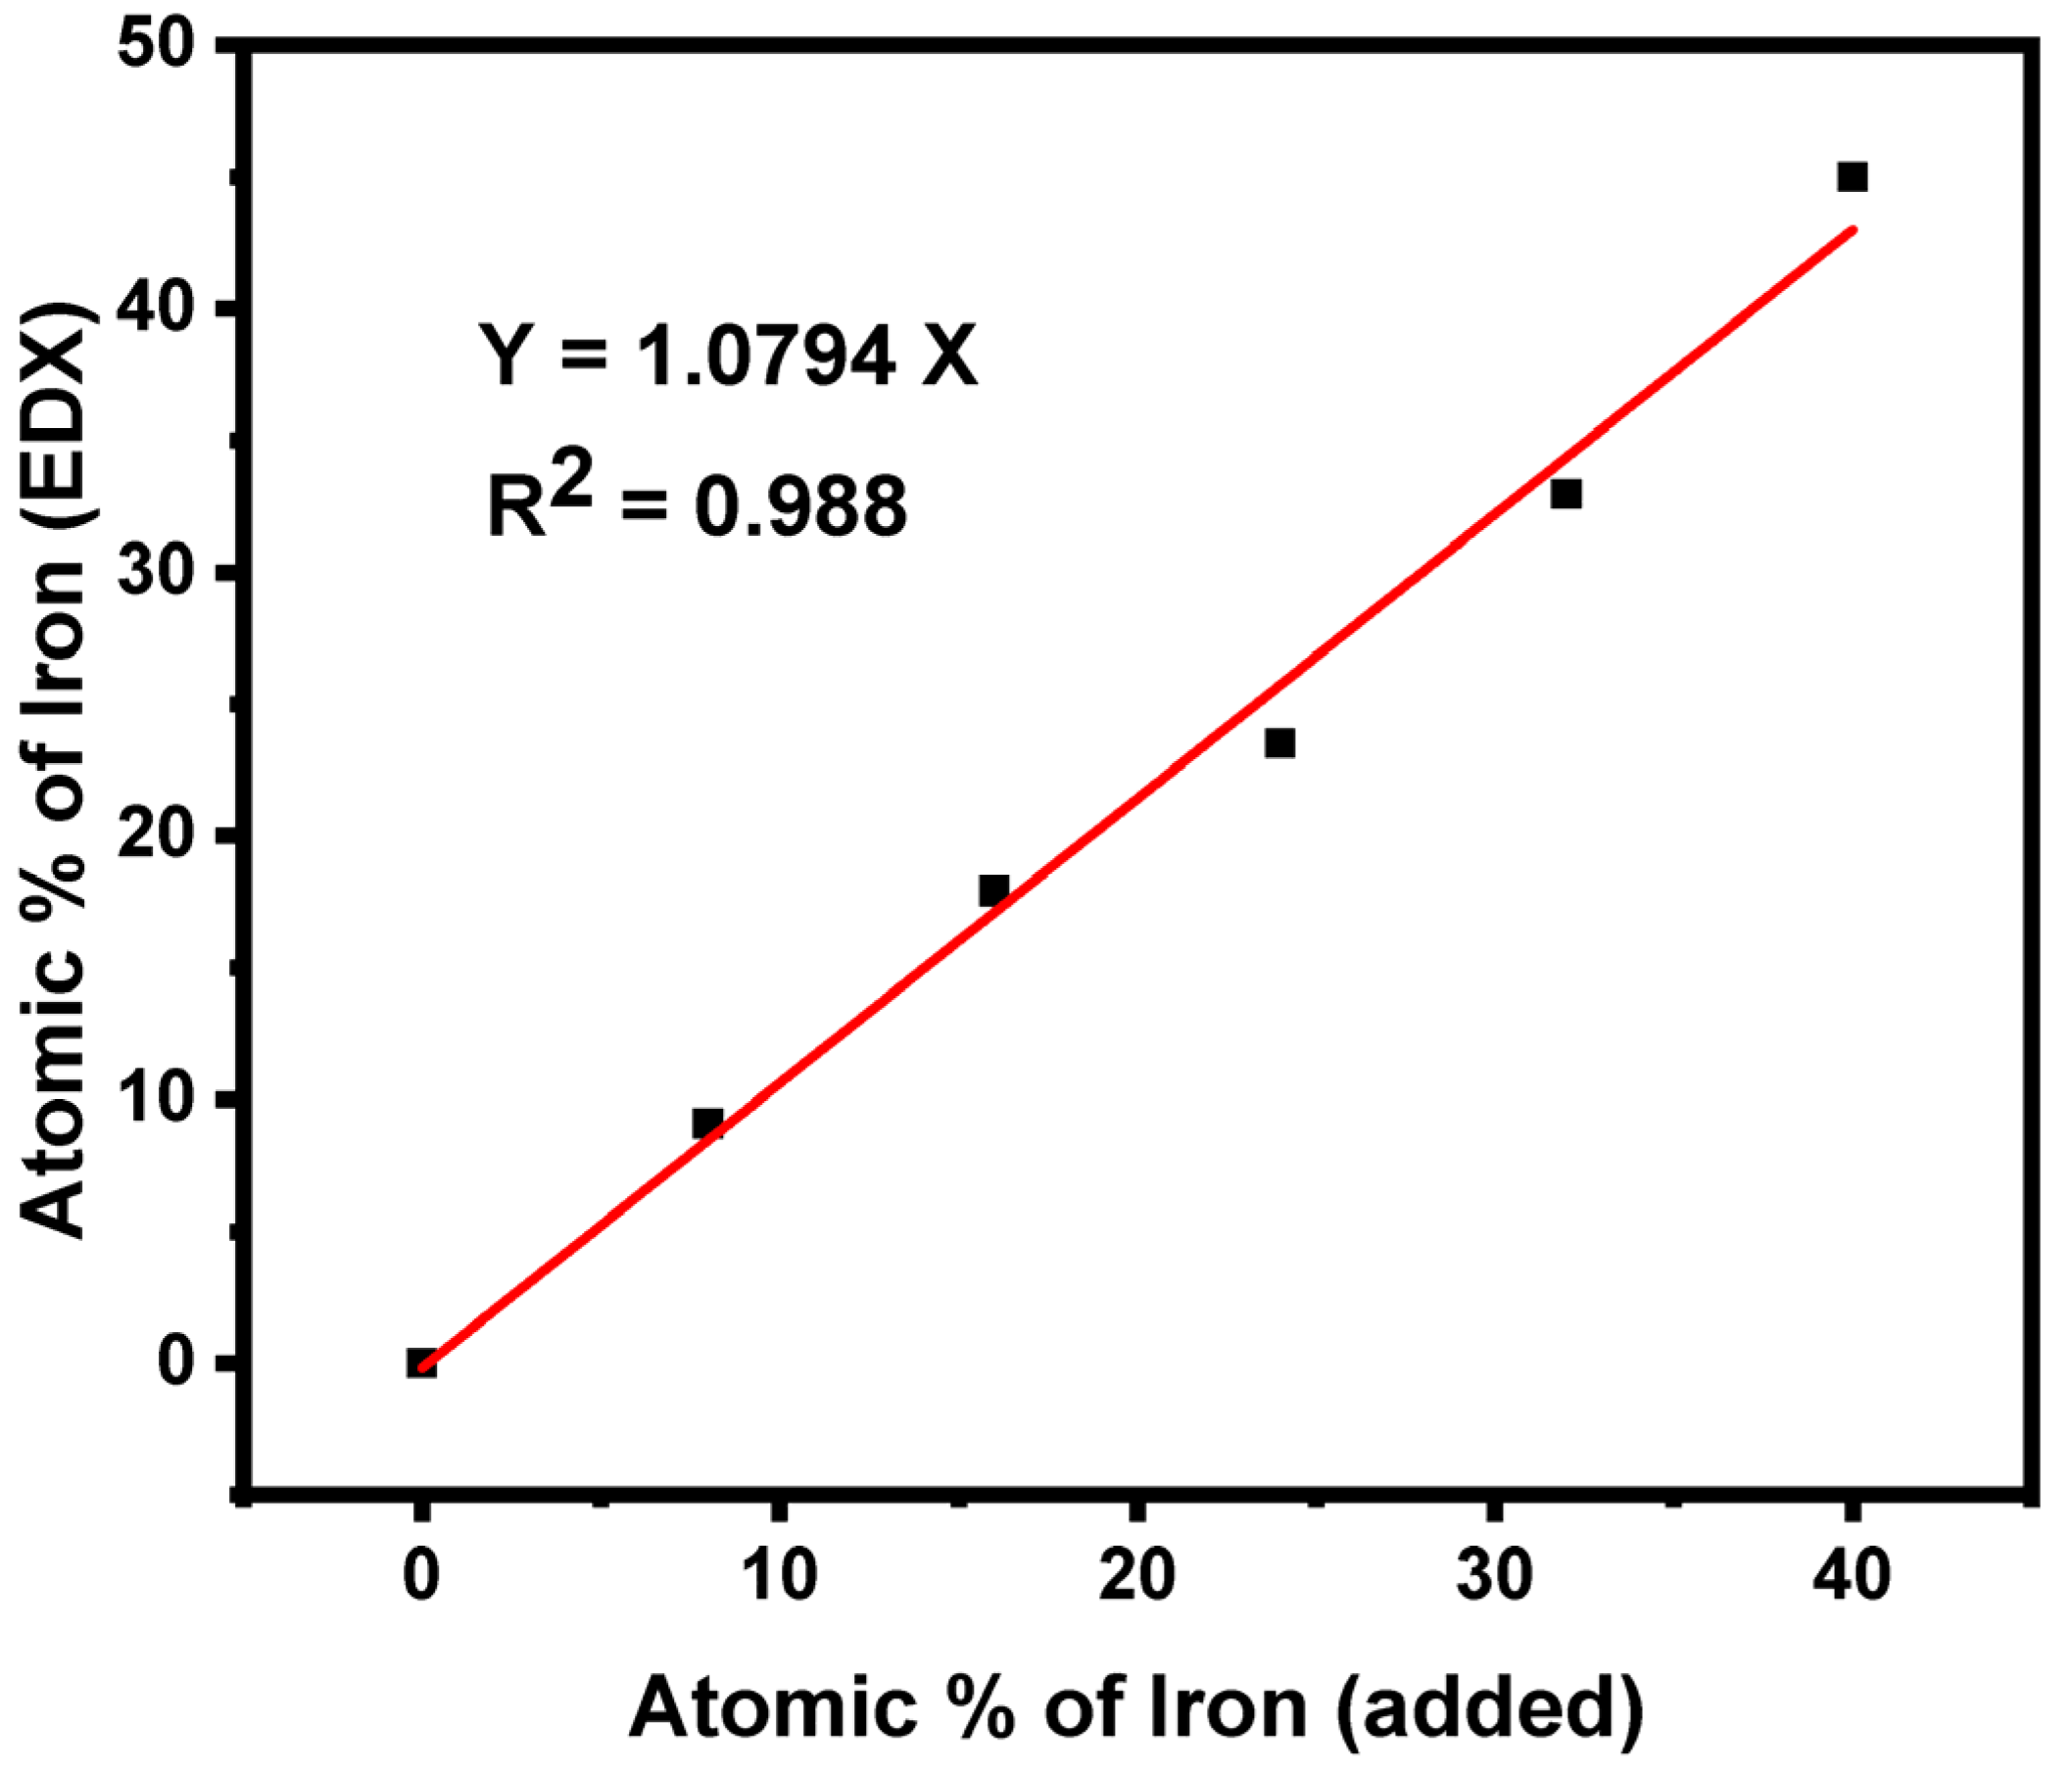
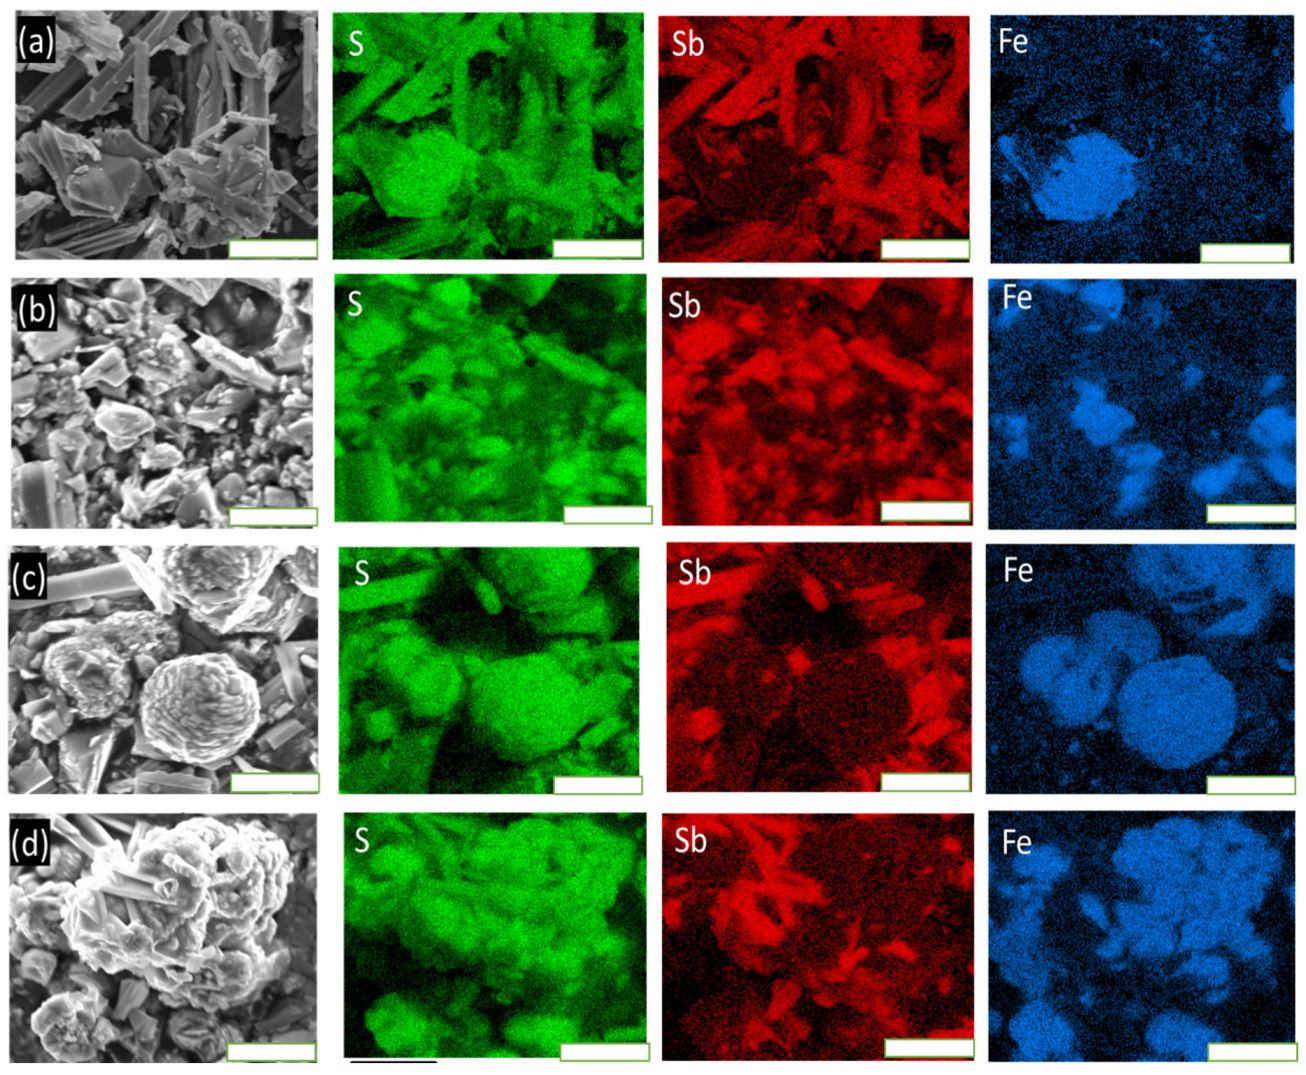
3.3. Energy Dispersive X-ray Spectroscopy

The atomic percentages of antimony, iron, and sulfur in the Sb2(1−x)Fe2xS3 (0 ≤ x ≤ 1) were measured using EDX spectroscopy and are presented in Figure S3 and summarised in Table S2. The sample prepared at x = 0 showed a composition with an atomic percentage of Sb/S as (38:62), which is close to the expected stoichiometry for Sb2S3. Likewise, for x = 1 (FeS), no additional peaks, except Fe and S, were observed in the spectrum. The atomic ratio of Fe to S was 45:55, which is close to the expected stoichiometry of iron sulfide determined from the XRD of Fe1.05S0.95. The EDX spectra of Sb2(1−x)Fe2xS3 with x = 0.2, 0.4, 0.6, and 0.8 displayed the characteristic peaks of antimony, iron, and sulfur (Figure S3). The atomic percentages of antimony, iron, and sulfur at x = 0.2 were measured and all the compositions were found to be in good agreement with the stoichiometric ratio calculated from the feed rate (Table S2). Increasing the molar fraction to x = 0.4 resulted in a higher elemental composition of iron and antimony. This might be because the EDX analysis uses a very small area of the samples that had a lower amount of sulfur. At x = 0.6 and 0.8, the amount of antimony was slightly higher and the amount of sulfur was lower, which revealed that the prepared materials were sulfur-deficient. A linear relationship between the amount of iron in the precursor feed and the amount of iron found in the Sb2(1−x)Fe2xS3 samples determined by the EDX analysis is shown in Figure 3.

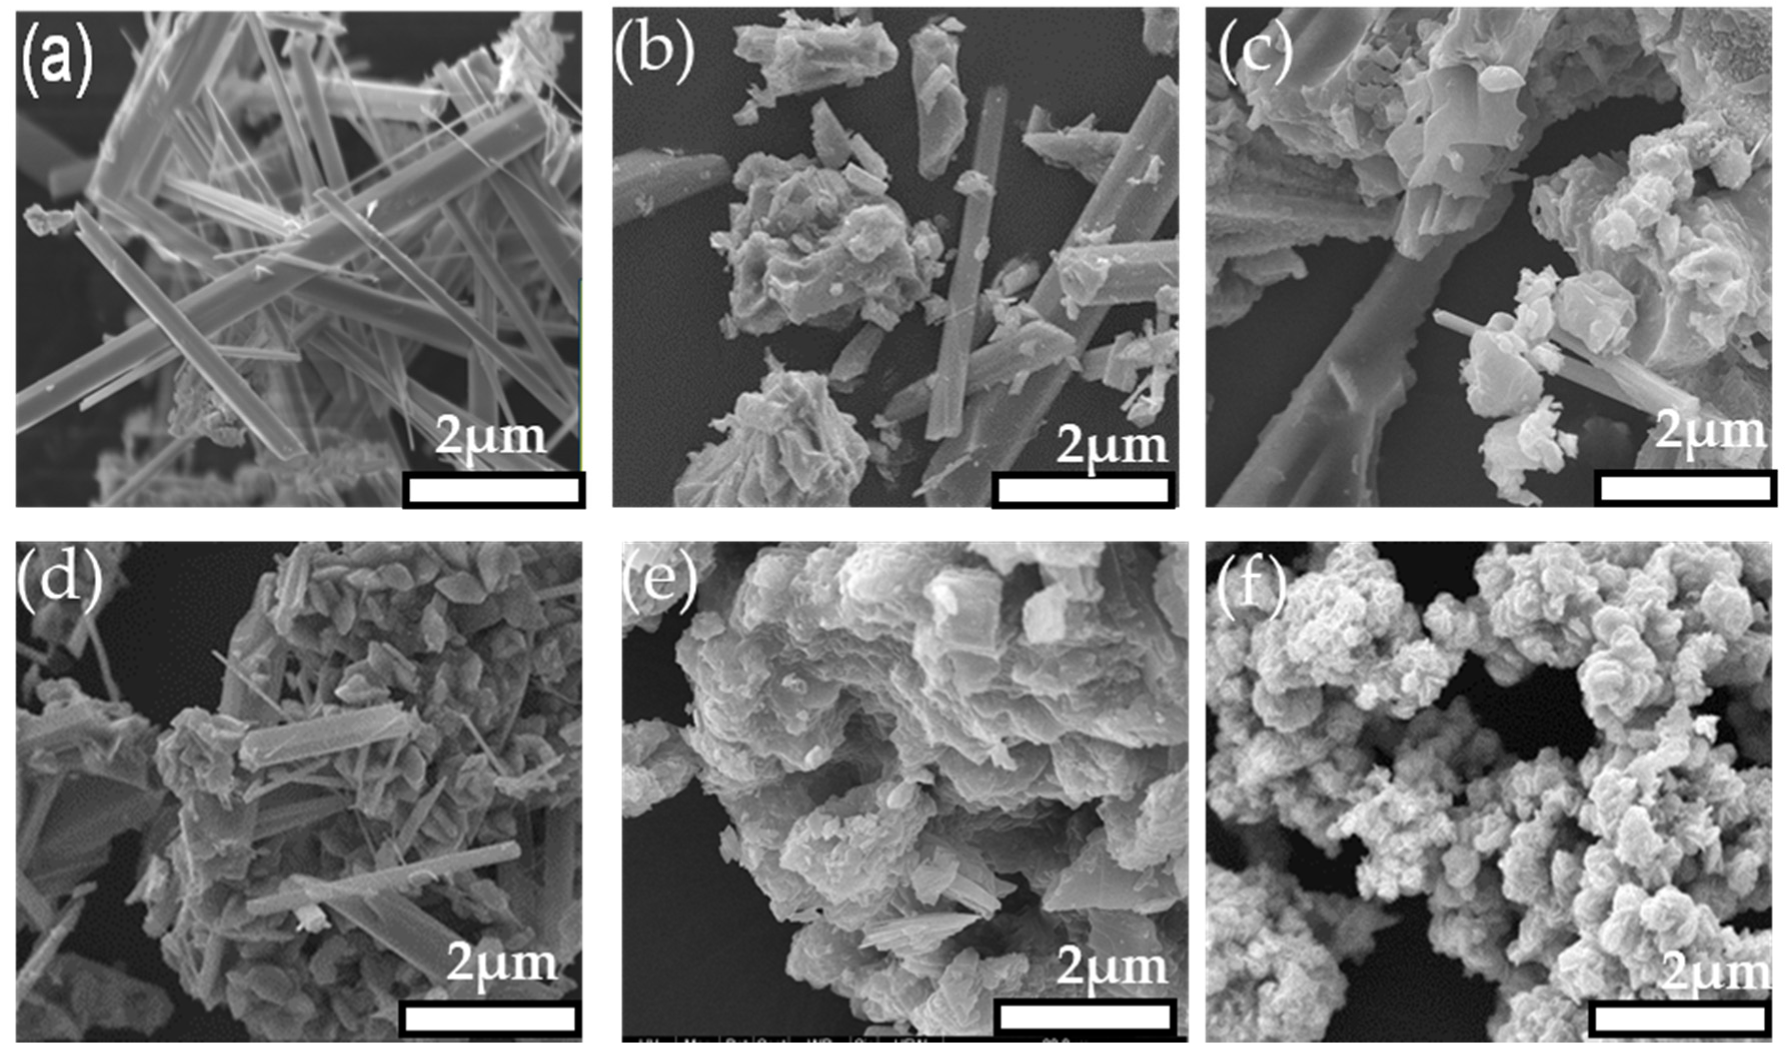
3.4. Scanning Electron Microscopy

The SEM images of the Sb2(1−x)Fe2xS3 systems synthesized using 0, 0.2, 0.4, 0,6 0.8, and 1-mole fraction of Fe are presented in Figure 4. SEM images of pure Sb2S3 (x = 0) revealed rod-like structures (Figure 4a). Previously, Xie et al. prepared nanostructures with similar morphology from antimony diethyldithiocarbamate precursor by the hydrothermal method [35]. The morphology changed to a mixture of a thicker rod and sheet clusters at x = 0.2, 0.4, and 0.6, as shown in Figure 4b,c. A further increase in the molar fraction of Fe to x = 0.8 showed a sheet-like structure of crystallites (Figure 4d). Besides, the morphology of pure iron sulfide at x = 1 showed flower-like structures (Figure 4f). EDX elemental mapping of the Sb2(1−x)Fe2xS3 system is presented in Figure 5 to show the spatial distribution of elements in the system. It can be seen that, at this length scale, sulfur was evenly distributed throughout the sample, while iron and antimony were unevenly distributed throughout the entire sample. Again, this is not entirely unexpected for these samples based on their phase diagram. What is interesting is that, in regions with a high antimony content, there is also a low iron content, suggesting that some iron is incorporated into the antimony sulfide structure, which is commensurate with the peak shifts observed in the P-XRD patterns (vide supra), and suggests that the single source precursor route can produced doped materials, albeit as a mixture of products, but still can circumvent the product expected on the reported phase diagram [43].

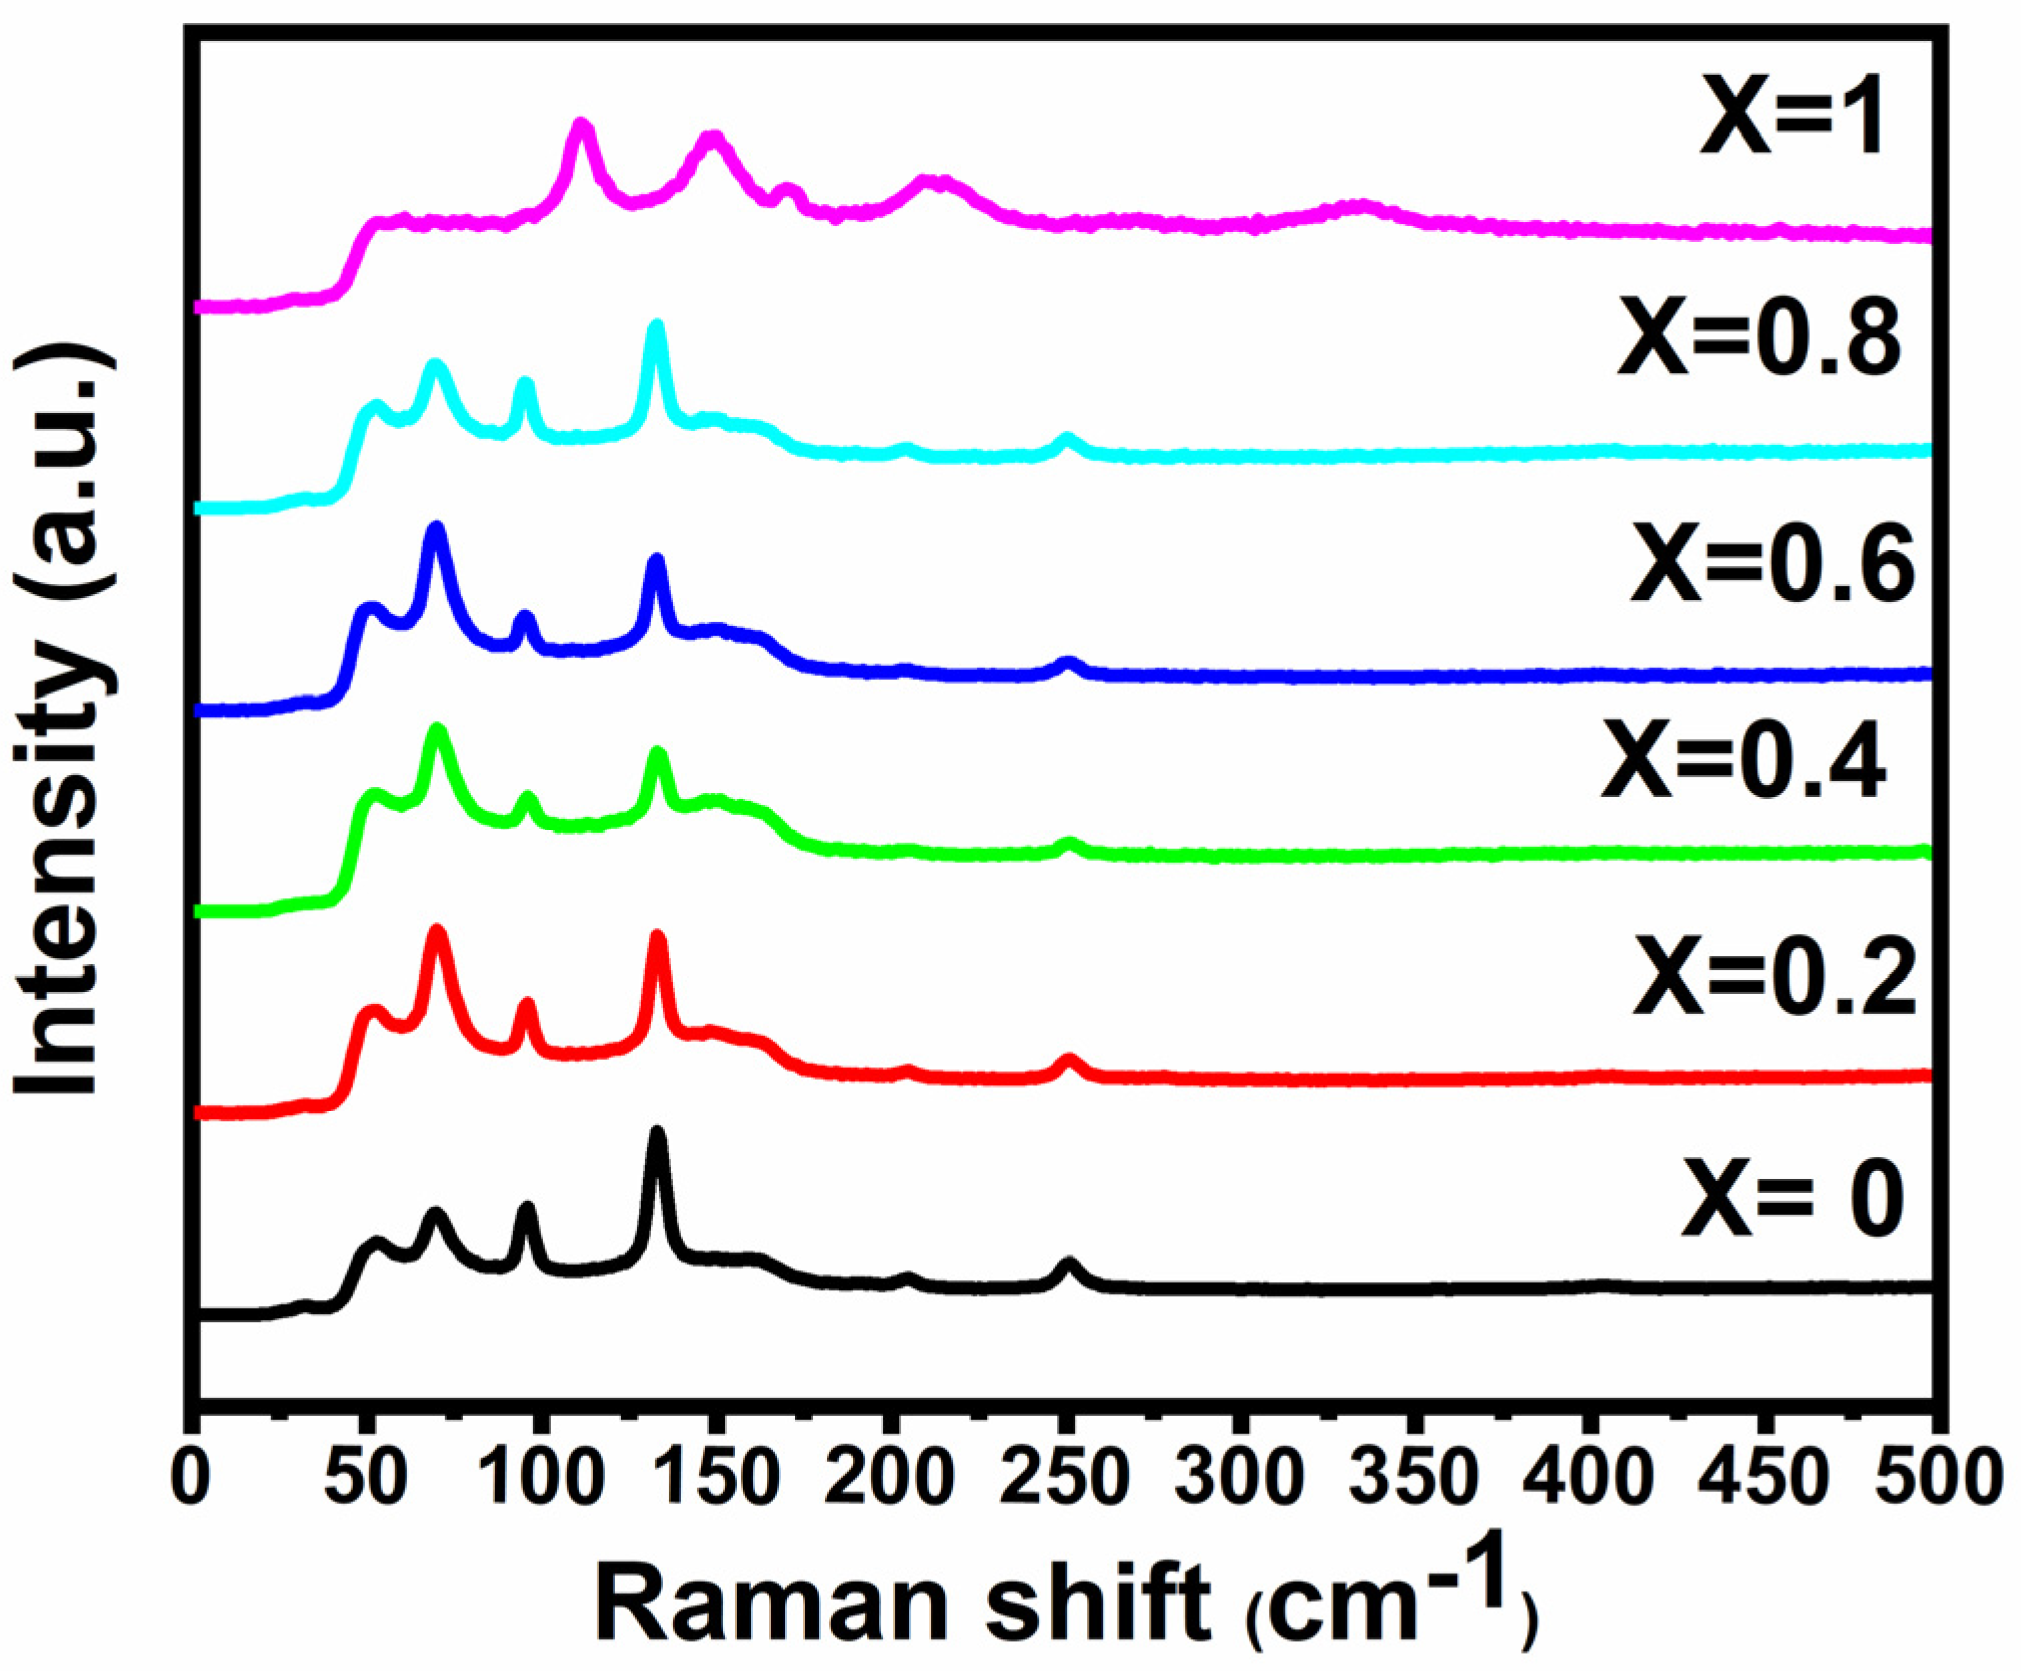
3.5. Raman Spectroscopy

Raman spectroscopy was used to study the Sb2(1−x)Fe2xS3 (0 ≤ x ≤ 1) samples prepared (Figure 6). The pure Sb2S3 (x = 0) sample showed dominant peaks at 53, 69, 98, 145, 184, and 249 cm−1 and three low-intensity peaks at 272, 366, and 445 cm−1 (x = 0), which are in agreement with the Raman analysis reported for the pure Sb2S3 [47]. Similarly, the Raman spectrum of the pure FeS indicated peaks at 122, 155, 175, 224, and 325 cm−1, which are in agreement with the Raman analysis reported for the iron sulfide [48]. For the Sb2(1−x)Fe2xS3 (x = 0.2, 0.4, 0.6, and 0.8), the peaks shifted continuously toward a higher wavenumber with increasing iron content in the precursor, again suggesting doping is possible using metal dithiocarbamate precursors.

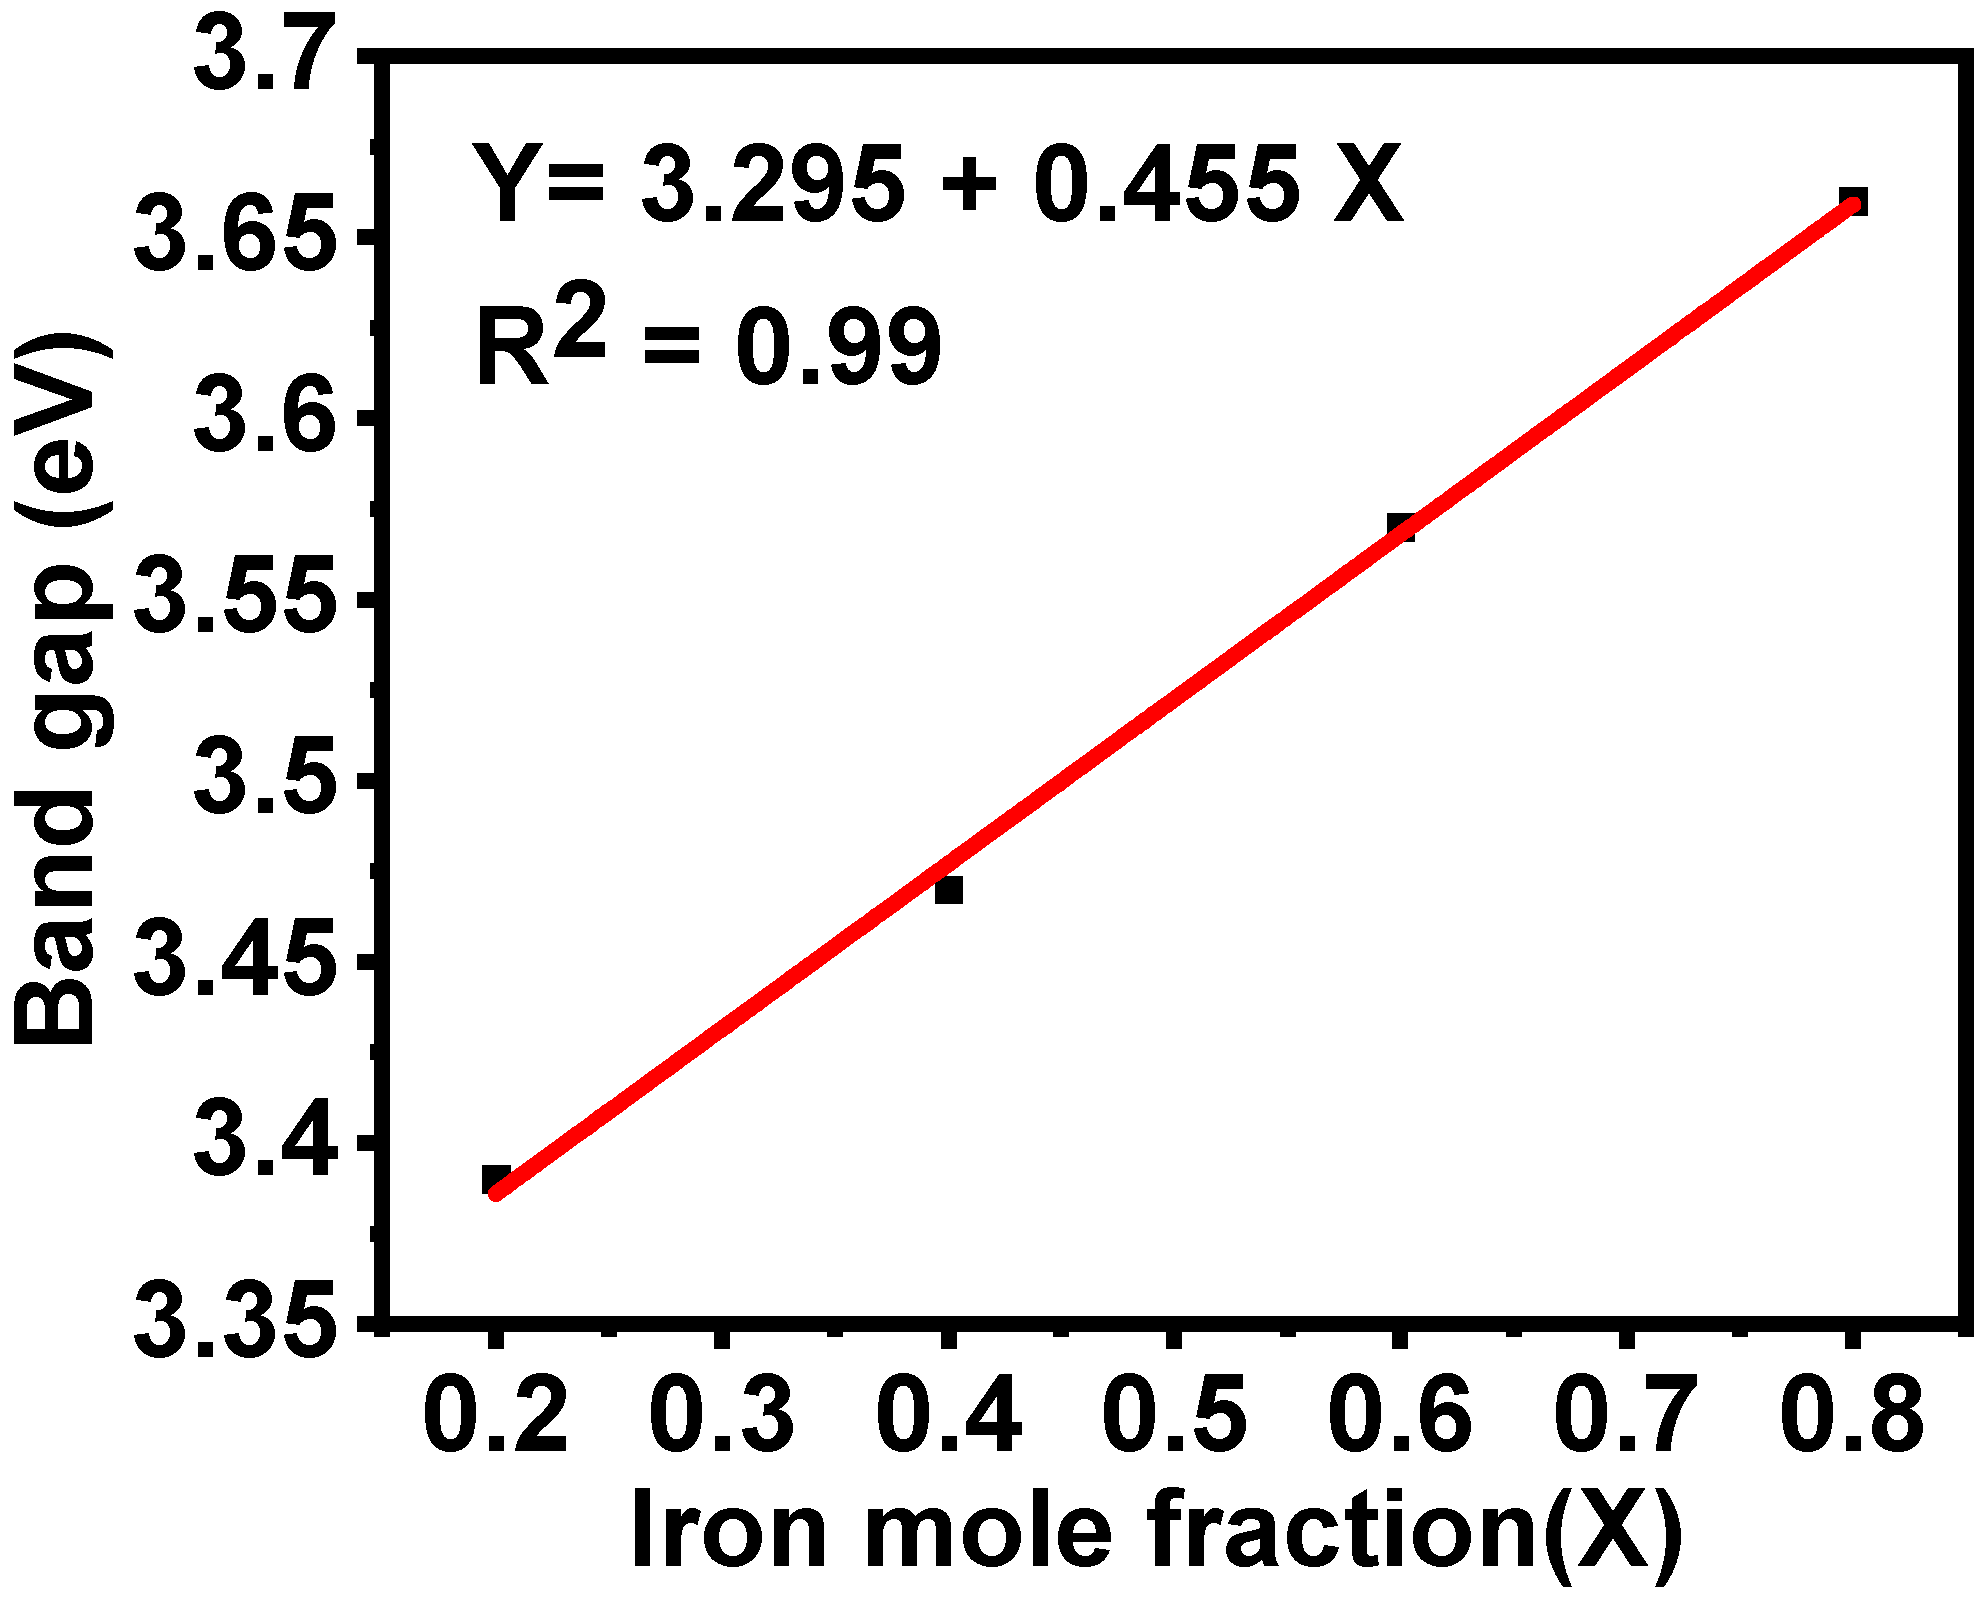
3.6. Optical Properties

For optical bandgap measurements, solutions of Sb2(1−x)Fe2xS3 (0 ≤ x ≥ 1) powder were prepared in methanol, and spectra were recorded in the wavelength range of 300–900 nm. The bandgap energy of the Sb2(1−x)Fe2xS3 (0 ≤ x ≥ 1) was calculated using the following equation:
(αhν)n = A(hν − Eg),
where Eg is the optical band gap; hν is the photon energy; α is the absorption coefficient; A is a constant characteristic of the material; and n = 2 and ½ for allowed direct and allowed indirect transitions, respectively. Plots of the (αhν)n versus hν showed a linear behavior for n = 2, which confirmed the direct transition in all the samples. Figure S4 (Supporting Information) presents the absorption and the Tauc plot to determine the band gaps for all Sb2(1−x)Fe2xS3 samples. For binary FeS and Sb2S3 compositions, the direct band gaps were 3.92 and 2.71 eV, respectively. The obtained bandgaps were in agreement with the reported values for these materials [49]. The bandgap for the mixed samples Sb2(1−x)Fe2xS3 was 3.39, 3.47, 3.57, and 3.66 eV for x = 0.2, 0.4, 0.6, and 0.8, respectively, values that lie between pure FeS and Sb2S3. Figure 7 represents the composition dependence of the bandgap of the Sb2(1−x)Fe2xS3 samples, demonstrating that the bandgap of Sb2(1−x)Fe2xS3 increased from 2.71 to 3.92 eV with increasing iron concentration. This gradual change in the bandgap is due to a small amount of iron being doped into the Sb2S3, which again suggests that the metal dithiocarbamate precursor route is able to produce materials that would not be predicted using a traditional phase diagram.

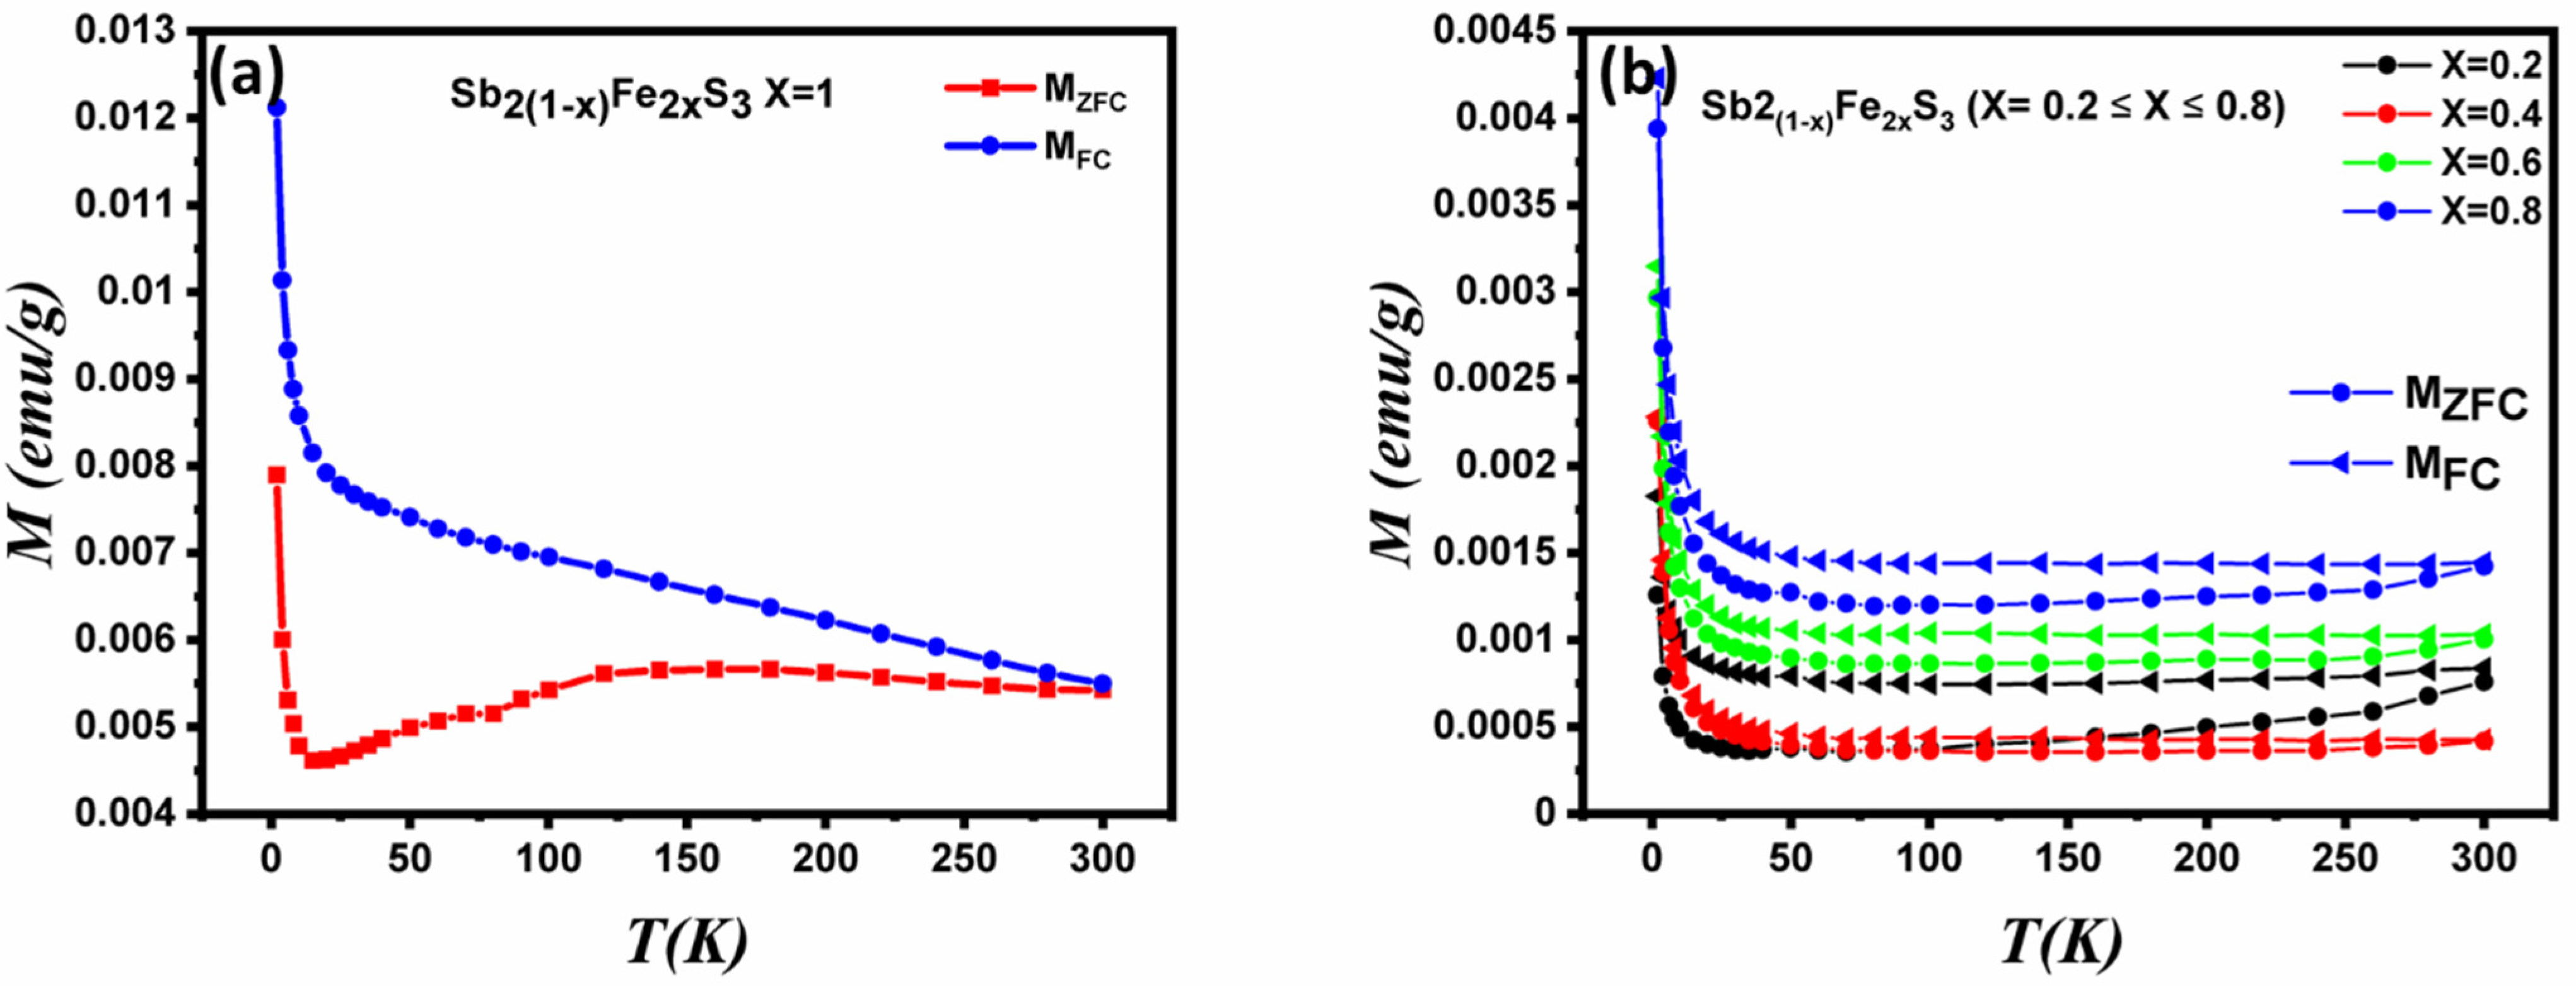
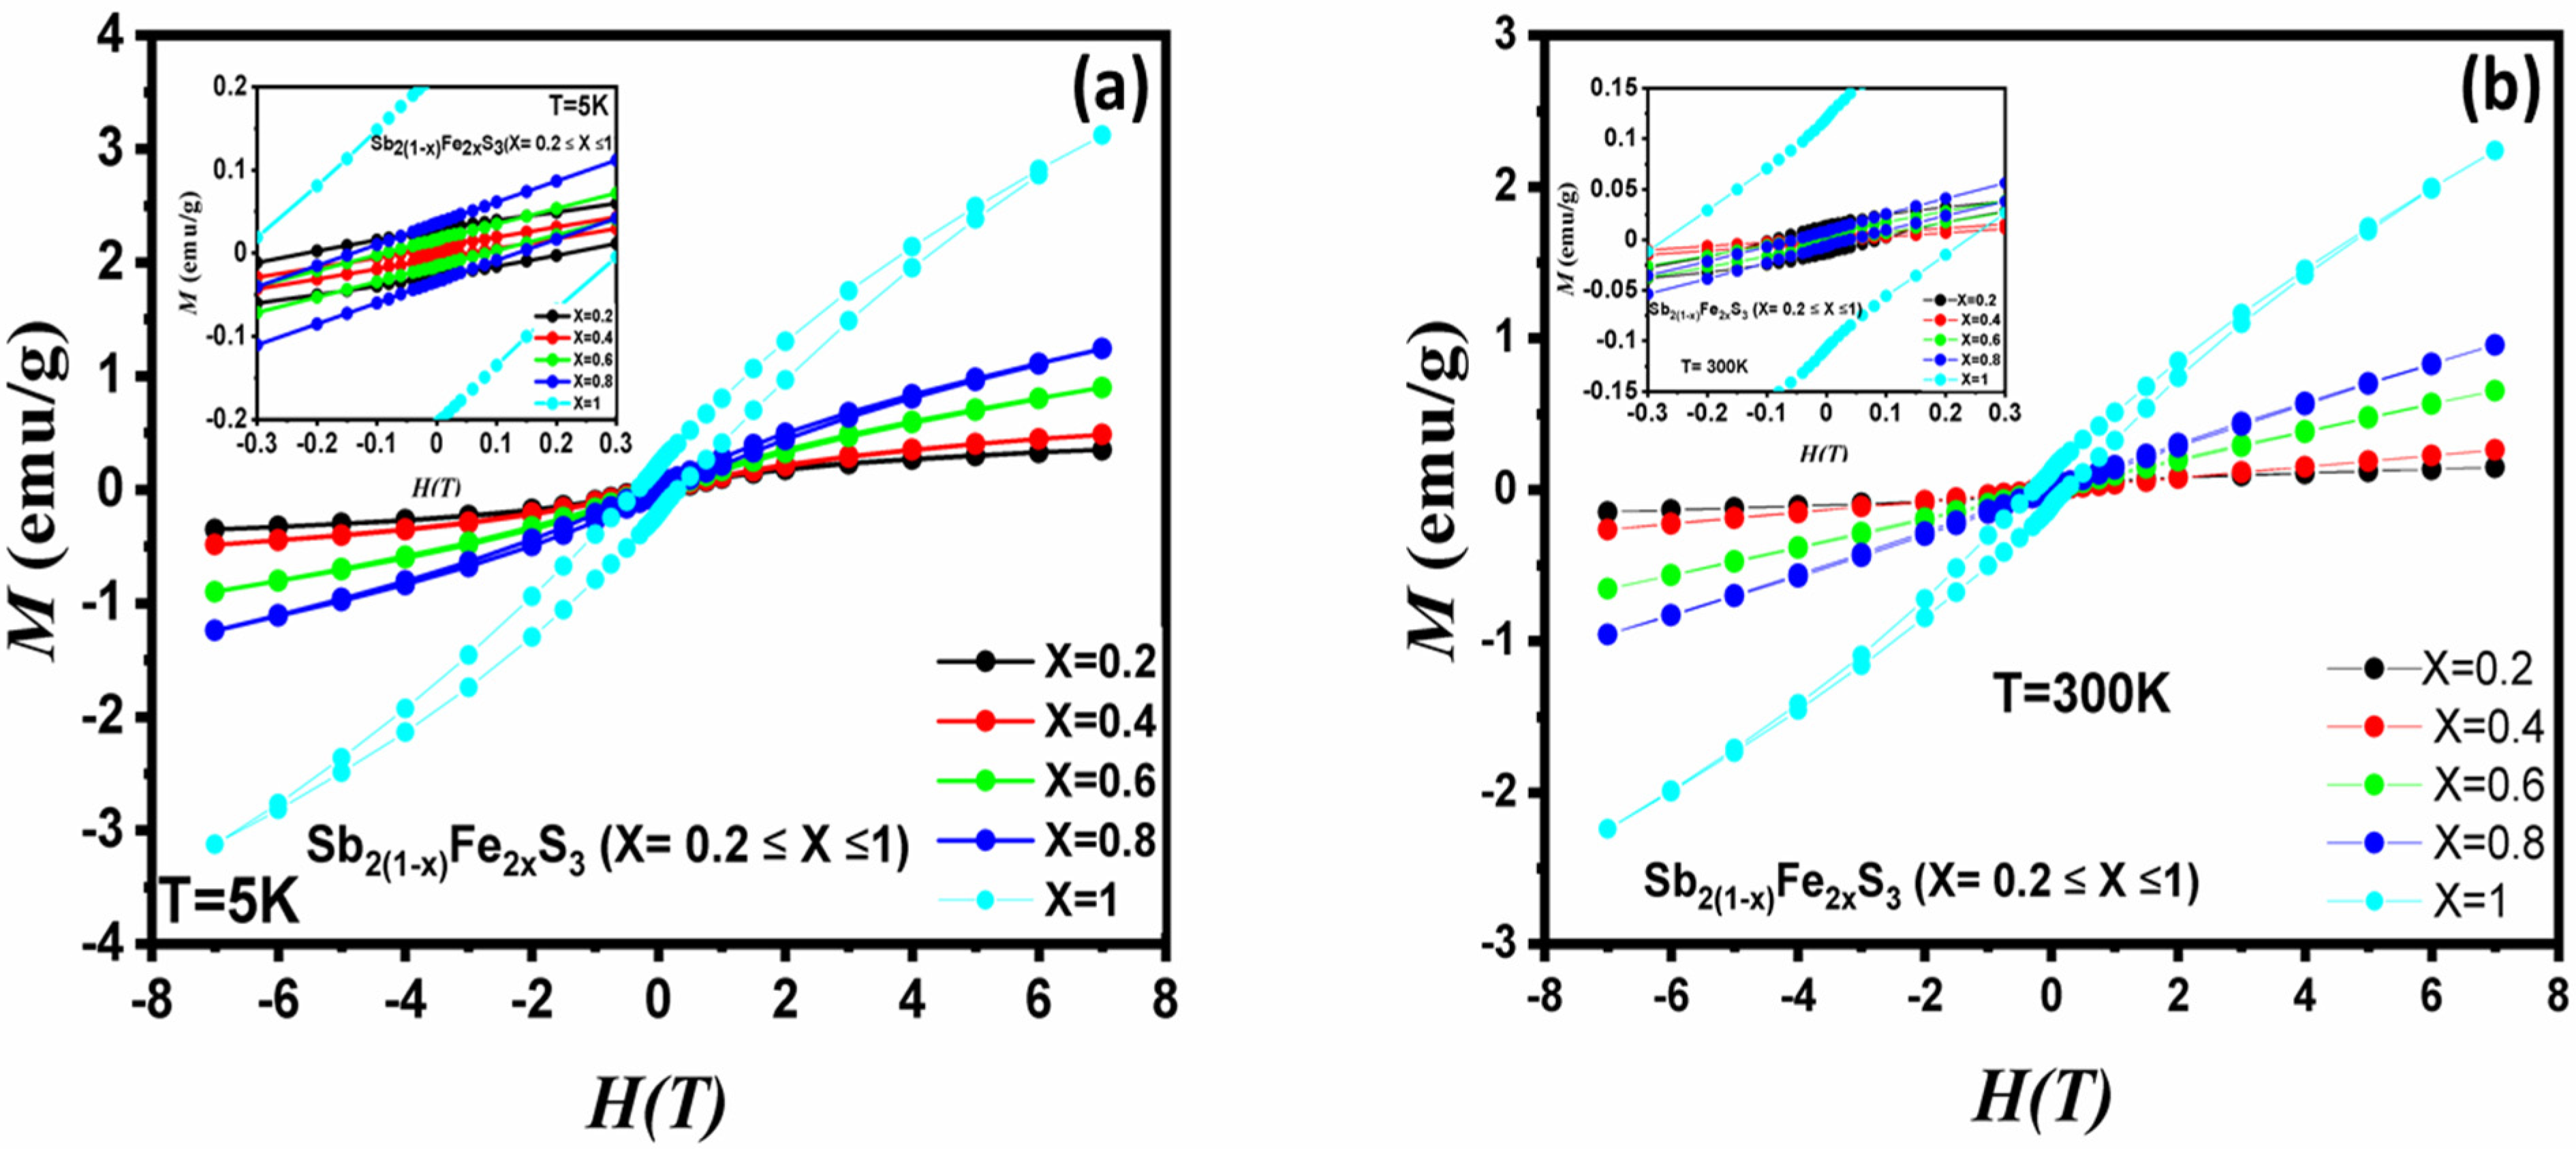
3.7. Magnetic Properties

Variable temperature magnetisation measurements on Sb2(1−x)Fe2xS3 powder containing different amounts of paramagnetic Fe (x = 0.2, 0.4, 0.6, 0.8, and 1) were performed in both zero-field cooled (ZFC) and field-cooled (FC) conditions to better characterise the systems. Data were collected under an applied magnetic field of 100 Oe and are presented in Figure 8a.
The most pronounced split between the ZFC and FC magnetisation curves was observed for the sample with the highest Fe content (x = 1), though irreversibility was observed in all samples. This may indicate that the insertion of anisotropic Fe ions results in large nanoparticle anisotropy and possible ferromagnetic behaviour. Data are presented in Figure 8b.
Measurements of magnetic hysteresis at 5 K (Figure 9a) and 300 K (Figure 9b) report open hysteresis loops in all cases. The coercivity and saturation of the magnetization increase with the increasing amount of iron in the sample, but a full saturation of the magnetisation is not reached even at a 7 T applied field. This could be the result of a too large anisotropy or occurrence of ferrimagnetic rather than ferromagnetic ordering [50]. More information about the coercive field (Hc), remnant magnetization (Mr), and maximum magnetisation values at 5 and 300 K, as deducted from the data in Figure 9, are listed in Table 1.

4. Conclusions

The phase diagram of the Sb-Fe-S system predicts phase-separated solid products in all cases and at all Fe-Sb ratios below ca. 540 °C using traditional solid-state synthesis. In this paper, we tested the hypothesis that precursors could circumvent this thanks to their ability to rapidly form products. Sb-Fe-S powders were synthesized by the solvent-less thermolysis of metal diethyldithiocarbamate single-source precursors at different molar ratios of iron at 450 °C. TGA of two complexes indicated that the precursors decomposed to their corresponding metal sulfides at a similar range of temperatures. XRD analysis of the powder synthesised revealed that a mixture of two phases including orthorhombic Sb2S3 and hexagonal pyrrhotite was synthesised as one might expect from the phase diagram. However, some incorporation of iron into antimony sulfide led to changes in X-ray powder patterns, Raman spectra, and band gap energies. EDX mapping showed the co-localisation of both Sb and Fe alongside the phase-separated binary materials. We conclude that the molecular precursor approach thus may have some merit in producing novel materials in this system, but it must be acknowledged that the synthetic conditions would have to be optimised to produce phase pure materials.

Supplementary Materials

The following are available online at https://0-www-mdpi-com.brum.beds.ac.uk/article/10.3390/inorganics9080061/s1. Supplementary materials are available for this paper which includes recipes used for decomposition, details on decomposition and structural characterisaiton of the binary compounds, and absorption spectra. Figure S1: P-XRD patterns of Sb2S3 nanoparticles at (a) 300, (b) 400, (c) 425, (d) 450 and (e) 475 °C deposited from decomposition of Sb(S2CN(Et)2)3 using melt method for 1h. All peaks corresponded to standard pattern of stibnite (ICDD 01-073-0393); Figure S2: P-XRD patterns of FeS nanoparticles at (a) 300 °C, (b) 400 °C (c) 450 °C and (d) 475 °C from decomposition of Fe(S2CN(Et2))3 using melt method for 1h. All peaks corresponded to standard pattern of pyrrhotite (ICDD 01-075-0600); Figure S3: The EDX spectra of Sb2(1−x)Fe2xS3 samples prepared by melt method at 450 °C at various Iron mole fraction (a) x = 0, (b) x = 0.2, (c) x = 0.4, (d) x = 0.6, (e) x = 0.8 and (f) x = 1.; Figure S4: Absorption spectra of Sb2(1−x)Fe2xS3 and inset the tauc plot of Sb2(1−x)Fe2xS3 samples prepared by melt method at 450 °C at various Iron mole fraction x = 0.2, 0.4, 0.6, and 0.8.; Table S1: Composition used for the synthesis of Sb2(1−x)Fe2xS3 system, Table S2: The content of Fe, Sb and S in Sb2(1−x)Fe2xS3 prepared by melt method at 450 °C (x = 0, 0.2, 0.4, 0.6, 0.8 and 1 molar fraction of iron) calculated from the feed rate and found by EDX measurement.

Author Contributions

D.J.L. conceived and supervised the project. F.M., D.A., F.A., F.T. performed experiments. F.M., D.A., F.A., F.T. and D.J.L. interpreted data. F.M., F.A. and D.J.L. wrote the manuscript. All authors have read and agreed to the published version of the manuscript.

Funding

D.J.L. and F.A. would like to acknowledge the funding from EPSRC UK grant number EP/R020590/1.

Institutional Review Board Statement

Not applicable.

Informed Consent Statement

Not applicable.

Data Availability Statement

All data presented is available in this manuscript.

Acknowledgments

Fadiyah Makin thanks Jazan University for the funding support and for allowing a period of study in the United Kingdom, as well as the Saudi Arabian Cultural Bureau in London for their assistance and support.

Conflicts of Interest

The authors declare no conflict of interest.

References

  1. Liu, Y.; Shen, Q.; Yu, D.; Shi, W.; Li, J.; Zhou, J.; Liu, X. A facile and green preparation of high-quality CdTe semiconductor nanocrystals at room temperature. Nanotechnology 2008, 19, 245601. [Google Scholar] [CrossRef]
  2. Tang, K.; Zhang, J.; Yan, W.; Li, Z.; Wang, Y.; Yang, W.; Xie, Z.; Sun, T.; Fuchs, H. One-step controllable synthesis for high-quality ultrafine metal oxide semiconductor nanocrystals via a separated two-phase hydrolysis reaction. J. Am. Chem. Soc. 2008, 130, 2676–2680. [Google Scholar] [CrossRef]
  3. Zhu, Q.-A.; Gong, M.; Zhang, C.; Yong, G.-B.; Xiang, S. Preparation of Sb2S3 nanomaterials with different morphologies via a refluxing approach. J. Cryst. Growth 2009, 311, 3651–3655. [Google Scholar] [CrossRef]
  4. Gorer, S.; Hodes, G. Quantum size effects in the study of chemical solution deposition mechanisms of semiconductor films. J. Phys. Chem. 1994, 98, 5338–5346. [Google Scholar] [CrossRef]
  5. Moreels, I.Z.; Lambert, K.; De Muynck, D.; Vanhaecke, F.; Poelman, D.; Martins, J.C.; Allan, G.; Hens, Z. Composition and size-dependent extinction coefficient of colloidal PbSe quantum dots. Chem. Mater. 2007, 19, 6101–6106. [Google Scholar] [CrossRef]
  6. Zakutayev, A.; Major, J.D.; Hao, X.; Walsh, A.; Tang, J.; Todorov, T.K.; Wong, L.H.; Saucedo, E. Emerging inorganic solar cell efficiency tables (version 2). J. Phys. Energy 2021, 3, 032003. [Google Scholar] [CrossRef]
  7. Khalid, S.; Ahmed, E.; Khan, Y.; Riaz, K.N.; Malik, M.A. Nanocrystalline pyrite for photovoltaic applications. Chemistryselect 2018, 3, 6488–6524. [Google Scholar] [CrossRef] [Green Version]
  8. Luo, L.; Luan, W.; Yuan, B.; Zhang, C.; Jin, L. High efficient and stable solid solar cell: Based on FeS2 nanocrystals and P3HT: PCBM. Energy Procedia 2015, 75, 2181–2186. [Google Scholar] [CrossRef] [Green Version]
  9. Yang, R.X.; Butler, K.T.; Walsh, A. Assessment of hybrid organic–inorganic antimony sulfides for earth-abundant photovoltaic applications. J. Phys. Chem. Lett. 2015, 6, 5009–5014. [Google Scholar] [CrossRef] [Green Version]
  10. Roy, B.; Chakraborty, B.; Bhattacharya, R.; Dutta, A. Electrical and magnetic properties of antimony sulphide (Sb2S3) crystals and the mechanism of carrier transport in it. Solid State Commun. 1978, 25, 937–940. [Google Scholar] [CrossRef]
  11. Savadogo, O.; Mandal, K. Studies on new chemically deposited photoconducting antimony trisulphide thin films. Sol. Energy Mater. Sol. Cells 1992, 26, 117–136. [Google Scholar] [CrossRef]
  12. Savadogo, O. Chemically and electrochemically deposited thin films for solar energy materials. Sol. Energy Mater. Sol. Cells 1998, 52, 361–388. [Google Scholar] [CrossRef]
  13. George, J.; Radhakrishnan, M. Electrical conduction in coevaporated antimony trisulphide films. Solid State Commun. 1980, 33, 987–989. [Google Scholar] [CrossRef]
  14. Meshkauskas, J. Dielectric properties of Sb2S3 at microwave frequencies. Phys. Status Solid 1976, 39, 39–41. [Google Scholar]
  15. Biswal, J.B.; Garje, S.S.; Revaprasadu, N. A convenient synthesis of antimony sulfide and antimony phosphate nanorods using single source dithiolatoantimony (III) dialkyldithiophosphate precursors. Polyhedron 2014, 80, 216–222. [Google Scholar] [CrossRef]
  16. Lei, H.; Chen, J.; Tan, Z.; Fang, G. Review of recent progress in antimony chalcogenide-based solar cells: Materials and devices. Sol. RRL 2019, 3, 1900026. [Google Scholar] [CrossRef]
  17. Savadogo, O.; Mandal, K.C. Low-cost technique for preparing n-Sb2S3/p-Si heterojunction solar cells. Appl. Phys. Lett. 1993, 63, 228–230. [Google Scholar] [CrossRef] [Green Version]
  18. Yang, Z.; Wang, X.; Chen, Y.; Zheng, Z.; Chen, Z.; Xu, W.; Liu, W.; Yang, Y.; Zhao, J.; Chen, T.; et al. Ultrafast self-trapping of photoexcited carriers sets the upper limit on antimony trisulfide photovoltaic devices. Nat. Commun. 2019, 10, 1–8. [Google Scholar] [CrossRef]
  19. Kondrotas, R.; Chen, C.; Tang, J. Sb2S3 solar cells. Joule 2018, 2, 857–878. [Google Scholar] [CrossRef] [Green Version]
  20. Wang, X.; Tang, R.; Wu, C.; Zhu, C.; Chen, T. Development of antimony sulfide–selenide Sb2(S, Se)3-based solar cells. J. Energy Chem. 2018, 27, 713–721. [Google Scholar] [CrossRef] [Green Version]
  21. Escorcia-García, J.; Becerra, D.; Nair, M.; Nair, P. Heterojunction CdS/Sb2S3 solar cells using antimony sulfide thin films prepared by thermal evaporation. Thin Solid Film. 2014, 569, 28–34. [Google Scholar] [CrossRef]
  22. Choi, Y.C.; Seok, S.I. Efficient Sb2S3-sensitized solar cells via single-step deposition of Sb2S3 using S/Sb-ratio-controlled SbCl3-thiourea complex solution. Adv. Funct. Mater. 2015, 25, 2892–2898. [Google Scholar] [CrossRef]
  23. Cheong, S.; Ferguson, P.M.; Feindel, K.; Hermans, I.; Callaghan, P.T.; Meyer, C.; Slocombe, A.; Su, C.-H.; Cheng, F.-Y.; Yeh, C.-S.; et al. Simple synthesis and functionalization of iron nanoparticles for magnetic resonance imaging. Angew. Chem. Int. Ed. 2011, 50, 4206–4209. [Google Scholar] [CrossRef]
  24. Herman, D.A.J.; Ferguson, P.; Cheong, S.; Hermans, I.F.; Ruck, B.J.; Allan, K.M.; Prabakar, S.; Spencer, J.L.; Lendrum, C.D.; Tilley, R.D. Hot-injection synthesis of iron/iron oxide core/shell nanoparticles for T2 contrast enhancement in magnetic reso-nance imaging. Chem. Commun. 2011, 47, 9221–9223. [Google Scholar] [CrossRef]
  25. Sun, S.; Murray, C.B.; Weller, D.; Folksm, L.; Moser, A. Monodisperse FePt nanoparticles and ferromagnetic FePt nanocrystal superlattices. Science 2000, 287, 1989–1992. [Google Scholar] [CrossRef] [PubMed]
  26. Wintenberger, M.; André, G. Magnetic properties and spiral magnetic structure of berthierite FeSb2S4. Phys. B Condens. Matter 1990, 162, 5–12. [Google Scholar] [CrossRef]
  27. Yin, J.; Jin, J.; Lin, H.; Yin, Z.; Li, J.; Lu, M.; Guo, L.; Xi, P.; Tang, Y.; Yan, C. Optimized metal chalcogenides for boosting water splitting. Adv. Sci. 2020, 7, 1903070. [Google Scholar] [CrossRef] [PubMed] [Green Version]
  28. Azadar, R.; Hussain, I. Use of surfactants to tailor the morphologies and crystalline phases of thin films via aerosol assisted chemical vapor deposition. J. Solid State Chem. 2020, 288, 121429. [Google Scholar]
  29. Park, J.-H.; Kang, S.G.; Lee, Y.K.; Chung, T.-M.; Park, B.K.; Kim, C.G. Tin (II) aminothiolate and Tin (IV) aminothiolate selenide compounds as single-source precursors for tin chalcogenide materials. Inorg. Chem. 2020, 59, 3513–3517. [Google Scholar] [CrossRef] [PubMed]
  30. Khan, M.D.; Revaprasadu, N. Metal-organic precursors for ternary and quaternary metal chalcogenide nanoparticles and thin films. R. Soc. Chem. 2020, 1–31. [Google Scholar] [CrossRef]
  31. Lou, W.; Chen, M.; Wang, X.; Liu, W. Novel single-source precursors approach to prepare highly uniform Bi2S3 and Sb2S3 nanorods via a solvothermal treatment. Chem. Mater. 2007, 19, 872–878. [Google Scholar] [CrossRef]
  32. Pickett, N.L.; O’Brien, P. Syntheses of semiconductor nanoparticles using single-molecular precursors. Chem. Rec. 2001, 1, 467–479. [Google Scholar] [CrossRef] [PubMed]
  33. Adeyemi, J.O.; Onwudiwe, D.C. Organotin (IV) dithiocarbamate complexes: Chemistry and biological activity. Molecules 2018, 23, 2571. [Google Scholar] [CrossRef] [PubMed] [Green Version]
  34. Zhang, Y.; Du, Y.; Xu, H.; Wang, Q. Diverse-shaped iron sulfide nanostructures synthesized from a single source precursor approach. CrystEngComm 2010, 12, 3658–3663. [Google Scholar] [CrossRef]
  35. Xie, G.; Qiao, Z.-P.; Zeng, M.-H.; Chen, X.-M.; Gao, S.-L. A single-source approach to Bi2S3 and Sb2S3 nanorods via a hydrothermal treatment. Cryst. Growth Des. 2004, 4, 513–516. [Google Scholar] [CrossRef]
  36. Sun, J.; Shen, X.; Guo, L.; Wang, G.; Park, J.; Wang, K. Solvothermal synthesis of ternary sulfides of Sb2xBixS3 (x = 0.4, 1) with 3D flower-like architectures. Nanoscale Res. Lett. 2010, 5, 364–369. [Google Scholar] [CrossRef] [Green Version]
  37. Xu, D.; Shen, S.; Zhang, Y.; Gu, H.; Wang, Q. Selective synthesis of ternary copper–antimony sulfide nanocrystals. Inorg. Chem. 2013, 52, 12958–12962. [Google Scholar] [CrossRef]
  38. Lu, L.; Zhang, A.; Xiao, Y.; Gong, F.; Jia, D.; Li, F. Effect of solid inorganic salts on the formation of cubic-like aggregates of ZnSnO3 nanoparticles in solventless, organic-free reactions and their gas sensing behaviors. Mater. Sci. Eng. B 2012, 177, 942–948. [Google Scholar] [CrossRef]
  39. Chen, Y.-B.; Chen, L.; Wu, L.-M. Structure-controlled solventless thermolytic synthesis of uniform silver nanodisks. Inorg. Chem. 2005, 44, 9817–9822. [Google Scholar] [CrossRef]
  40. García-Peña, N.G.; Caminade, A.-M.; Ouali, A.; Redón, R.; Turrin, C.-O. Solventless synthesis of Ru (0) composites stabilized with polyphosphorhydrazone (PPH) dendrons and their use in catalysis. RSC Adv. 2016, 6, 64557–64567. [Google Scholar] [CrossRef]
  41. Lewis, E.; Haigh, S.; O’Brien, P. The synthesis of metallic and semiconducting nanoparticles from reactive melts of precursors. J. Mater. Chem. A 2014, 2, 570–580. [Google Scholar] [CrossRef] [Green Version]
  42. Zeng, N.; Wang, Y.-C.; Neilson, J.; Fairclough, S.M.; Zou, Y.; Thomas, A.G.; Cernik, R.J.; Haigh, S.J.; Lewis, D.J. Rapid and low-temperature molecular precursor approach toward ternary layered metal chalcogenides and oxides: Mo1−xWxS2 and Mo1−xWxO3 Alloys (0 ≤ x ≤ 1). Chem. Mater. 2020, 32, 7895–7907. [Google Scholar] [CrossRef] [PubMed]
  43. Urazov, G.G.; Bolshakov, K.A.; Federov, P.I.; Vasilevskaya, I.I. The antimony-iron-sulphur ternary system. A contribution to the theory of precipitation smelting of antimony. Russ. J. Inorg. Chem. 1960, 5, 214–218. [Google Scholar]
  44. Malik, A. Deposition of iron sulfide thin films by AACVD from single source precursors. J. Cryst. Growth 2011, 346, 106–112. [Google Scholar]
  45. Shavel, A.; Ibáñez, M.; Luo, Z.; De Roo, J.; Carrete, A.; Dimitrievska, M.; Gencì, A.; Meyns, M.; Pérez-Rodríguez, A.; Kovalenko, M.V.; et al. Scalable heating-up synthesis of monodisperse Cu2ZnSnS4 nanocrystals. Chem. Mater. 2016, 28, 720–726. [Google Scholar] [CrossRef] [Green Version]
  46. Inagawa, I.; Morimoto, S.; Yamashita, T.; Shirotani, I. Temperature dependence of transmission loss of chalcogenide glass fibers. Jpn. J. Appl. Phys. 1997, 36, 2229–2235. [Google Scholar] [CrossRef]
  47. Almalki, R.; Mkawi, E.M.; Al-Hadeethi, Y. Fabricating antimony sulfide Sb2S3 microbars using solvothermal synthesis: Effect of the solvents used on the optical, structural, and morphological properties. J. Mater. Sci. Mater. Electron. 2020, 31, 9203–9211. [Google Scholar] [CrossRef]
  48. Remazeilles, C.; Tran, K.; Guilminot, E.; Conforto, E.; Refait, P. Study of Iron(II) Sulphides by Environmental Scanning Electron Microscopy (ESEM) and Micro-Raman Spectroscopy in Waterlogged Archaeological Woods. In Proceedings of the 10th International Conference on Non-Destructive Investigations and Microanalysis for the Diagnostics and Conservation of Cultural and Environmental Heritage, Florence, Italy, 13–15 April 2011. [Google Scholar] [CrossRef]
  49. Sultan, M.; Khan, Y.; Hussain, S.T.; Shafiq, M. Growth and optical properties of antimony sulfide decorated ZnO nano-rod heterojunctions. Mater. Lett. 2013, 104, 44–47. [Google Scholar] [CrossRef]
  50. Bhowmik, R. Ferromagnetism in lead graphite-pencils and magnetic composite with CoFe2O4 particles. Compos. Part B Eng. 2012, 43, 503–509. [Google Scholar] [CrossRef] [Green Version]
Figure 1. Thermogravimetric analysis (TGA) of Sb[S2CNEt2]3 and Fe[S2CNEt2]3 complexes. The black dotted line refers to the weight loss for the formation of Sb2S3 and the red dotted line refers to the values of weight loss to produce FeS.
Inorganics 09 00061 g001
Figure 2. Powder X-ray diffraction (P-XRD) patterns of Sb2(1−x)Fe2xS3 (0 ≤ x ≥1) produced by solvent-less thermolysis at 450 °C with variation in Fe/(Fe + Sb) molar ratio x = 0, x = 0.2, x = 0.4, x = 0.6, x = 0.8, and x = 1 with a standard pattern of Sb2S3 (bottom) and Fe1.05S0.95 (top).
Inorganics 09 00061 g002
Figure 3. Linear relationship between the amount of iron in the precursors and the amount of iron in Sb2(1−x)Fe2xS3 systems determined by energy dispersive X-ray (EDX) measurement.
Inorganics 09 00061 g003
Figure 4. SEM images of Sb2(1−x)Fe2xS3 powder prepared by the melt method for 1 h at 450 °C using different mole fractions of iron (a) x = 0 (b) x = 0.2 (c) x = 0.4 (d) x = 0.6 (e) x = 0.8, and (f) x = 1.
Inorganics 09 00061 g004
Figure 5. EDX elemental mapping of S kα, Sb Lα, and Fe Kα for Sb2(1−x)Fe2xS3 prepared by the melt method for 1 h at 450 °C using different mole fractions of iron (a) x = 0.2 (b) x = 0.4 (c) x = 0.6, and (d) x = 0.8.
Inorganics 09 00061 g005
Figure 6. Raman spectra of Sb2(1−x)Fe2xS3 (0 ≤ x ≤ 1) samples prepared by the melt method from a mixture of antimony and iron diethyldithiocarbamate at 450 °C with different mole fractions of Fe.
Raman spectra of Sb2(1−x)Fe2xS3 (0 ≤ x ≤ 1) samples prepared by the melt method from a mixture of antimony and iron diethyldithiocarbamate at 450 °C with different mole fractions of Fe.
Inorganics 09 00061 g006
Figure 7. Variation of the direct band gaps for Sb2(1−x)Fe2xS3 (0 ≤ x ≤ 1) samples prepared at different mole fractions of x = 0.2, 0.4, 0.6, and 0.8.
Inorganics 09 00061 g007
Figure 8. Plots of magnetization vs. temperature for Sb2(1−x)Fe2xS3 (a) x = 1 (b) 0.2 ≤ x ≤ 0.8, measured in zero-field-cooled (ZFC) and field-cooled (FC) regimes, with 100 Oe applied field.
Inorganics 09 00061 g008
Figure 9. Hysteresis loops at (a) 5 K and (b) 300 K for Sb2(1−x)Fe2xS3 (0.2 ≤ x ≤ 1). The inset is a zoom of the region around the zero field.
Inorganics 09 00061 g009
Table 1. Coercive field, maximum magnetization at 7 T, and remnant magnetization values at 300 and 5 K, based on Figure 9 for Sb2(1−x)Fe2xS3 (0.2 ≤ x ≤ 1).
SampleT (K)Hc (Oe)Mr (emu/g)Mmax (emu/g)
x = 0.252220.600.0280.35
300867.850.0140.147
x = 0.45575.040.0060.48
300352.040.0020.26
x = 0.65852.400.0160.89
300376.640.00590.65
x = 0.851327.640.0341.24
300396.410.00630.95
x = 153110.580.223.12
3002374.440.122.24
Publisher’s Note: MDPI stays neutral with regard to jurisdictional claims in published maps and institutional affiliations.

