
Barium Titanium Oxynitride from Ammonia-Free Nitridation of Reduced BaTiO3
by
 ,
,
Hua Guo
1 ,
,
Aleksander Jaworski
1,
Zheng Chen
2,
Can Lu
2,
Adam Slabon
1 and
Ulrich Häussermann
1,* 1
Department of Materials and Environmental Chemistry, Stockholm University, SE-10691 Stockholm, Sweden
2
Institute of Inorganic Chemistry, RWTH Aachen University, Landoltweg 1, DE-52074 Aachen, Germany
*
Author to whom correspondence should be addressed.
Inorganics 2021, 9(8), 62; https://0-doi-org.brum.beds.ac.uk/10.3390/inorganics9080062
Submission received: 28 June 2021
/
Revised: 29 July 2021
/
Accepted: 31 July 2021
/
Published: 5 August 2021
(This article belongs to the Section Inorganic Solid-State Chemistry)
Abstract
:We investigated the nitridation of reduced BaTiO3, BaTiO2.60H0.08, corresponding to an oxyhydride with a large concentration of O defects (>10%). The material is readily nitrided under flowing N2 gas at temperatures between 400 and 450 °C to yield oxynitrides BaTiO2.6Nx (x = 0.2−0.22) with a slightly tetragonally distorted perovskite structure, a ≈ 4.01 and c ≈ 4.02 Å, and Ti partially remaining in the oxidation state III. The tetragonal structure was confirmed from Raman spectroscopy. 14N MAS NMR spectroscopy shows a single resonance at 270 ppm, which is typical for perovskite transition metal oxynitrides. However, largely different signal intensity for materials with very similar N content suggests N/O/vacancy ordering when prolonging nitridation times to hours. Diffuse reflectance UV-VIS spectroscopy shows a reduction of the intrinsic band gap to 2.4–2.45 eV compared to BaTiO3 (~3.2 eV). Mott-Schottky measurements confirm n-type conductivity and reveal a slight negative shift of the conduction band edge from –0.59 V (BaTiO3) to ~–0.65 eV.
1. Introduction
In 2012 Kobayashi et al. reported that the simple perovskite BaTiO3 can be converted to BaTiO3-xHx (with H-contents up to x ≈ 0.6) at comparatively mild temperatures, around 600 °C, by hydride reduction [1]. The paramagnetic oxyhydride BaTiO3-xHx attains a cubic structure in which O2− and H− ions commonly—and as in a solid–solution—form the octahedral environment around Ti that is now in a mixed IV/III oxidation state. Shortly after, it was shown that due to the labile nature of the hydride species BaTiO3-xHx represents a versatile precursor toward new mixed-anion compounds [2]. This includes low temperature conversion to heavily nitridized BaTiO3 by either ammonolysis (nitridation under a stream of NH3) but, remarkably, also nitridation with inert elemental N2 [2,3]. Because of the ease of activation of N2, BaTiO3-xHx has been investigated as a potential catalyst for ammonia synthesis [4].
Nitridized BaTiO3 has been previously obtained from the ammonolysis of mixtures of BaO (BaCO3) and TiO2 at 950 °C, which produced BaTiO2.85N0.1 (0.57 wt% N) [5]. By applying an excess of BaO nitrogen contents may be increased to 0.8 wt% [6]. The low-temperature conversion from reduced BaTiO3 precursors will give even higher N contents (up to 2.3 wt% as in BaTiO2.4N0.4 [3]) and provide at the same time a broader range of compositions because of their variable O content, which can be—at least partially—controlled through the reaction conditions in the hydride reduction. Yet there have been only few investigations into the nitridation of reduced BaTiO3 and, in particular, little is known with respect to the properties of nitridized BaTiO3. According to Yajima et al. [3] and Masuda et al. [2] barium titanium oxynitride materials attain, depending on the N content, a cubic or a slightly distorted tetragonal simple perovskite structure. The tetragonal phases are non-centrosymmetric and ferroelectric. Temperature induced tetragonal-to-cubic transition occurs at around 120 °C, which is close to that of BaTiO3.
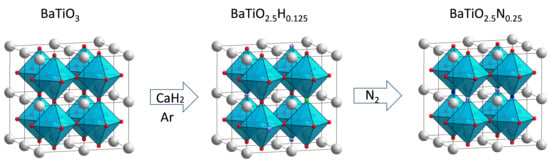
Here we re-examine the nitridation of reduced BaTiO3 with N2. We point out that reduced BaTiO3 range from oxyhydrides where O2− in the anion substructure is stoichiometrically replaced by H− (as in refs [1,2,3]) to materials with rather low contents of H and simultaneously large concentrations of O vacancies, BaTiO3-xHy◻(x-y). Hydride reduction of BaTiO3—involving the sintering of pelletized mixtures of BaTiO3 and metal hydride (e.g., CaH2) over prolonged periods of time—is not well understood, but it is most likely that O-deficient forms BaTiO3-x represent intermediates in the formation of oxyhydrides. Reactions conditions in hydride reductions can be varied by the choice and concentration/activity of metal hydride, reaction temperature, time and also the simultaneous presence of a (pressurized) H2 atmosphere [7,8,9,10]. Depending on conditions, highly O-deficient disordered cubic phases with x up to 0.6 and y in a range 0.04–0.25 may be obtained [10,11]. We show that such O-deficient variants show equally high reactivity toward oxynitride formation as originally investigated BaTiO3-xHx. The sequence of materials conversions is sketched in Figure 1.
2. Results and Discussion
2.1. BTON Synthesis and Characterization
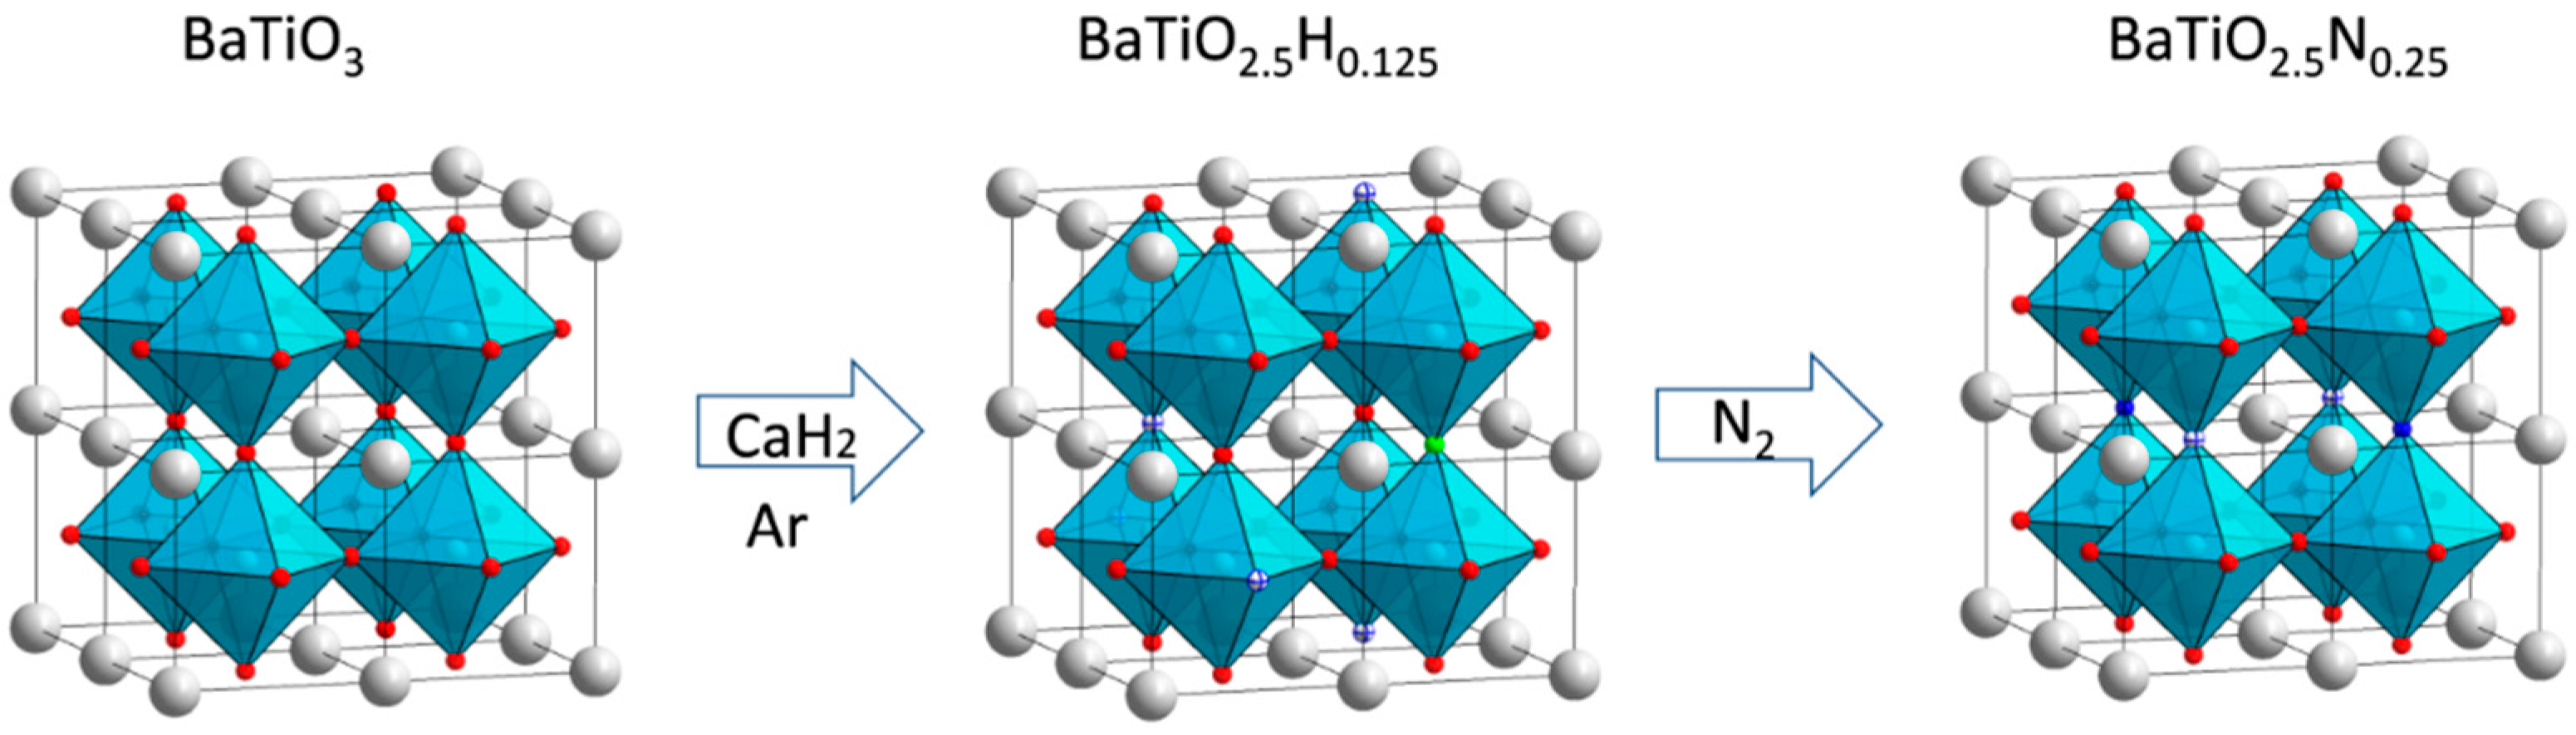
The starting material for nitridation was obtained from reacting BaTiO3 with CaH2 at 550 °C for 48 h and corresponded to BaTiO2.60H0.08◻0.32, in the following abbreviated as BTOH. BTOH was characterized by powder X-ray diffraction (PXRD), thermogravimetric (TG) analysis, and 1H Magic Angle Spinning (MAS) Nuclear Magnetic Resonance (NMR) spectroscopy. The TG curve is shown in Figure 2 whereas the PXRD and 1H-MAS NMR analyses are detailed as Supplementary Materials, Figures S1 and S2. The characterization results are summarized in Table 1. BTOH has a cubic lattice parameter of a = 4.022 Å resulting in a unit cell volume slightly higher than BaTiO3. From TG analysis the H content and/or O defect concentration of reduced BaTiO3 can be assessed [1,11,12]. An experiment under flowing air monitors the reactions BaTiO3-xHx + 0.75x O2 → BaTiO3 + 0.5x H2O (1) and BaTiO3-x + 0.5x O2 → BaTiO3 (2). Typically there is a small initial weight loss (between 0.1 and 0.15%) in the temperature range up to 300 °C which stems from the loss of surface hydroxyl and secondary water [13,14]. The onset of oxidation is seen at around 400 °C. Oxidation appears to be completed above 650 °C and leads to a weight increase of 2.79%. The associated x values according to Equations (1) and (2) are contained in Table 1. 1H-MAS-NMR then revealed a rather small H content in BTOH, x ≈ 0.08, and accordingly BTOH possesses a high concentration of O defects.
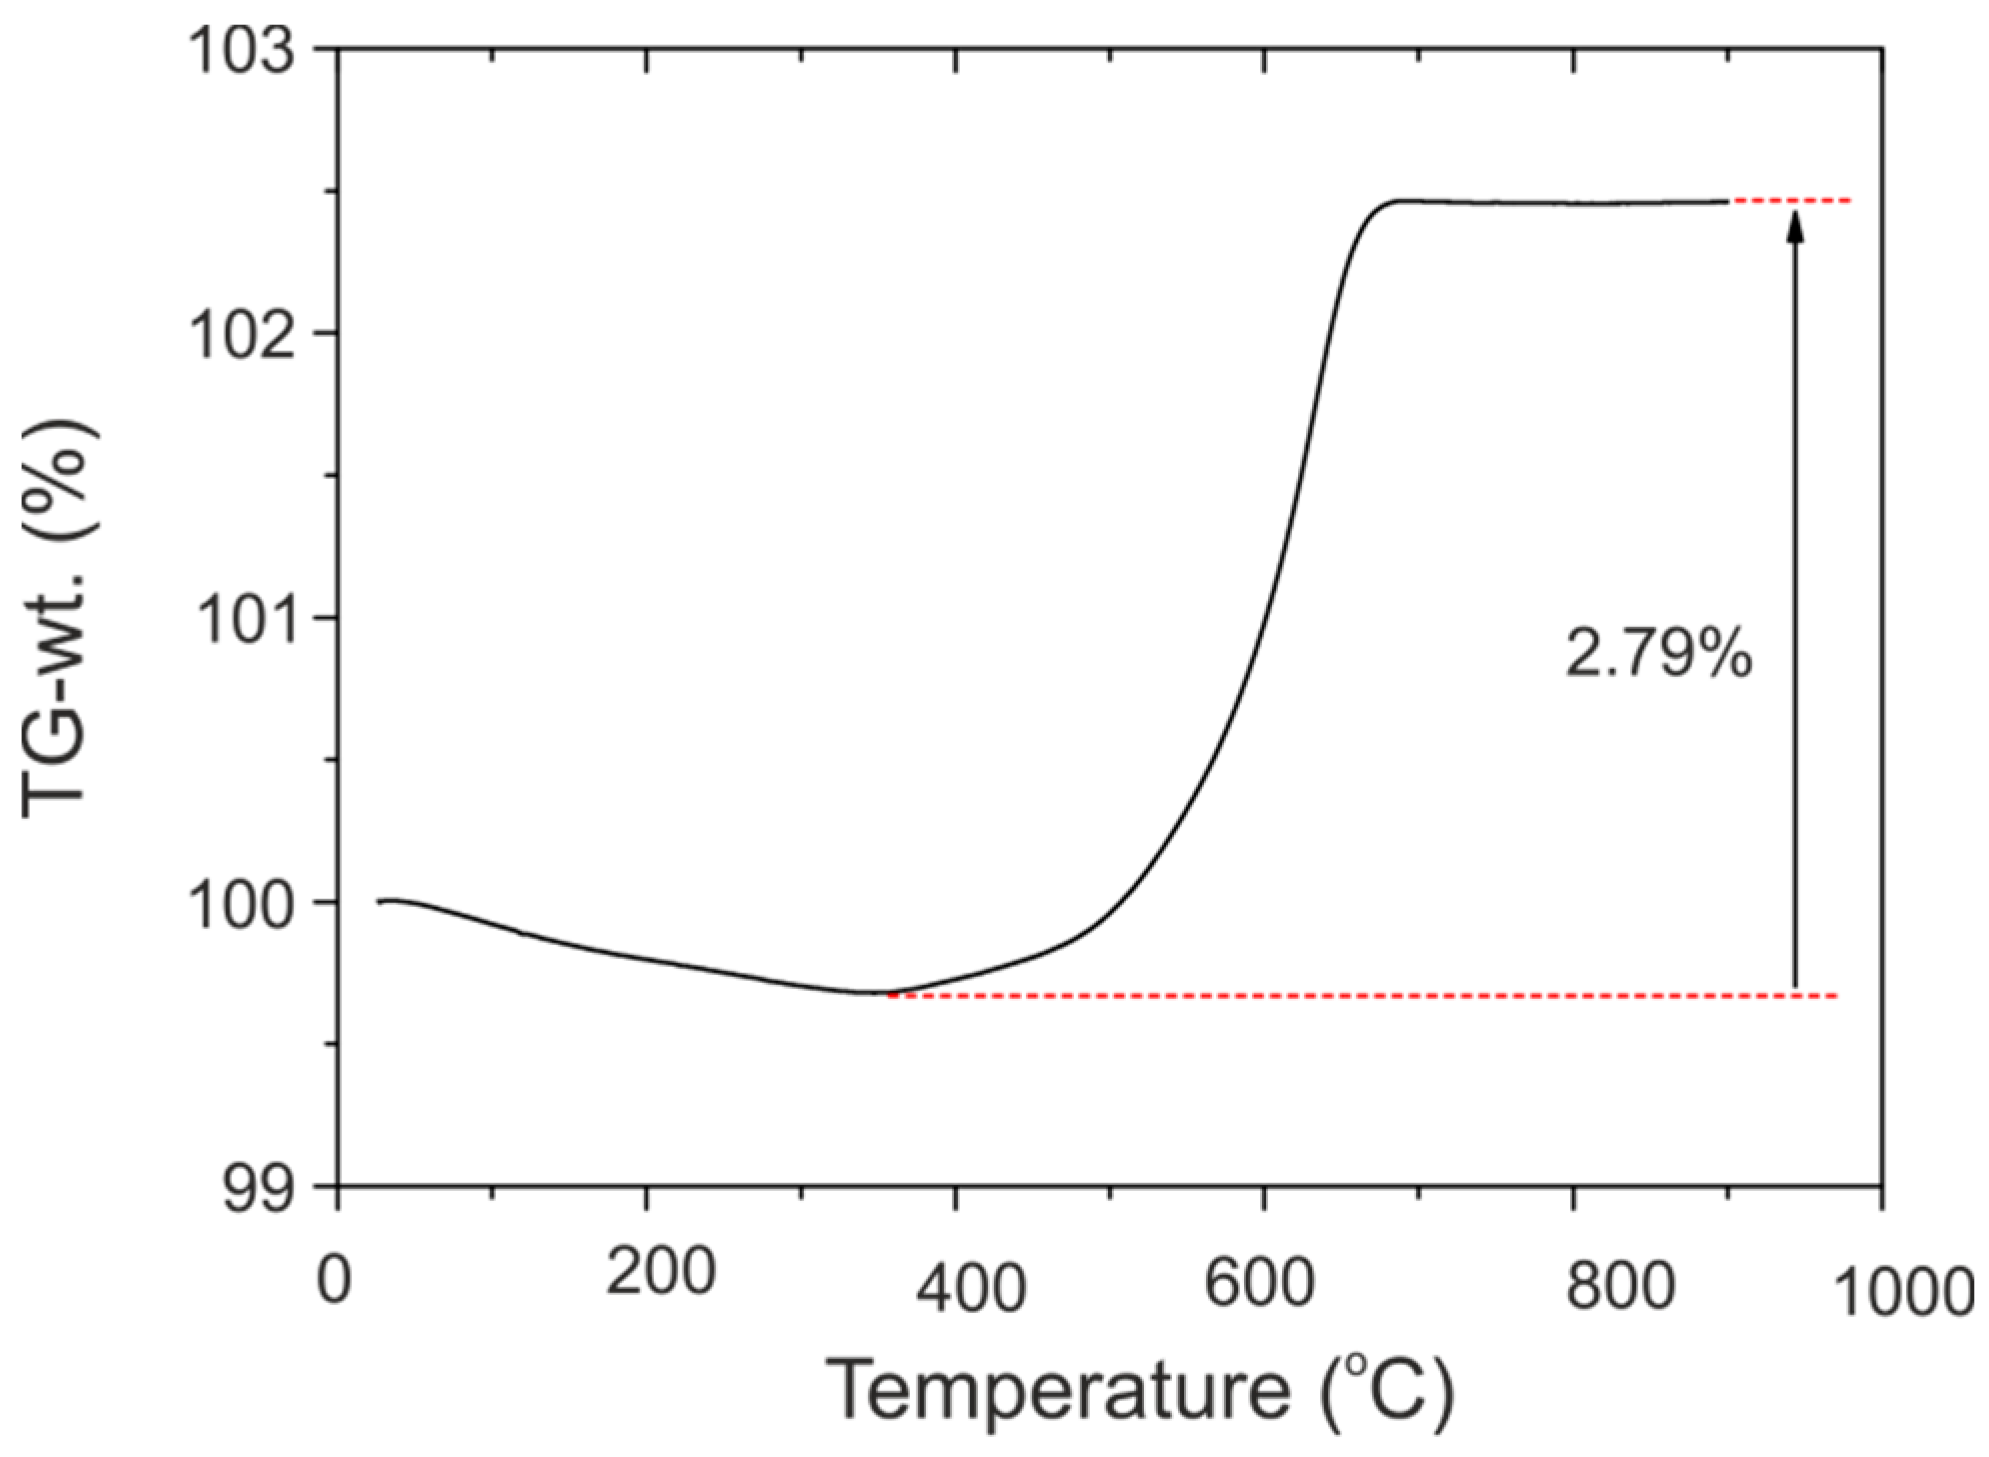
Figure 3 shows combined TG and differential scanning calorimetry (DSC) traces of BTOH when heated in a stream of N2 to 500 °C (a) and 600 °C (b) at a rate of 10 °C/min. The exothermic event at around 435 °C, concomitant with a weight increase of 0.99% and 1.38% respectively, is attributed to the formation of a nitridated phase, in the following abbreviated as BTON. The onset of nitridation occurs at a similar temperature as oxidation, perhaps relating to the activation of labile H−, but appears to be a sudden process compared to more gradual oxidation. Figure 3c compares TG traces of BTOH when heating for a prolonged period of time after reaching the target temperatures 500 and 600 °C, respectively. There was no further weight increase with time in the 600 °C experiment, which implies that the nitridation reaction had already been completed when reaching this temperature. In the 500 °C experiment, continued weight increase was seen for about additionally 15 min. At the same time the TG trace plateaued at a lower weight gain level, which suggests that the 600 °C experiment resulted in a product with a slightly higher N content (by 15%). The N content corresponding to the TG weight increase is x = 0.19 and 0.22 for the 500 and 600 °C experiment, respectively. The N content was also determined by chemical analysis for samples obtained at 600 °C without annealing (BTON-600C-0 h) and after 6 h prolonged nitridation (BTON-600C-6 h) and found to be in good agreement with the TG results. The characterization results for BTON samples are summarized in Table 2 and as Supplementary Materials. It is important to emphasize that nitridation experiments require strictly air-free conditions, otherwise (partial) oxidation will occur. In air BTON samples are stable up to about 400–500 °C.
The composition of nitridized BaTiO3 can be expressed as BaTiO3-xN2x/3. Accordingly, the inherent O defect concentration is x/3 [3]. The upper limit for x for reduced BaTiO3 appears to be x ≈ 0.6 [1]. Thus the composition BaTiO2.4N0.4, as reported by Yajima et al. [3], should represent the highest achievable N content for Ba oxynitrides. With our BTOH starting material, the composition after nitridation was expected to be BaTiO2.6N0.267. This N content is clearly not achieved, which implies that Ti partially remains as Ti3+ (about 5%). Thus, our BTON materials should be paramagnetic and possibly metallic. To accommodate for this situation, the formula for nitridized BaTiO3 is rewritten as BaTiO3-xN(2x/3)-y◻(x/3)+y where y = 0 refers to the stoichiometric, diamagnetic case. The application of higher nitridation temperatures and/or changed heating rates did not result in fully nitridized BTON samples (cf. Supplementary Materials, Figure S3).
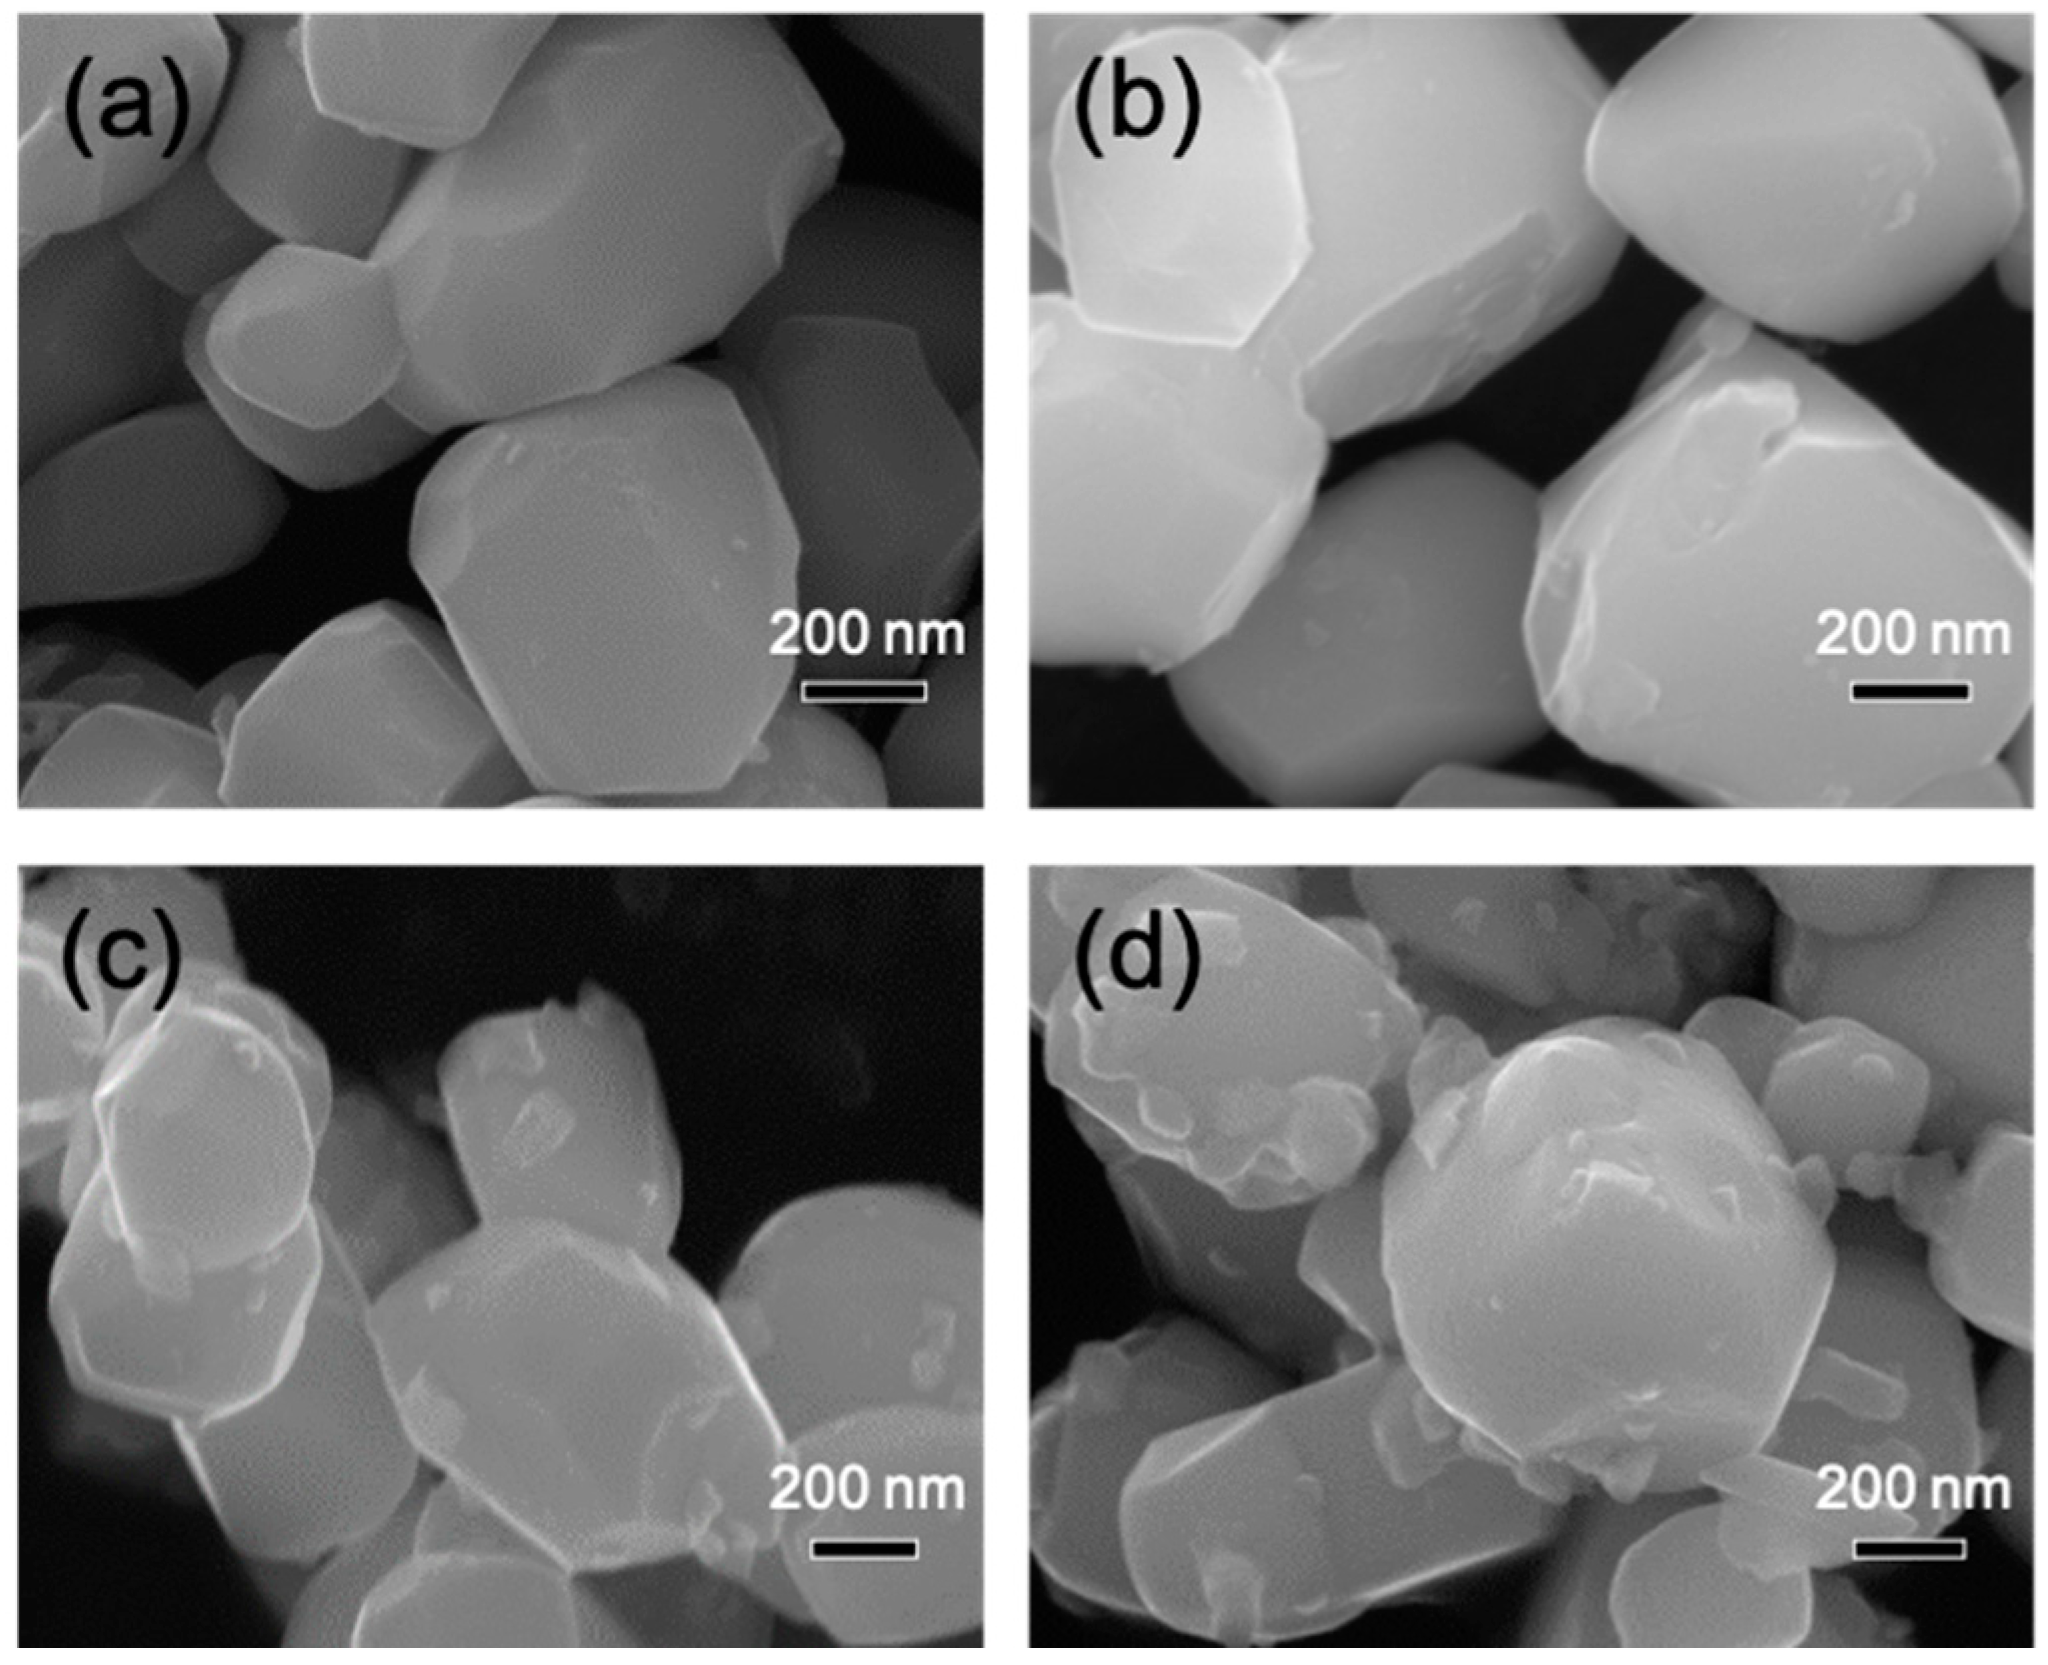
Figure 4 shows scanning electron microscopy (SEM) images of the materials constituting the sequence of conversions (cf. Figure 1). The average particle size of tetragonal BaTiO3 used for hydride reduction was specified by the manufacturer as 0.5 micron. This is confirmed in Figure 4a, although some particle size distribution is noticeable. The particle morphology of BaTiO3 is retained in BTOH (Figure 4b). However, upon nitridation the surface topography of particles becomes noticeable changed (Figure 4c,d). The step-like features suggest recrystallization, involving ion transport during the solid–gas reaction. Thus the nitridation process of reduced BaTiO3 may not be truly topochemical.
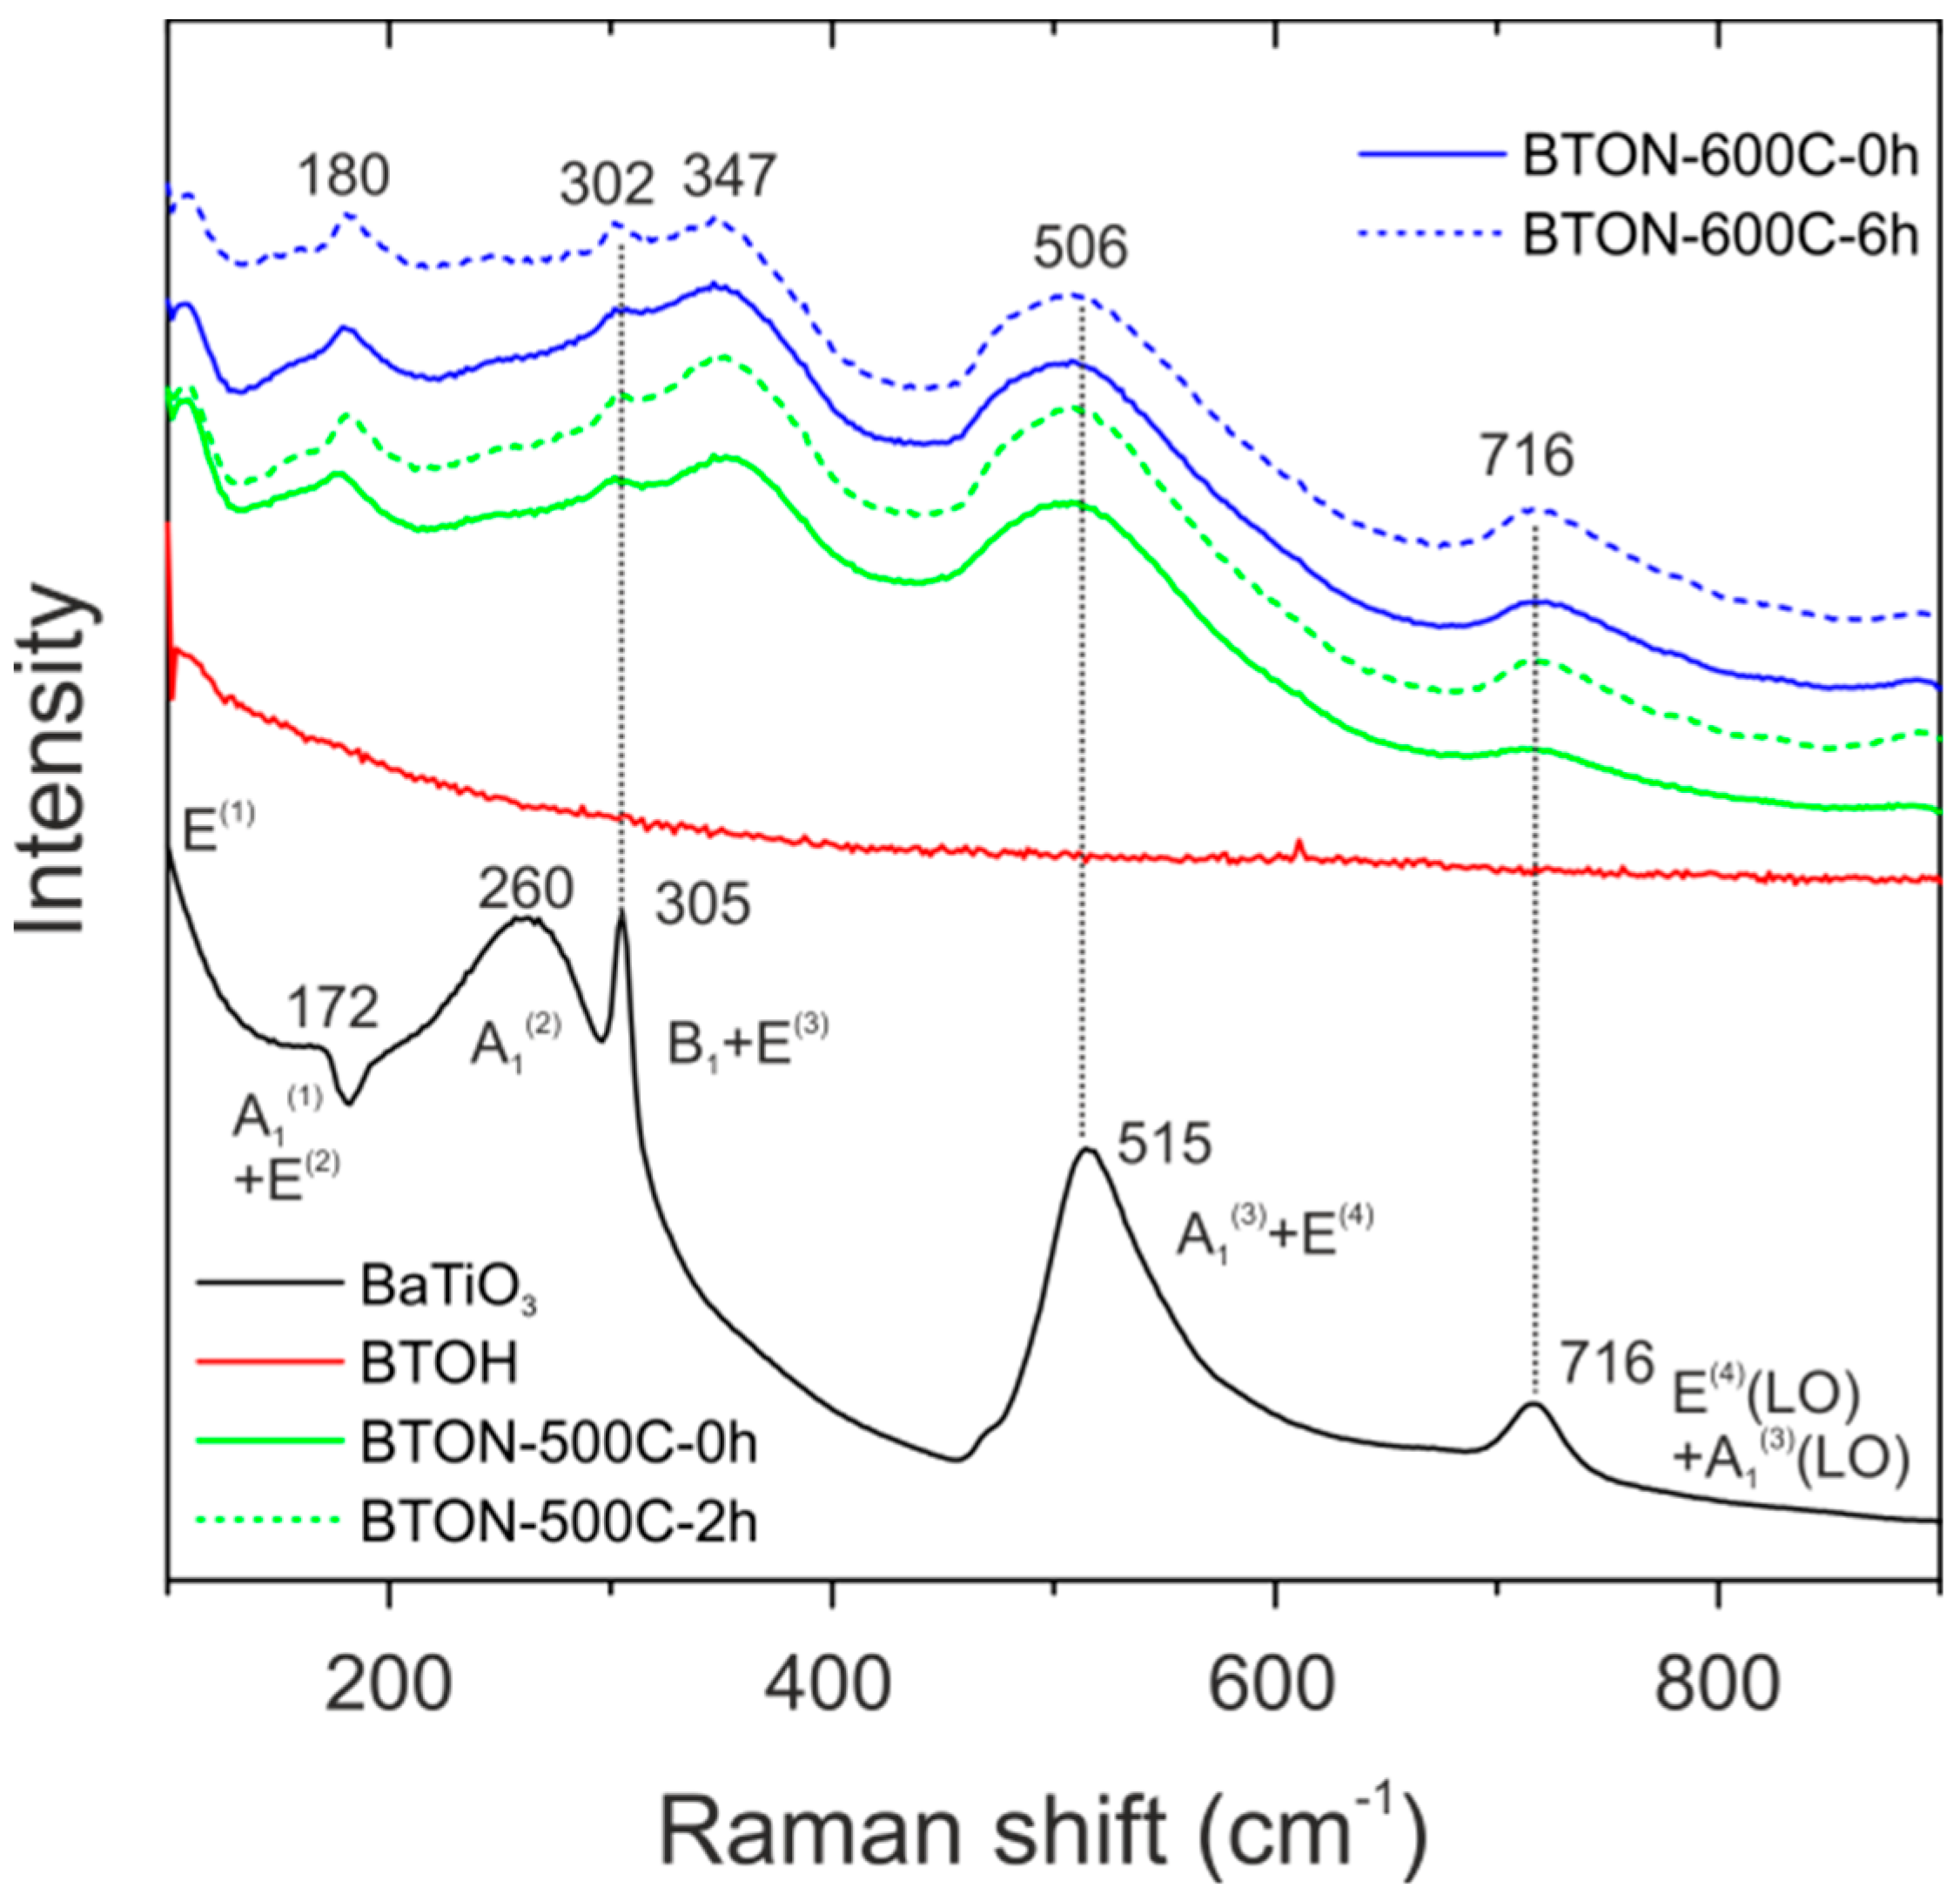
Figure 5a depicts the changes of PXRD patterns and sample colors when going from BaTiO3 to BTOH to BTON. Detailed results of Rietveld refinements are presented as Supplementary Materials (Figures S4–S13, Tables S1 and S2). The tetragonal structure of BaTiO3 is clearly noticeable in the laboratory PXRD pattern, a = 3.996, c = 4.031 Å (c/a = 1.009), whereas the patterns for BTOH and BTON appear cubic, with the unit cell volume of BTON slightly smaller. Compared to BTOH one could infer a slight broadening of the reflections (200), (201), (211) (in the 2θ range 20–40°), which most clearly would show the tetragonal split. However, the refinement of laboratory data does not allow for discrimination between cubic and tetragonal phase (c/a < 1.003), Figure 5b. The tetragonal structure of BTON is then clearly revealed from Raman spectroscopy, as shown in Figure 6. Thus, we chose to present the result of the tetragonal refinement (c/a ≈ 1.002(2)) in Table 2, whereas the result of the cubic refinements is given in Table S2.
The Raman spectrum of tetragonal BaTiO3 is well understood [15,16,17]. All twelve optical modes 3×A1 + B1 + 4×E are Raman active. Poly/nanocrystalline samples are characterized by sharp bands at about 170 and 305 cm−1 and asymmetric broader bands at about 260, 515, and 720 cm−1 [18,19]. Furthermore, a pronounced dip at around 180 cm−1 is also characteristic, which has been attributed to interference from anharmonic coupling between three A1 modes [15]. Lastly, the E1 softmode (x,y displacement of Ti) expresses itself with a sharp rise of Raman scattering intensity at lowest wavenumbers [19]. The BTOH spectrum is featureless, in agreement with a cubic perovskite structure where all modes are Raman inactive. The Raman spectra of the BTON samples show broad bands at 347, 506 and 716 cm−1 and sharp bands at 100, 180 and 302 cm−1. The latter (assigned to the non-polar B1 mode) is characteristic for a tetragonal phase [20,21]. The same holds true for the band at 720 cm−1 which would be extremely broad and week in the cubic para-electric phase [20]. Because of the considerably lower tetragonality of the BTON phases compared to BaTiO3, bands are generally broader and weaker. However, there are two clear major differences. The softmode in BaTiO3 appears stiffened and the corresponding band is at around 100 cm−1 in the spectra of the BTON phases. Further, the band at around 260 cm−1 in BaTiO3 (A1(2)) is not apparent in BTON and instead a band at 347 cm−1 is visible. The A1(2) mode is the mutual displacement of Ba atoms and the TiO6/2 octahedron framework in the z direction [19]. It is not clear why this mode has either a very low intensity for BTON or is possibly blue-shifted by almost 90 cm−1.
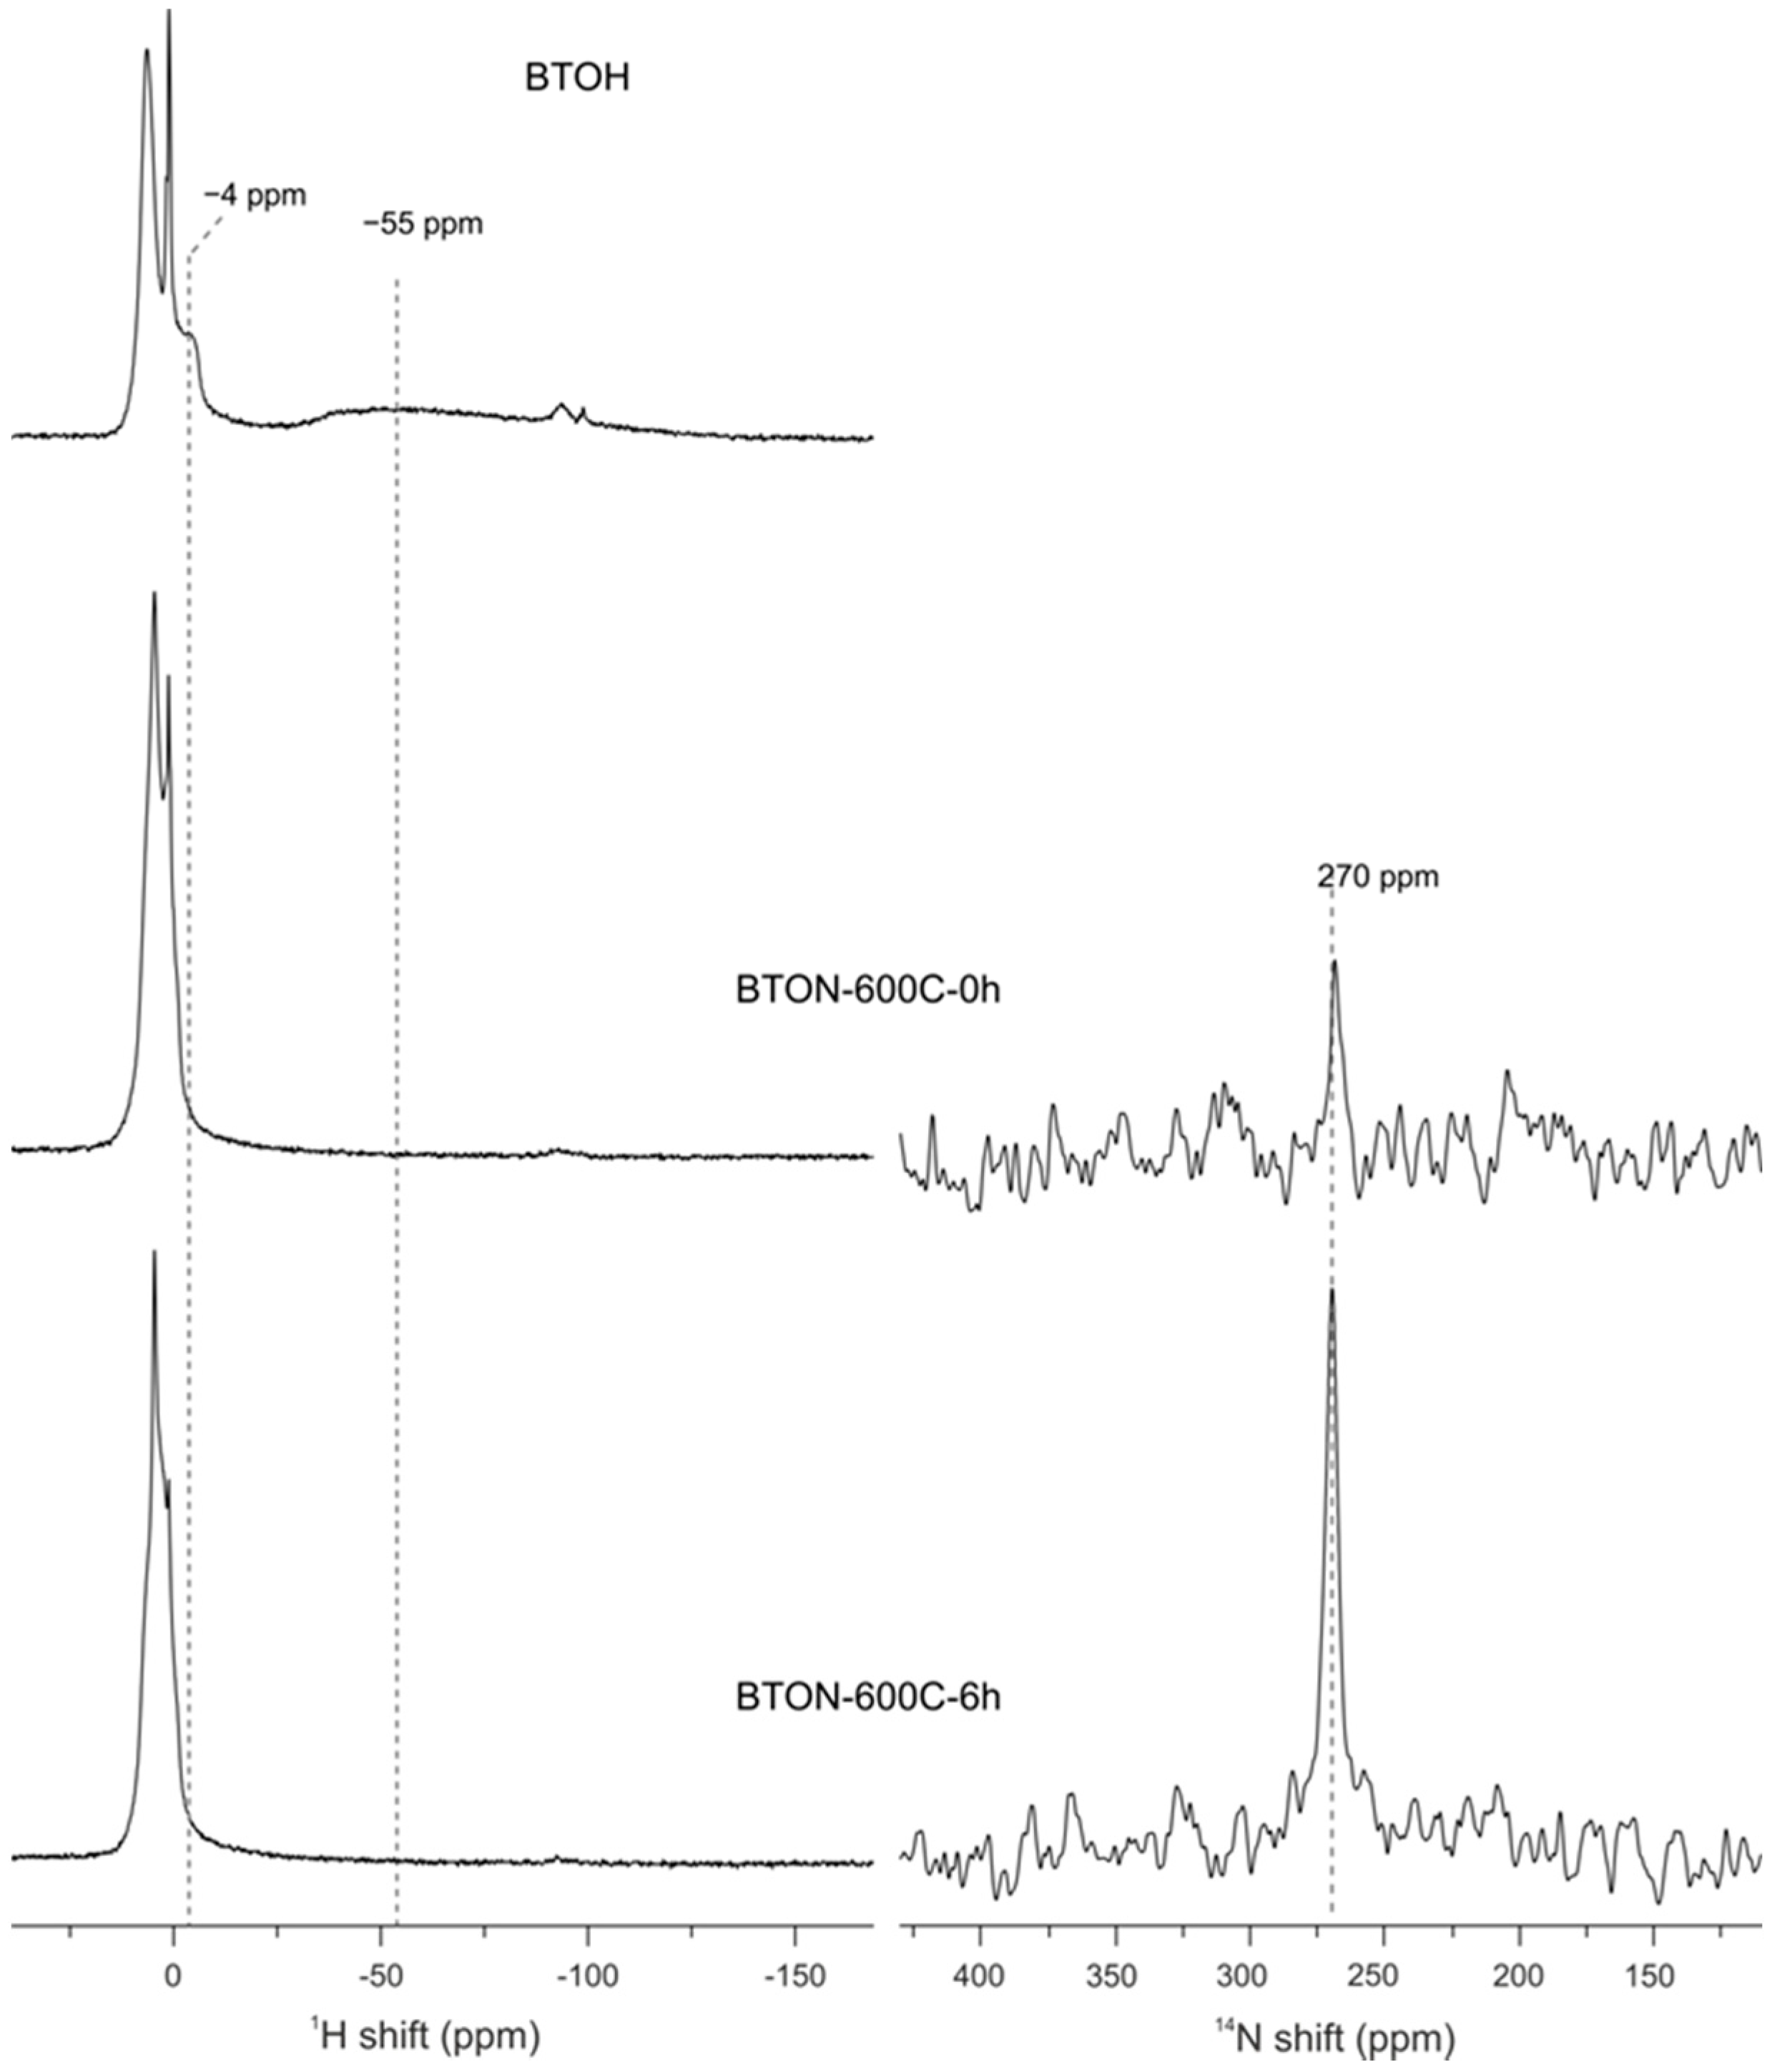
The Raman spectra of the four different BTON samples are very much alike (possibly that the B1 peak at ~302 cm−1 is somewhat sharper for the annealed samples, especially for BTON-600C-6 h). This is in contrast with 14N-MAS-NMR spectra, shown in Figure 7. The nuclear quadrupole moment of the 14N isotope implies drastic broadening of the resonance lines unless N is in a highly symmetric environment for which the quadrupolar coupling constant is relatively small. This is the case for perovskite oxynitrides and 14N-MAS-NMR has been used previously to probe N [5,22,23,24]. Somewhat surprising and still not explained, 14N expresses as a single resonance at 270 ppm, regardless the kind of transition metal (Ti, Nb, Ta) or A component (Ca, Sr, Ba, La, Ce) in the perovskite oxynitride [25]. In our spectra the 270 ppm resonance is clearly there, but the signal intensity is considerably less for BTON-600-0 h compared to BTON-600C-6 h although the two materials possess virtually the same N content. We speculate that quadrupolar coupling is rather large for BTON-600C-0 h and that prolonged nitridation at 600 °C resulted in a more ordered N/O/vacancy structure for BTON-600C-6 h (cf. Figure 1c). 1H-MAS-NMR spectra show clearly the absence of hydridic H in BTON-600-0h and BTON-600-6h. As earlier shown, hydridic H as part of the bulk structure can be discriminated from protic H (from (surface) hydroxyl and secondary water) as negative and positive chemical shift contributions, respectively [11,12]. Hydric H expresses itself as a single broad resonance peak at negative chemical shift whereas protic resonances appear at ~1 ppm (surface OH species) and in the region 6–7 ppm (secondary water). Interestingly one can recognize two H− environments for BTOH, one centered at −4 ppm and one at −55 pm. The occurrence of two hydridic environments in reduced BaTiO3 is highly unusual and perhaps relates to the large O defect concentration of BTOH (see Supplementary Materials for more details). Although the phenomenon is interesting and deserves more detailed investigations, it is not considered important for the outcome of the nitridation reactions.
2.2. Spectroscopic and Mott-Schottky Analysis
It is well known that BaTiO3 is a wide gap semiconductor with a band gap energy of 3.2–3.4 eV [26,27]. According to first principles calculations, the band gap is indirect for the tetragonal form and direct for the cubic (high temperature) polymorph [28]. However, experimentally it appears to be difficult to assign the nature of the band gap and frequently a direct band gap is also assumed for the tetragonal form. Mixed anion oxynitrides show reduced band gaps, by ca 1 eV, since the top of the valence band constitutes N-2p based states, which are at higher energy than O-2p [29]. Perovskite oxynitrides involving Ti are typically based on lanthanoid metals as the perovskite A component and ATiO2N (A = La, Nd, Ce, Pr, Eu) have been extensively investigated because of their photocatalytic activity and dielectric properties [30,31,32]. As outlined above, when A corresponds to an alkaline earth metal, the reduced valence has to be compensated with defects in the anion substructure, i.e., BaTiO3-xN(2x/3)-y◻(x/3)+y where y = 0 refers to the fully nitridized, diamagnetic case. For these materials properties are not well investigated.
Figure 8 compares the UV-VIS diffuse reflectance spectra of the BTON-500C and BTON-600C samples with BTOH and pristine BaTiO3. As earlier reported, reduced BaTiO3 materials exhibit a broad absorption in the visible and near-IR region (Figure 8a) [12]. The actual absorption edge, corresponding to interband transitions, is around 400 nm, which corresponds well to the band gap energy of BaTiO3. The near IR-VIS absorption enters a minimum upon approaching the upturn of the absorption edge, which is typical of (intraband) free carrier absorption in heavily doped semiconductors [33]. In metallic BTOH states at the bottom of the conduction band are occupied. The absorption edge of BTON is significantly red-shifted. In addition, the exponential onset of absorption indicates that charge carriers are localized in traps below the conduction band [34]. So in contrast with reduced BaTiO3 where electrons form delocalized band states [35], they appear localized in polarons in not fully nitridized BTON.
Figure 8b shows the Kubelka–Munk (K–M) transformed spectra, which—for comparability across the samples—was normalized. The K–M transformed spectrum of metallic BTOH is different from the BTON materials because of the free carrier absorption. Its absorption edge is slightly (by 0.1 eV) shifted upwards compared to BaTiO3, which is in line with earlier observations [12]. The absorption edge of BTON is in a range 500–550 nm. Tauc plots (presented as Supplementary Materials, Figure S14) suggest band gaps in a range 2.4–2.5 eV as summarized in Table 3, which agrees with the green-yellow color of the material.
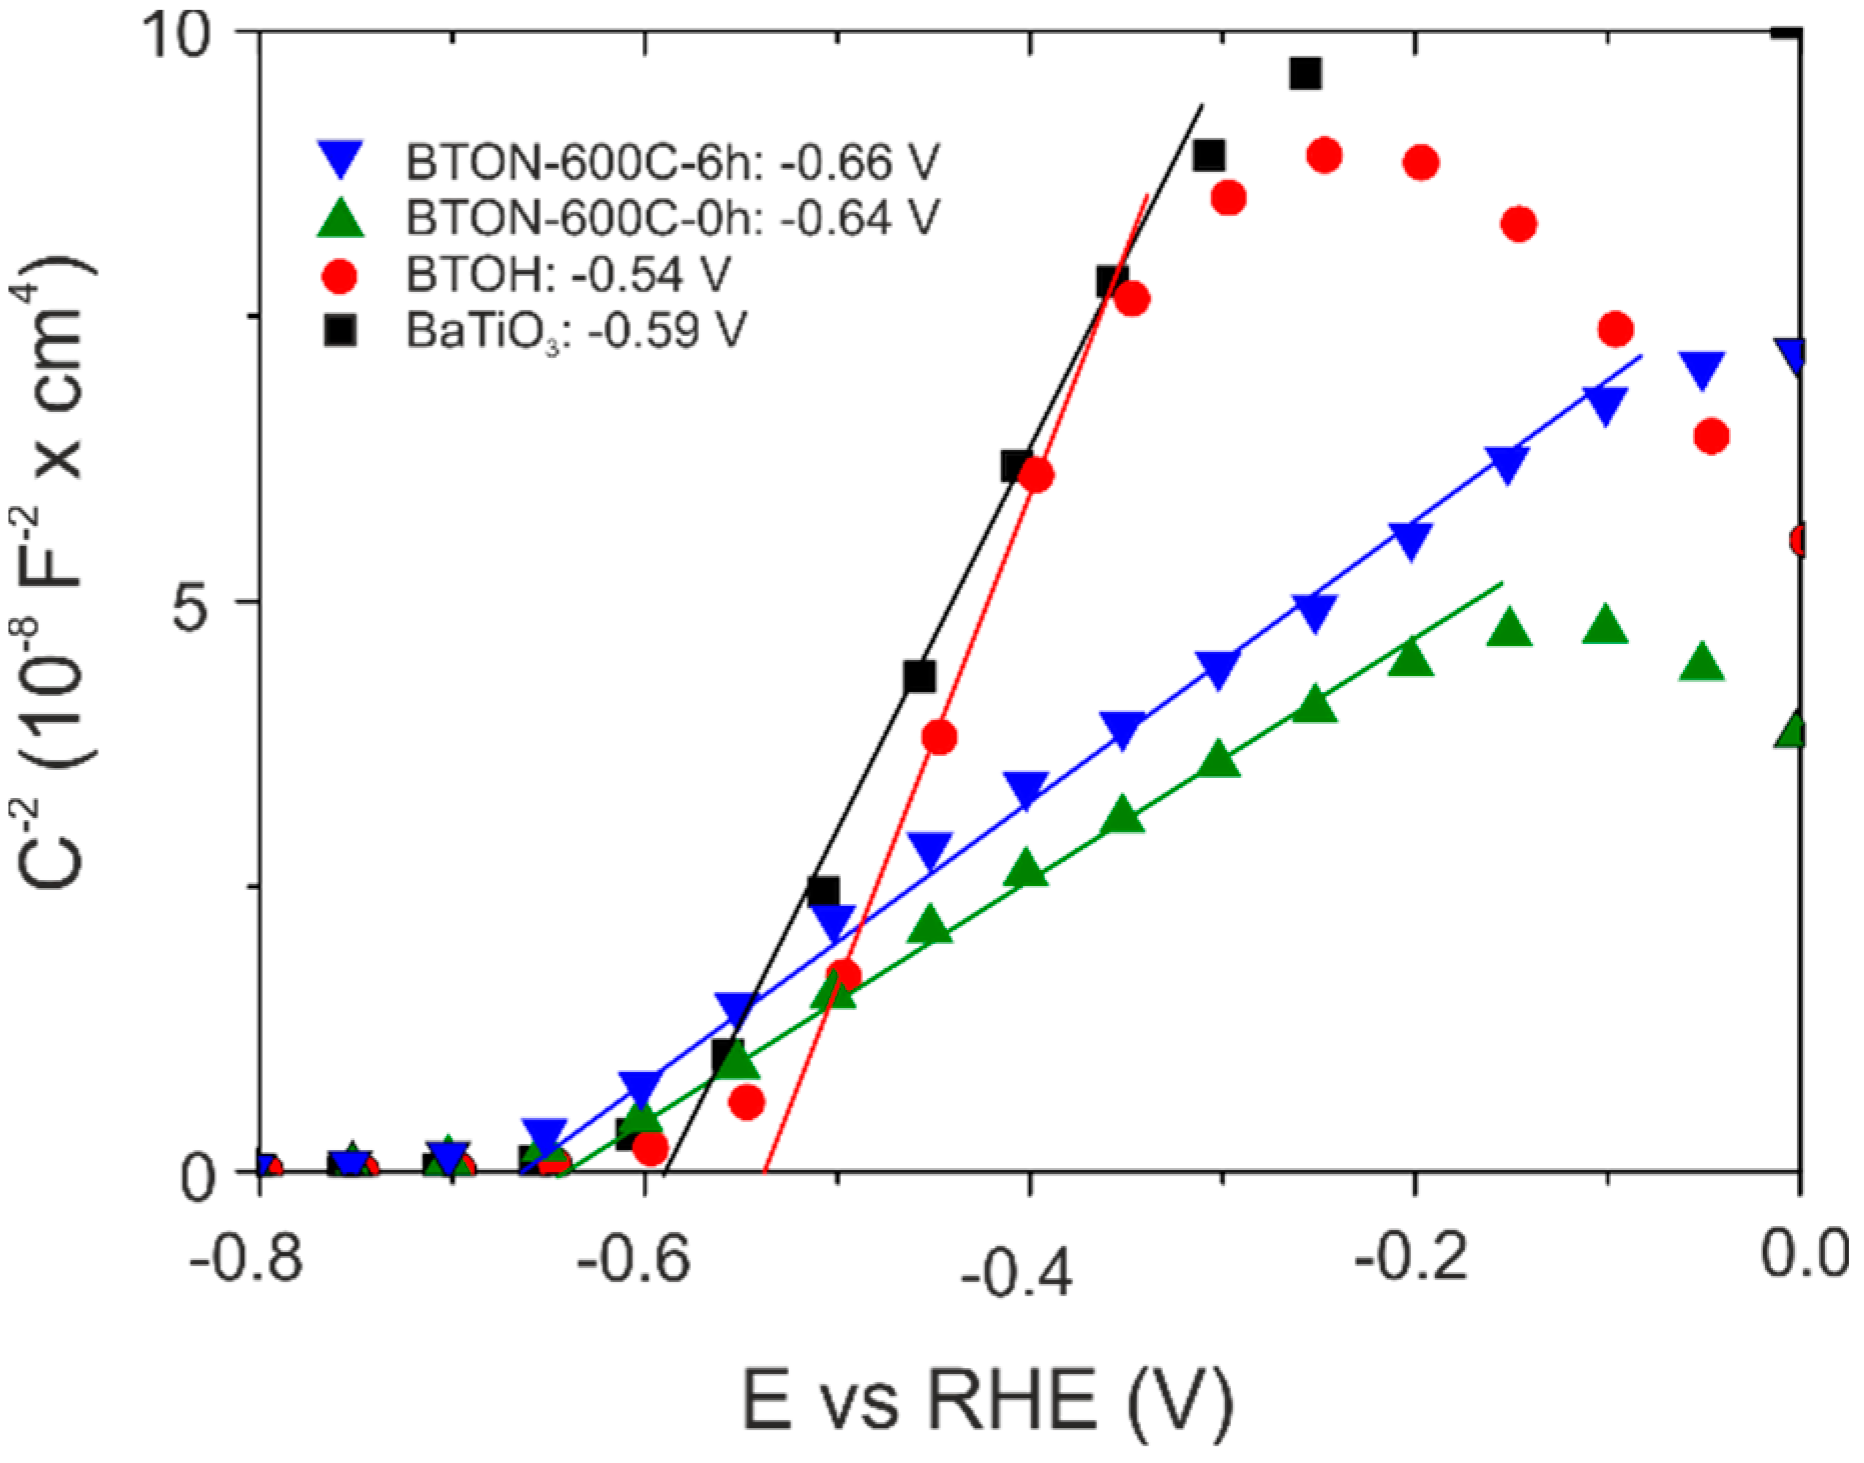
Mott–Schottky measurements were carried out for BTON-600-0 h and BTON-600-6 h as well as the BTOH precursor and the results compared with pristine BaTiO3 (Figure 9). All materials show a positive slope, confirming the semiconducting n-type behavior. The flat band potential of BaTiO3 is −0.59 V vs. Reversible Hydrogen Electrode (RHE). In case of a n-type semiconductor, the flat band potential is close to the bottom of the conduction band [36]. BTOH exhibits a flat band potential at −0.54 V vs. RHE. A slight positive shift of the flat potential, which may reach up to −0.36 V compared to the pristine BaTiO3, has also been observed for other reduced materials BaTiO3-xHy◻(x-y) with different x,y [12]. In contrast, BTON displays a negative shift −0.65 V, without any significant difference between the differently annealed samples (cf. Table 3). The slopes of BaTiO3 and BTOH are very similar, although the charge carrier density of the latter is considerably higher. Since the slope is also depending on the dielectric constant, this was explained with a much smaller dielectric constant of cubic BTOH [12]. The dielectric constant of tetragonal BTON will relate more to that of tetragonal BaTiO3 and, thus, the smaller slope compared to BaTiO3 reflects its higher charge carrier density.
3. Materials and Methods
3.1. Synthesis of the Materials
As starting materials we used BaTiO3 (500 nm particle size, 99.9% purity, ABCR GmbH, Karlsruhe, Germany) and CaH2 powder (95%, Sigma Aldrich, Darmstadt, Germany). Prior to use, BaTiO3 was dried overnight in an oven at 200 °C. All steps of sample preparation were performed in an Ar filled glove box. For a typical synthesis ~0.25 g (1.05 mmol) of BaTiO3 was intimately mixed with 0.053 g (2.36 mmol) CaH2, i.e., the BaTiO3:H ratio was about 4.5. The BaTiO3/CaH2 mixture was subsequently pressed into a pellet with a diameter of 9 mm. The pellet was then sealed inside a stainless steel ampule (with dimensions 10 mm ID and 50 mm length), which—after removal from the glove box—was placed in a box furnace. A K-type thermocouple was inserted and located in close proximity to the metal ampule. Ampules were heated for 48 h at 550 °C. After cooling to room temperature, ampules were opened and the products washed with 0.1 M acetic acid (HAc) solution to remove excess CaH2 and metal oxide/hydroxide formed during hydride reduction. For washing, the pellets were crushed and sonicated with 50 mL HAc and then centrifuged. The procedure was repeated 3 times. As a last step, products were treated with 20 mL 95% ethanol and then dried at 120 °C under dynamic vacuum (<10−5 bar). The dried product corresponded to dark blue powder. Portions of about 20 mg of the so obtained oxyhydride material were then heated in a 100 mL/min nitrogen stream (99.9999% (6N) purity) at a rate of 10 °C/min to various temperatures using a Netzsch® STA 449 F1 Jupiter thermal analysis apparatus (Netzsch, Selb, Germany). The reactions were protected by an oxygen getter to avoid oxidation of oxyhydride materials. The color or the products after nitridation was changed to yellow-green (cf. Figure 5a).
3.2. Powder X-ray Diffraction (PXRD) Analysis
PXRD patterns were collected on a Panalytical X’Pert PRO diffractometer (Malvern Panalytical, Malvern, UK) operated with Cu Kα radiation and in θ–2θ diffraction geometry. Powder samples were mounted on a Si wafer zero-background holder and diffraction patterns measured in a 2θ range of 20–120° with 0.016° step size. The contribution of Kα2 radiation to the PXRD patterns was removed using the Panalytical X’Pert HighScore Plus software (Malvern Panalytical, Malvern, UK). The Rietveld method as implemented in the FullProf program was used for structure and phase analysis [37]. A six-coefficient polynomial function was applied for the background. The peak shape was described by a Pseudo-Voigt function. Site occupancies for the O atoms could not be refined reliably and were constrained to 1.
3.3. Scanning Electron Microscopy (SEM) Investigations
SEM investigations were carried out using a JEOL JSM-7000F microscope (Jeol, Tokyo, Japan) equipped with a Schottky-type field emission gun (Oxford Instruments, Oxfordshire, UK). Images were recorded in second-electron mode with an accelerating voltage of 15 kV. Samples were prepared by first producing a homogeneous suspension of particles in ethanol by sonication. Then droplets of the suspension were applied onto surface-polished Aluminum pin stubs and left to dry.
3.4. Raman Spectroscopy
Raman spectra were measured using a Labram HR 800 spectrometer (Horiba, Kyoto, Japan) equipped with an 800 mm focal length spectrograph and an air cooled, back thinned CCD detector. Powdered sample was placed on a glass slide and excited with a double frequency Nd:YAG laser (532 nm). To avoid decomposition/oxidation the lowest possible laser power (ND filter 1%, corresponding to a power density of 5.5 × 10⁻⁶ mW∙μm−2) was applied for the oxyhydride and oxynitride samples. Spectra were collected at room temperature in a range 0–1800 cm−1 and using a grating of 600 lines/mm. For oxynitride samples large exposure times (of up to 25 min) were employed.
3.5. Thermogravimetric Analysis (TGA)
TGA experiments were carried out using a TA instruments Discovery system (TA Instruments, New Castle, DE, USA). The samples (~15 mg powders) were heated in a platinum crucible from room temperature to 900 °C with a heating rate of 10 °C/min. A dry air gas flow of 20 mL/min was applied.
3.6. Chemical Analysis
Elemental analysis of N was performed by Mikroanalytisches Labor Kolbe (www.mikro-lab.de, accessed on 12 April 2021) using a CHN-(combustion) analyzer from Elementar (model “vario MICRO cube”, Elementar Analysensysteme GmbH, Langenselbold, Germany).
3.7. UV-VIS Diffuse Reflectance Spectroscopy
UV-VIS diffuse reflectance measurements were performed at room temperature on finely ground samples. Spectra were recorded in the range from 200 to 800 nm with an Agilent Cary 5000 UV-VIS-NIR spectrometer (Agilent, Santa Clara, CA, USA) equipped with a diffuse reflectance accessory from Harrick (Harrick Scientific Products Inc, New York, NY, USA). A polytetrafluoroethylene (PTFE) pellet (100% reflectance) was used as the reference.
3.8. Magic Angle Spinning (MAS) NMR Spectroscopy
The 1H and 14N MAS NMR experiments were performed at a magnetic field of 14.1 T (600.1 and 43.4 MHz Larmor frequencies for 1H and 14N, respectively) and MAS frequency of 60.00 kHz on a Bruker Avance-III spectrometer (Bruker, Billerica, MA, USA) equipped with a 1.3 mm MAS HX probe. Proton spectra were acquired using a rotor-synchronized, double-adiabatic spin-echo sequence with a 90° excitation pulse of 1.1 μs followed by a pair of 50 μs tanh/tan short high-power adiabatic pulses (SHAPs) with 5 MHz frequency sweep [38,39]. All pulses were applied at a nutation frequency of 210 kHz. In total, 256 signal transients with a 5 s recycle delay were accumulated for each sample. The 14N MAS spectra were collected using a Hahn-echo sequence with 3.0/6.0 μs 90°/180° rf pulses and 131,072 scans collected per sample using a 1 s relaxation delay. 1H shifts were referenced with respect to tetramethylsilane (TMS) at 0 ppm, whereas 14N shifts to solid NH4Cl at 0 ppm (−342.4 ppm with respect to nitromethane).
3.9. Mott–Schottky Measurements
Powder samples were assembled into particle-base thin film electrodes on fluorine-doped tin oxide (FTO) glass substrate via electrophoretic deposition. The homogeneous suspension was prepared by mixing 30 mg powder samples and 10 mg iodine in 30 mL of acetone via sonication. Two pre-cleaned FTO slides were immersed in the above suspension with 1 cm distance, and a DC potential of 30 V was applied between them for 3 min. After Electrophoretic Deposition (EPD) process, the FTO slides with thin film were washed with water and dried naturally. 0.1 M NaOH (pH 13), in which oxyhydrides are stable, was used as electrolyte to perform Mott–Schottky measurements. The measurements were conducted in the conventional three-electrode system where a platinum wire, a 1 M Ag/AgCl electrode and the thin film on FTO were used as counter electrode, reference electrode and working electrode, respectively. The potentials were recorded versus 1 M Ag/AgCl and converted versus reversible hydrogen electrode (RHE) according to ERHE (V) = EAg/AgCl + (0.059 × pH) + EθAg/AgCl. The measurements were carried out by using the Gamry INTERFACE 1010T Potentiostat/Galvanostat/ZRA workstation (Gamry Instruments, Warminster, PA, USA) in darkness at ac amplitude of 5 mV and a frequency of 10 Hz.
4. Conclusions
It was shown that reduced BaTiO3 containing simultaneously hydride and defects in the anion substructure, BaTiO3-xHy◻(x-y), can be readily nitrided with elemental N2 at temperatures around 450 °C to yield tetragonal phases BaTiO3-xN(2x/3)-y◻(x/3)+y with c/a ≈ 1.002. In contrast with the nitridation of vacancy free oxyhydride BaTiO3-xHx, oxynitrides from BaTiO3-xHy◻(x-y) appear not fully nitrided and titanium remains partially as Ti3+, i.e., y ≠ 0. Electrons are localized in traps below the conduction band. The band gap energy of BaTiO3-xN(2x/3)-y◻(x/3)+y materials is in a range 2.4–2.5 eV. Since the conduction band edge lies above the reduction potential for water and optical absorption is in the visible light region, it will be interesting to investigate photocatalytic properties.
Supplementary Materials
The following are available online at https://0-www-mdpi-com.brum.beds.ac.uk/article/10.3390/inorganics9080062/s1, Figure S1: Rietveld fit to the PXRD data of the oxyhydride starting material BaTiO2.60H0.08◻0.32 (BTOH), Figure S2: 1H MAS NMR spectrum of BTOH showing the division into protic and hydridic signal intensity and explaining the quantification of hydridic H content, Figure S3: Simultaneously measured TG and DSC traces for BTOH upon heating under a dry N2 stream up to 700 °C with a heating rate 10 °C/min and to 600 °C with a heating rate 5 °C/min, Figure S4–S13: Rietveld fits to PXRD data of BTON samples, Figure S14: Tauc plots for band gap evaluation, Table S1: Refinement result summary for BTON samples using the tetragonal structure model, Table S2: Refinement result summary for BTON samples using the cubic structure model.
Author Contributions
H.G. and U.H. conceived and designed the experiments; H.G., A.J., Z.C., C.L., performed the experiments; H.G., A.J., A.S., U.H. contributed to analyzing the data and writing the paper. All authors have read and agreed to the published version of the manuscript.
Funding
This work was supported by the Swedish Research Council (VR) through grant #2016-03441.
Data Availability Statement
All data presented is available in this manuscript.
Acknowledgments
The authors acknowledge the financial support of the Swedish Research Council.
Conflicts of Interest
The authors declare no conflict of interest.
References
- Kobayashi, Y.; Hernandez, O.J.; Sakaguchi, T.; Yajima, T.; Roisnel, T.; Tsujimoto, Y.; Morita, M.; Noda, Y.; Mogami, Y.; Kitada, A.; et al. An Oxyhydride of BaTiO3 Exhibiting Hydride Exchange and Electronic Conductivity. Nat. Mater. 2012, 11, 507–511. [Google Scholar] [CrossRef]
- Masuda, N.; Kobayashi, Y.; Hernandez, O.; Bataille, T.; Paofai, S.; Suzuki, H.; Ritter, C.; Ichijo, N.; Noda, Y.; Takegoshi, K.; et al. Hydride in BaTiO2.5H0.5: A Labile Ligand in Solid State Chemistry. J. Am. Chem. Soc. 2015, 137, 15315–15321. [Google Scholar] [CrossRef] [PubMed]
- Yajima, T.; Takeiri, F.; Aidzu, K.; Akamatsu, H.; Fujita, K.; Yoshimune, W.; Ohkura, M.; Lei, S.; Gopalan, V.; Tanaka, K.; et al. A Labile Hydride Strategy for the Synthesis of Heavily Nitridized BaTiO3. Nat. Chem. 2015, 7, 1017–1023. [Google Scholar] [CrossRef]
- Kobayashi, Y.; Tang, Y.; Kageyama, T.; Yamashita, H.; Masuda, N.; Hosokawa, S.; Kageyama, H. Titanium-Based Hydrides as Heterogeneous Catalysts for Ammonia Synthesis. J. Am. Chem. Soc. 2017, 139, 18240–18246. [Google Scholar] [CrossRef]
- Bräuniger, T.; Müller, T.; Pampel, A.; Abicht, H.-P. Study of Oxygen−Nitrogen Replacement in BaTiO3 by 14N Solid-State Nuclear Magnetic Resonance. Chem. Mater. 2005, 17, 4114–4117. [Google Scholar] [CrossRef]
- Müller, T.; Großmann, T.; Abicht, H.-P. Nitrogen Containing Barium Titanate: Preparation and Characterisation. J. Phys. Chem. Solids 2009, 70, 1093–1097. [Google Scholar] [CrossRef]
- Yamamoto, T.; Kageyama, H. Hydride Reductions of Transition Metal Oxides. Chem. Lett. 2013, 42, 946–953. [Google Scholar] [CrossRef] [Green Version]
- Hayward, M.A. Topochemical Reactions of Layered Transition-Metal Oxides. Semicond. Sci. Technol. 2014, 29, 29. [Google Scholar] [CrossRef]
- Kobayashi, Y.; Li, Z.; Hirai, K.; Tassel, C.; Loyer, F.; Ichikawa, N.; Abe, N.; Yamamoto, T.; Shimakawa, Y.; Yoshimura, K.; et al. Gas Phase Contributions to Topochemical Hydride Reduction Reactions. J. Solid State Chem. 2013, 207, 190–193. [Google Scholar] [CrossRef]
- Hernden, B.C.; Lussier, J.A.; Bieringer, M. Topotactic Solid-State Metal Hydride Reductions of Sr2MnO4. Inorg. Chem. 2015, 54, 4249–4256. [Google Scholar] [CrossRef] [PubMed]
- Nedumkandathil, R.; Jaworski, A.; Grins, J.; Bernin, D.; Karlsson, M.; Eklof-Osterberg, C.; Neagu, A.; Tai, C.-W.; Pell, A.J.; Haussermann, U. Hydride Reduction of BaTiO3-Oxyhydride Versus O Vacancy Formation. ACS Omega 2018, 3, 11426–11438. [Google Scholar] [CrossRef]
- Guo, H.; Jaworski, A.; Ma, Z.; Slabon, A.; Bacsik, Z.; Nedumkandathil, R.; Häussermann, U. Trapping of Different Stages of BaTiO3 Reduction with LiH. RSC Adv. 2020, 10, 35356–35365. [Google Scholar] [CrossRef]
- Adam, J.; Klein, G.; Lehnert, T. Hydroxyl Content of BaTiO3 Nanoparticles with Varied Size. J. Am. Ceram. Soc. 2013, 96, 2987–2993. [Google Scholar] [CrossRef]
- Atakan, V.; Chen, C.-W.; Paul, R.; Riman, R.E. Quantification of Hydroxyl Content in Ceramic Oxides: A Prompt Gamma Activation Analysis Study of BaTiO3. Anal. Chem. 2008, 80, 6626–6632. [Google Scholar] [CrossRef] [PubMed]
- DiDomenico, M.; Wemple, S.H.; Porto, S.P.S.; Bauman, R.P. Raman Spectrum of Single-Domain BaTiO3. Phys. Rev. 1968, 174, 522–530. [Google Scholar] [CrossRef]
- Venkateswaran, U.D.; Naik, V.M.; Naik, R. High-Pressure Raman Studies of Polycrystalline BaTiO3. Phys. Rev. B 1998, 58, 14256–14260. [Google Scholar] [CrossRef]
- Jiang, Y.-J.; Zeng, L.-Z.; Wang, R.-P.; Zhu, Y.; Liu, Y.-L. Fundamental and Second-Order Raman Spectra of BaTiO3. J. Raman Spectrosc. 1996, 27, 31–34. [Google Scholar] [CrossRef]
- An, W.; Liu, T.H.; Wang, C.H.; Diao, C.L.; Luo, N.N.; Liu, Y.; Qi, Z.-M.; Shao, T.; Wang, Y.-Y.; Jiao, H. Assignment for Vibrational Spectra of BaTiO3 Ferroelectric Ceramic Based on the First-Principles Calculation. Acta Phys. Chim. Sin. 2015, 31, 1059–1068. [Google Scholar]
- Pokorný, J.; Pasha, U.M.; Ben, L.; Thakur, O.P.; Sinclair, D.C.; Reaney, I.M. Use of Raman Spectroscopy to Determine the Site Occupancy of Dopants in BaTiO3. J. Appl. Phys. 2011, 109, 114110. [Google Scholar] [CrossRef]
- Hayashi, H.; Nakamura, T.; Ebina, T. In-Situ Raman Spectroscopy of BaTiO3 Particles for Tetragonal–Cubic Transformation. J. Phys. Chem. Solids 2013, 74, 957–962. [Google Scholar] [CrossRef]
- Chávez, E.; Fuentes, S.; Zarate, R.A.; Padilla-Campos, L. Structural Analysis of Nanocrystalline BaTiO3. J. Mol. Struct. 2010, 984, 131–136. [Google Scholar] [CrossRef]
- Cordes, N.; Bräuniger, T.; Schnick, W. Ammonothermal Synthesis of EAMO2N (EA = Sr, Ba; M = Nb, Ta) Perovskites and 14N Solid-State NMR Spectroscopic Investigations of AM(O,N)3 (A = Ca, Sr, Ba, La). Eur. J. Inorg. Chem. 2018, 2018, 5019–5026. [Google Scholar] [CrossRef]
- Ma, Z.; Linnenberg, O.; Rokicinska, A.; Kustrowski, P.; Slabon, A. Augmenting the Photocurrent of CuWO4 Photoanodes by Heat Treatment in the Nitrogen Atmosphere. J. Phys. Chem. C 2018, 122, 19281–19288. [Google Scholar] [CrossRef]
- Ma, Z.; Lu, C.; Chen, J.; Rokicińska, A.; Kuśtrowski, P.; Coridan, R.; Dronskowski, R.; Slabon, A.; Jaworski, A. CeTiO2N Oxynitride Perovskite: Paramagnetic 14N MAS NMR without Paramagnetic Shifts. Z. Für Naturforschung B 2021, 76, 275–280. [Google Scholar] [CrossRef]
- Kim, Y.-I.; Paik, Y. Bond Covalency in Perovskite Oxynitrides ATaO2N (A = Ca, Sr, Ba) Studied by 14N NMR Spectroscopy. Solid State Sci. 2012, 14, 580–582. [Google Scholar] [CrossRef]
- Wemple, S. Polarization fluctuations and optical-absorption edge in BaTiO3. Phys. Rev. B 1970, 2, 2679. [Google Scholar] [CrossRef]
- Suzuki, K.; Kijima, K. Optical Band Gap of Barium Titanate Nanoparticles Prepared by RF-Plasma Chemical Vapor Deposition. Jpn. J. Appl. Phys. PART 1-Regul. Pap. BRIEF Commun. Rev. Pap. 2005, 44, 2081–2082. [Google Scholar] [CrossRef]
- Sanna, S.; Thierfelder, C.; Wippermann, S.; Sinha, T.P.; Schmidt, W.G. Barium Titanate Ground- and Excited-State Properties from First-Principles Calculations. Phys. Rev. B 2011, 83, 054112. [Google Scholar] [CrossRef] [Green Version]
- Balaz, S.; Porter, S.H.; Woodward, P.M.; Brillson, L.J. Electronic Structure of Tantalum Oxynitride Perovskite Photocatalysts. Chem. Mater. 2013, 25, 3337–3343. [Google Scholar] [CrossRef]
- Ebbinghaus, S.G.; Abicht, H.-P.; Dronskowski, R.; Müller, T.; Reller, A.; Weidenkaff, A. Perovskite-Related Oxynitrides—Recent Developments in Synthesis, Characterisation and Investigations of Physical Properties. Ion. Solid Solut.—Mix. Solid State 2009, 37, 173–205. [Google Scholar] [CrossRef] [Green Version]
- Fuertes, A. Chemistry and Applications of Oxynitride Perovskites. J. Mater. Chem. 2012, 22, 3293–3299. [Google Scholar] [CrossRef]
- Fuertes, A. Nitride Tuning of Transition Metal Perovskites. APL Mater. 2020, 8, 020903. [Google Scholar] [CrossRef] [Green Version]
- Grundmann, M. The Physics of Semiconductors; Chapter 9; Springer: Berlin/Heidelberg, Germany, 2006. [Google Scholar]
- Amano, F.; Nakata, M.; Yamamoto, A.; Tanaka, T. Effect of Ti3+ Ions and Conduction Band Electrons on Photocatalytic and Photoelectrochemical Activity of Rutile Titania for Water Oxidation. J. Phys. Chem. C 2016, 120, 6467–6474. [Google Scholar] [CrossRef]
- Granhed, E.J.; Lindman, A.; Eklof-Osterberg, C.; Karlsson, M.; Parker, S.F.; Wahnstrom, G. Band vs. Polaron: Vibrational Motion and Chemical Expansion of Hydride Ions as Signatures for the Electronic Character in Oxyhydride Barium Titanate. J. Mater. Chem. A 2019, 7, 16211–16221. [Google Scholar] [CrossRef] [Green Version]
- Schnabel, C.; Worner, M.; Gonzalez, B.; del Olmo, I.; Braun, A. Photoelectrochemical Characterization of p- and n-Doped Single Crystalline Silicon Carbide and Photoinduced Reductive Dehalogenation of Organic Pollutants at p-Doped Silicon Carbide. Electrochim. Acta 2001, 47, 719–727. [Google Scholar] [CrossRef]
- Rodriguez-Carvajal, J. FULLPROF: A Program for Rietveld Refinement and Pattern Matching Analysis. In Proceedings of the Satellite Meeting on Powder Diffraction of the XV Congress of the IUCr, Toulouse, France, 19–28 July 1990; Volume 127. [Google Scholar]
- Hwang, T.; van Zijl, P.; Garwood, M. Fast Broadband Inversion by Adiabatic Pulses. J. Magn. Reson. 1998, 133, 200–203. [Google Scholar] [CrossRef] [PubMed]
- Kervern, G.; Pintacuda, G.; Emsley, L. Fast Adiabatic Pulses for Solid-State NMR of Paramagnetic Systems. Chem. Phys. Lett. 2007, 435, 157–162. [Google Scholar] [CrossRef]
Figure 1.
Sketch of material conversions: hydride reduction of BaTiO3 leading to an O-deficient oxyhydride (exemplified as H/vacancy disordered BaTiO2.5H0.125) which then is nitridized with elemental nitrogen (exemplified as BaTiO2.5N0.25 with an ordered (orthorhombic) N/vacancy arrangement). Ba, O, H, N and vacancies are depicted as grey, red, green, blue, and white-blue circles, respectively.

Figure 2.
TG trace for BTOH upon heating under a dry air stream.

Figure 3.
Simultaneously measured TG and DSC traces for BTOH upon heating under a dry N2 stream to 500 °C (a) and 600 °C (b). (c) TG traces upon prolonged nitridation at 500 °C (2 h) and 600 °C (6 h).
Figure 3.
Simultaneously measured TG and DSC traces for BTOH upon heating under a dry N2 stream to 500 °C (a) and 600 °C (b). (c) TG traces upon prolonged nitridation at 500 °C (2 h) and 600 °C (6 h).

Figure 4.
SEM images of BaTiO3 employed for hydride reduction (a), of BTOH (b), of BTON-600C-0 h (c), and BTON-600C-6 h (d).
Figure 4.
SEM images of BaTiO3 employed for hydride reduction (a), of BTOH (b), of BTON-600C-0 h (c), and BTON-600C-6 h (d).

Figure 5.
(a) PXRD patterns of BaTiO3 employed for hydride reduction, BTOH, BTON-600C-0 h, and BTON-600C-6 h, with pictures on the right illustrating the sample colors. (b) Section of Rietveld plots for the PXRD pattern of BTON-600C-6 h when fitting a cubic structure (a = 4.0111(2), 2 = 4.90, RBragg = 4.71, RF = 3.25) and tetragonal structure (a = 4.0085(3), c = 4.0184(2), 2 = 4.25, RBragg = 5.45, RF = 3.66).

Figure 6.
Compilation of Raman spectra for BaTiO3, BTOH, BTON-500C-0 h, BTON-500C-2 h, BTON-600C-0 h, and BTON-600C-6 h.
Figure 6.
Compilation of Raman spectra for BaTiO3, BTOH, BTON-500C-0 h, BTON-500C-2 h, BTON-600C-0 h, and BTON-600C-6 h.

Figure 7.
Compilation of MAS-NMR spectra for BTON and BTON-600C-0 h, and BTON-600C-6 h. Left panel: 1H spectra. Right panel: 14N spectra. The broken vertical lines indicate the position of resonances of hydridic H (left) and N (right).
Figure 7.
Compilation of MAS-NMR spectra for BTON and BTON-600C-0 h, and BTON-600C-6 h. Left panel: 1H spectra. Right panel: 14N spectra. The broken vertical lines indicate the position of resonances of hydridic H (left) and N (right).

Figure 8.
(a) Diffuse reflectance UV-VIS spectra of BaTiO3, BTOH, BTON-500C-0 h, BTON-500C-2 h, BTON-600C-0 h, and BTON-600C-6 h. (b) Normalized Kubelka–Munk function of the spectra.
Figure 8.
(a) Diffuse reflectance UV-VIS spectra of BaTiO3, BTOH, BTON-500C-0 h, BTON-500C-2 h, BTON-600C-0 h, and BTON-600C-6 h. (b) Normalized Kubelka–Munk function of the spectra.

Figure 9.
Mott–Schottky plots of BaTiO3, BTOH, BTON-600C-0 h, and BTON-600C-6 h.


Table 1.
Characterization summary for BTOH.
| Sample | Lattice Parameters (Å) | Volume (Å3) | XTG,H 1 | XTG,◻ 2 | XNMR,H | X◻ | Formula |
|---|---|---|---|---|---|---|---|
| BaTiO3 | a = 3.9964(1) c = 4.0310(2) | 64.379(2) | |||||
| BTOH | 4.0220(2) | 65.062(1) | 0.422 | 0.396 | 0.08 | 0.32 | BaTiO2.60H0.08 |
1 XTG,H refers to the reaction BaTiO3-xHx + 0.75x O2 → BaTiO3 + 0.5x H2O. 2 XTG,◻ refers to the reaction BaTiO3-x + 0.5x O2 → BaTiO3.
Table 2.
Characterization summary for BTON. Samples are abbreviated as BTON-xxxC-yh where xxx indicates the nitridation temperature and y the annealing time. Note that the tetragonal distortion has poor significance since the refinement of BTON PXRD patterns does not allow to discriminate between cubic and tetragonal phase when c/a < 1.003.
| Sample | Lattice Parameters (Å) | Volume (Å3) | XTG,N | Xchem.anal.,N | Formula |
|---|---|---|---|---|---|
| BTON-600C-0 h | a = 4.0086(3) c = 4.0180(5) | 64.630(2) | 0.22 | 0.20 | BaTiO2.60N0.20◻0.20 |
| BTON-600C-6 h | a = 4.0085(3) c = 4.0184(2) | 64.533(2) | 0.21 | 0.18 | BaTiO2.60N0.18◻0.22 |
Table 3.
Compilation of bandgaps and flat band potentials.
| Sample | Bandgap (eV) (Direct) | Flat Band Potential (vs. RHE, V) |
|---|---|---|
| BaTiO3 | 3.18 | −0.59 |
| BTOH | 3.33 | −0.54 |
| BTON-600-0 h | 2.45 | −0.64 |
| BTON-600-6 h | 2.46 | −0.66 |
Publisher’s Note: MDPI stays neutral with regard to jurisdictional claims in published maps and institutional affiliations. |
© 2021 by the authors. Licensee MDPI, Basel, Switzerland. This article is an open access article distributed under the terms and conditions of the Creative Commons Attribution (CC BY) license (https://creativecommons.org/licenses/by/4.0/).
Share and Cite
MDPI and ACS Style
Guo, H.; Jaworski, A.; Chen, Z.; Lu, C.; Slabon, A.; Häussermann, U. Barium Titanium Oxynitride from Ammonia-Free Nitridation of Reduced BaTiO3. Inorganics 2021, 9, 62. https://0-doi-org.brum.beds.ac.uk/10.3390/inorganics9080062
AMA Style
Guo H, Jaworski A, Chen Z, Lu C, Slabon A, Häussermann U. Barium Titanium Oxynitride from Ammonia-Free Nitridation of Reduced BaTiO3. Inorganics. 2021; 9(8):62. https://0-doi-org.brum.beds.ac.uk/10.3390/inorganics9080062
Chicago/Turabian StyleGuo, Hua, Aleksander Jaworski, Zheng Chen, Can Lu, Adam Slabon, and Ulrich Häussermann. 2021. "Barium Titanium Oxynitride from Ammonia-Free Nitridation of Reduced BaTiO3" Inorganics 9, no. 8: 62. https://0-doi-org.brum.beds.ac.uk/10.3390/inorganics9080062
Note that from the first issue of 2016, this journal uses article numbers instead of page numbers. See further details here.