Photobiomodulation Dose Parameters in Dentistry: A Systematic Review and Meta-Analysis

 ,
,
Abstract
:1. Introduction
2. Materials and Methods
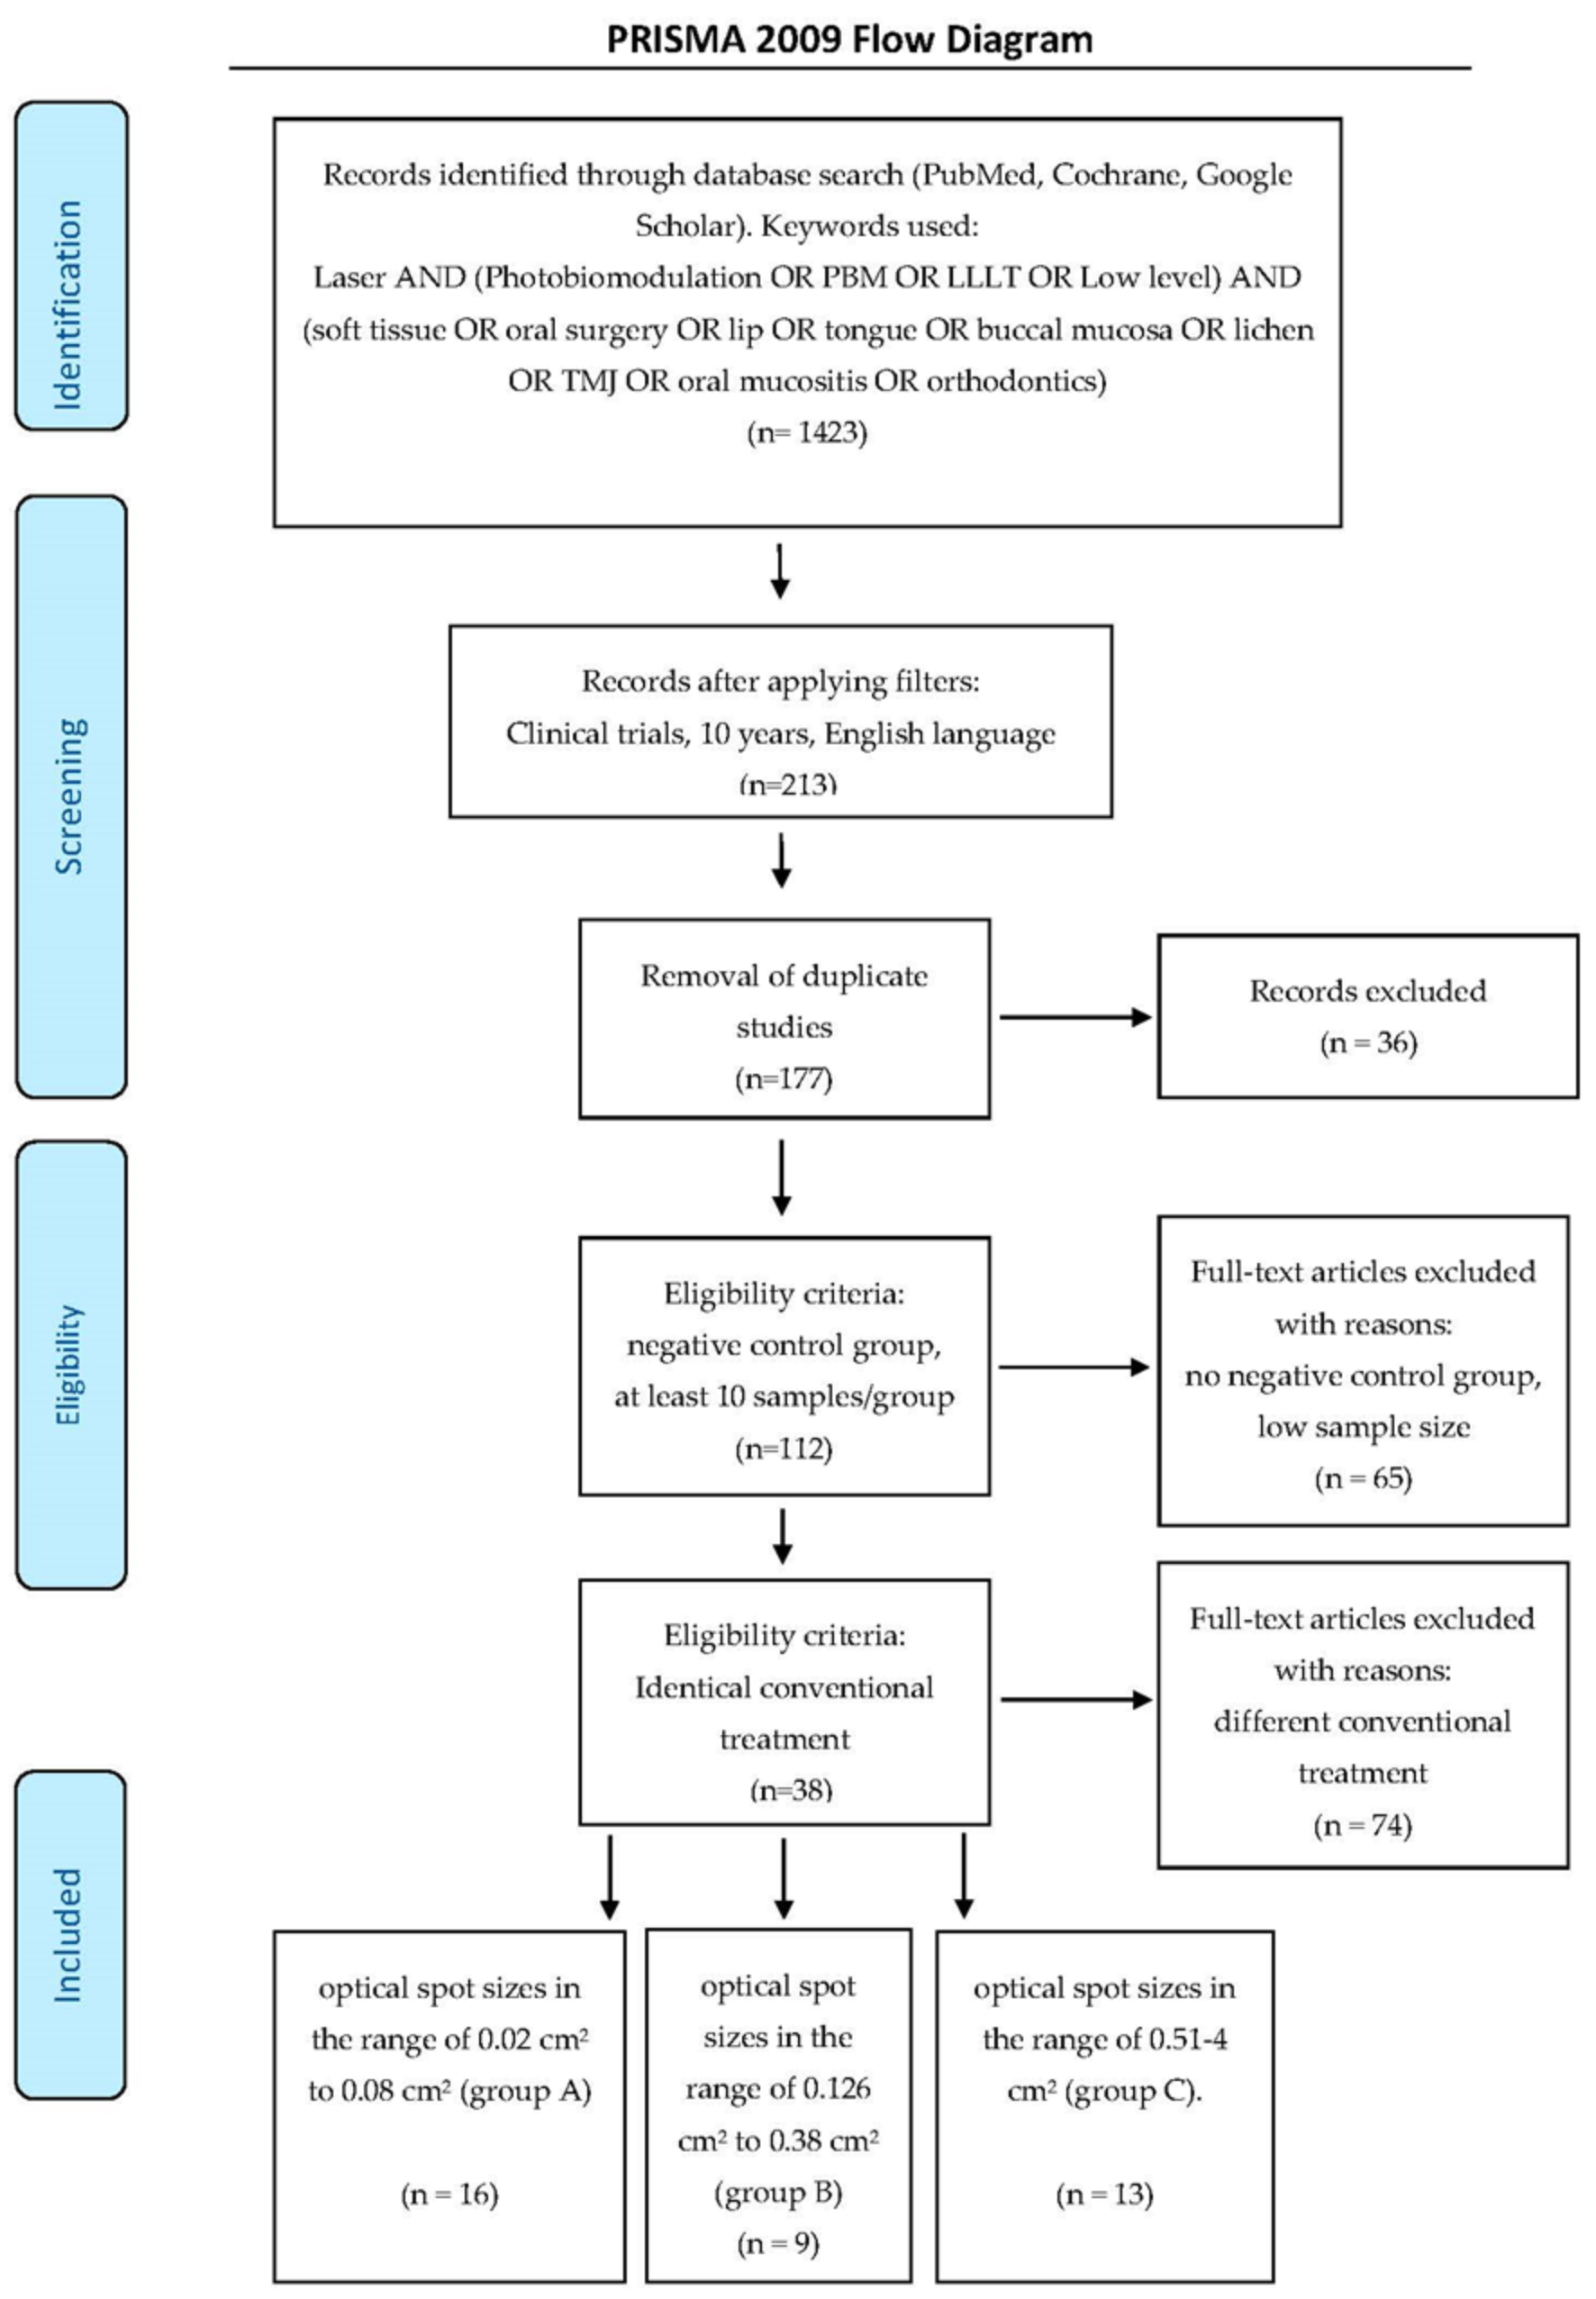
2.1. Search Strategy
- Population = Patients receiving PBM therapy as adjunct to treat presenting pathology.
- Intervention = Administered PBM to assist in pain management/healing.
- Compared with = Control groups receiving alternative therapy/sham phototherapy.
- Outcome of interest = Pain; Healing; etc.
- Study type = Randomized Controlled Trials.
- Randomized controlled clinical trials;
- Laser applied as an adjunctive therapy;
- Standard orthodox treatment performed to all groups;
- Negative control group;
- Minimum of 10 participants per group.
- PBM therapy not applied;
- Duplicates or studies with the same ethical approval number;
- Alternative to control conventional treatment applied to the test group;
- Less than 10 subjects per group;
- Clinical trials, case series, pilot studies, (not randomized controlled);
- In vitro studies;
- LED rather than laser as light source.
- Optical spot sizes in the range of 0.02–0.08 cm2 (group A–16 articles)
- Optical spot sizes in the range of 0.126–0.38 cm2 (group B–9 articles)
- Optical spot sizes in the range of 0.51–4 cm2 (group C–13 articles).
2.2. Quality Assessment
- Randomization?
- Sample size calculation and required sample number included?
- Allocation ratio of 1:1?
- Baseline situation similar?
- Blinding (single/double)?
- Parameters of laser use correctly described, and calculations checked?
- Power meter used for calibration of the source?
- Numerical results available (statistics)?
- Outcome data complete?
- Correct interpretation of data?
- High risk: 0–4.
- Moderate risk: 5–7.
- Low risk: 8–10.
3. Statistical Analysis of Systematic Review Clinical Outcome Dataset
4. Results
5. Discussion
6. Conclusions
Author Contributions
Funding
Acknowledgments
Conflicts of Interest
References
- Hamblin, M.; Ferraresi, C.; Huang, Y.; Freitas, L.; Carroll, J. Low-Level Light Therapy: Photobiomodulation. Tutorial Texts in Optical Engineering; SPIE Press: Bellingham, WA, USA, 2018; Volume TT115, ISBN 9781510614161. [Google Scholar]
- Romagnoli, E.; Cafaro, A. Ch. 7: PBM. Theoretical and Applied Concepts of Adjunctive use of LLLT/PBM within Clinical Dentistry. In Lasers in Dentistry- Current Concepts; Coluzzi, D., Parker, S., Eds.; Pub. Springer Nature: Cham, Switzerland, 2017; pp. 125–157. ISBN 978-3-319-51943-2. [Google Scholar] [CrossRef]
- Cronshaw, M.; Parker, S.; Anagnostaki, E.; Lynch, E. Systematic Review of Orthodontic Treatment Management with Photobiomodulation Therapy. Photobiomodulation Photomed. Laser Surg. 2019, 37, 862–868. [Google Scholar] [CrossRef] [Green Version]
- Cronshaw, M. Ch. 12: Photobiomodulation Concepts within Orthodontics. In Lasers in Dentistry- Current Concepts; Coluzzi, D., Parker, S., Eds.; Pub. Springer Nature: Cham, Switzerland, 2017; pp. 262–275. ISBN 978-3-319-51943-2. [Google Scholar] [CrossRef]
- Sonesson, M.; De Geer, E.; Subraian, J.; Petrén, S. Efficacy of low-level laser therapy in accelerating tooth movement, preventing relapse and managing acute pain during orthodontic treatment in humans: A systematic review. BMC Oral Health 2017, 17, 11. [Google Scholar] [CrossRef] [Green Version]
- Machado, A.C.; Viana, Í.; Farias-Neto, A.M.; Braga, M.M.; Eduardo, C.D.P.; De Freitas, P.M.; Aranha, A.C.C. Is photobiomodulation (PBM) effective for the treatment of dentin hypersensitivity? A systematic review. Lasers Med. Sci. 2018, 33, 745–753. [Google Scholar] [CrossRef]
- Sgolastra, F.; Petrucci, A.; Severino, M.; Gatto, R.; Monaco, A. Lasers for the Treatment of Dentin Hypersensitivity. J. Dent. Res. 2013, 92, 492–499. [Google Scholar] [CrossRef]
- Lalla, R.V.; Bowen, J.M.; Barasch, A.; Elting, L.; Epstein, J.; Keefe, D.M.; McGuire, D.B.; Migliorati, C.; Nicolatou-Galitis, O.; Dmd, D.E.P.; et al. MASCC/ISOO clinical practice guidelines for the management of mucositis secondary to cancer therapy. Cancer 2014, 120, 1453–1461. [Google Scholar] [CrossRef] [Green Version]
- Cronshaw, M.; Parker, S.; Anagnostaki, E.; Mylona, V.; Lynch, E.; Grootveld, M. Photobiomodulation and Oral Mucositis: A Systematic Review. Dent. J. 2020, 8, 87. [Google Scholar] [CrossRef]
- Zadik, Y.; Arany, P.R.; Fregnani, E.R.; Bossi, P.; Antunes, H.S.; Bensadoun, R.-J.; Gueiros, L.A.; Majorana, A.; Nair, R.G.; Ranna, V.; et al. Systematic review of photobiomodulation for the management of oral mucositis in cancer patients and clinical practice guidelines. Support. Care Cancer 2019, 27, 3969–3983. [Google Scholar] [CrossRef] [Green Version]
- Rahman, S.U.; Mosca, R.; Reddy, S.G.; Nunez, S.; Andreana, S.; Mang, T.; Arany, P.R. Learning from clinical phenotypes: Low-dose biophotonics therapies in oral diseases. Oral Dis. 2018, 24, 261–276. [Google Scholar] [CrossRef]
- Merigo, E.; Rocca, J.-P.; Pinheiro, A.L.; Fornaini, C. Photobiomodulation Therapy in Oral Medicine: A Guide for the Practitioner with Focus on New Possible Protocols. Photobiomodulation Photomed. Laser Surg. 2019, 37, 669–680. [Google Scholar] [CrossRef]
- Al-Maweri, S.; Javed, F.; Kalakonda, B.; Alaizari, N.A.; Al-Soneidar, W.; Al-Akwa, A. Efficacy of low level laser therapy in the treatment of burning mouth syndrome: A systematic review. Photodiagnosis Photodyn. Ther. 2017, 17, 188–193. [Google Scholar] [CrossRef]
- Doeuk, C.; Hersant, B.; Bosc, R.; Lange, F.; SidAhmed-Mezi, M.; Bouhassira, J.; Meningaud, J.-P. Current indications for low level laser treatment in maxillofacial surgery: A review. Br. J. Oral Maxillofac. Surg. 2015, 53, 309–315. [Google Scholar] [CrossRef]
- Hahm, E.; Kulhari, S.; Arany, P.R. Targeting the pain, inflammation and immune (PII) axis: Plausible rationale for LLLT. Photon-Lasers Med. 2012, 1, 241–254. [Google Scholar] [CrossRef]
- Ozcelik, O.; Haytac, M.C.; Kunin, A.; Seydaoglu, G. Improved wound healing by low-level laser irradiation after gingivectomy operations: A controlled clinical pilot study. J. Clin. Periodontol. 2008, 35, 250–254. [Google Scholar] [CrossRef]
- Grundy, M.; Aykroyd, S.; Lynch, E. Pain, Inflammation and Infection: A Daily Challenge in Every Clinical Practice; Role for Lasers? EC Dental Sci. 2019, 18, 1352–1353. [Google Scholar]
- Cronshaw, M.; Parker, S.; Anaganostaki, E.; Bordin-Aykroyd, S.; Lynch, E. Photobiomodulation Therapy and Periodontitis: A Discussion Paper. EC Dental Sci. 2019, 18, 1791–1797. [Google Scholar]
- Hamblin, M.R. Mechanisms and applications of the anti-inflammatory effects of photobiomodulation. AIMS Biophys. 2017, 4, 337–361. [Google Scholar] [CrossRef]
- Pesevska, S.; Nakova, M.; Gjorgoski, I.; Angelov, N.; Ivanovski, K.; Nares, S.; Andreana, S. Effect of laser on TNF-alpha expression in inflamed human gingival tissue. Lasers Med. Sci. 2012, 27, 377–381. [Google Scholar] [CrossRef] [PubMed]
- Safavi, M.; Kazemi, B.; Esmaeili, M.; Fallah, A.; Modarresi, A.; Mir, M. Effects of low-level He–Ne laser irradiation on the gene expression of IL-1β, TNF-α, IFN-γ, TGF-β, bFGF, and PDGF in rat’s gingiva. Lasers Med. Sci. 2007, 23, 331–335. [Google Scholar] [CrossRef]
- Choi, H.; Lim, W.; Kim, I.; Kim, J.; Ko, Y.; Kwon, H.; Kim, S.; Kabir, K.M.A.; Li, X.; Kim, O.; et al. Inflammatory cytokines are suppressed by light-emitting diode irradiation of P. gingivalis LPS-treated human gingival fibroblasts. Lasers Med. Sci. 2011, 27, 459–467. [Google Scholar] [CrossRef]
- Ryu, J.-J.; Yoo, S.; Kim, K.; Park, J.-S.; Bang, S.; Lee, S.; Yang, T.-J.; Cho, H.; Hwang, S.W. Laser Modulation of Heat and Capsaicin Receptor TRPV1 Leads to Thermal Antinociception. J. Dent. Res. 2010, 89, 1455–1460. [Google Scholar] [CrossRef]
- Serrage, H.; Heiskanen, V.; Palin, W.M.; Cooper, P.R.; Milward, M.R.; Hadis, M.; Hamblin, M.R. Under the spotlight: Mechanisms of photobiomodulation concentrating on blue and green light. Photochem. Photobiol. Sci. 2019, 18, 1877–1909. [Google Scholar] [CrossRef]
- Sakurai, Y.; Yamaguchi, M.; Abiko, Y. Inhibitory effect of low-level laser irradiation on LPS-stimulated prostaglandin E2 production and cyclooxygenase-2 in human gingival fibroblasts. Eur. J. Oral Sci. 2000, 108, 29–34. [Google Scholar] [CrossRef] [PubMed]
- Pesevska, S.; Gjorgoski, I.; Ivanovski, K.; Soldatos, N.K.; Angelov, N. The effect of low-level diode laser on COX-2 gene expression in chronic periodontitis patients. Lasers Med. Sci. 2017, 32, 1463–1468. [Google Scholar] [CrossRef]
- Karu, T.I. Is It Time to Consider Photobiomodulation As a Drug Equivalent? Photomed. Laser Surg. 2013, 31, 189–191. [Google Scholar] [CrossRef] [PubMed] [Green Version]
- Ross, G. Photobiomodulation Therapy: A Possible Answer to the Opioid Crisis. Photobiomodulation Photomed. Laser Surg. 2019, 37, 667–668. [Google Scholar] [CrossRef]
- Huang, Y.-Y.; Chen, A.C.-H.; Carroll, J.D.; Hamblin, M.R. Biphasic Dose Response in Low Level Light Therapy. Dose-Response 2009, 7, 358–383. [Google Scholar] [CrossRef] [PubMed]
- Huang, Y.; Sharma, S.; Carroll, J.; Hamblin, M. Biphasic dose response in low level light therapy- an update. Dose Response 2011, 9, 602–618. [Google Scholar] [CrossRef] [PubMed]
- Chow, R.; Armati, P.J. Photobiomodulation: Implications for Anesthesia and Pain Relief. Photomed. Laser Surg. 2016, 34, 599–609. [Google Scholar] [CrossRef] [PubMed]
- Kate, R.J.; Rubatt, S.; Enwemeka, C.S.; Huddleston, W.E. Optimal Laser Phototherapy Parameters for Pain Relief. Photomed. Laser Surg. 2018, 36, 354–362. [Google Scholar] [CrossRef]
- Cronshaw, M.; Parker, S.; Arany, P. Feeling the Heat: Evolutionary and Microbial Basis for the Analgesic Mechanisms of Photobiomodulation Therapy. Photobiomodulation Photomed. Laser Surg. 2019, 37, 517–526. [Google Scholar] [CrossRef]
- Khan, I.; Arany, P.R. Dosimetry for photobiomodulation therapy: Response to Sommers et al. Ann. Transl. Med. 2016, 4, 208. [Google Scholar] [CrossRef] [PubMed] [Green Version]
- Parker, S.; Cronshaw, M.; Anagnostaki, E.; Lynch, E. Laser Essentials for the Dental Practitioner: Foundation Knowledge-Construction, Modes of Operation and Safety. EC Dental Sci. 2019, 18, 2020–2027. [Google Scholar]
- Selting, W. Ch. 4. Laser operating parameters for hard and soft tissue surgical and PBM management. In Lasers in Dentistry-Current Concepts; Coluzzi, D., Parker, S., Eds.; Springer Pub. Springer Nature: Cham, Switzerland, 2017; pp. 57–81. ISBN 978-3-319-51943-2. [Google Scholar] [CrossRef]
- Parker, S.; Cronshaw, M.; Anagnostaki, E.; Bordin-Aykroyd, S.R.; Lynch, E. Systematic Review of Delivery Parameters Used in Dental Photobiomodulation Therapy. Photobiomodulation Photomed. Laser Surg. 2019, 37, 784–797. [Google Scholar] [CrossRef]
- Methley, A.M.; Campbell, S.; Chew-Graham, C.A.; McNally, R.; Cheraghi-Sohi, S. PICO, PICOS and SPIDER: A comparison study of specificity and sensitivity in three search tools for qualitative systematic reviews. BMC Heal. Serv. Res. 2014, 14, 579. [Google Scholar] [CrossRef] [Green Version]
- Moher, D.; Liberati, A.; Tetzlaff, J.; Altman, U.G. Preferred Reporting Items for Systematic Reviews and Meta-Analyses: The PRISMA Statement. PLoS Med. 2009, 6, e1000097. [Google Scholar] [CrossRef] [Green Version]
- Higgins, J.; Savović, J.; Page, M.; Elbers, R.; Sterne, J. Assessing risk of bias in a randomized trial. In Cochrane Handbook for Systematic Reviews of Interventions, 2nd ed.; Higgins, J., Thomas, J., Chandler, J., Cumpston, M., Li, T., Page, M., Welch, V., Eds.; John Wiley & Sons: Chichester, UK, 2019; pp. 205–228. [Google Scholar] [CrossRef]
- Sugaya, N.N.; Silva, E.; Kato, I.; Prates, R.; Gallo, C.; Pellegrini, V. Low Intensity laser therapy in patients with burning mouth syndrome: A randomized, placebo-controlled study. Braz. Oral Res. 2016, 30, e108. [Google Scholar] [CrossRef] [PubMed]
- Valenzuela, S.; Lopez-Jornet, P. Effects of low-level laser therapy on burning mouth syndrome. J. Oral Rehabil. 2017, 44, 125–132. [Google Scholar] [CrossRef]
- Barbosa, N.G.; Gonzaga, A.K.G.; de Sena Fernandes, L.L.; da Fonseca, A.G.; Queiroz, S.I.M.L.; Lemos, T.M.A.M.; da Silveira, É.J.D.; de Medeiros, A.M.C. Evaluation of laser therapy and alpha-lipoic acid for the treatment of burning mouth syndrome: A randomized clinical trial. Lasers Med. Sci. 2018, 33, 1255–1262. [Google Scholar] [CrossRef]
- Dias, S.B.F.; Fonseca, M.V.A.; Dos Santos, N.C.; Mathias, I.F.; Martinho, F.C.; Júnior, M.S.; Jardini, M.A.N.; Santamaria, M.P. Effect of GaAIAs low-level laser therapy on the healing of human palate mucosa after connective tissue graft harvesting: Randomized clinical trial. Lasers Med. Sci. 2015, 30, 1695–1702. [Google Scholar] [CrossRef]
- Neves, F.L.D.S.; Silveira, C.A.; Dias, S.B.F.; Júnior, M.S.; De Marco, A.C.; Kerbauy, W.D.; Filho, A.B.D.M.; Jardini, M.A.N.; Santamaria, M.P. Comparison of two power densities on the healing of palatal wounds after connective tissue graft removal: Randomized clinical trial. Lasers Med. Sci. 2016, 31, 1371–1378. [Google Scholar] [CrossRef] [Green Version]
- De Rezende, R.A.; Silva, D.N.; Frigo, L. Effect of GaAlAs low-level laser therapy on mouth opening after orthognathic surgery. Lasers Med. Sci. 2018, 33, 1271–1277. [Google Scholar] [CrossRef]
- Tuk, J.G.; Van Wijk, A.J.; Mertens, I.C.; Keleş, Z.; Lindeboom, J.A.; Milstein, D.M.J. Analgesic effects of preinjection low-level laser/light therapy (LLLT) before third molar surgery: A double-blind randomized controlled trial. Oral Surgery Oral Med. Oral Pathol. Oral Radiol. 2017, 124, 240–247. [Google Scholar] [CrossRef]
- De Carli, M.L.; Guerra, M.B.; Nunes, T.B.; Di Matteo, R.C.; De Luca, C.E.P.; Aranha, A.C.C.; Bolzan, M.C.; Witzel, A.L. Piroxicam and laser phototherapy in the treatment of TMJ arthralgia: A double-blind randomised controlled trial. J. Oral Rehabil. 2013, 40, 171–178. [Google Scholar] [CrossRef]
- Machado, B.C.Z.; Mazzetto, M.O.; Da Silva, M.A.M.R.; De Felício, C.M. Effects of oral motor exercises and laser therapy on chronic temporomandibular disorders: A randomized study with follow-up. Lasers Med. Sci. 2016, 31, 945–954. [Google Scholar] [CrossRef]
- Magri, L.V.; Carvalho, V.A.; Rodrigues, F.C.C.; Bataglion, C.; Leite-Panissi, C.R.A. Non-specific effects and clusters of women with painful TMD responders and non-responders to LLLT: Double-blind randomized clinical trial. Lasers Med. Sci. 2018, 33, 385–392. [Google Scholar] [CrossRef] [PubMed]
- Ramalho, K.M.; De Souza, L.M.P.; Tortamano, I.P.; Adde, C.A.; Rocha, R.G.; Eduardo, C.D.P. A randomized placebo-blind study of the effect of low power laser on pain caused by irreversible pulpitis. Lasers Med. Sci. 2016, 31, 1899–1905. [Google Scholar] [CrossRef] [PubMed]
- Oton-Leite, A.F.; Silva, G.B.L.; Morais, M.O.; Silva, T.A.; Leles, C.R.; Valadares, M.C.; Pinezi, J.C.D.; Batista, A.C.; De Mendonça, E.F. Effect of low-level laser therapy on chemoradiotherapy-induced oral mucositis and salivary inflammatory mediators in head and neck cancer patients. Lasers Surg. Med. 2015, 47, 296–305. [Google Scholar] [CrossRef]
- Ferrante, M.; Petrini, M.; Trentini, P.; Perfetti, G.; Spoto, G. Effect of low-level laser therapy after extraction of impacted lower third molars. Lasers Med. Sci. 2013, 28, 845–849. [Google Scholar] [CrossRef]
- Nóbrega, C.; Da Silva, E.M.K.; De Macedo, C.R. Low-Level Laser Therapy for Treatment of Pain Associated with Orthodontic Elastomeric Separator Placement: A Placebo-Controlled Randomized Double-Blind Clinical Trial. Photomed. Laser Surg. 2013, 31, 10–16. [Google Scholar] [CrossRef]
- Marín-Conde, F.; Castellanos-Cosano, L.; Pachón-Ibañez, J.; Serrera-Figallo, M.; Gutiérrez-Pérez, J.; Torres-Lagares, D. Photobiomodulation with low-level laser therapy reduces oral mucositis caused by head and neck radio-chemotherapy: Prospective randomized controlled trial. Int. J. Oral Maxillofac. Surg. 2019, 48, 917–923. [Google Scholar] [CrossRef]
- Silva, G.B.L.; De Mendonça, E.F.; Bariani, C.; Antunes, H.S.; Silva, M.A.G. The Prevention of Induced Oral Mucositis with Low-Level Laser Therapy in Bone Marrow Transplantation Patients: A Randomized Clinical Trial. Photomed. Laser Surg. 2011, 29, 27–31. [Google Scholar] [CrossRef]
- Arduino, P.G.; Cafaro, A.; Garrone, M.; Gambino, A.; Cabras, M.; Romagnoli, E.; Broccoletti, R. A randomized pilot study to assess the safety and the value of low-level laser therapy versus clonazepam in patients with burning mouth syndrome. Lasers Med. Sci. 2016, 31, 811–816. [Google Scholar] [CrossRef] [PubMed]
- Elbay, U.; Tak, O.; Elbay, M.; Uğurluel, C.; Kayaet, C. Efficacy of Low-Level Laser Therapy in the Management of Postoperative Pain in Children After Primary Teeth Extraction: A Randomized Clinical Trial. Photomed. Laser Surg. 2016, 34, 171–177. [Google Scholar] [CrossRef]
- Lopez-Ramırez, M.; Vılchez-Perez, M.; Gargallo-Albiol, J.; Arnabat-Domínguez, J.; Gay-Escodaet, C. Efficacy of low-level laser therapy in the management of pain, facial swelling, and postoperative trismus after a lower third molar extraction. A preliminary study. Lasers Med. Sci. 2012, 27, 559–566. [Google Scholar] [CrossRef]
- Landucci, A.; Wosny, A.; Uetanabaro, L.; Moro, A.; De Araujo, M.R. Efficacy of a single dose of low-level laser therapy in reducing pain, swelling, and trismus following third molar extraction surgery. Int. J. Oral Maxillofac. Surg. 2016, 45, 392–398. [Google Scholar] [CrossRef] [PubMed]
- Moosavi, H.; Arjmand, N.; Ahrari, F.; Zakeri, M.; Maleknejad, F. Effect of low-level laser therapy on tooth sensitivity induced by in-office bleaching. Lasers Med. Sci. 2016, 31, 713–719. [Google Scholar] [CrossRef]
- Amanat, D.; Ebrahimi, H.; Lavaee, F.; Alipour, A. The Adjunct Therapeutic Effect of Lasers with Medication in the Management of Orofacial Pain: Double Blind Randomized Controlled Trial. Photomed. Laser Surg. 2013, 31, 474–479. [Google Scholar] [CrossRef]
- Shirani, A.M.; Gutknecht, N.; Taghizadeh, M.; Mir, M. Low-level laser therapy and myofacial pain dysfunction syndrome: A randomized controlled clinical trial. Lasers Med. Sci. 2009, 24, 715–720. [Google Scholar] [CrossRef] [PubMed]
- Khaw, C.M.A.; Dalci, O.; Foley, M.; Petocz, P.; Darendeliler, M.A.; Papadopoulou, A.K. Physical properties of root cementum: Part 27. Effect of low-level laser therapy on the repair of orthodontically induced inflammatory root resorption: A double-blind, split-mouth, randomized controlled clinical trial. Am. J. Orthod. Dentofac. Orthop. 2018, 154, 326–336. [Google Scholar] [CrossRef]
- Antunes, H.S.; Herchenhorn, D.; Small, I.; Araujo, C.M.; Viégas, C.M.P.; Cabral, E.; Rampini, M.P.; Rodrigues, P.C.; Silva, T.G.; Ferreira, E.M.; et al. Phase III trial of low-level laser therapy to prevent oral mucositis in head and neck cancer patients treated with concurrent chemoradiation. Radiother. Oncol. 2013, 109, 297–302. [Google Scholar] [CrossRef] [PubMed]
- Aras, M.H.; Güngörmüş, M. Placebo-controlled randomized clinical trial of the effect two different low-level laser therapies (LLLT)—Intraoral and extraoral—On trismus and facial swelling following surgical extraction of the lower third molar. Lasers Med. Sci. 2010, 25, 641–645. [Google Scholar] [CrossRef]
- Ustaoğlu, G.; Ercan, E.; Tunali, M. Low-Level Laser Therapy in Enhancing Wound Healing and Preserving Tissue Thickness at Free Gingival Graft Donor Sites: A Randomized, Controlled Clinical Study. Photomed. Laser Surg. 2017, 35, 223–230. [Google Scholar] [CrossRef]
- Asutay, F.; Ozcan-Kucuk, A.; Alan, H.; Koparal, M. Three-dimensional evaluation of the effect of low-level laser therapy on facial swelling after lower third molar surgery: A randomized, placebo-controlled study. Niger. J. Clin. Pr. 2018, 21, 1107–1113. [Google Scholar]
- Ahrari, F.; Madani, A.S.; Ghafouri, Z.S.; Tunér, J. The efficacy of low-level laser therapy for the treatment of myogenous temporomandibular joint disorder. Lasers Med. Sci. 2014, 29, 551–557. [Google Scholar] [CrossRef]
- Liang, R.; George, R.; Walsh, L.J. Pulpal response following photo-biomodulation with a 904-nm diode laser: A double-blind clinical study. Lasers Med. Sci. 2016, 31, 1811–1817. [Google Scholar] [CrossRef] [PubMed]
- Amadori, F.; Bardellini, E.; Conti, G.; Pedrini, N.; Schumacher, R.F.; Majorana, A. Low-level laser therapy for treatment of chemotherapy-induced oral mucositis in childhood: A randomized double-blind controlled study. Lasers Med. Sci. 2016, 31, 1231–1236. [Google Scholar] [CrossRef] [PubMed] [Green Version]
- Caccianiga, G.; Paiusco, A.; Perillo, L.; Nucera, R.; Pinsino, A.; Maddalone, M.; Cordasco, G.; Giudice, A.L. Does Low-Level Laser Therapy Enhance the Efficiency of Orthodontic Dental Alignment? Results from a Randomized Pilot Study. Photomed. Laser Surg. 2017, 35, 421–426. [Google Scholar] [CrossRef] [PubMed]
- Gautam, A.P.; Fernandes, D.J.; Vidyasagar, M.S.; Maiya, A.; Guddattu, V. Low level laser therapy against radiation induced oral mucositis in elderly head and neck cancer patients-a randomized placebo controlled trial. J. Photochem. Photobiol. B Biol. 2015, 144, 51–56. [Google Scholar] [CrossRef]
- Gautam, A.P.; Fernandes, D.J.; Vidyasagar, M.S.; Maiya, G.A. Low Level Helium Neon Laser therapy for chemoradiotherapy induced oral mucositis in oral cancer patients–A randomized controlled trial. Oral Oncol. 2012, 48, 893–897. [Google Scholar] [CrossRef]
- Nicotra, C.; Polizzi, A.; Zappalà, G.; Leonida, A.; Indelicato, F.; Caccianiga, G. A Comparative Assessment of Pain Caused by the Placement of Banded Orthodontic Appliances with and without Low-Level Laser Therapy: A Randomized Controlled Prospective Study. Dent. J. 2020, 8, 24. [Google Scholar] [CrossRef] [PubMed] [Green Version]
- Flieger, R.; Gedrange, T.; Grzech-Lesniak, K.; Dominiak, M.; Matys, J. Low-Level Laser Therapy with a 635 nm Diode Laser Affects Orthodontic Mini-Implants Stability: A Randomized Clinical Split-Mouth Trial. J. Clin. Med. 2020, 9, 112. [Google Scholar] [CrossRef] [Green Version]
- Matys, J.; Świder, K.; Grzech-Lesniak, K.; Dominiak, M.; Romeo, U. Photobiomodulation by a 635 nm Diode Laser on Peri-Implant Bone: Primary and Secondary Stability and Bone Density Analysis—A Randomized Clinical Trial. BioMed Res. Int. 2019, 2019, 2785302. [Google Scholar] [CrossRef] [PubMed] [Green Version]
- Feslihan, E.; Eroğlu, C.N. Can Photobiomodulation Therapy Be an Alternative to Methylprednisolone in Reducing Pain, Swelling, and Trismus After Removal of Impacted Third Molars? Photobiomodulation Photomed. Laser Surg. 2019, 37, 700–705. [Google Scholar] [CrossRef]
- Alvarenga, L.H.; Ribeiro, M.S.; Kato, I.T.; Núñez, S.C.; Prates, R.A. Evaluation of red light scattering in gingival tissue–in vivo study. Photodiagnosis Photodyn. Ther. 2018, 23, 32–34. [Google Scholar] [CrossRef]
- Steiner, R. Laser tissue interactions. In Laser & IPL Technology in Dermatology & Aesthetic Medicine; Springer: Berlin/Heidelberg, Germany; New York, NY, USA, 2010; pp. 23–36. ISBN 978-3-642-03438-1. [Google Scholar]
- Bashkatov, A.N.; A Genina, E.; I Kochubey, V.; Tuchin, V.V. Optical properties of human skin, subcutaneous and mucous tissues in the wavelength range from 400 to 2000 nm. J. Phys. D Appl. Phys. 2005, 38, 2543–2555. [Google Scholar] [CrossRef]
- Bashkatov, A.N.; A Genina, E.; Tuchin, V.V. Optical Properties of skin, subcutaneous, and muscle tissues: A review. J. Innov. Opt. Heal. Sci. 2011, 4, 9–38. [Google Scholar] [CrossRef]
- Jacques, S.L. Optical properties of biological tissues: A review. Phys. Med. Biol. 2013, 58, R37–R61. [Google Scholar] [CrossRef]
- Benedicenti, A.; Benedicenti, S. Atlas of Laser Therapy: State of the Art, 4th ed.; Teamwork Media Srl: Villa Carcina, Italy, 2016; pp. 141–152. ISBN 88-89626-02-X. [Google Scholar]
- Hadis, M.; Zainal, S.A.; Holder, M.J.; Carroll, J.D.; Cooper, P.R.; Milward, M.R.; Palin, W.M. The dark art of light measurement: Accurate radiometry for low-level light therapy. Lasers Med. Sci. 2016, 31, 789–809. [Google Scholar] [CrossRef] [PubMed] [Green Version]
- Khan, I.; Tang, E.; Arany, P.R. Molecular pathway of near-infrared laser phototoxicity involves ATF-4 orchestrated ER stress. Sci. Rep. 2015, 5, 10581. [Google Scholar] [CrossRef]
- Amaroli, A.; Ravera, S.; Parker, S.; Panfoli, I.; Benedicenti, A.; Benedicenti, S. An 808-nm Diode Laser with a Flat-Top Handpiece Positively Photobiomodulates Mitochondria Activities. Photomed. Laser Surg. 2016, 34, 564–571. [Google Scholar] [CrossRef] [PubMed]
- Salehpour, F.; Mahmoudi, J.; Kamari, F.; Sadigh-Eteghad, S.; Rasta, S.H.; Hamblin, M.R. Brain Photobiomodulation Therapy: A Narrative Review. Mol. Neurobiol. 2018, 55, 6601–6636. [Google Scholar] [CrossRef] [PubMed]
- Montedori, A.; Abraha, I.; Orso, M.; D’Errico, P.G.; Pagano, S.; Lombardo, G. Lasers for caries removal in deciduous and permanent teeth. Cochrane Database Syst. Rev. 2016. [Google Scholar] [CrossRef]


| 1. Risk of Bias for Small Spot Size Articles | |||||||||||
| Citation [ref] | Random-Ization | Sample size Calculation and Required Number Included | Baseline Situation Similar | Blinding | Parameters of Laser Use Described and Calculations Correct | Power-Meter Used | Numerical Results Available (Stats) | No Missing Out-Come Data | All Samples/Patients Completed the Follow-Up | Correct Inter-Pretation of Data | Total Score/10 |
| SMALL SPOT SIZE | |||||||||||
| Sugaya [41] | Yes | Yes | Yes | Yes | Yes | No | Yes | Yes | No | Yes | 8 |
| Valenzuela [42] | Yes | Yes | Yes | Yes | Yes | Yes | Yes | Yes | Yes | Yes | 10 |
| Barbosa [43] | Yes | Yes | Yes | Yes | No | No | Yes | Yes | No | Yes | 7 |
| Dias [44] | Yes | Yes | Yes | Yes | Yes | Yes | Yes | Yes | No | Yes | 9 |
| Neves [45] | Yes | Yes | Yes | Yes | Yes | Yes | Yes | Yes | No | Yes | 9 |
| Rezade [46] | Yes | Yes | Yes | Yes | Yes | Yes | Yes | Yes | Yes | Yes | 10 |
| Tuk [47] | Yes | Yes | Yes | Yes | Yes | No | Yes | Yes | No | Yes | 8 |
| De Carli [48] | Yes | Yes | Yes | Yes | Yes | Yes | Yes | Yes | No | Yes | 9 |
| Machado [49] | Yes | Yes | Yes | Yes | No | No | Yes | Yes | No | Yes | 7 |
| Magri [50] | Yes | Yes | Yes | Yes | Yes | No | Yes | Yes | Yes | Yes | 9 |
| Ramalho [51] | Yes | Yes | Yes | Yes | Yes | No | Yes | Yes | Yes | Yes | 9 |
| Oton-Leite [52] | Yes | Yes | Yes | Yes | Yes | No | Yes | Yes | No | Yes | 8 |
| Ferrante [53] | Yes | Yes | Yes | Yes | No | No | Yes | Yes | Yes | Yes | 8 |
| Nobrega [54] | Yes | Yes | Yes | Yes | Yes | Yes | Yes | Yes | Yes | Yes | 10 |
| Marin Conde [55] | Yes | Yes | Yes | Yes | Yes | No | Yes | Yes | No | Yes | 8 |
| Silva [56] | Yes | Yes | Yes | Yes | No | No | Yes | Yes | Yes | Yes | 8 |
| 2. Risk of Bias for Medium Spot Size Articles | |||||||||||
| Citation [ref] | Random-Ization | Sample size Calculation and Required Number Included | Baseline Situation Similar | Blinding | Parameters of Laser Use Described and Calculations Correct | Power-Meter Used | Numerical Results Available (Stats) | No Missing Out-Come Data | All Samples/Patients Completed the Follow-Up | Correct Inter-Pretation of Data | Total Score/10 |
| MEDIUM SPOT SIZE | |||||||||||
| Arduino [57] | Yes | Yes | Yes | Yes | No | Yes | Yes | Yes | No | Yes | 8 |
| Elbay [58] | Yes | Yes | Yes | Yes | Yes | Yes | Yes | Yes | No | Yes | 9 |
| Ramirez [59] | Yes | No | Yes | Yes | No | No | Yes | Yes | Yes | Yes | 7 |
| Landucci [60] | Yes | No | Yes | Yes | No | No | Yes | Yes | No | Yes | 6 |
| Moosavi [61] | Yes | Yes | Yes | Yes | Yes | No | Yes | Yes | Yes | Yes | 9 |
| Amanat [62] | Yes | Yes | Yes | Yes | Yes | No | Yes | Yes | No | Yes | 8 |
| Shirani [63] | Yes | Yes | Yes | Yes | Yes | Yes | Yes | Yes | Yes | Yes | 10 |
| Ang Khaw [64] | Yes | Yes | Yes | Yes | Yes | No | Yes | Yes | Yes | Yes | 9 |
| Antunes [65] | Yes | Yes | Yes | Yes | No | No | Yes | Yes | No | Yes | 7 |
| 3. Risk of Bias for Large Spot Size Articles | |||||||||||
| Citation [ref] | Random-Ization | Sample size Calculation and Required Number Included | Baseline Situation Similar | Blinding | Parameters of laser Use Described and Calculations Correct | Power-Meter Used | Numerical Results Available (Stats) | No Missing Out-Come Data | All Samples/Patients Completed the Follow-Up | Correct Inter-Pretation of Data | Total Score/10 |
| LARGE SPOT SIZE | |||||||||||
| Aras [66] | Yes | Yes | Yes | Yes | No | No | Yes | Yes | Yes | Yes | 8 |
| Ustaoglu [67] | Yes | Yes | Yes | Yes | Yes | No | Yes | Yes | No | Yes | 8 |
| Asutay [68] | Yes | Yes | Yes | Yes | No | No | Yes | Yes | Yes | Yes | 8 |
| Ahrari [69] | Yes | Yes | Yes | Yes | Yes | Yes | Yes | Yes | Yes | Yes | 10 |
| Liang [70] | Yes | No | Yes | Yes | No | No | Yes | Yes | No | Yes | 6 |
| Amadori [71] | Yes | Yes | Yes | Yes | Yes | No | Yes | Yes | Yes | Yes | 9 |
| Caccianaga [72] | Yes | Yes | Yes | Yes | Yes | No | Yes | Yes | Yes | Yes | 9 |
| Gautam 2015 [73] | Yes | Yes | Yes | Yes | Yes | Yes | Yes | Yes | No | Yes | 9 |
| Gautam 2013 [74] | Yes | Yes | Yes | Yes | No | No | Yes | Yes | Yes | Yes | 8 |
| Nicotra [75] | Yes | Yes | Yes | Yes | No | No | Yes | Yes | No | Yes | 7 |
| Flieger [76] | Yes | Yes | Yes | Yes | Yes | No | Yes | Yes | Yes | Yes | 8 |
| Matys [77] | Yes | Yes | Yes | Yes | Yes | No | Yes | Yes | Yes | Yes | 9 |
| Feslihan [78] | Yes | Yes | Yes | Yes | No | No | Yes | Yes | Yes | Yes | 8 |
| Author (Ref)/Study Type | Number of Participants: Test (T) Control (C) | (i) Small Spot Size: Target Size cm2 (ii) Target: Superficial = 1 Deep = 2 | Area Exposed to Tip (cm2); Radiant Exposure (Fluence J/cm2); Total Energy Delivered (Joules) | Net Outcome (ΔOutcome Score) | Dose Commentary | Statistical Analysis: Test vs. Control Group |
|---|---|---|---|---|---|---|
| Sugaya [41] RCT DB BMS | T = 13 C = 10 | 2.0 1 | 1.0 0.24 N/R | 0 | Scanning technique 2 s/spot of 0.03 cm2 Dose insufficient | Test > control, although ns. VAS Remission of symptoms: test 46% control 40% N/S |
| Valenzuela [42] RCT B BMS | T gp.1 = 16. T gp.2 = 16. C = 12 | 2.0 1 | 0.3 133/200 Gp. 1: 4.0/Gp 2: 60 | 1 | Small area treated High radiant exposure, low volume exposed | Tests 1 and 2 > control: 15.7% vs. 7.3% VAS VAS score 16% improvement with test outcomes. |
| Barbosa [43] RCT DB BMS | T = 25 C = 19 C gp.2 (normal) = 8 | 2.0 1 | N/R 3.0/4.28 N/R | 0 | Low irradiance (30 mW), multiple points/small spot size | Test = Control VAS Equivalence of laser to ALA |
| Dias [44] RCT DB WH | T = 16 C = 16 | 1.0 1 | 0.15 3.0 N/R | 3 | Low irradiance (30 mW), multiple points to cover target | Test > control. D14 T = 16.4 (SD9.6) C = 26.2 (SD 10.6) D45 T = 5.9 (SD 1.9) C = 13.6 (SD 3.8) Wound Area D represents day 14 or 45. 40% reduction vs control T1 57% reduction vs. Control T2 |
| Neves [45] RCT DB WH | T gp.1 = 18. T gp.2 = 18. C = 18 | 1.0 1 | 0.06 3 /60 Gp 1: 0.9/Gp 2: 1.8 | 1 | Low irradiance (30 mW), smaller area treated than target size | Test > control T 1 =14.4 (SD 5.1) T 2 = 14.3 (SD 6.1). C = 11.4 (SD 4) Measure: colourimetry, wound area. Significant: T1 (group 1 only) |
| Rezade [46] RCT B WH | T = 40 C = 42 | 6.0 2 | 0.28 100 28 | 0 | Deep target, large area to treat: low dose to each point & small area treated | Test > Control N/S. T1 = 41.18 (SD13.03) C = 34.55 (SD 3.22) T2 = 36.6 (SD 7.98) C = 34.82 (SD 11.58) Measure: mouth opening T1 = Men T2 = Women |
| Tuk [47] RCT B Pain | T = 80 C = 83 | 1.0 2 | 0.08 148.5 11.88 | 0 | Small area treated: dose to target insufficient? | Test = Control T = 4.1 (SD 2.4) C = 4.2 (SD 2.7) VAS |
| De Carli [48] RCT DB Pain | T (gp.1) = 11 T (gp.2) = 10 C = 11 | 6.0 2 | 0.28 100 28 | 0 | Large and deeper target: small area treated. Dose low? | Test gp.1/2 = Control N/S Equivalence test gps to control VAS |
| Machado [49] RCT DB Pain | T = 42 C (gp.1) = 40 C (gp.2) = 20 | 6.0 2 | 0.2 60 12 | 1 | Large and deeper target: small area treated. Dose low? | T= 1.6 C (gp.2 =1.1) p < 0.001 VAS |
| Magri [50] RCT DB Pain | T = 20 C (gp.1) = 21 C (gp.2) = 23 | 6.0 2 | 0.34 5.9/7.5 Gp 1: 0.9/Gp 2: 1.4 | 0 | Large and deeper target: small area treated. Dose low? | T = C (gp.1) T/C (gp.1) > C (gp.2) VAS C1 = Placebo C2 = No treatment |
| Ramalho [51] RCT B Pain | T (gp.1) = 15 T (gp.2) = 15 C (gp.1) = 15 C (gp.2) = 15 | 1.0 2 | 0.04 4/40 Gp 1: 0.32/Gp 2: 3.2 | 0 | Dose low | T = C (gp.1) T/C(gp.1) > C (gp.2) VAS C1 = Placebo C2 = No treatment |
| Oton-Leite [52] RCT DB OM | T = 15 C = 15 | 6.0 1 | 1.72 6.2 10.75 | 3 | Oral mucositis High number of points low irradiance | T > C 50–75% reduction in OM in T vs. C OM Severity Test vs. Placebo |
| Ferrante [53] RCT B WH | T = 15 C = 15 | 6.0 2 | 0.08 225 18 | 1 | Deep target, low dose | Measure: mouth opening Test: <swelling/trismus |
| Nobrega [54] RCT DB Pain | T = 30 C = 30 | 1.0 2 | 0.15 38/76 Gp 1: 5/Gp 2: 2.3 | 3 | Low dose but: high radiant exposure to apex 76 J/cm2 | VAS Test vs. placebo no nil intervention |
| Marin Conde [55] RCT DB OM | T = 11 C = 15 | 6.0 1 | 2.6 83.3 216 | 3 | Oral mucositis High radiant exposure large number of points | T > C 50% + reduction OM OM Severity Test vs. placebo no nil intervention |
| Silva [56] RCT DB OM | T =19 C =20 | 6.0 1 | 3.2 4.0 12.8 | 3 | Oral mucositis Low radiant exposure large number of points | OM severity Test vs. Nil Marked reduction severity and incidence OM |
| Author (Ref)/Study Type | Number of Participants: Test (T) Control (C) | (i) Medium Spot Size: Target Size cm2 (ii) Medium Spot Size: Target Superficial = 1 Deep = 2 | Area Exposed to Tip (cm2): Radiant Exposure (Fluence J/cm2) Total Energy Delivered (J) | Net Outcome (ΔOutcome Score) | Dose Commentary | Statistical Analysis: Test vs. Control Group |
|---|---|---|---|---|---|---|
| Arduino [57] RCT B OM | T = 18 C = 15 | 2.0 1 | 0.28 10.7 3.0 | 1 | Incomplete data | Outset: VAS 3.35 (SD 2.18) Time (T4): 3.47. (SD 2.14) |
| Elbay [58] RCT DB Pain | T = 49 C = 49 | 1.0 2 | 0.6 90 N/R | 0 | Target at depth, dose at surface too low? | Outset VAS 2.05 (SD 2.027). Post 0.11 (SD 0.727) |
| Ramirez [59] RCT DB Split Mouth Pain | T = 20 C = 20 | 6.0 2 | 3.14 1.55 12.8 | 0 | Scanning technique to cover area, target at depth: dose too low? | VAS Outset 52.47 (SD 7.05) T (24 hours) 30.74 (SD 8.94) |
| Landucci [60] RCT DB Split Mouth Pain | T = 22 C = 22. | 6.0 2 | 0.126 2.39 0.3 | 1 | Target at depth, large target: dose low | VAS outset 0.27. T2 = 3.86 |
| Moosavi [61] RCT DB Pain | T (gp.1) = 14 T (gp.2) = 12. C = 15 | 1.0 2 | 0.25 12.0 3.0 | 3 | Best effect with 810 nm. Small target (pulp), and good transmission via (dentine) | VAS outset 21.11 (SD 18.19). Time 1: 51.94 (SD 20.8) Time 2: 17.77 (SD 13.57). |
| Amanat [62] RCT DB Pain | T = 30 C = 30 | 6.0 2 | 0.283 12.73 3.6 | 0 | Large target at depth: dose too low | VAS outset: 7.5 (SD 2.3). VAS post Rx: 3 (SD 3.7) |
| Shirani [63] RCT DB Pain | T = 8. C = 8 | 6.0 2 | 0.6 6.2 6.3 | 1 | Multiple points (number not specified) | VAS outset 4 (SD 1.5). VAS post Rx 2.5. (SD 1.5) |
| Ang Khaw [64] RCT DB Split Mouth WH | T = 20 C = 20 | 1.0 2 | 0.26 3.6 8.0 | 0 | Too low: 7.6 J total to sub-surface target | Wound area VAS outset 0.27 T2: 3.86. T3: 1.41 |
| Antunes [65] RCT DB OM | T = 47 C = 47 | 6.0 1 | 17.28 4.2 72.0 | 4 | Oral mucositis: multiple points large area | OM severity Incidence OM Grade 3 C = 40.5% grade 1/2 = 21.3% |
| Author (Ref)/Study Type | Number of Participants: Test (T) Control (C) | (i) Large Spot Size: Target Size cm2 (ii) Large Spot Size: target Superficial = 1 Deep = 2 | Area Exposed to Tip (cm2): Radiant Exposure (Fluence J/cm2) Total Energy Delivered (J) | Outcome (ΔOutcome Score) | Dose Commentary | Statistics Control Group |
|---|---|---|---|---|---|---|
| Aras [66] RCT B WH | T = 32 C = 16 | 2.0 2 | 3.0 4.0 12 | 2 | Incomplete data 3rd molar extractions measures: inter- incisal opening | Measure: mouth opening C-D0: 45. C-D2: 21.1 (SD5.2) C-D7: 29(SD 6.2) |
| Ustaoglu [67] RCT DB WH | T = 20 C = 20 | 1.0 1 | 2.8 2.86 8.0 | 1 | Gated mode peak power 3 x average Gaussian beam | Wound area C -D0: 0 C-D14: 82. C-D21: 0 (H2O2) |
| Asutay [68] RCT DB WH/Pain | T = 15 C (gp.1) = 15 C (gp.2) = 15 | 2.0 2 | 3.0 4.0 12 | 1 | Large target at depth: dose low. Control gp.3 placebo | Measure: mouth opening. VAS T > C for VAS reduction |
| Ahrari [69] RCT DB WH/Pain | T = 10 C = 10 | 6.0 2 | 1.76 3.4 6.0 | 1 | Large target at depth: dose low. Placebo vs. Test VAS / inter-incisal | Measure: mouth opening. VAS C -D0: 26.9 (SD 7.78) C-D56: 29.36 (SD 6.46) |
| Liang [70] RCT DB Pain | T = 30. C = 30 | 1.0 2 | 1.0 3.6 3.6 | 3 | Small sub-surface target (pulp), good optical transmission (dentine) | EPT C = 1.9%. (T = 52.8%) |
| Amadori [71] RCT DB OM/Pain | T = 62 C = 61 | 6.0 1 | 1.0 4.5 4.5 | 1 | Treatment target analgesia: dose low | OM severity. VAS C >T |
| Caccianaga [72] RCT DB OTM | T = 18 C = 18 | 6.0 2 | 6.0 24 150 | 3 | Sub-surface target: dose optimal (flat top beam profile) | OTM Alignment D: C = 284.1. Test D: 211.8 |
| Gautam 2015 [73] RCT DB Om/Pain | T = 23 C = 26 | 6.0 1 | 12 3.0 36 | 3 | Oral mucositis: large target at surface | OM severity OM C >> T VAS C > T |
| Gautam 2012 [74] RCT TB OM/Pain | T =115 C = 124 | 6.0 1 | 6.0 3.5 21 | 4 | Oral mucositis: large target at surface | OM severity. VAS OM C = 77/110 ( T= 25/110) (Pain C >>T |
| Nicotra [75] RCT B Pain | T = 19 C = 37 | 1.0 2 | 1.0 30 30 | 2 | Ortho pain 3 × 10 s Test/Control C1 and C2(placebo) | VAS C > T |
| Flieger [76] RCT B Implants | T = 20 C = 20 | 1.0 2 | 0.5024 40 20 | 3 | Implant stability | IS C << T |
| Matys [77] RCT Implants | T = 12 C =12 | 1.0 2 | 0.5024 40 8.0 | 1 | Implant stability | IS C < T |
| Feslihan [78] RCT B WH/Pain | T= 30 C =30 | 2.0 2 | 3.0 6.0 18 | 0 | Third molars test vs prednisolone. No control: measure of steroid vs. Laser: equivalence | Measure: mouth opening. VAS C = T |
© 2020 by the authors. Licensee MDPI, Basel, Switzerland. This article is an open access article distributed under the terms and conditions of the Creative Commons Attribution (CC BY) license (http://creativecommons.org/licenses/by/4.0/).
Share and Cite
Cronshaw, M.; Parker, S.; Anagnostaki, E.; Mylona, V.; Lynch, E.; Grootveld, M. Photobiomodulation Dose Parameters in Dentistry: A Systematic Review and Meta-Analysis. Dent. J. 2020, 8, 114. https://0-doi-org.brum.beds.ac.uk/10.3390/dj8040114
Cronshaw M, Parker S, Anagnostaki E, Mylona V, Lynch E, Grootveld M. Photobiomodulation Dose Parameters in Dentistry: A Systematic Review and Meta-Analysis. Dentistry Journal. 2020; 8(4):114. https://0-doi-org.brum.beds.ac.uk/10.3390/dj8040114
Chicago/Turabian StyleCronshaw, Mark, Steven Parker, Eugenia Anagnostaki, Valina Mylona, Edward Lynch, and Martin Grootveld. 2020. "Photobiomodulation Dose Parameters in Dentistry: A Systematic Review and Meta-Analysis" Dentistry Journal 8, no. 4: 114. https://0-doi-org.brum.beds.ac.uk/10.3390/dj8040114