
Influence of Dental Implant Diameter and Bone Quality on the Biomechanics of Single-Crown Restoration. A Finite Element Analysis

 , ,
, ,
Abstract
:1. Introduction
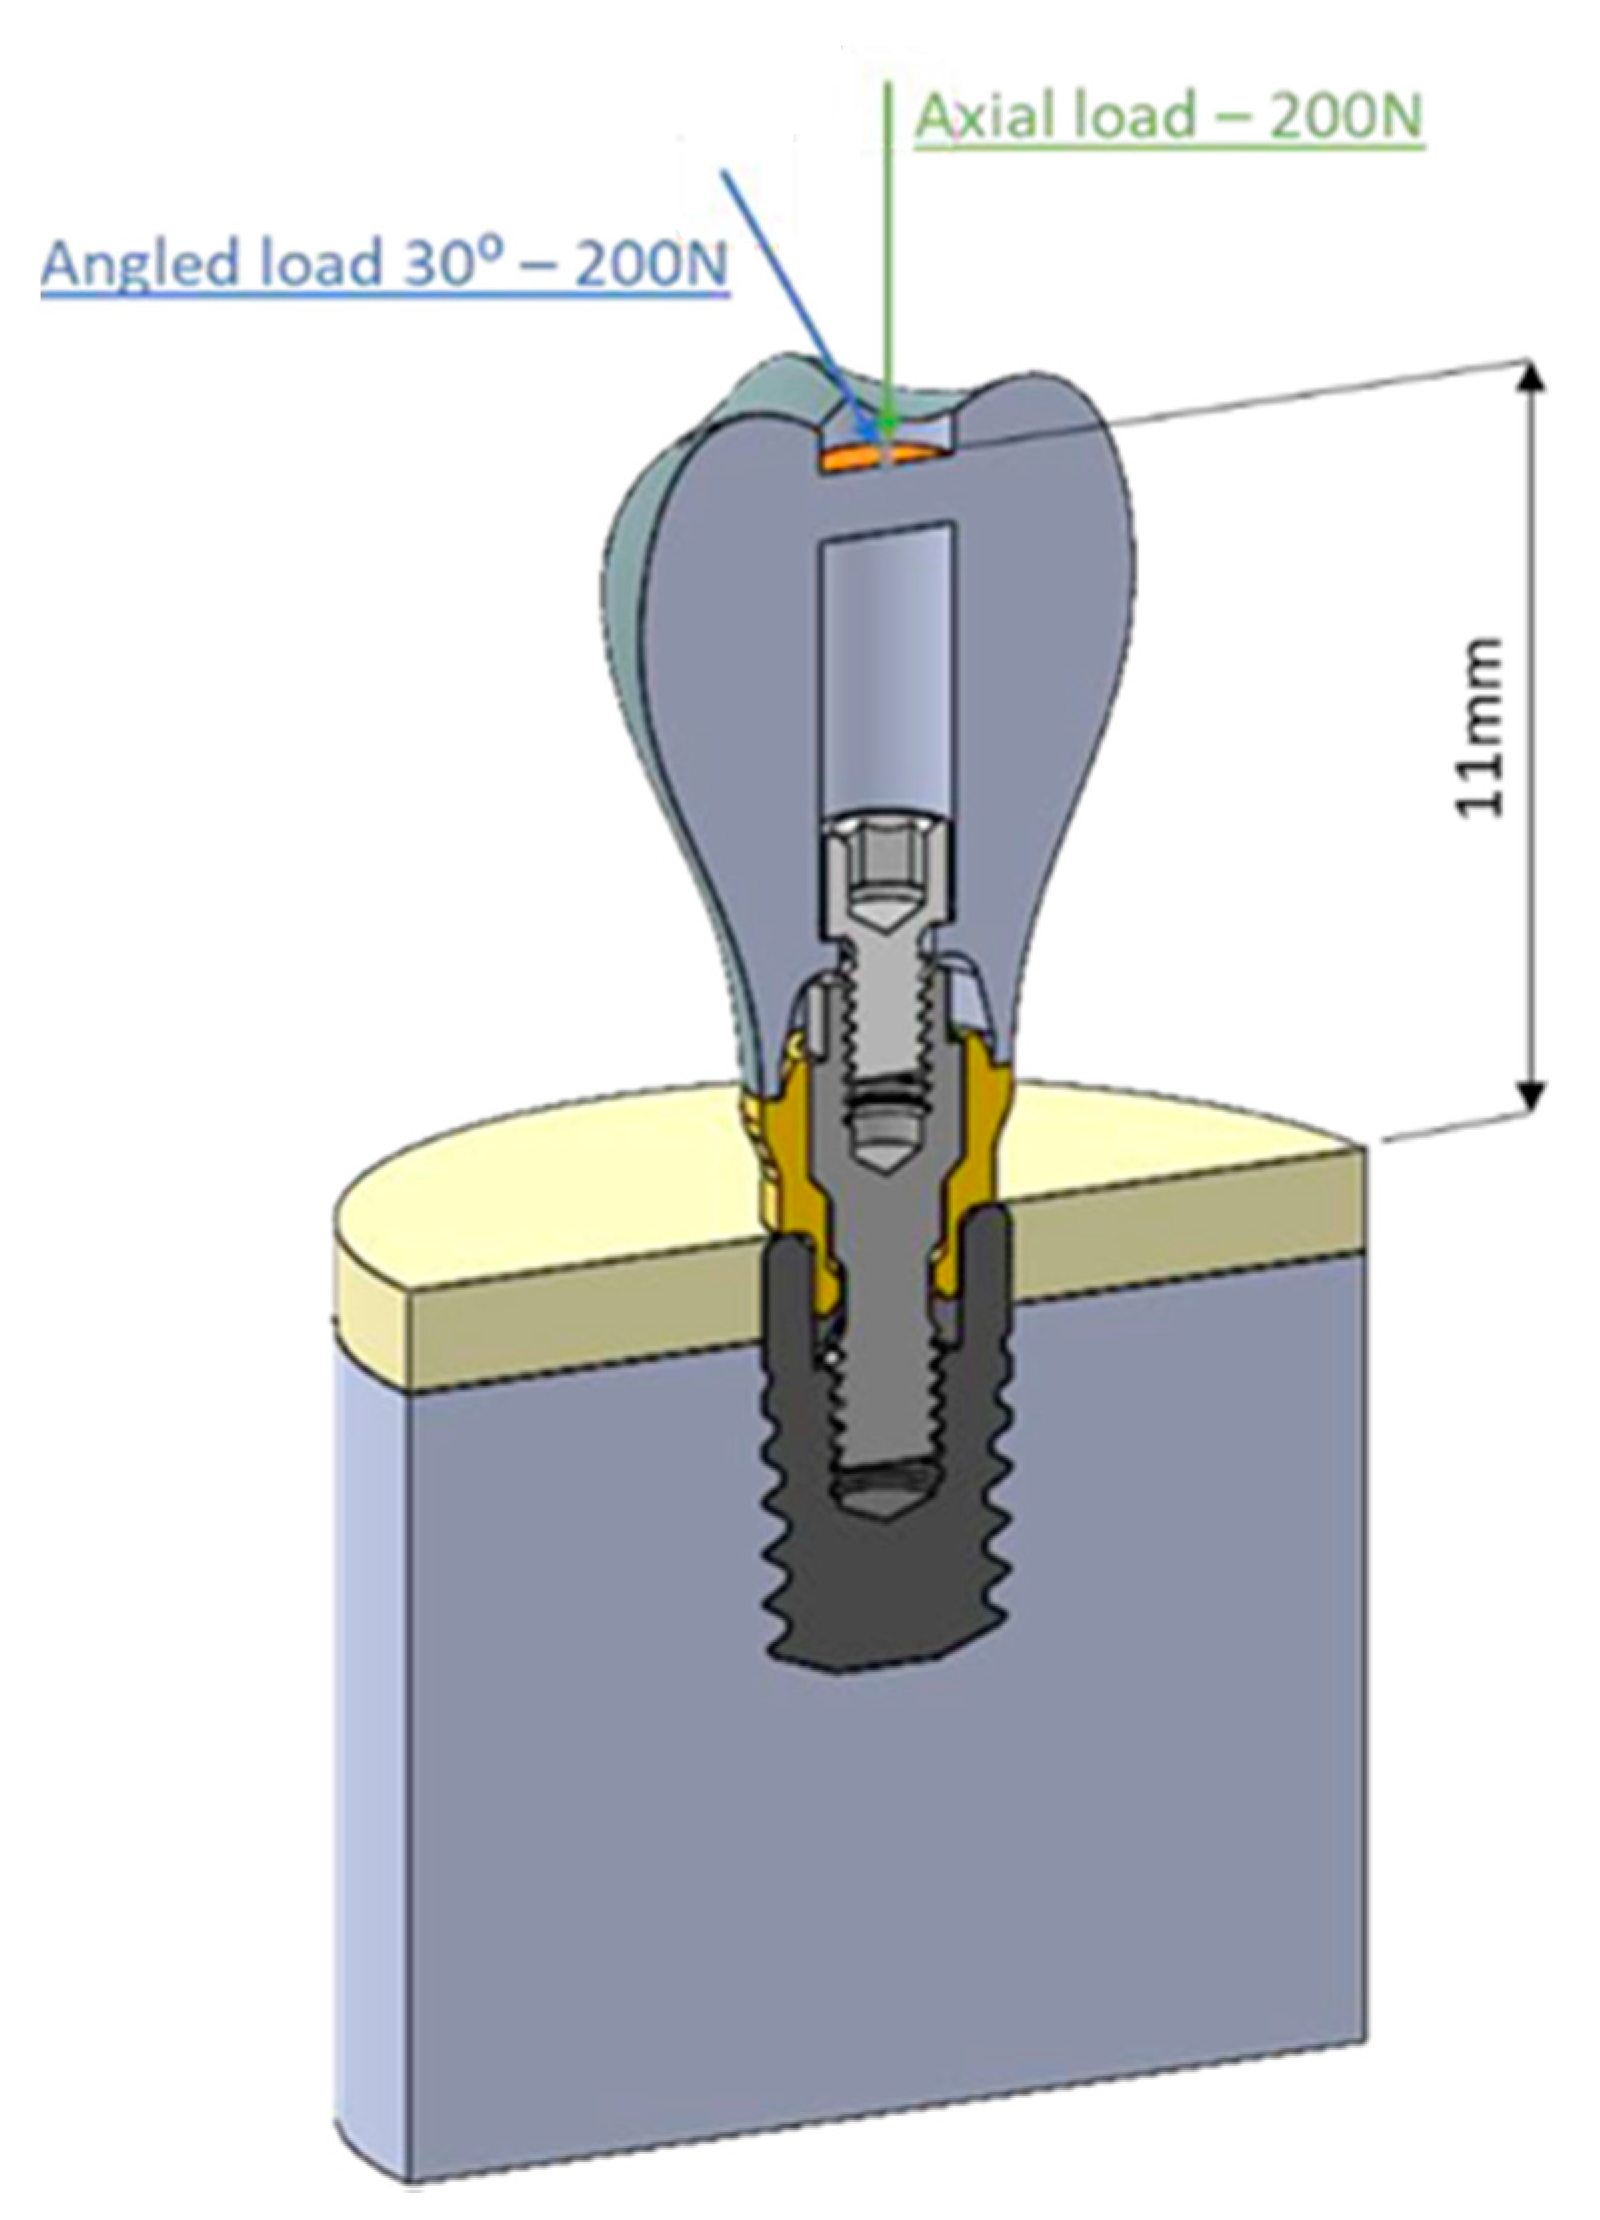
2. Material and Methods


| COMPONENT | MATERIAL | ELASTIC MODULUS (MPa) | POISSON COEF. |
|---|---|---|---|
| Dental Implant | Commercially pure titanium [22] | 105,000 | 0.37 |
| Prosthesis screw | Titanium alloy [22] | 113,800 | 0.342 |
| Transepithelial bodyl | Commercially pure titanium [22] | 105,000 | 0.37 |
| Transepithelial screw | Titanium alloy [22] | 113,800 | 0.342 |
| Prosthesis | Co-Cr alloy [20] | 218,000 | 0.33 |
| N/A | Cortical bone [20] | 13,700 | 0.28 |
| N/A | Cancellous bone [20] | 1370 | 0.3 |
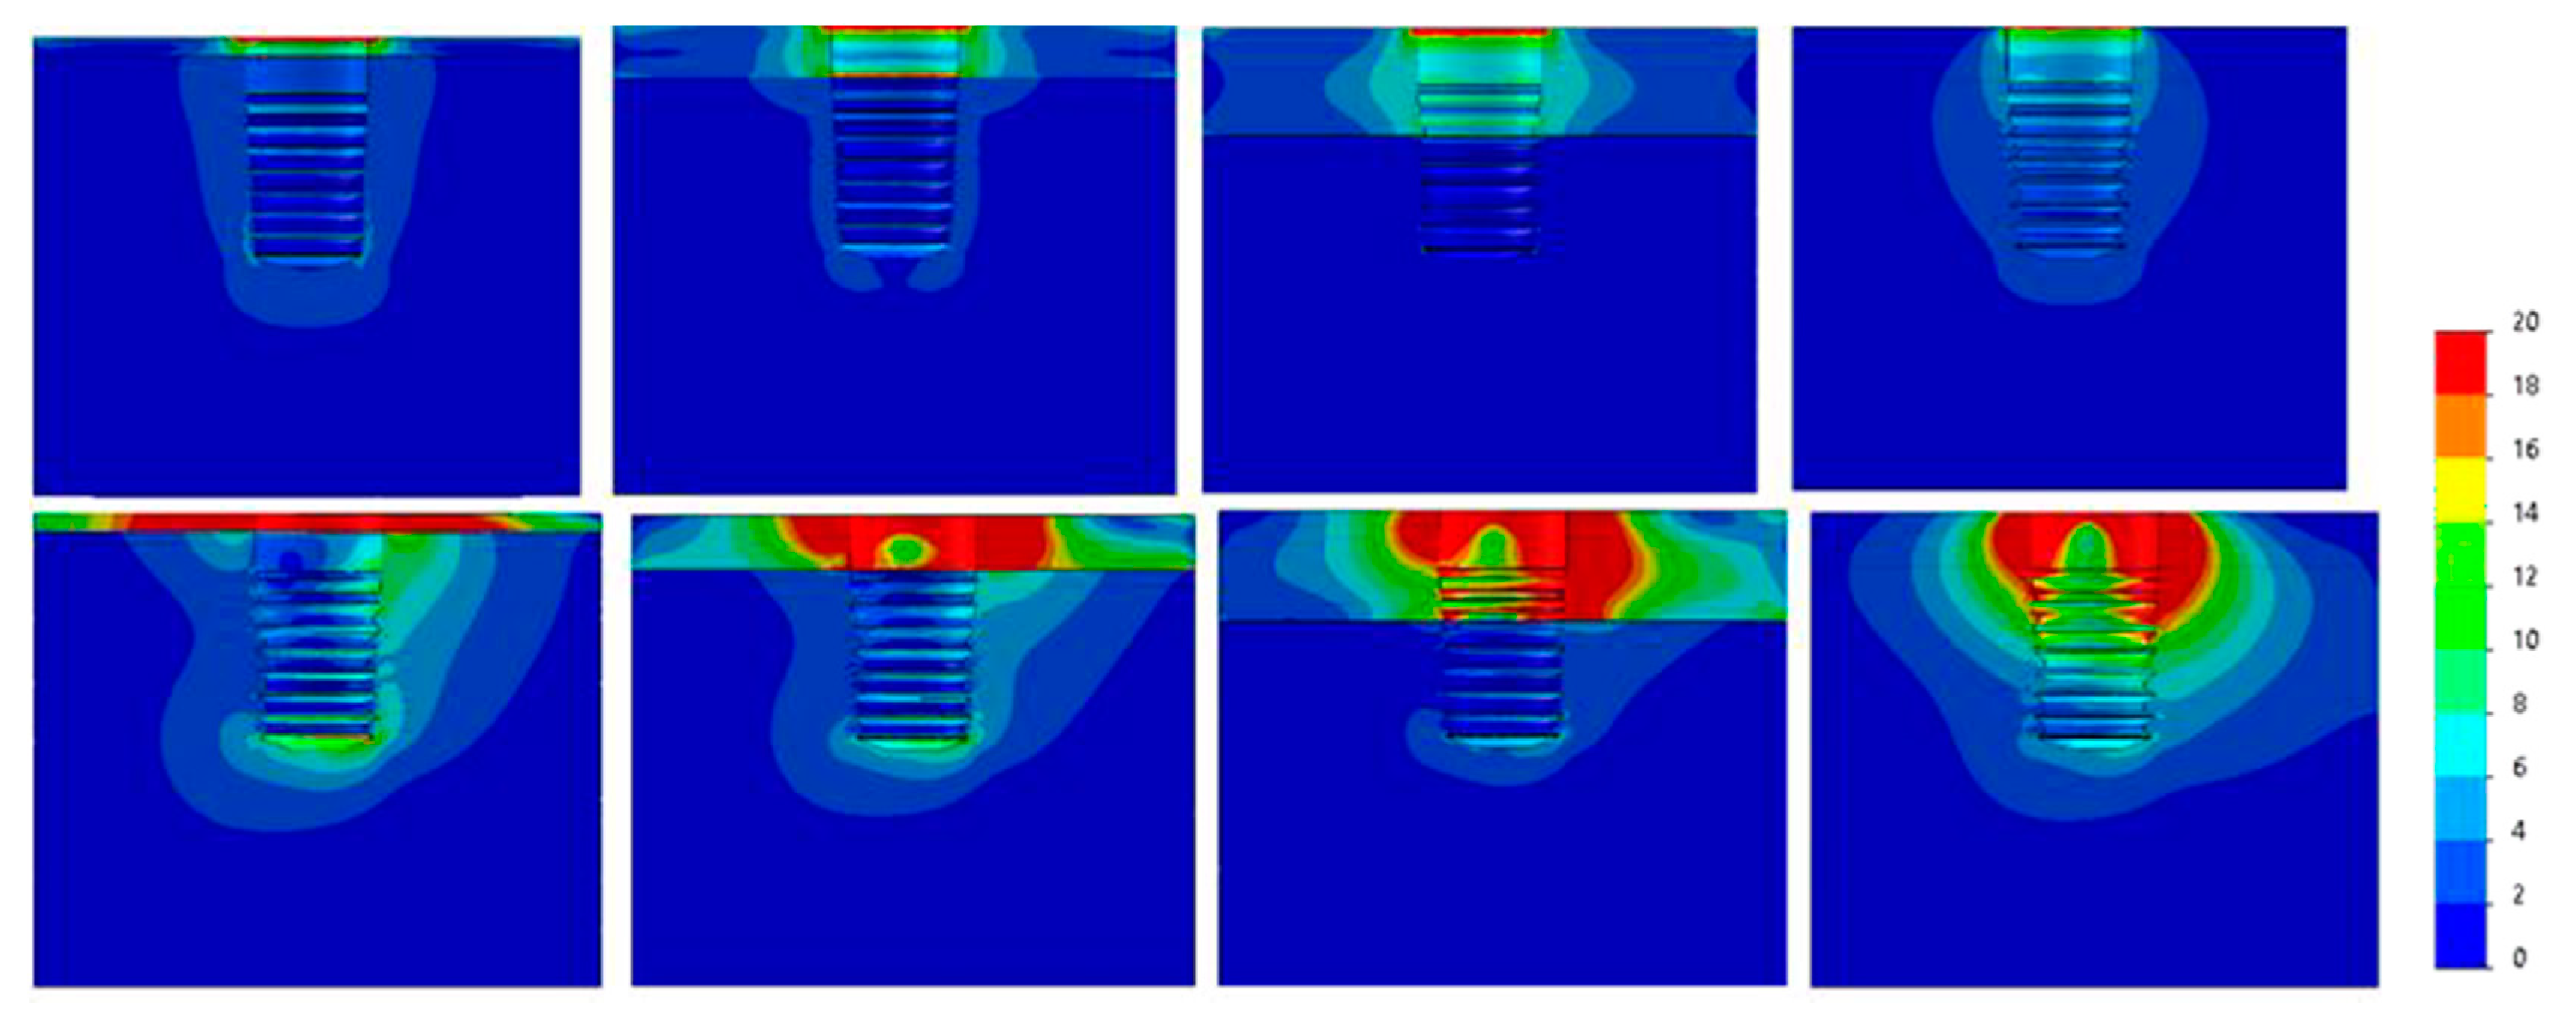
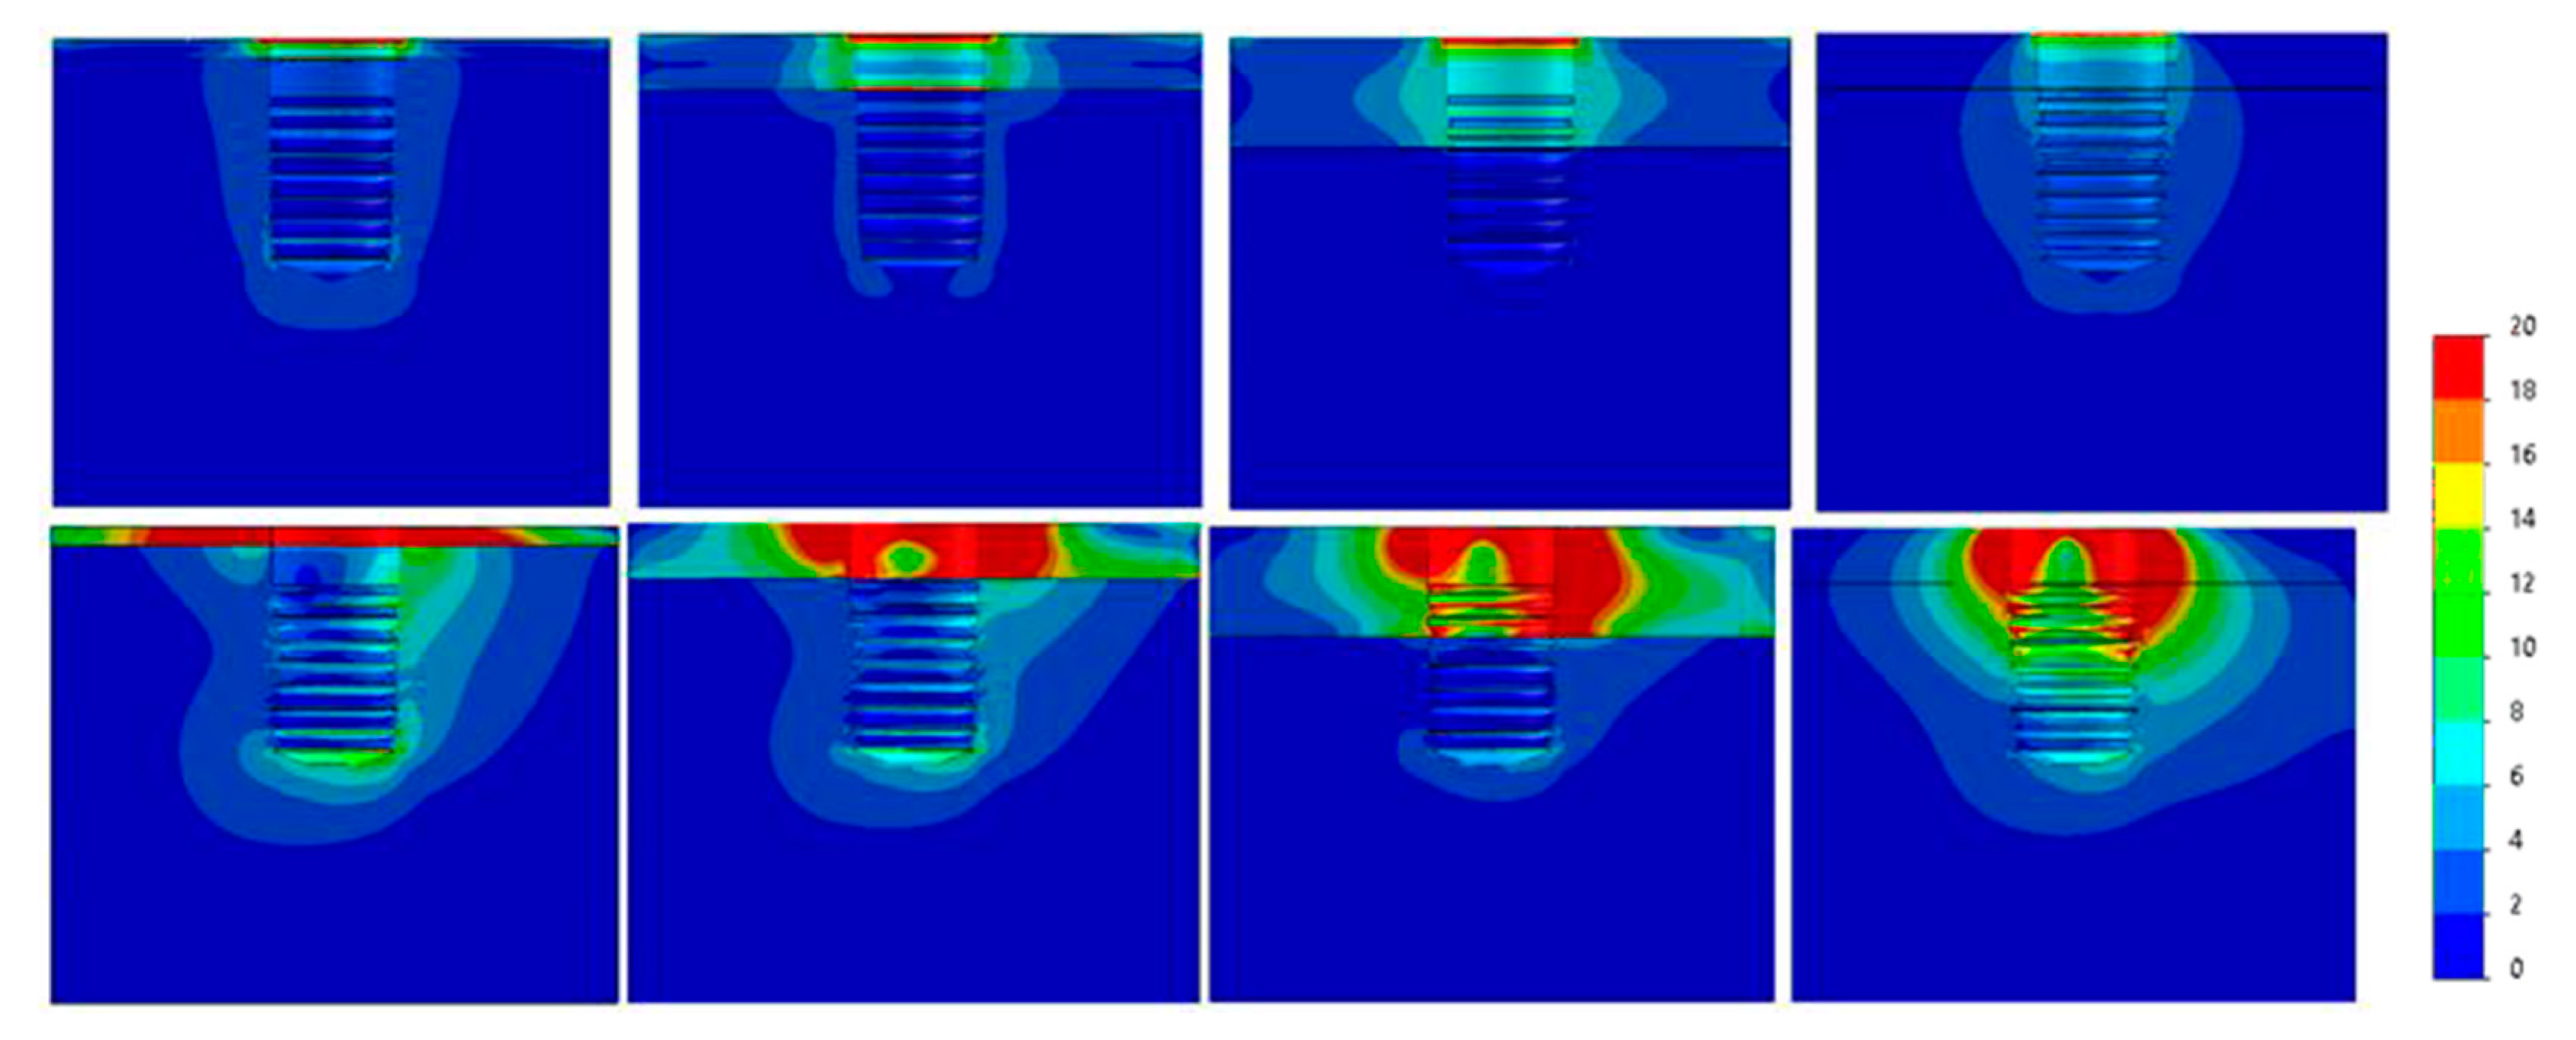
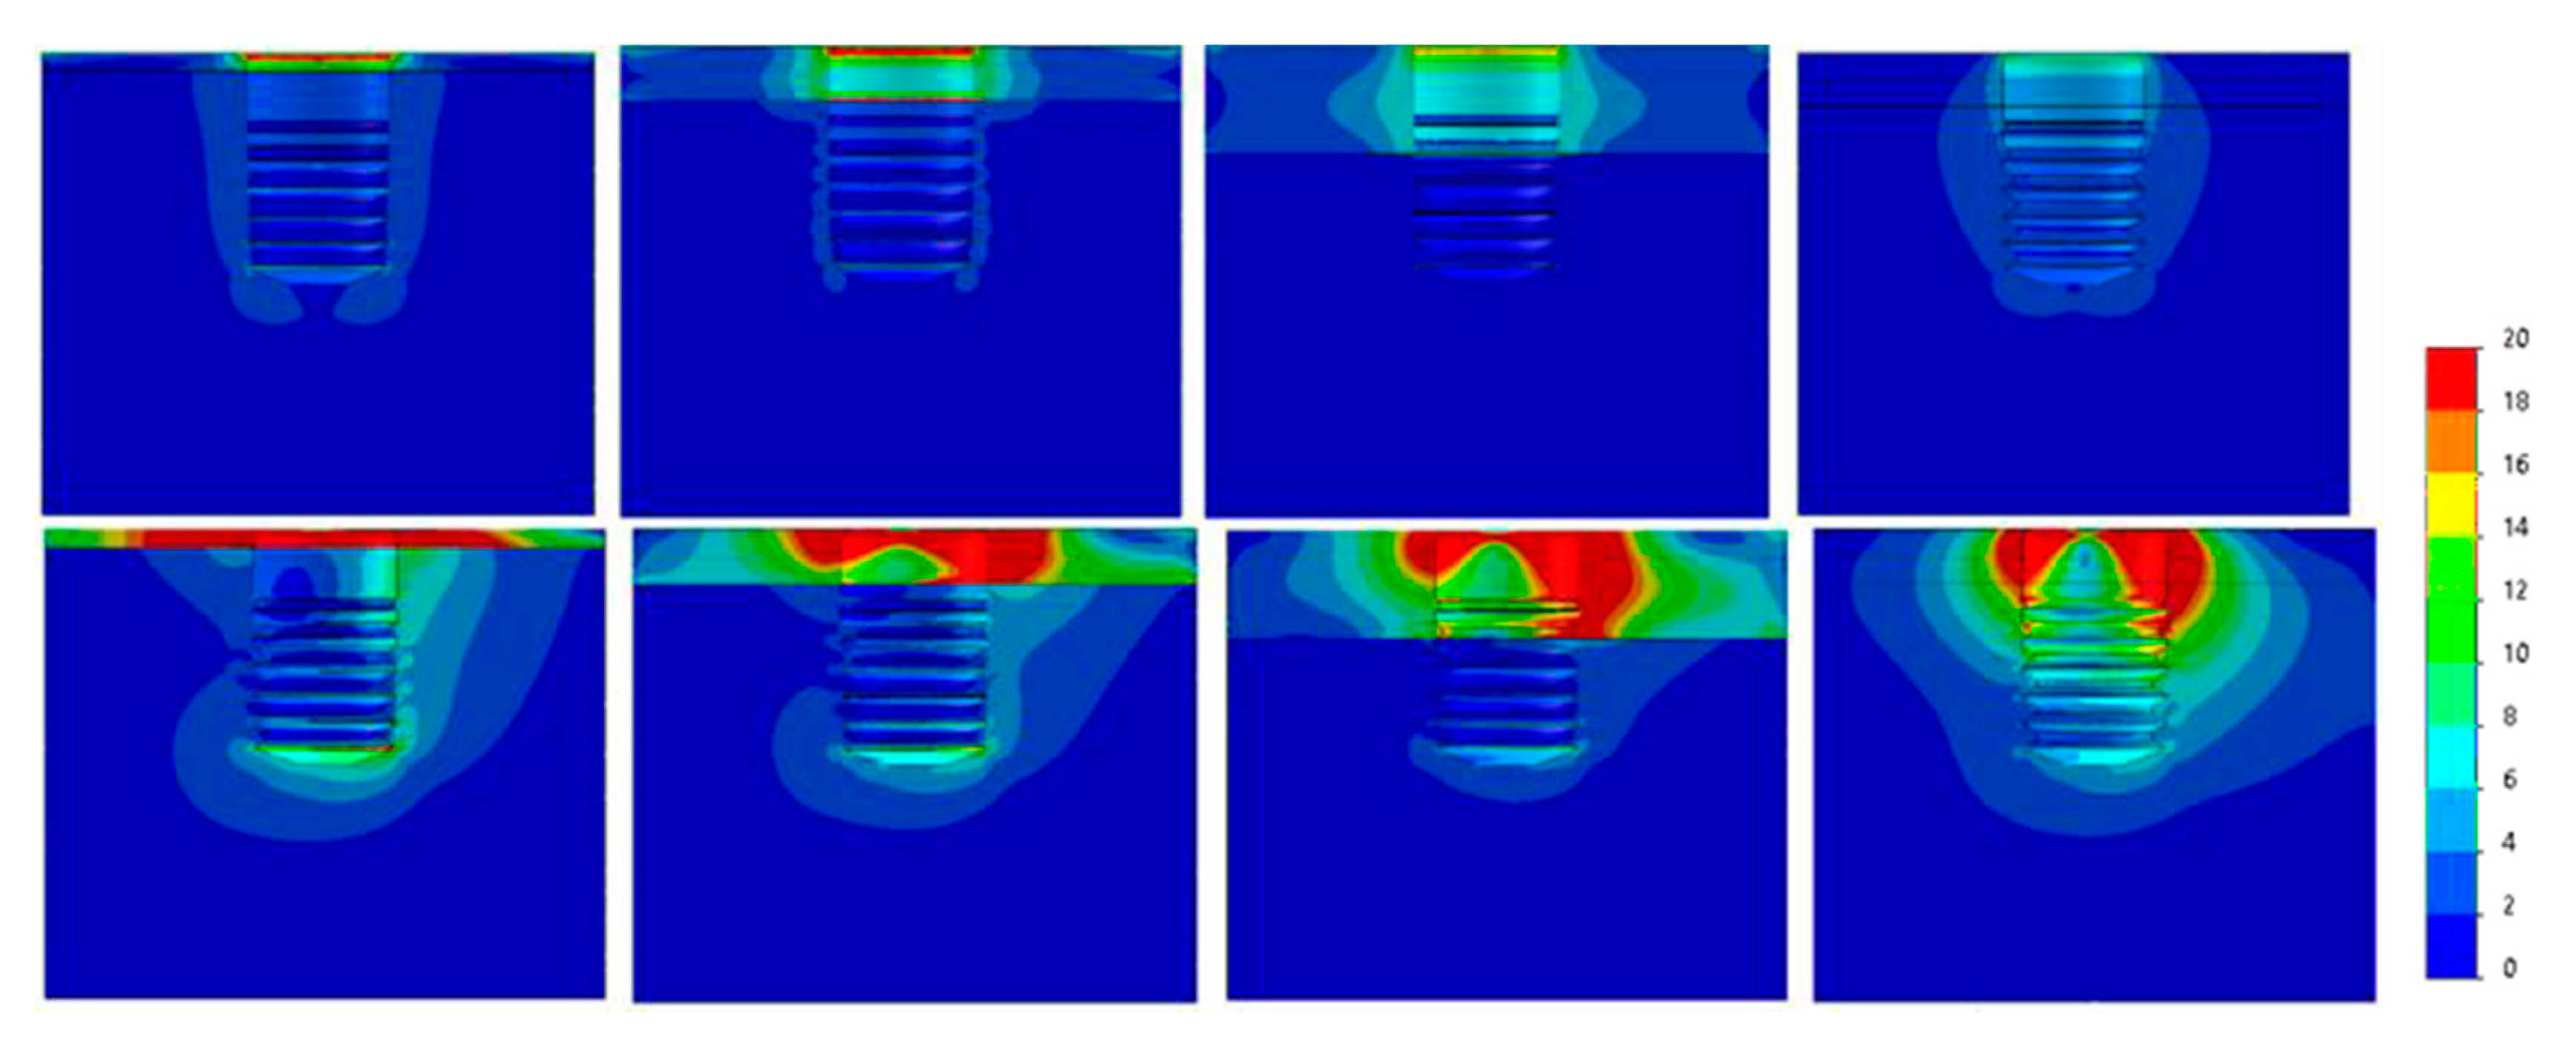
3. Results
4. Discussion
5. Conclusions
Author Contributions
Funding
Informed Consent Statement
Data Availability Statement
Conflicts of Interest
References
- Geng, J.-P.; Tan, K.B.C.; Liu, G.-R. Application of finite element analysis in implant dentistry: A review of the literature. J. Prosthet. Dent. 2001, 85, 585–598. [Google Scholar] [CrossRef] [PubMed] [Green Version]
- Anitua, E. The biomechanics of the short implant. In Short and Extra-Short Implants; Anitua, E., Ed.; Team Work Media España: Vitoria, Spain, 2017; p. 57. [Google Scholar]
- Huang, H.-L.; Hsu, J.-T.; Fuh, L.-J.; Tu, M.-G.; Ko, C.-C.; Shen, Y.-W. Bone stress and interfacial sliding analysis of implant designs on an immediately loaded maxillary implant: A non-linear finite element study. J. Dent. 2008, 36, 409–417. [Google Scholar] [CrossRef]
- Baggi, L.; Cappelloni, I.; Di Girolamo, M.; Maceri, F.; Vairo, G. The influence of implant diameter and length on stress distribution of osseointegrated implants related to crestal bone geometry: A three-dimensional finite element analysis. J. Prosthet. Dent. 2008, 100, 422–431. [Google Scholar] [CrossRef] [Green Version]
- Anitua, E.; Tapia, R.; Luzuriaga, F.; Orive, G. Influence of implant length, diameter, and geometry on stress distribution: A finite element analysis. Int. J. Periodontics Restor. Dent. 2010, 30, 89–95. [Google Scholar]
- Urdaneta, R.A.; Leary, J.; Lubelski, W.; Emanuel, K.M.; Chuang, S.K. The effect of implant size 5 × 8 mm on crestal bone levels around single-tooth implants. J. Periodontol. 2012, 83, 1235–1244. [Google Scholar] [CrossRef]
- Nissan, J.; Ghelfan, O.; Gross, O.; Priel, I.; Gross, M.; Chaushu, G. The Effect of Crown/Implant Ratio and Crown Height Space on Stress Distribution in Unsplinted Implant Supporting Restorations. J. Oral Maxillofac. Surg. 2011, 69, 1934–1939. [Google Scholar] [CrossRef]
- Dos, L.P.; Renouard, F.; Renault, P.; Barquins, M. Influence of Implant Length and Bicortical Anchorage on Implant Stress Distribution. Clin. Implant. Dent. Relat. Res. 2003, 5, 254–262. [Google Scholar] [CrossRef]
- Eazhil, R.; Swaminathan, S.V.; Gunaseelan, M.; Kannan, G.V.; Alagesan, C. Impact of implant diameter and length on stress distribution in osseointegrated implants: A 3D FEA study. J. Int. Soc. Prev. Community Dent. 2016, 6, 590–596. [Google Scholar] [CrossRef] [Green Version]
- Anitua, E.; Alkhraisat, M.; Piñas, L.; Orive, G. Efficacy of biologically guided implant site preparation to obtain adequate primary implant stability. Ann. Anat. Anat. Anz. 2015, 199, 9–15. [Google Scholar] [CrossRef]
- Rabel, A.; Köhler, S.G.; Schmidt-Westhausen, A.M. Clinical study on the primary stability of two dental implant systems with resonance frequency analysis. Clin. Oral Investig. 2007, 11, 257–265. [Google Scholar] [CrossRef]
- Velazquez, F.A.; Castillo-Oyagüe, R.; Oliveros-López, L.-G.; Torres-Lagares, D.; Martínez-González, Á.-J.; Pérez-Velasco, A.; Lynch, C.D.; Gutiérrez-Pérez, J.-L.; Serrera-Figallo, M.-Á. Influence of bone quality on the mechanical interaction between implant and bone: A finite element analysis. J. Dent. 2019, 88, 103161. [Google Scholar] [CrossRef]
- Anitua, E.; Alkhraisat, M. Clinical Performance of Short Dental Implants Supporting Single Crown Restoration in the Molar-Premolar Region: Cement Versus Screw Retention. Int. J. Oral Maxillofac. Implant. 2019, 34, 969–976. [Google Scholar] [CrossRef]
- Guljé, F.L.; Raghoebar, G.M.; Vissink, A.; Meijer, H.J.A. Single crowns in the resorbed posterior maxilla supported by either 6-mm implants or by 11-mm implants combined with sinus floor elevation surgery: A 1-year randomised controlled trial. Eur. J. Oral Implant. 2014, 7, 247–255. [Google Scholar]
- Mezzomo, L.A.; Miller, R.; Triches, D.; Alonso, F.; Shinkai, R. Meta-analysis of single crowns supported by short (<10 mm) implants in the posterior region. J. Clin. Periodontol. 2014, 41, 191–213. [Google Scholar]
- Meijer, H.J.A.; Boven, C.; Delli, K.; Raghoebar, G.M. Is there an effect of crown-to-implant ratio on implant treatment outcomes? A systematic review. Clin. Oral Implant. Res. 2018, 29, 243–252. [Google Scholar] [CrossRef] [PubMed]
- Guljé, F.L.; Raghoebar, G.M.; Al Erkens, W.; Meijer, H.J. Impact of Crown-Implant Ratio of Single Restorations Supported by 6-mm Implants: A Short-Term Case Series Study. Int. J. Oral Maxillofac. Implant. 2016, 31, 672–675. [Google Scholar] [CrossRef] [Green Version]
- Lekohlm, U.Z.G. Patient selection and preparation. In Tissue-Integrated Prostheses: Osseointegration in Clinical Dentistry; Zarb, G.A., Branemark, P.I., Alberktsson, T., Eds.; Quintessence Publishing: Chicago, IL, USA, 1985; pp. 199–209. [Google Scholar]
- Sato, Y.; Teixeira, E.; Tsuga, K.; Shindoi, N. The effectiveness of a new algorithm on a three-dimensional finite element model construction of bone trabeculae in implant biomechanics. J. Oral Rehabil. 1999, 26, 640–643. [Google Scholar] [CrossRef] [PubMed]
- Capatti, R.S.; Barboza, M.S.; Antunes, A.N.D.G.; Oliveira, D.D.; Seraidarian, P.I. Viability of Maxillary Single Crowns Supported by 4-mm Short Implants: A Finite Element Study. Int. J. Oral Maxillofac. Implant. 2020, 35, e41–e50. [Google Scholar] [CrossRef] [PubMed]
- Doganay, O.; Kilic, E. Comparative Finite Element Analysis of Short Implants with Different Treatment Approaches in the Atrophic Mandible. Int. J. Oral Maxillofac. Implant. 2020, 35, e69–e76. [Google Scholar] [CrossRef] [PubMed]
- Moreira de Melo, E.J., Jr.; Francischone, C.E. Three-dimensional finite element analysis of two angled narrow-diameter implant designs for an all-on-4 prosthesis. J. Prosthet Dent. 2020, 124, 477–484. [Google Scholar] [CrossRef]
- Akça, K.; Iplikçioğlu, H. Finite element stress analysis of the influence of staggered versus straight placement of dental implants. Int. J. Oral Maxillofac. Implant. 2001, 16, 722–730. [Google Scholar]
- Okumura, N.; Stegaroiu, R.; Kitamura, E.; Kurokawa, K.; Nomura, S. Influence of maxillary cortical bone thickness, implant design and implant diameter on stress around implants: A three-dimensional finite element analysis. J. Prosthodont. Res. 2010, 54, 133–142. [Google Scholar] [CrossRef] [PubMed]
- Qian, L.; Todo, M.; Matsushita, Y.; Koyano, K. Effects of implant diameter, insertion depth, and loading angle on stress/strain fields in implant/jawbone systems: Finite element analysis. Int. J. Oral Maxillofac. Implants 2009, 24, 877–886. [Google Scholar] [PubMed]
- Barewal, R.M.; Stanford, C.; Weesner, T.C. A randomized controlled clinical trial comparing the effects of three loading protocols on dental implant stability. Int. J. Oral Maxillofac. Implant. 2012, 27, 945–956. [Google Scholar]
- Nevins, M.; Nevins, M.L.; Schupbach, P.; Fiorellini, J.; Lin, Z.; Kim, D.M. The impact of bone compression on bone-to-implant contact of an osseointegrated implant: A canine study. Int. J. Periodontics Restor. Dent. 2012, 32, 637–645. [Google Scholar]
- Krennmair, G.; Seemann, R.; Schmidinger, S.; Ewers, R.; Piehslinger, E. Clinical outcome of root-shaped dental implants of various diameters: 5-year results. Int. J. Oral Maxillofac. Implant. 2010, 25, 357–366. [Google Scholar]
- Sesha, M.R.; Sunduram, R.; Abdelmagyd, H.A.E. Biomechanical evaluation of stress distribution in subcrestal placed platform-switched short dental implants in D4 bone: In vitro finite-element model study. J. Pharm. Bioallied. Sci. 2020, 12, S134–S139. [Google Scholar] [CrossRef]
- Papavasiliou, G.; Kamposiora, P.; Bayne, S.C.; Felton, D.A. Three-dimensional finite element analysis of stress-distribution around single tooth implants as a function of bony support, prosthesis type, and loading during function. J. Prosthet. Dent. 1996, 76, 633–640. [Google Scholar] [CrossRef]
- Rangert, B.; Jemt, T.; Jörneus, L. Forces and moments on Branemark implants. Int. J. Oral Maxillofac. Implant. 1989, 4, 86–104. [Google Scholar]


| 30°ANGLED LOAD | ||||||
|---|---|---|---|---|---|---|
| Diameter (mm) | Ø3.3 | Ø3.5 | Ø3.75 | Ø4 | Ø4.25 | Ø4.75 |
| Bone Type IV | 235 | 215 | 125 | 102 | 90 | 68 |
| Bone type III | 230 | 205 | 120 | 90 | 83 | 60 |
| Bone Type II | 205 | 190 | 110 | 82 | 71 | 52 |
| Bone Type 0-I | 180 | 173 | 97 | 69 | 58 | 41 |
| AXIAL LOAD | ||||||
|---|---|---|---|---|---|---|
| Diameter (mm) | Ø3.3 | Ø3.5 | Ø3.75 | Ø4 | Ø4.25 | Ø4.75 |
| Bone Type IV | 40 | 39 | 22 | 19.5 | 17 | 16 |
| Bone Type III | 39 | 38 | 23 | 19.5 | 17 | 15 |
| Bone Type II | 33 | 32 | 19 | 16 | 14 | 11 |
| Bone Type 0-I | 21 | 20 | 10,5 | 8.5 | 7,5 | 5,5 |
Publisher’s Note: MDPI stays neutral with regard to jurisdictional claims in published maps and institutional affiliations. |
© 2021 by the authors. Licensee MDPI, Basel, Switzerland. This article is an open access article distributed under the terms and conditions of the Creative Commons Attribution (CC BY) license (https://creativecommons.org/licenses/by/4.0/).
Share and Cite
Anitua, E.; Larrazabal Saez de Ibarra, N.; Morales Martín, I.; Saracho Rotaeche, L. Influence of Dental Implant Diameter and Bone Quality on the Biomechanics of Single-Crown Restoration. A Finite Element Analysis. Dent. J. 2021, 9, 103. https://0-doi-org.brum.beds.ac.uk/10.3390/dj9090103
Anitua E, Larrazabal Saez de Ibarra N, Morales Martín I, Saracho Rotaeche L. Influence of Dental Implant Diameter and Bone Quality on the Biomechanics of Single-Crown Restoration. A Finite Element Analysis. Dentistry Journal. 2021; 9(9):103. https://0-doi-org.brum.beds.ac.uk/10.3390/dj9090103
Chicago/Turabian StyleAnitua, Eduardo, Naiara Larrazabal Saez de Ibarra, Iñigo Morales Martín, and Luis Saracho Rotaeche. 2021. "Influence of Dental Implant Diameter and Bone Quality on the Biomechanics of Single-Crown Restoration. A Finite Element Analysis" Dentistry Journal 9, no. 9: 103. https://0-doi-org.brum.beds.ac.uk/10.3390/dj9090103