Open Bioeconomy—A Bibliometric Study on the Accessibility of Articles in the Field of Bioeconomy


1
ULR 4073-GERiiCO-Groupe d’Études et de Recherche Interdisciplinaire en Information et Communication, Univ. Lille, F-59000 Lille, France
2
ULR 4073-GERiiCO-Groupe d’Études et de Recherche Interdisciplinaire en Information et Communication, CNRS, F-59000 Lille, France
3
Univ. Lille, CNRS, Centrale Lille, Univ. Artois, UMR 8181-UCCS-Unité de Catalyse et Chimie du Solide, F-59000 Lille, France
*
Author to whom correspondence should be addressed.
Publications 2020, 8(4), 55; https://0-doi-org.brum.beds.ac.uk/10.3390/publications8040055
Submission received: 29 October 2020
/
Revised: 7 December 2020
/
Accepted: 15 December 2020
/
Published: 17 December 2020
Abstract
:Open access (OA) to scientific information is one of the major challenges and objectives of actual public research policy. The purpose of this paper is to assess the degree of openness of scientific articles on bioeconomy, as one of the emergent research fields at the crossroads of several disciplines and with high societal and industrial impact. Based on a Web of Science (WoS) corpus of 2489 articles published between 2015 and 2019, we calculated bibliometric indicators, explored the openness of each article and assessed the share of journals, countries and research areas of these articles. The results show a sharp increase and diversification of articles in the field of bioeconomy, with a beginning long tail distribution. 45.6% of the articles are freely available and the share of OA articles is steadily increasing, from 31% in 2015 to 52% in 2019. Gold is the most important variant of OA. Open access is low in the applied research areas of chemical, agricultural and environmental engineering but higher in the domains of energy and fuels, forestry and green and sustainable science and technology. The UK and the Netherlands have the highest rates of OA articles, followed by Spain and Germany. The funding rate of OA articles is higher than of non-OA articles. This is the first bibliometric study on open access to articles on bioeconomy. The results can be useful for the further development of OA editorial and funding criteria in the field of bioeconomy.
1. Introduction
The climatic context is forcing us to rethink our production and consumption methods to limit the damage to the environment. Not only the extensive use of non-renewable resources (with further depletion issues) but also irreversible impacts on life cycles are pointed out as the main causes [1]. The bioeconomy is part of this approach which aims to replace fossil resources—i.e., non-sustainable resources such as coal or oil—by “green” resources which are also called biomass, the process of which the rationalized processing would open more environmental-friendly perspectives to our Planet. Indeed, bioeconomy is more than a concept. It is a set of initiatives that reconciles both economic, environmental and social objectives [2].
Is it a new concept or not? Fifteen years ago, the European Commission observed that bioeconomy was one of the oldest economic sectors known to humanity but that the life sciences and biotechnology were transforming it into one of the newest [3]. Generally, bioeconomy is understood as an economy “where the basic building blocks for materials, chemicals and energy are derived from renewable biological resources, such as plant and animal sources,” with a strong potential for environmental, social and economic sustainability [4]. In other words, bioeconomy is an “economy based on the sustainable production and conversion of renewable biomass into a range of bio-based products, chemicals and energy” [5].
Especially in Europe, the short “modern bioeconomy” started twenty years ago, with the 5th EU Framework Programme (1998–2002) and the creation of so-called key actions; this FP5 “departed from the classical and linear innovation chain (and) focused on targeted socio-economic needs and on the Community’s policy objectives, where European research should make a decisive contribution with innovative products, processes or services (…) with the aim of developing new types of drugs, foodstuffs with specific nutritional properties, techniques for biodegradation of recalcitrant compounds, industrial enzymes able to replace less environmentally friendly chemical processes and so forth.” [6].
According to various scientific orientations and political priorities, bioeconomy has been defined in different ways, as a broader or narrower concept, with different visions and sometimes divergent goals; as a matter of fact, the short history of “modern” bioeconomy is characterized by a close interaction between politics, research and industry [4,5,6,7]. A comparative analysis of ten integrated and fully developed bioeconomy strategies from OECD and EU, Germany, Sweden and the USA reveals not only specific and divergent elements of definitions but also different visions, expectations and guiding principles, covering innovative knowledge society as well as economic growth and competitiveness, a revolution in the health sector or priority for food; the same study highlights the need for a consistent political framework, for international cooperation, for interdisciplinary research and for integrated action, especially between the public and the corporate sectors [8].
Nevertheless, another assessment of political strategies provides evidence how these different strategies focus on the same key priority areas for developing the bioeconomy, in particular “fostering research and innovation, primarily in the field of biotechnology; promoting collaboration between industry, enterprises and research institutions; prioritizing the optimized use of biomass by implementation of the cascade principle and by utilizing waste residue streams; and providing funding support for the development of bio-based activities” [5]. The “multiple, sometimes scattered activities within the EC and the Member States (…) were always pointing into the same direction, that is, to the utmost use of the four unique ‘properties’ of biological resources (…):
- renewability,
- carbon-friendliness,
- inherent circularity,—particularly in closing cycles in waste processing, recycling and fostering bio-degradability, mostly in the format of cascades in biorefining activities
- and, last but not least, offering new additional and better functions, such as higher stability, longer lifetime, less toxicity, less resources consumption, sustainability and so forth.” [6].
Until recently, the concept of bioeconomy has been rapidly spreading in different spheres: institutional, scientific and entrepreneurial. The concept of bioeconomy is used in scientific publications and mobilizes on the one hand, experimental sciences and agronomic and environmental techniques and, on the other hand, human and social sciences. Moreover, this concept has been the subject of strong public policy attention. The Organization for Economic Co-operation and Development (OECD) is the first institution to underline the issues and the aims of bioeconomy through its pioneering work. According to Reference [1], “the transition to bioeconomy gains significant footing towards the end of the 20th century and is now a strategic element on a transnational, national and regional level” (p. 67). Most strategies “point to the need for strong collaborations between research institutions and industry in order to facilitate technological innovation” [5]. Companies are applying new technologies to meet the demands of pollution abatement, innovation and profitability. In the field of research and development, there is an innovation model based on sharing and collaboration between stakeholders. This model, called “Open Innovation,” suggests calling on stakeholders outside the company to innovate [9]. In such an approach, a set of stakeholders can be profitably invested in the field of bioeconomy to achieve major advances both socioeconomic and environmental major advances.
Bioeconomy being a relatively recent and emergent field of research, a small but growing number of papers present results of bibliometric studies on this topic. A multilevel social network analysis has been applied by Reference [1] to construct a holistic and visual definition of bioeconomy and to describe its evolution, based on scientific literature from the European Union, the United States and China. Their data consists of 1369 articles from 2008 to 2018, retrieved from the Web of Science (WoS) database; the study includes a content analysis of strategic policy documents. In 2016, a study showed how in terms of publications, the importance of biotechnology had grown in South Africa following the country’s launch of its Biotechnology Strategy in 2001, with accompanying government financial support for R&D [10].
A large study on about 7000 papers indexed in the Scopus database showed the decisive role of technology (industrial biotechnology, synthetic biology, metabolic engineering etc.) in the development of the bioeconomy and proposed a systemic model of 20 interacting factors influencing this development, such as research and innovation, energy consumption and policy [11]. Innovation is the main topic of a recent German study which aims to improve the measurement of innovation in bioeconomy, to discuss what kind of information may be needed to understand innovation patterns in bioeconomy and to assess the current data availability [12]. This study is particular insofar as it applies bibliometric methodology to patents, in order to highlight the innovation potential of bioeconomy and the public and private R&D funding activities and to contribute to the monitoring of the economic, social and ecologic developments of bioeconomy.
The relationship between bioeconomy and sustainability has been addressed by Reference [13], providing evidence how visions about this relationship differ across scientific publications, ranging from positive to negative: the assumption that sustainability is an inherent characteristic of bioeconomy; the expectation of benefits under certain conditions; tentative criticism; and the expectation of a negative impact.
Another bibliometric study on 453 articles published between 2005 and 2014 analyzed the meaning of the notion of bioeconomy by exploring the origins, uptake and contents of the term “bioeconomy” in the academic literature [14]. Main results are an increasing visibility of bioeconomy research, mainly by researchers affiliated to a higher education institution, much less from the corporate sector; a rather fragmented research community, with a core of European and American regional clusters most active and networked in the field and dispersed over many fields of science yet dominated by natural and engineering sciences. They also identified three different visions of bioeconomy (i.e., bio-technology, bio-resource, bio-ecology) and described their implications in terms of overall aims and objectives, value creation, drivers and mediators of innovation and spatial focus. Reference [2] conducted a complementary bibliometric study on temporal and geographical distribution of publications, most popular publication platforms, salient keywords and emerging topics in order to compare circular economy, green economy and bioeconomy as global sustainability concepts.
Reference [15] performed a bibliometric analysis on papers indexed by the Web of Science (WoS) for a number of South African authored publications and citations in bioeconomy and compared them with Brazil, Russia, India and China (BRICS) and selected countries for the period 2008 to 2018. Based on a large and inclusive query, they retrieved 19,040 publications in bioeconomy disciplines with at least one South African author for the period 2008–2018; about 55% were written in collaboration with researchers from other countries and the average percentage industry collaboration was at 1.3%. With a focus on biotechnology, Reference [16] evaluated the research output of ten Indian universities between 1997 and 2006, identifying prolific authors, most relevant journals and different document types.
Other bibliometric papers deal with specific aspects of bioeconomy, like biomass, biorefineries and forest bioeconomy [17,18,19]. Reference [20] performed a bibliometric analysis of a small corpus of 166 papers on bioeconomy retrieved through a systematic review of academic journals in social sciences. Their study confirms that most of the current analysis of the bioeconomy relates to genetics, chemistry, biotechnology, energy or biology issues and regrets that a proper interpretation of the significant implications of the bioeconomy from a social and economic perspective is still (too) scarce.
Most of these papers (9 out of 13) are based on WoS data; some are rather large and inclusive whereas others apply a more selective query approach. Half of them combine the bibliometric methodology with a conceptual analysis of the papers’ content. However, so far none of the bibliometric papers investigated the accessibility of publications on bioeconomy on the Internet, to which degree the access to published research output is free, open and universal. Open access (OA) to academic papers and more generally, open science appears out of scope in this field of research.
Now, open science is one of the major challenges of the European research and innovation framework program (Horizon 2020, Horizon Europe1), along with bioeconomy. The objective is to accelerate the transition towards a sustainable European bioeconomy by reducing the gap between new technologies and their implementation. The position in favor of open science includes the obligation to ensure free access to publications resulting from funded projects. The European Commission defines open science as a way research is carried out, “disseminated, deployed and transformed by digital tools and networks. It relies on the combined effects of technological development and cultural change towards collaboration and openness in research”2. New technologies contribute to the improvement of scientific research and communication and “by providing unlimited, barrier free, open access to research outputs, open science makes scientific processes more efficient, transparent and responsive to societal challenges” (ibid.).
The scientific and technical information brings together all the information produced by professionals in research, teaching but also industry and economics. It covers all scientific and technical sectors and can be presented in several forms, such as articles, reviews, books, posters, technical documentation, patent notice, databases and gray literature [21]. The real challenge of research today is to democratize access to knowledge and to recognize that knowledge has a driving role for our society. The open access movement has focused on the communication and circulation of scientific publications while the open science movement values science and its evaluation by opening up research data and new measures to assess awareness, for example [22].
The aim of our paper is to assess the degree of openness of scientific articles on bioeconomy and related topics. Similar to Reference [14], we calculated bibliometric indicators on the development, impact (citations), journals, authors, institutions, countries and research areas; we also investigated the internationality [23] of the underlying research collaborations and the share and types of funding sources [24,25]. Based on this dataset, we explored the openness of each article, if it has been published in a gold or hybrid OA journal or if it is legally available on an institutional or a disciplinary repository or another, similar platform and we assessed the share of journals, countries and research areas of open access (OA) articles on bioeconomy.
After a short description of the applied methodology (Section 2), we present the results of the bibliometric analysis of scientific articles on bioeconomy published between 2015 and 2019, together with an assessment of their free and open availability on the Internet (Section 3). The results are discussed in Section 4, in particular regarding methodological limitations and downfalls, the differences with former studies and the impact of open science in this research field. We conclude our paper with some perspectives for further research.
2. Materials and Methods
2.1. Bibliometric Analysis
We used the multidisciplinary bibliometric database Web of Science (WoS) Core Collection in order to retrieve relevant articles in the field of bioeconomy. The choice of the WoS was conditioned by the purpose to provide results that could be compared with former research [14]. As the former corpus covered the period from 2005 to 2014 [14], we decided to cover the following five years, excluding 2020 because this year is not ended and because of lacking data on citations. The literature retrieval was therefore limited to articles published in scientific journals between 2015 and 2019.
The following search terms and strings were used in the field TOPIC (article title, abstract, author keywords, WoS keywords): agro-based, agrobased, agro-sourced, agrosourced, naturality, bioeconomy, bio-economy, biobased economy, bio-based economy, biobased industry, bio-based industry, biobased society, bio-based society, biobased product*, bio-based product*, biobased knowledge economy, bio-based knowledge economy, circular economy AND biobased.
The WoS Core Collection set we used consists of the following content, with coverage time spans:
- Science Citation Index Expanded: 1991–present
- Social Sciences Citation Index: 1991–present
- Arts & Humanities Citation Index: 1991–present
- Emerging Sources Citation Index: 2015–present
The WoS queries were performed on 24 June 2020. The retrieved references have been downloaded as a CSV-file and processed as Excel spreadsheets. Some variables needed curation and cleansing, in particular the data on publishers and affiliated organizations. Network maps were created with VosViewer 1.6.15 [26]. In case of missing data, articles were excluded from the analysis. Appendix A provides a list of the calculated indicators.
2.2. Evaluation of Openness
In a second step, we selected those articles with an DOI. For these articles, we performed a search in the open database Unpaywall3 [27] in order to assess if the articles are freely available on the Internet (open access) or not, especially in gold or hybrid open access (OA) journals or in institutional or disciplinary repositories.
The queries via Unpaywall were performed on 24 August 2020. The retrieved references with all relevant information about open access have been downloaded as JSON and CSV files and the data were added to the WoS references. Appendix A provides a list of the calculated indicators.
3. Results
The search in the entire WoS Core Collection based on the selected keywords described above produced 6728 references. From these references, 5073 are identified as journal articles (75.4%). 2489 articles have been published from 2015 to 2019. These articles are the sample for the following bibliometric analysis. From this sample, 2329 articles have an DOI (93.6%) and serve as the subsample for the assessment of openness.
3.1. Articles and Citations
Our search in the WoS Core Collection identified 2489 articles for the period 2015–2019. The annual number of published articles doubled from 2015 to 2019, with an annual increase rate between 15% and 30% (Figure 1). The articles from 2019 include 28 articles published by the journal in an early access version.
The annual increase in bioeconomy is well above the average global growth of published articles worldwide which is, for the given period, between 5% and 10% (WoS Core Collection).
At the time of the WoS query, the articles of our sample have been cited 18,431 times. As in Reference [14], the distribution of the citations is skewed but in a more long-tail way (Figure 2).
The most cited article published in the period 2015–2019—Roger Sheldon’s article on “The E factor 25 years on: the rise of green chemistry and sustainability” published by the Royal Society of Chemistry journal Green Chemistry [28]—received so far 269 citations; the five most cited articles (the “top of the charts”) are at the origin of 5.9% of all citations (Table 1). The 15 most cited articles received 10.7% of all citations.
20% of all articles received 66.9% of all citations while 80% of all citations are “produced” by 31% articles. This is not a classic 80/20 Pareto-like distribution but moves to the so-called “long-tail” distribution [29]. On the other extreme of the ranking, 332 articles (19.7%) received one citation only while 490 articles (13.3%) were not cited at all.
The median number of citations per article is low, with only 3 citations per article. For articles published in 2015, the median is 7 citations while for those published more recently in 2019, it is only 1 citation (Table 2).
3.2. Journals and Research Areas
The 2489 articles of our sample have been published in 932 different journals. From these journals, 607 (65.1%) have published only one article on bioeconomy in the given period 2015–2019. Again, the distribution is skewed. The five journals with the highest number of articles on bioeconomy and related subjects, together represent 332 articles (13.3% of all articles). Their articles received 3247 citations (17.6%). The journal which published the most articles in the field of bioeconomy in the given period 2015–2019, was the Journal of Cleaner Production, an international, transdisciplinary journal focusing on cleaner production, environmental and sustainability research and practice4, published by Elsevier, followed by the MDPI open access journal Sustainability, an international, cross-disciplinary, scholarly journal of environmental, cultural, economic and social sustainability of human beings5 (Table 3).
The first twenty journals published together 703 articles on the topic (28.2%). These articles received 6362 citations (34.5%) (Appendix B). Applying the Bradford law on the distribution of articles and citations to our corpus, 29 journals (3.1%) (=1/3 articles) and 12 journals (1.3%) (=1/3 citations) can be identified as core journals in the field of bioeconomy (Appendix C).
The journals of our sample are published by 360 different publishers but some of them belong to the same publishing house. The most important publishers, in terms of articles and citations, are Elsevier, Springer Nature, Wiley, MDPI and Taylor & Francis (Table 4); except for the new open access publisher MDPI from Switzerland, these publishers belong to “big five” academic publishers. Together, the five publishers represent 1565 articles (62.9%) and 12,473 citations (67.7%), confirming in this particular, emerging field of research the global oligopoly of academic publishers [30].
Sage Publishing, the fifth of the “big five” academic publishers, produced only 27 articles over the given period, which received 274 citations. Clearly, Elsevier is in a significant, dominant position, as well in terms of production (articles) as in terms of impact (citations). The only surprise is the emergence of the newcomer MDPI, with a different publishing and business model based on 100% open access (see below).
Publications on bioeconomy are dispersed over many fields of science, yet dominated by natural and engineering science [14]. In our sample, we identified 161 WoS categories of research areas, most of them—the long tail—covered by few articles. Figure 3 shows the fifteen most important WoS research areas, representing the highest number of articles; one article can be indexed in more than one research area.
The most important research areas contributing to the growing corpus of journal articles on bioeconomy and related topics are, for the period 2015–2019, environmental sciences (19.5% of all articles), followed by biotechnology & applied microbiology (13.3%), green & sustainable science & technology (11.9%), environmental studies (11.7%) and economics (10.1%). A more detailed analysis of these figures provides complementary insight:
- Ranking: the comparison of the annual ranking of the different research areas reveals that while over the whole period environmental sciences remain the first research area in terms of articles, four areas are gaining importance (green & sustainable science & technology; environmental engineering; forestry; multidisciplinary chemistry); three other areas become relatively less important (ecology; fisheries; agricultural engineering).
- Journals: in some research areas, articles on bioeconomy are more dispersed than in others, that is, are published in a relatively higher number of journals. More dispersion: multidisciplinary sciences; chemical engineering; multidisciplinary chemistry. Less dispersion: agricultural engineering; green & sustainable science & technology; environmental engineering.
- Citations: in some research areas, articles are averagely more cited than in others and thus have a higher potential impact. Higher citation average per article: multidisciplinary chemistry; environmental engineering; green & sustainable science & technology; agricultural engineering. Lower citation average per article: economics; forestry; fisheries.
3.3. Authors, Organisations and Funding
The articles of our sample were written by 8566 authors. 8447 (98.6%) authors contributed only to one article on the topic of bioeconomy, which represents 2090 articles of the corpus. The ten most prolific researchers authored between 9 and 17 articles, together 125 articles which received 1153 citations, which is above the average number of citations per article (Table 5). The most prominent author, S.Venkata Mohan, is working at the Council of Scientific and Industrial Research funded Indian Institute of Chemical Technology (CSIR-IICT), Hyderabad, India. The two following authors, Mario Pagliaro and Rosaria Cirminna, are both working at the Institute for the Study of Nanostructured Materials (ISMN) of the Italian National Research Council (CNR) at Palermo, Italy, while Qingling Zhang is working at the Northeastern University, Shenyang, China.
The median number of authors per article is 4; the maximum number is 89, for an article on the emerging field of marine biotechnology in Brazil with 20 main authors and a network of 69 other researchers.
Among the references, the authors listed affiliations to 2471 organizations. The most performant institution, in terms of published articles in the field of bioeconomy but also in terms of impact (citations), is the Dutch University of Wageningen, followed by the French public National Institute of Agricultural Research (INRA)6, the US Department of Agriculture (USDA), the Australian Commonwealth Scientific and Industrial Research Organization (CSIRO) and the Swedish University of Agricultural Sciences (Table 6). Except for USDA and CSIRO, all organizations are from the European Union member states.
These ten organizations together produced 415 articles (16.7%); their articles received 4198 citations (22.8%). In terms of impact, the most important organizations are the Dutch universities of Wageningen and Delft, followed by the German Helmholtz-Centre for Environmental Research (which is ranked #11 and not part of Table 6), the University of Helsinki and the Technical University of Denmark.
85% of these organizations could be clearly attributed to a specific type of academic or other structure. More than half of the organizations are Higher Education institutions (mainly universities) and they contributed to 86% of all articles (Table 7). They are followed by research institutes (like INRA, CNR or CSIRO) which represent 18.5% of all institutions but contributed to 32.4% articles. Corporate companies (5.2%) authored or co-authored 6.5% articles.
A total of 1677 articles (67.4%) acknowledge some kind of funding, from one (30.0%) or more funding bodies (37.4%). However, when this indicator—the funding rate—is broken up by the research areas, significant differences appear. Some research areas - especially (but not only) the most important in terms of published articles—show funding rates well above 70% or 75%, like green & sustainable science & technology, agricultural engineering but also marine & freshwater biology or fisheries, for instance (Figure 4). In other research areas, the funding rate is lower, that is, the published results have less often received specific funding; this is the case for articles indexed in economics and management, similar to a long tail of articles covering less important or less central fields of bioeconomy.
3.4. Affiliation Countries and International Collaboration
Based on the affiliations, the following table shows the cumulative number of articles and citations for the most “productive” countries in the field of bioeconomy research (Table 8).
These ten leading research countries in the field of bioeconomy represent 1958 articles (78.7%) and 17,043 citations (92.5%). The researchers from US organizations, the best ranked country, have authored or co-authored 17.5% of all articles and received 19.0% of all citations. Articles from France, Spain, India and Australia are in average less well cited than from the other countries.
Two-third of the articles are domestic, that is, written by authors working in the same country (1685 articles, 67.7%). Most of the international articles have been published by authors from two or three countries (705 articles, 28.3%); yet, one article, a comparative property rights analysis on Europe’s private forests, has authors from 29 different countries.
The topological map (Figure 5) represents the affiliate network according to the share of international articles by country.
Figure 5 highlights the international collaboration between different countries. The majority of countries that maintain international collaboration are developed countries: USA, Austria, Germany, England, France, Italy, Nordic countries and other countries from Europe. Interesting: the central role of Austrian research for partnerships with countries from Central and East Europe. Interesting, too, the strong partnerships of the US with the Commonwealth countries England, Canada and Australia but also with China and Brazil and, less, with Germany and France.
The word cloud represents the share of domestic articles per country, that is, highlights countries that have produced articles without international collaboration. Germany, the US and Italy are countries with a high amount of domestic research (Figure 6, Appendix E); yet, all of them are also strongly invested in international collaborations (see Figure 5 above). More interesting is the case of India, with an important number of domestic research but less international partnerships.
3.5. Openness
1135 articles from the sample have been identified as freely available in open access (45.6%), nearly as much (1194 articles) are not open access but behind a paywall (48%); for the other 160 articles, because of lacking DOIs, Unpaywall could not identify the status (Figure 7).
Figure 7 shows also the distribution of different variants of open access:
- Green open access (articles that are also available in an institutional or other open access repository): 11.6%. This percentage does not include preprints or other unpublished articles.
- Gold open access (articles published in an open access journal): with 22.1% of all articles, the 549 gold OA articles represent 48.4% of all OA articles and is clearly the most important variant of OA.
- Hybrid open access (articles in a subscription journal that are open access with a clear license): 8.3% articles are freely accessible in subscription journals.
- Bronze open access (articles published in a subscription journal that are open access without a license): 3.7% articles have been made freely accessible by the publishers.
To summarize, in the field of bioeconomy, open repositories provide 25.4% of the open access to published articles, while the journals cover the other 74.6%.
The share of OA articles is steadily increasing, from 31% in 2015 to 52% in 2019 (Figure 8).
The 1135 open access articles come from 505 journals (54.2% of all journals) but only 83 journals (8.9%) have 3 or more articles in open access, either on their own platform or on a green repository. Table 9 shows the five journals that published the highest number of open access articles.
The first twenty journals cumulate 326 OA articles on the topic, which represent 46.4% of all OA articles but only 13.1% of all articles (Appendix B). Elsevier published the most articles in bioeconomy (791) and Elsevier is also the publisher with the highest number of OA articles (216, equal 19% of all OA articles). But as Table 10 shows, this represents only 27.3% of all articles published by Elsevier on bioeconomy, a share which is lower than the other “big five” publishers Springer Nature (37.7%), Taylor & Francis (39.2%) and Wiley Blackwell (44.2%).
The real difference, however, is with the MDPI publisher of open access journals—all MDPI articles are published in gold open access. With regards to open access, MDPI is already the second important publishers of articles on bioeconomy; with regards to open access compliant with the Plan S requirements7 and the preference of funding bodies for gold OA, they are the most important OA publishing house. MDPI is not the only OA publisher in this field; however, the other gold OA publishers, like BioMed Central, Frontiers Media, Public Library of Science and Sciendo, are less important, at least for the moment, with an overall share of less than 10% of all articles.
The part of OA articles in the fifteen most important research areas (cf. Figure 3) range from 16.7% (Engineering, Chemical) to 78.6% (Multidisciplinary Studies) (Figure 9). Especially the applied domains of agricultural, chemical and environmental engineering have low rates of OA publishing while, except for the relatively small number of multidisciplinary studies, all other important research areas have average rates of OA publishing, between 40% and 50%. The full table with all WoS research areas in our sample is in Appendix D.
Some of the less important research areas show relatively high rates of OA articles, with more than 60% articles in OA journals or repositories. Some examples: marine and freshwater biology; business; management; microbiology; mathematics; plant sciences; biodiversity conservation. But because of the relatively small number of published articles, there may be a bias and this should not be over-interpreted.
Some research areas are more “OA gold,” obviously preferring open access via journals (Biotechnology & Applied Microbiology; Green & Sustainable Science & Technology; Energy & Fuels; Agronomics) while others are more “OA green” with a preference for repositories as a vector of open access (Economics; Ecology; Fisheries).
Table 8 (see above) ranks the ten most important countries, according to the total number of articles published in the field of bioeconomy. Table 11 shows the same countries, this time with the number and percentage of OA articles.
The leading countries regarding the part of open access are the UK, the Netherlands, Spain, Germany and France; while Germany and the Netherlands appear preferring the gold variant of OA, the UK has a preference for OA hybrid and gold journals and France clearly prefers green.
Regarding the different types of organizations, the essential contribution to OA articles on bioeconomy comes from the universities which (co)authored 87.6% of all OA articles. However, the share of OA does not vary significantly between universities, research institutes, government organizations, companies and so forth.
A last result: 73.5% of the OA articles (834) present results from research that got funding from one or more funding bodies, a percentage which is slightly higher than the funding rate of the non-OA articles (66.2%).
4. Discussion
4.1. Methodological Limitations
The WoS Core Collection is a representative but not exhaustive database. Also, as the transparency of the WoS Core Collection has been a matter of concern [31], we specified the customized sub-datasets we used for our study. In order to obtain a more complete picture, we could have included other databases, especially Scopus from Elsevier or used discovery tools like the BASE or Dimensions. We could also have considered other document types than journal articles, like books and book chapters, communications, dissertations, reports, preprints and other categories of grey literature. We made some comparative test queries in the field of bioeconomy; probably, Scopus would have produced 5–10% more articles while Dimension and BASE would have shown 50–80% more articles and two to three times more references, when other document types like reports, theses, preprints, books and book chapters, conference contributions and so forth were included. Clearly, this means that (much) more publications and other academic articles are available on bioeconomy and related topics than in our sample. For our study, however, we preferred consistency, representativity and reliability to exhaustivity. Journal articles are (still) the most relevant type of scientific information, especially in the fields of science and technology and they are the most important part of the Crossref DOI database, representing 72.9% of all content items8 and of the Unpaywall search engine required for the OA assessment.
Another limitation is the preponderance of English articles in the WoS. Yet, searching through databases, catalogs and on the Internet reveals that at least for the moment, only few scientific articles have been published in French.
Our analysis of open access excluded all piracy platforms (e.g., Sci-Hub) and all academic social networks from the retrieval of OA articles, which probably contributes to an underestimation of the real open accessibility of bioeconomy articles.
4.2. Delineation, Growth and Diversification of the Field of Bioeconomy
The statistical delineation of bioeconomy remains a critical issue [12]. Setting boundaries, attributing some sectors to bioeconomy while excluding others depends on political and economic strategies and on academic definitions of what is or should be bioeconomy. However, so far there is no generally accepted and consensual definition, just more or less large and inclusive approaches.
Our empirical approach is based on the work of Reference [14] and replicates their search strategy, with an opening towards agriculture: the search terms we have added are “agrobased,” “agro-based,” “agrosourced,” “agro-sourced” and “naturality.” The term “naturality” was included experimentally as a central and highly-ranked attribute of renewable materials [32]. These keywords enabled us to include research in the field of agriculture and the natural environment. This means that our corpus of published articles is potentially larger and covers more domains than that from the 2016 study.
Our main purpose was to remain as similar and comparable as possible with [14]; prior to our study, we assessed different search strategies with different combinations of search terms and selected this one because it seemed to us as an acceptable compromise between former research (such as [14]) and the recent development of the field. On the other hand, we could have gone farther and include more keywords, as for example “bio-sourced,” “biosourced,” “sustainability” or “biomass”; but we did not because we preferred a reliable corpus of references to a larger sample with more “noise,” that is, less or irrelevant articles. We are aware that this choice may reduce the visibility of certain topics, in particular the technology side of bioeconomy (biotechnology, chemistry).
Compared with other studies, our more inclusive approach probably explains one part of the increase of publications, authors, institutions and domains. Our assessment produced 2489 articles published between 2015 and 2019; for the period 2005–2014, Reference [14] identified only 453 articles, while [2] found 646 articles on bioeconomy for the period 1990–2017 and [1] 1369 articles published between 2008 and 2018. More or less inclusive views and queries and different data sources probably explain a large part of these differences, Scopus for instance having a broader coverage than the WoS. However, all these results, like figures from other recent papers [17,18], may also reveal a real and significant increase of publications in this field, from 2014 and 2015 on, which is well above the global increase of academic articles.
This growth of the number of articles is accompanied by an increasing number of authors, affiliated organizations and journals. For instance, Reference [14] counted 1487 authors; our corpus contains more than 8000 authors. They identified 459 organizations, in our study there were 2471 organizations. The articles of their corpus were published in 222 journals, while this number in our study is 932. Obviously, this is more than a numerical increase. Compared to former and other studies, our results reveal an increasing diversification and inter- or pluridisplinarity. Research on bioeconomy is conducted in an increasing number of scientific domains and the results are published in more and more journals covering a larger range of topics than before.
While the number of journals quadrupled, the number of articles per journal remained more or less stable, increasing slightly from 2 to 2.7. The analysis of citations shows the development of a long tail in the field of bioeconomy, with a less-skewed distribution of impact. In our study, 20% articles received 66.9% citations and 80% citations were “produced” by 31.1% articles. Compared to Reference [8], the most cited articles, that is, the “top of the charts” [28], become less important. In their sample, the three most cited articles received 18% citations, in our study the percentage is only 4%. Table 12 gives more evidence on this evolution.
On the other hand, the “far end” of the long tail becomes longer, with a higher percentage of articles that received only one or no citation at all—in our sample, this percentage is 32.8% while in the corpus of Reference [14] it is only 21.2%. In summary, the figures indicate the development of a larger, more diversified and less structured field of research, with less leading or “reference” articles and more and more studies with less or no impact.
4.3. Clusters of Bioeconomy
It was not the purpose of our research to provide a conceptual analysis of the field of bioeconomy, similar for instance to References [1,14,18]. Nevertheless, we conducted a co-occurrence analysis of the articles’ keywords, for two reasons: we wanted to get a (visual) idea of the scope and the diversity of the research field, as a complement to the bibliometric assessment but also in order to control and adjust if necessary the underlying search strategy (WoS query); and we wanted to prepare a more detailed and differentiated evaluation of the development of open science in bioeconomy, based on the clustering of research articles, as a complement to the WoS indexing of research areas. Figure 10 presents the first results of this approach, a co-occurrence map based on 12,859 keywords.
For each article, all keyword occurrences have been counted. Yet, in order to keep the map intelligible, the visualization threshold was limited to those 861 keywords with at least five occurrences. The resulting map reveals three main clusters, among other, smaller clusters:
- General principles and challenges of bioeconomy (blue): bioeconomy, economy, policy, industry, sustainability, innovation. This cluster appears similar to Reference [1] cluster 1 on bioeconomy, biopolitics, political economy and so forth, except for the biodiversity which is missing in our blue cluster. The cluster seems to express at least partly the “bio-technology vision” described by References [14,18], with a focus on economic growth, innovation and investment.
- Natural resource management (green): management, bioeconomic model, biodiversity. This cluster shifts the focus on management and modelling, especially in the field of fisheries and marine protected areas. It seems quite similar to a “bio-ecology vision” [14] which is held by France for instance, following [1].
- Transformation of bioresources (red): biomass, biofuels, biorefinery, transformation, extraction, fermentation, bio-based production/products. The cluster is similar to Reference [1] cluster 2 on biomass, biorefining and bioproducts and seems to express the “bio-resource vision” described by Reference [14] as focused on the processing and conversion of bio-resources into new products.
Other clusters are centered on bioenergy or on productivity, growth and a systemic approach while “naturality” appears (so far) out of scope and not related to bioeconomy; the analysis is still in progress. But for the purpose of this paper, two aspects are important: the similarities with other, recent studies on bioeconomy, which confirms the pertinence of our search strategy; and the reality of three large clusters of research that are interconnected, of course but can be clearly distinguished and described, which makes them interesting and relevant for further assessment of open science, beyond disciplinary boundaries.
4.4. Openness
The overall part of articles on bioeconomy that are freely accessible in open access is 45.6%. Compared to the metrics of the European Commission’s Open Science Monitor9, this OA rate is above the average percentage of open access publications from 2015 to 2017 (Figure 8, in blue the EC Monitor’s indicator, in green our own sample).
Figure 11 shows that the open accessibility of our bioeconomy sample is well above the EC metrics based on a corpus of 1.7 m to 1.8 m references from the Scopus database, with slightly more than 40% open access. The figure shows, too, that the share between the different variants of open access is particular in the field of bioeconomy, compared to the large EC sample which covers all research areas:
- Green open access: much less bioeconomy articles (11.6%) are available in repositories than in the global EC sample (25–30%);
- Gold open access: the percentage of gold bioeconomy articles (22.1%) is well above the EC gold share (around 15%, increasing);
- Hybrid open access: similar to gold OA. There are more bioeconomy OA articles in hybrid journals (8.3%) than in the EC sample (6–7%);
- Bronze open access: fewer bronze articles in bioeconomy (3.7%) than in the EC sample (7–9%).
Taken together, the open access to articles in the field of bioeconomy is obviously more gold (including hybrid) than green. One reason may be that this is a young and emergent research area in need of quick communication and impact; perhaps bioeconomy is just some years ahead of the other research areas, regarding the preference of gold OA (journals) to green OA (repositories). OA journals are the fastest way to disseminate peer-reviewed articles in a trustworthy environment; also, some major countries in bioeconomy (in particular, UK, Germany, The Netherlands) clearly prefer OA journals to open repository, for the publishing of their public research output. Another reason may be the high degree of funding in this new and challenging field with high societal and industrial impact. Especially funding from the EC (program Horizon 2020) but also from an increasing number of national research agencies or other funding bodies requires OA to results; more and more, research funds include the costs of OA publishing in gold and hybrid journals (article processing charges). This would explain why a relatively important part of bioeconomy articles is freely accessible on journal platforms and in repositories. An indicator may be the higher rate of funding in OA articles, compared to non-OA articles.
A recent study from Finland reports market shares of open access in eighteen Scopus-indexed disciplines ranging from 27% (agriculture) to 7% (business); it also provides percentages of OA articles that are published in gold OA journals, by discipline [33]. Figure 12 compares the overall OA share of our bioeconomy sample (45.6%, green) with the OA metrics of five disciplines from the Finish study (gold) and of five similar disciplines from the EC Open Science Monitor (blue).
The OA rate of the bioeconomy articles is similar to the OA rates in biological sciences and agriculture, forestry and fisheries in the EC Open Science Monitor; it is two times higher than in chemical engineering, chemical sciences and environmental engineering (blue). Following the EC Open Science Monitor, biological and agricultural sciences are leading disciplines regarding the implementation of OA strategies to scientific output. This disciplinary environment of good OA practice is probably the main reason for the relative high rate of OA articles in the field of bioeconomy.
When compared to the Finish study, which considers only gold OA articles, it is obvious that the bioeconomy gold OA rate is slightly higher than in engineering, chemistry and environmental science but quite similar to biochemistry, genetics and molecular biology and above all to agriculture and biological sciences. These similarities confirm the disciplinary dominance of agriculture, biology and, to a lesser degree, of environmental studies and engineering in the new research area of bioeconomy. Economics (not in Figure 9), on the other hand, has a much lower OA rate in the EC Monitor and the Finish study than our own sample and appears rather marginal, compared to the other disciplines.
5. Conclusions
Our paper presents the results of a first comprehensive, scientometric study on the development of open science in the research area of bioeconomy, based on a corpus of 2489 articles from the WoS, published between 2015 and 2019. Among the main findings are the following:
- 45.6% of the articles are freely available in open access; the share of OA articles is steadily increasing, from 31% in 2015 to 52% in 2019.
- Gold open access represents 48.4% of all OA articles on bioeconomy and is the most important variant of OA, before green and hybrid.
- Elsevier published the highest number of OA articles but MDPI is the first gold OA publisher in the field of bioeconomy.
- Open access is low in the applied research areas of chemical, agricultural and environmental engineering but higher in the domains of energy and fuels, forestry and green and sustainable science and technology.
- The UK and the Netherlands have the highest rates of OA articles, followed by Spain and Germany, while the lowest rates can be observed in India and China.
- The funding rate of OA articles is higher than of non-OA articles.
- The global OA share of articles on bioeconomy is above the average OA rate in the European Union and it is similar to the research areas of biological sciences, agriculture, forestry and fisheries.
Also, based on the study of keywords, other terms could and should be included in order to cope with the development of the research in the field of bioeconomy. Further, including the “bio-sourced” and “biosourced” keywords in the corpus would give a larger number of publications more centered on “technical” aspects of bioeconomy with technologies of transformation of bioresources to platform molecules, semi-finished and finished goods. This will be done in the future, along with a broader search for literature on bioeconomy from other sources, in particular Scopus and the French national open repository HAL.
The co-occurrence analysis of the articles’ keywords is a first step to further research in this field, insofar it lays the foundations for a differential assessment of open access development in specific research fields, beyond the disciplinary boundaries. Other perspectives for further insight into open science in the field of bioeconomy:
- How does funding impact the OA publishing?
- In particular, does public funding increase the share of OA in general and gold and green OA in particular?
- Which is the part of OA in other research publications and documents, like conference papers and posters, dissertations, reports and working papers? Which importance have preprints in this research area?
- What can be said about research data in the field of bioeconomy?
A follow-up study in one or two years should provide additional evidence on the development of open science in this new research area. Also, we intend to “zoom” on the particular situation in France and to compare the French development of open science with other countries and regions.
Author Contributions
M.D.: Data curation, Conceptualization, Writing—original draft, review & editing. H.P.: Data curation, Writing—review & editing. J.S.: Data curation, Writing—original draft, review & editing, Funding acquisition, Project administration, Supervision. F.D.: Writing—review & editing, Supervision. All authors have read and agreed to the published version of the manuscript.
Funding
The research receives funding from the RECABIO project which is supported by the French government through the Programme d’Investissements d’Avenir (I-SITE ULNE/ANR-16-IDEX-0004 ULNE) managed by the Agence Nationale de la Recherche.
Acknowledgments
The study has been carried out as part of a PhD thesis on the application of the principles of open science in the field of bioeconomy, especially on how open science can accelerate open innovation, how it can foster cooperation between stakeholders from different fields in the French region of Hauts de France as a case study and how it can respond to the challenges of the bioeconomy. The research receives funding from the RECABIO project which encourages collaboration between experimental sciences and the human and social sciences; also, our paper is a result of scientific cooperation between two very different research disciplines, that is, chemistry and information and communication sciences. We would like to thank Stéphane Chaudiron for helpful advice. We would also like to express our appreciation to four anonymous peer reviewers for their useful comments and suggestions.
Conflicts of Interest
The authors declare no conflict of interest.
Appendix A. Indicators
The data were obtained in June and August 2020. The following indicators have been calculated:
WoS queries (June 2020):
- Number of articles per year
- Total number of citations
- Citations per article
- Average number of citations of each article per year
- Number of articles per journal
- Citations of articles per journal
- Number of articles per author
- Affiliation of authors (articles per country and per organisation)
- Number of articles per type of organisation
- Number of articles per research area (scientific field)
- Share of domestic and international articles per country and research area
- Distribution of funding sources
Unpaywall queries (August 2020):
- Number of articles in open access
- Share of articles in open access per journal, country and research area
Appendix B. Twenty Relevant Journals in the Field of Bioeconomy
Alphabetic list of the twenty journals with the highest number and share of articles, with number and share of citations and number and share of open access articles.
| Journal | Nb Art | % Art | Nb Cit | % Cit | Nb OA | % OA |
| ACS Sustainable Chemistry & Engineering | 30 | 1.21 | 415 | 2.25 | 6 | 20 |
| Agricultural Systems | 49 | 1.97 | 340 | 1.84 | 14 | 28.6 |
| Amfiteatru Economic | 32 | 1.29 | 52 | 0.28 | 32 | 100 |
| Biofuels, Bioproducts & Biorefining-biofpr | 37 | 1.49 | 325 | 1.76 | 18 | 48.6 |
| Biomass & Bioenergy | 18 | 0.72 | 169 | 0.92 | 4 | 22.2 |
| Bioresource Technology | 33 | 1.33 | 402 | 2.18 | 8 | 24.2 |
| Biotechnology for Biofuels | 29 | 1.17 | 549 | 2.98 | 29 | 100 |
| Ecological Economics | 39 | 1.57 | 206 | 1.12 | 12 | 30.8 |
| Environmental & Resource Economics | 27 | 1.08 | 89 | 0.48 | 7 | 25.9 |
| Fisheries Research | 21 | 0.84 | 147 | 0.8 | 5 | 23.8 |
| Forest Policy and Economics | 21 | 0.84 | 250 | 1.36 | 5 | 23.8 |
| Forests | 16 | 0.64 | 43 | 0.23 | 16 | 100 |
| Global Change Biology Bioenergy | 24 | 0.96 | 129 | 0.7 | 23 | 95.8 |
| ICES Journal of Marine Science | 23 | 0.92 | 148 | 0.8 | 17 | 73.9 |
| Industrial Crops and Products | 47 | 1.89 | 576 | 3.13 | 5 | 10.6 |
| Journal of Cleaner Production | 121 | 4.86 | 1529 | 8.3 | 33 | 27.3 |
| Marine Policy | 23 | 0.92 | 103 | 0.56 | 8 | 34.8 |
| Natural Resource Modeling | 20 | 0.8 | 31 | 0.17 | 8 | 40 |
| New Biotechnology | 17 | 0.68 | 263 | 1.43 | 0 | 0 |
| Sustainability | 76 | 3.05 | 596 | 3.23 | 76 | 100 |
Appendix C. Core Journals in the Field of Bioeconomy
List of core journals, following the Bradford law (numbers of articles and citations).
| Journal | Publisher | Core Journal (Articles) | Core Journal (Citations) |
| JOURNAL OF CLEANER PRODUCTION | Elsevier | x | x |
| SUSTAINABILITY | MDPI | x | x |
| AGRICULTURAL SYSTEMS | Elsevier | x | x |
| INDUSTRIAL CROPS AND PRODUCTS | Elsevier | x | x |
| ECOLOGICAL ECONOMICS | Elsevier | x | |
| BIOFUELS BIOPRODUCTS & BIOREFINING-BIOFPR | Wiley | x | x |
| BIORESOURCE TECHNOLOGY | Elsevier | x | x |
| AMFITEATRU ECONOMIC | Editura ASE | x | |
| ACS SUSTAINABLE CHEMISTRY & ENGINEERING | Amer Chemical Soc | x | x |
| BIOTECHNOLOGY FOR BIOFUELS | BioMed Central | x | x |
| ENVIRONMENTAL & RESOURCE ECONOMICS | Springer | x | |
| GLOBAL CHANGE BIOLOGY BIOENERGY | Wiley | x | |
| ICES JOURNAL OF MARINE SCIENCE | Oxford Univ Pr | x | |
| MARINE POLICY | Elsevier | x | |
| FISHERIES RESEARCH | Elsevier | x | |
| FOREST POLICY AND ECONOMICS | Elsevier | x | |
| NATURAL RESOURCE MODELING | Wiley | x | |
| BIOMASS & BIOENERGY | Elsevier | x | |
| NEW BIOTECHNOLOGY | Elsevier | x | x |
| FORESTS | MDPI | x | |
| LAND USE POLICY | Elsevier | x | |
| PLOS ONE | Public Library of Science | x | |
| JOURNAL OF ENVIRONMENTAL MANAGEMENT | Elsevier | x | |
| RESOURCES CONSERVATION AND RECYCLING | Elsevier | x | |
| SCIENCE OF THE TOTAL ENVIRONMENT | Elsevier | x | |
| BIOENERGY RESEARCH | Springer | x | |
| GREEN CHEMISTRY | Royal Soc Chemistry | x | x |
| JOURNAL OF THE AMERICAN OIL CHEMISTS SOCIETY | Wiley | x | |
| MICROBIAL CELL FACTORIES | BioMed Central | x | x |
| PROCEEDINGS OF THE NATIONAL ACADEMY OF SCIENCES OF THE UNITED STATES OF AMERICA | Natl Acad Sciences | x |
Appendix D. WoS Categories of Articles in the Field of Bioeconomy
List of Web of Science categories, sorted by numbers of articles and share of articles.
- % art: share of all 2489 articles
- % OA: share of all 1332 OA articles
- % OA art: percentage of OA articles for each research area
| WoS Research Area | Nb Art | % Art | Nb OA Art | % OA | % OA Art |
| Environmental Sciences | 486 | 19.5% | 218 | 19.2% | 44.9% |
| Biotechnology & Applied Microbiology | 330 | 13.3% | 154 | 13.6% | 46.7% |
| Green & Sustainable Science & Technology | 295 | 11.9% | 146 | 12.9% | 49.5% |
| Environmental Studies | 291 | 11.7% | 141 | 12.4% | 48.5% |
| Economics | 251 | 10.1% | 105 | 9.3% | 41.8% |
| Energy & Fuels | 234 | 9.4% | 117 | 10.3% | 50.0% |
| Engineering, Environmental | 201 | 8.1% | 56 | 4.9% | 27.9% |
| Engineering, Chemical | 138 | 5.5% | 23 | 2.0% | 16.7% |
| Agronomy | 127 | 5.1% | 51 | 4.5% | 40.2% |
| Ecology | 116 | 4.7% | 57 | 5.0% | 49.1% |
| Forestry | 107 | 4.3% | 53 | 4.7% | 49.5% |
| Chemistry, Multidisciplinary | 104 | 4.2% | 43 | 3.8% | 41.3% |
| Agricultural Engineering | 101 | 4.1% | 18 | 1.6% | 17.8% |
| Fisheries | 100 | 4.0% | 48 | 4.2% | 48.0% |
| Multidisciplinary Sciences | 98 | 3.9% | 77 | 6.8% | 78.6% |
| Agriculture, Multidisciplinary | 97 | 3.9% | 39 | 3.4% | 40.2% |
| Food Science & Technology | 81 | 3.3% | 33 | 2.9% | 40.7% |
| Marine & Freshwater Biology | 80 | 3.2% | 54 | 4.8% | 67.5% |
| Management | 61 | 2.5% | 40 | 3.5% | 65.6% |
| Agricultural Economics & Policy | 57 | 2.3% | 15 | 1.3% | 26.3% |
| Business | 56 | 2.2% | 42 | 3.7% | 75.0% |
| Agriculture, Dairy & Animal Science | 51 | 2.0% | 30 | 2.6% | 58.8% |
| Oceanography | 46 | 1.8% | 24 | 2.1% | 52.2% |
| Biochemistry & Molecular Biology | 43 | 1.7% | 20 | 1.8% | 46.5% |
| Mathematics, Interdisciplinary Applications | 38 | 1.5% | 14 | 1.2% | 36.8% |
| Chemistry, Applied | 38 | 1.5% | 7 | 0.6% | 18.4% |
| Microbiology | 37 | 1.5% | 27 | 2.4% | 73.0% |
| Chemistry, Physical | 36 | 1.4% | 11 | 1.0% | 30.6% |
| Biochemical Research Methods | 36 | 1.4% | 10 | 0.9% | 27.8% |
| Mathematics | 32 | 1.3% | 22 | 1.9% | 68.8% |
| Materials Science, Multidisciplinary | 31 | 1.2% | 11 | 1.0% | 35.5% |
| Materials Science, Paper & Wood | 31 | 1.2% | 8 | 0.7% | 25.8% |
| Water Resources | 30 | 1.2% | 4 | 0.4% | 13.3% |
| Plant Sciences | 27 | 1.1% | 19 | 1.7% | 70.4% |
| International Relations | 27 | 1.1% | 10 | 0.9% | 37.0% |
| Mathematical & Computational Biology | 25 | 1.0% | 9 | 0.8% | 36.0% |
| Biodiversity Conservation | 23 | 0.9% | 16 | 1.4% | 69.6% |
| History & Philosophy Of Science | 23 | 0.9% | 13 | 1.1% | 56.5% |
| Veterinary Sciences | 23 | 0.9% | 11 | 1.0% | 47.8% |
| Polymer Science | 23 | 0.9% | 10 | 0.9% | 43.5% |
| Biology | 23 | 0.9% | 6 | 0.5% | 26.1% |
| Social Issues | 20 | 0.8% | 14 | 1.2% | 70.0% |
| Social Sciences, Biomedical | 20 | 0.8% | 11 | 1.0% | 55.0% |
| Engineering, Multidisciplinary | 20 | 0.8% | 8 | 0.7% | 40.0% |
| Geography | 20 | 0.8% | 8 | 0.7% | 40.0% |
| Mathematics, Applied | 19 | 0.8% | 8 | 0.7% | 42.1% |
| Genetics & Heredity | 18 | 0.7% | 15 | 1.3% | 83.3% |
| Mechanics | 15 | 0.6% | 3 | 0.3% | 20.0% |
| Philosophy | 14 | 0.6% | 8 | 0.7% | 57.1% |
| Social Sciences, Interdisciplinary | 14 | 0.6% | 6 | 0.5% | 42.9% |
| Geosciences, Multidisciplinary | 13 | 0.5% | 7 | 0.6% | 53.8% |
| Regional & Urban Planning | 13 | 0.5% | 4 | 0.4% | 30.8% |
| Meteorology & Atmospheric Sciences | 12 | 0.5% | 10 | 0.9% | 83.3% |
| Sociology | 12 | 0.5% | 6 | 0.5% | 50.0% |
| Computer Science, Interdisciplinary Applications | 12 | 0.5% | 5 | 0.4% | 41.7% |
| Engineering, Civil | 11 | 0.4% | 5 | 0.4% | 45.5% |
| Thermodynamics | 11 | 0.4% | 4 | 0.4% | 36.4% |
| Engineering, Mechanical | 11 | 0.4% | 2 | 0.2% | 18.2% |
| Ethics | 10 | 0.4% | 6 | 0.5% | 60.0% |
| Entomology | 10 | 0.4% | 2 | 0.2% | 20.0% |
| Nutrition & Dietetics | 9 | 0.4% | 3 | 0.3% | 33.3% |
| Chemistry, Analytical | 8 | 0.3% | 5 | 0.4% | 62.5% |
| Public, Environmental & Occupational Health | 8 | 0.3% | 5 | 0.4% | 62.5% |
| Soil Science | 8 | 0.3% | 4 | 0.4% | 50.0% |
| Physics, Multidisciplinary | 8 | 0.3% | 2 | 0.2% | 25.0% |
| Anthropology | 7 | 0.3% | 5 | 0.4% | 71.4% |
| Cultural Studies | 7 | 0.3% | 3 | 0.3% | 42.9% |
| Automation & Control Systems | 7 | 0.3% | 2 | 0.2% | 28.6% |
| Development Studies | 7 | 0.3% | 2 | 0.2% | 28.6% |
| Operations Research & Management Science | 7 | 0.3% | 1 | 0.1% | 14.3% |
| Communication | 6 | 0.2% | 2 | 0.2% | 33.3% |
| Materials Science, Textiles | 6 | 0.2% | 2 | 0.2% | 33.3% |
| Construction & Building Technology | 6 | 0.2% | 1 | 0.1% | 16.7% |
| Electrochemistry | 6 | 0.2% | 1 | 0.1% | 16.7% |
| Chemistry, Medicinal | 5 | 0.2% | 4 | 0.4% | 80.0% |
| Geography, Physical | 5 | 0.2% | 4 | 0.4% | 80.0% |
| Computer Science, Theory & Methods | 5 | 0.2% | 3 | 0.3% | 60.0% |
| Engineering, Electrical & Electronic | 5 | 0.2% | 3 | 0.3% | 60.0% |
| Instruments & Instrumentation | 5 | 0.2% | 3 | 0.3% | 60.0% |
| Logic | 5 | 0.2% | 3 | 0.3% | 60.0% |
| Nanoscience & Nanotechnology | 5 | 0.2% | 3 | 0.3% | 60.0% |
| Remote Sensing | 5 | 0.2% | 3 | 0.3% | 60.0% |
| Education & Educational Research | 5 | 0.2% | 2 | 0.2% | 40.0% |
| Political Science | 5 | 0.2% | 2 | 0.2% | 40.0% |
| Statistics & Probability | 5 | 0.2% | 2 | 0.2% | 40.0% |
| Horticulture | 5 | 0.2% | 1 | 0.1% | 20.0% |
| Law | 5 | 0.2% | 1 | 0.1% | 20.0% |
| Mycology | 4 | 0.2% | 3 | 0.3% | 75.0% |
| Humanities, Multidisciplinary | 4 | 0.2% | 2 | 0.2% | 50.0% |
| Limnology | 4 | 0.2% | 2 | 0.2% | 50.0% |
| Chemistry, Organic | 4 | 0.2% | 0 | 0.0% | 0.0% |
| Education, Scientific Disciplines | 4 | 0.2% | 0 | 0.0% | 0.0% |
| Computer Science, Information Systems | 3 | 0.1% | 3 | 0.3% | 100.0% |
| Tropical Medicine | 3 | 0.1% | 3 | 0.3% | 100.0% |
| Area Studies | 3 | 0.1% | 2 | 0.2% | 66.7% |
| Physics, Applied | 3 | 0.1% | 2 | 0.2% | 66.7% |
| Public Administration | 3 | 0.1% | 2 | 0.2% | 66.7% |
| Engineering, Biomedical | 3 | 0.1% | 1 | 0.1% | 33.3% |
| Engineering, Industrial | 3 | 0.1% | 1 | 0.1% | 33.3% |
| Materials Science, Coatings & Films | 3 | 0.1% | 1 | 0.1% | 33.3% |
| Materials Science, Composites | 3 | 0.1% | 1 | 0.1% | 33.3% |
| Computer Science, Artificial Intelligence | 3 | 0.1% | 0 | 0.0% | 0.0% |
| Engineering, Geological | 3 | 0.1% | 0 | 0.0% | 0.0% |
| Language & Linguistics | 3 | 0.1% | 0 | 0.0% | 0.0% |
| Literature | 3 | 0.1% | 0 | 0.0% | 0.0% |
| Nuclear Science & Technology | 3 | 0.1% | 0 | 0.0% | 0.0% |
| Astronomy & Astrophysics | 2 | 0.1% | 2 | 0.2% | 100.0% |
| Business, Finance | 2 | 0.1% | 2 | 0.2% | 100.0% |
| Evolutionary Biology | 2 | 0.1% | 2 | 0.2% | 100.0% |
| Industrial Relations & Labor | 2 | 0.1% | 2 | 0.2% | 100.0% |
| Integrative & Complementary Medicine | 2 | 0.1% | 2 | 0.2% | 100.0% |
| Medicine, General & Internal | 2 | 0.1% | 2 | 0.2% | 100.0% |
| Parasitology | 2 | 0.1% | 2 | 0.2% | 100.0% |
| Pharmacology & Pharmacy | 2 | 0.1% | 2 | 0.2% | 100.0% |
| Quantum Science & Technology | 2 | 0.1% | 2 | 0.2% | 100.0% |
| Computer Science, Software Engineering | 2 | 0.1% | 1 | 0.1% | 50.0% |
| Engineering, Petroleum | 2 | 0.1% | 1 | 0.1% | 50.0% |
| History | 2 | 0.1% | 1 | 0.1% | 50.0% |
| Mining & Mineral Processing | 2 | 0.1% | 1 | 0.1% | 50.0% |
| Zoology | 2 | 0.1% | 1 | 0.1% | 50.0% |
| Engineering, Manufacturing | 2 | 0.1% | 0 | 0.0% | 0.0% |
| Linguistics | 2 | 0.1% | 0 | 0.0% | 0.0% |
| Materials Science, Characterization & Testing | 2 | 0.1% | 0 | 0.0% | 0.0% |
| Physics, Mathematical | 2 | 0.1% | 0 | 0.0% | 0.0% |
| Social Work | 2 | 0.1% | 0 | 0.0% | 0.0% |
| Toxicology | 2 | 0.1% | 0 | 0.0% | 0.0% |
| Transportation | 2 | 0.1% | 0 | 0.0% | 0.0% |
| Architecture | 1 | 0.0% | 1 | 0.1% | 100.0% |
| Art | 1 | 0.0% | 1 | 0.1% | 100.0% |
| Cell & Tissue Engineering | 1 | 0.0% | 1 | 0.1% | 100.0% |
| Cell Biology | 1 | 0.0% | 1 | 0.1% | 100.0% |
| History Of Social Sciences | 1 | 0.0% | 1 | 0.1% | 100.0% |
| Immunology | 1 | 0.0% | 1 | 0.1% | 100.0% |
| Infectious Diseases | 1 | 0.0% | 1 | 0.1% | 100.0% |
| Information Science & Library Science | 1 | 0.0% | 1 | 0.1% | 100.0% |
| Medicine, Research & Experimental | 1 | 0.0% | 1 | 0.1% | 100.0% |
| Neurosciences | 1 | 0.0% | 1 | 0.1% | 100.0% |
| Nursing | 1 | 0.0% | 1 | 0.1% | 100.0% |
| Physics, Particles & Fields | 1 | 0.0% | 1 | 0.1% | 100.0% |
| Radiology, Nuclear Medicine & Medical Imaging | 1 | 0.0% | 1 | 0.1% | 100.0% |
| Asian Studies | 1 | 0.0% | 0 | 0.0% | 0.0% |
| Behavioral Sciences | 1 | 0.0% | 0 | 0.0% | 0.0% |
| Computer Science, Cybernetics | 1 | 0.0% | 0 | 0.0% | 0.0% |
| Dentistry, Oral Surgery & Medicine | 1 | 0.0% | 0 | 0.0% | 0.0% |
| Family Studies | 1 | 0.0% | 0 | 0.0% | 0.0% |
| Health Care Sciences & Services | 1 | 0.0% | 0 | 0.0% | 0.0% |
| Health Policy & Services | 1 | 0.0% | 0 | 0.0% | 0.0% |
| Materials Science, Biomaterials | 1 | 0.0% | 0 | 0.0% | 0.0% |
| Medical Ethics | 1 | 0.0% | 0 | 0.0% | 0.0% |
| Medieval & Renaissance Studies | 1 | 0.0% | 0 | 0.0% | 0.0% |
| Mineralogy | 1 | 0.0% | 0 | 0.0% | 0.0% |
| Obstetrics & Gynecology | 1 | 0.0% | 0 | 0.0% | 0.0% |
| Physics, Atomic, Molecular & Chemical | 1 | 0.0% | 0 | 0.0% | 0.0% |
| Physics, Nuclear | 1 | 0.0% | 0 | 0.0% | 0.0% |
| Psychology, Biological | 1 | 0.0% | 0 | 0.0% | 0.0% |
| Psychology, Multidisciplinary | 1 | 0.0% | 0 | 0.0% | 0.0% |
| Reproductive Biology | 1 | 0.0% | 0 | 0.0% | 0.0% |
| Spectroscopy | 1 | 0.0% | 0 | 0.0% | 0.0% |
| Transportation Science & Technology | 1 | 0.0% | 0 | 0.0% | 0.0% |
| Urban Studies | 1 | 0.0% | 0 | 0.0% | 0.0% |
| Women’s Studies | 1 | 0.0% | 0 | 0.0% | 0.0% |
Appendix E. Countries with Domestic Articles in the Field of Bioeconomy
List of countries with domestic articles (Figure 6)
| Country | Domestic Articles |
| usa | 244 |
| germany | 158 |
| india | 113 |
| italy | 110 |
| france | 69 |
| spain | 68 |
| china | 61 |
| brazil | 55 |
| netherlands | 55 |
| romania | 53 |
| canada | 52 |
| finland | 51 |
| australia | 49 |
| england | 46 |
| sweden | 41 |
| denmark | 30 |
| South korea | 27 |
| belgium | 24 |
| malaysia | 24 |
| norway | 24 |
| austria | 22 |
| poland | 21 |
| mexico | 18 |
| ireland | 16 |
| South africa | 14 |
| russia | 14 |
| greece | 12 |
| japan | 12 |
| turkey | 12 |
| taiwan | 11 |
| czech republic | 10 |
| latvia | 10 |
| new zealand | 10 |
| chile | 9 |
| pakistan | 9 |
| portugal | 9 |
| switzerland | 9 |
| colombia | 8 |
| iran | 7 |
| nigeria | 7 |
| serbia | 7 |
| egypt | 6 |
| indonesia | 5 |
| morocco | 5 |
| argentina | 4 |
| slovenia | 4 |
| thailand | 4 |
| algeria | 3 |
| saudi arabia | 3 |
| bangladesh | 3 |
| ethiopia | 3 |
| israel | 3 |
| kenya | 3 |
| lithuania | 3 |
| slovakia | 3 |
| uruguay | 3 |
| wales | 3 |
| other | 33 |
References
- Konstantinis, A.; Rozakis, S.; Maria, E.A.; Shu, K. A definition of bioeconomy through the bibliometric networks of the scientific literature. AgBioForum 2018, 21, 64–85. Available online: https://www.agbioforum.org/v21n2/v21n2a02-konstantinis.htm (accessed on 17 December 2020).
- D’Amato, D.; Droste, N.; Allen, B.; Kettunen, M.; Lähtinen, K.; Korhonen, J.; Toppinen, A. Green, circular, bio economy: A comparative analysis of sustainability avenues. J. Clean. Prod. 2017, 168, 716–734. [Google Scholar] [CrossRef]
- European Commission (EC). New Perspectives on the Knowledge-Based Bio-Economy; European Commission: Brussels, Belgium, 2005. [Google Scholar]
- McCormick, K.; Kautto, N. The Bioeconomy in Europe: An Overview. Sustainability 2013, 5, 2589–2608. [Google Scholar] [CrossRef] [Green Version]
- De Besi, M.; McCormick, K. Towards a Bioeconomy in Europe: National, Regional and Industrial Strategies. Sustainability 2015, 7, 10461–10478. [Google Scholar] [CrossRef] [Green Version]
- Patermann, C.; Aguilar, A. The origins of the bioeconomy in the European Union. New Biotechnol. 2018, 40, 20–24. [Google Scholar] [CrossRef]
- Meyer, R. Bioeconomy Strategies: Contexts, Visions, Guiding Implementation Principles and Resulting Debates. Sustainability 2017, 9, 1031. [Google Scholar] [CrossRef] [Green Version]
- El-Chichakli, B.; von Braun, J.; Lang, C.; Barben, D.; Philp, J. Policy: Five cornerstones of a global bioeconomy. Nature 2016, 535, 221–223. [Google Scholar] [CrossRef]
- Chesbrough, H. Open Innovation. The New Imperative for Creating and Profiting from Technology; Harvard Business School Press: Boston, MA, USA, 2003. [Google Scholar]
- Makhoba, X.; Pouris, A. Scientometric assessment of selected R&D priority areas in South Africa: A comparison with other BRICS countries. Afr. J. Sci. Technol. Innov. Dev. 2016, 8, 187–196. [Google Scholar] [CrossRef] [Green Version]
- Muizniece, I.; Zihare, L.; Blumberga, D. Obtaining the Factors Affecting Bioeconomy. Environ. Clim. Technol. 2019, 23, 277–291. [Google Scholar] [CrossRef] [Green Version]
- Wydra, S. Measuring innovation in the bioeconomy – Conceptual discussion and empirical experiences. Technol. Soc. 2020, 61, 101242. [Google Scholar] [CrossRef]
- Pfau, S.; Hagens, J.; Dankbaar, B.; Smits, A. Visions of Sustainability in Bioeconomy Research. Sustainability 2014, 6, 1222–1249. [Google Scholar] [CrossRef] [Green Version]
- Bugge, M.; Hansen, T.; Klitkou, A. What Is the Bioeconomy? A Review of the Literature. Sustainability 2016, 8, 691. [Google Scholar] [CrossRef] [Green Version]
- Bambo, T.L.; Pouris, A. Bibliometric analysis of bioeconomy research in South Africa. Scientometrics 2020. [Google Scholar] [CrossRef]
- Sevukan, R.; Sharma, J. Bibliometric Analysis of Research Output of Biotechnology Faculties in Some Indian Central Universities. Desidoc J. Libr. Inf. Technol. 2008, 28, 11–20. [Google Scholar] [CrossRef] [Green Version]
- Ferrari, G.; Pezzuolo, A.; Nizami, A.-S.; Marinello, F. Bibliometric Analysis of Trends in Biomass for Bioenergy Research. Energies 2020, 13, 3714. [Google Scholar] [CrossRef]
- Paletto, A.; Biancolillo, I.; Bersier, J.; Keller, M.; Romagnoli, M. A literature review on forest bioeconomy with a bibliometric network analysis. J. Forest Sci. 2020, 66, 265–279. [Google Scholar] [CrossRef]
- Ubando, A.T.; Felix, C.B.; Chen, W.-H. Biorefineries in circular bioeconomy: A comprehensive review. Bioresour. Technol. 2020, 299, 122585. [Google Scholar] [CrossRef]
- Sanz-Hernández, A.; Esteban, E.; Garrido, P. Transition to a bioeconomy: Perspectives from social sciences. J. Clean. Prod. 2019, 224, 107–119. [Google Scholar] [CrossRef] [Green Version]
- CNRS. Livre Blanc—Une Science Ouverte Dans une République Numérique; OpenEdition Press: Marseille, France, 2016. [Google Scholar] [CrossRef] [Green Version]
- Chartron, G. L’Open science au prisme de la Commission européenne. Éducation Sociétés 2018, 41, 177–193. [Google Scholar] [CrossRef]
- Calver, M.; Bryant, K.; Wardell-Johnson, G. Quantifying the internationality and multidisciplinarity of authors and journals using ecological statistics. Scientometrics 2018, 115, 731–748. [Google Scholar] [CrossRef]
- Wang, J.; Shapira, P. Funding acknowledgement analysis: An enhanced tool to investigate research sponsorship impacts: The case of nanotechnology. Scientometrics 2011, 87, 563–586. [Google Scholar] [CrossRef]
- Paul-Hus, A.; Desrochers, N.; Costas, R. Characterization, description, and considerations for the use of funding acknowledgement data in Web of Science. Scientometrics 2016, 108, 167–182. [Google Scholar] [CrossRef] [Green Version]
- Van Eck, N.J.; Waltman, L. Software survey: VOSviewer, a computer program for bibliometric mapping. Scientometrics 2010, 84, 523–538. [Google Scholar] [CrossRef] [PubMed] [Green Version]
- Else, H. How Unpaywall is transforming open science. Nature 2018, 560, 290–291. [Google Scholar] [CrossRef] [PubMed]
- Sheldon, R.A. The E factor 25 years on: The rise of green chemistry and sustainability. Green Chem. 2017, 19, 18–43. [Google Scholar] [CrossRef]
- Anderson, C. The Long Tail. Wired 2004, 12. Ideas, 10.01.2004. Available online: https://www.wired.com/2004/10/tail/ (accessed on 17 December 2020).
- Larivière, V.; Haustein, S.; Mongeon, P. The Oligopoly of Academic Publishers in the Digital Era. PLoS ONE 2015, 10, e0127502. [Google Scholar] [CrossRef] [PubMed]
- Liu, W. The data source of this study is Web of Science Core Collection? Not enough. Scientometrics 2019, 121, 1815–1824. [Google Scholar] [CrossRef]
- Navrátilová, L.; Výbošťok, J.; Dobšinská, Z.; Šálka, J.; Pichlerová, M.; Pichler, V. Assessing the potential of bioeconomy in Slovakia based on public perception of renewable materials in contrast to non-renewable materials. Ambio 2020, 49, 1912–1924. [Google Scholar] [CrossRef]
- Björk, B.-C.; Korkeamäki, T. Adoption of the open access business model in scientific journal publishing: A cross-disciplinary study. Coll. Res. Libr. 2020, 81, 1080–1094. [Google Scholar] [CrossRef]
| 1 | EC Horizon Europe https://ec.europa.eu/info/horizon-europe_en |
| 2 | EC Open Science https://ec.europa.eu/digital-single-market/en/open-science |
| 3 | Unpaywall https://unpaywall.org/ |
| 4 | Journal of Cleaner Productionhttps://0-www-journals-elsevier-com.brum.beds.ac.uk/journal-of-cleaner-production |
| 5 |
| 6 | INRA merged in 2020 with IRSTEA, another French research organisation, to become the new National Research Institute for Agriculture, Food and Environment (INRAE). |
| 7 | Plan S https://www.coalition-s.org/ |
| 8 | Figures from October 2019, cf. Crossref 2019 Annual Report https://0-doi-org.brum.beds.ac.uk/10.13003/y8ygwm5 |
| 9 |
Figure 1.
Number of articles per year (n = 2489).

Figure 2.
Distribution of the article citations (n = 18,431).

Figure 3.
Number of articles per research area (n = 2489).

Figure 4.
Funding rate per research area (n = 1677 articles).

Figure 5.
Representation of international articles per country (n = 790 articles, Gephi software).

Figure 6.
Representation of domestic articles per country (n = 790 articles, Voyant Tools software).
Figure 6.
Representation of domestic articles per country (n = 790 articles, Voyant Tools software).

Figure 7.
The part of open access (n = 2489 articles).

Figure 8.
Open access (OA) and other articles 2015–2019 (n = 2489).

Figure 9.
Share of OA articles in the 15 most important research areas (n = 1135).

Figure 10.
Key-word co-occurrence map (VOSviewer software).

Figure 11.
Percentage of open access articles (source for 2015 EU, 2016 EU and 2017 EU: EC Open Science Monitor).
Figure 11.
Percentage of open access articles (source for 2015 EU, 2016 EU and 2017 EU: EC Open Science Monitor).

Figure 12.
Percentage of OA articles (explication in text).


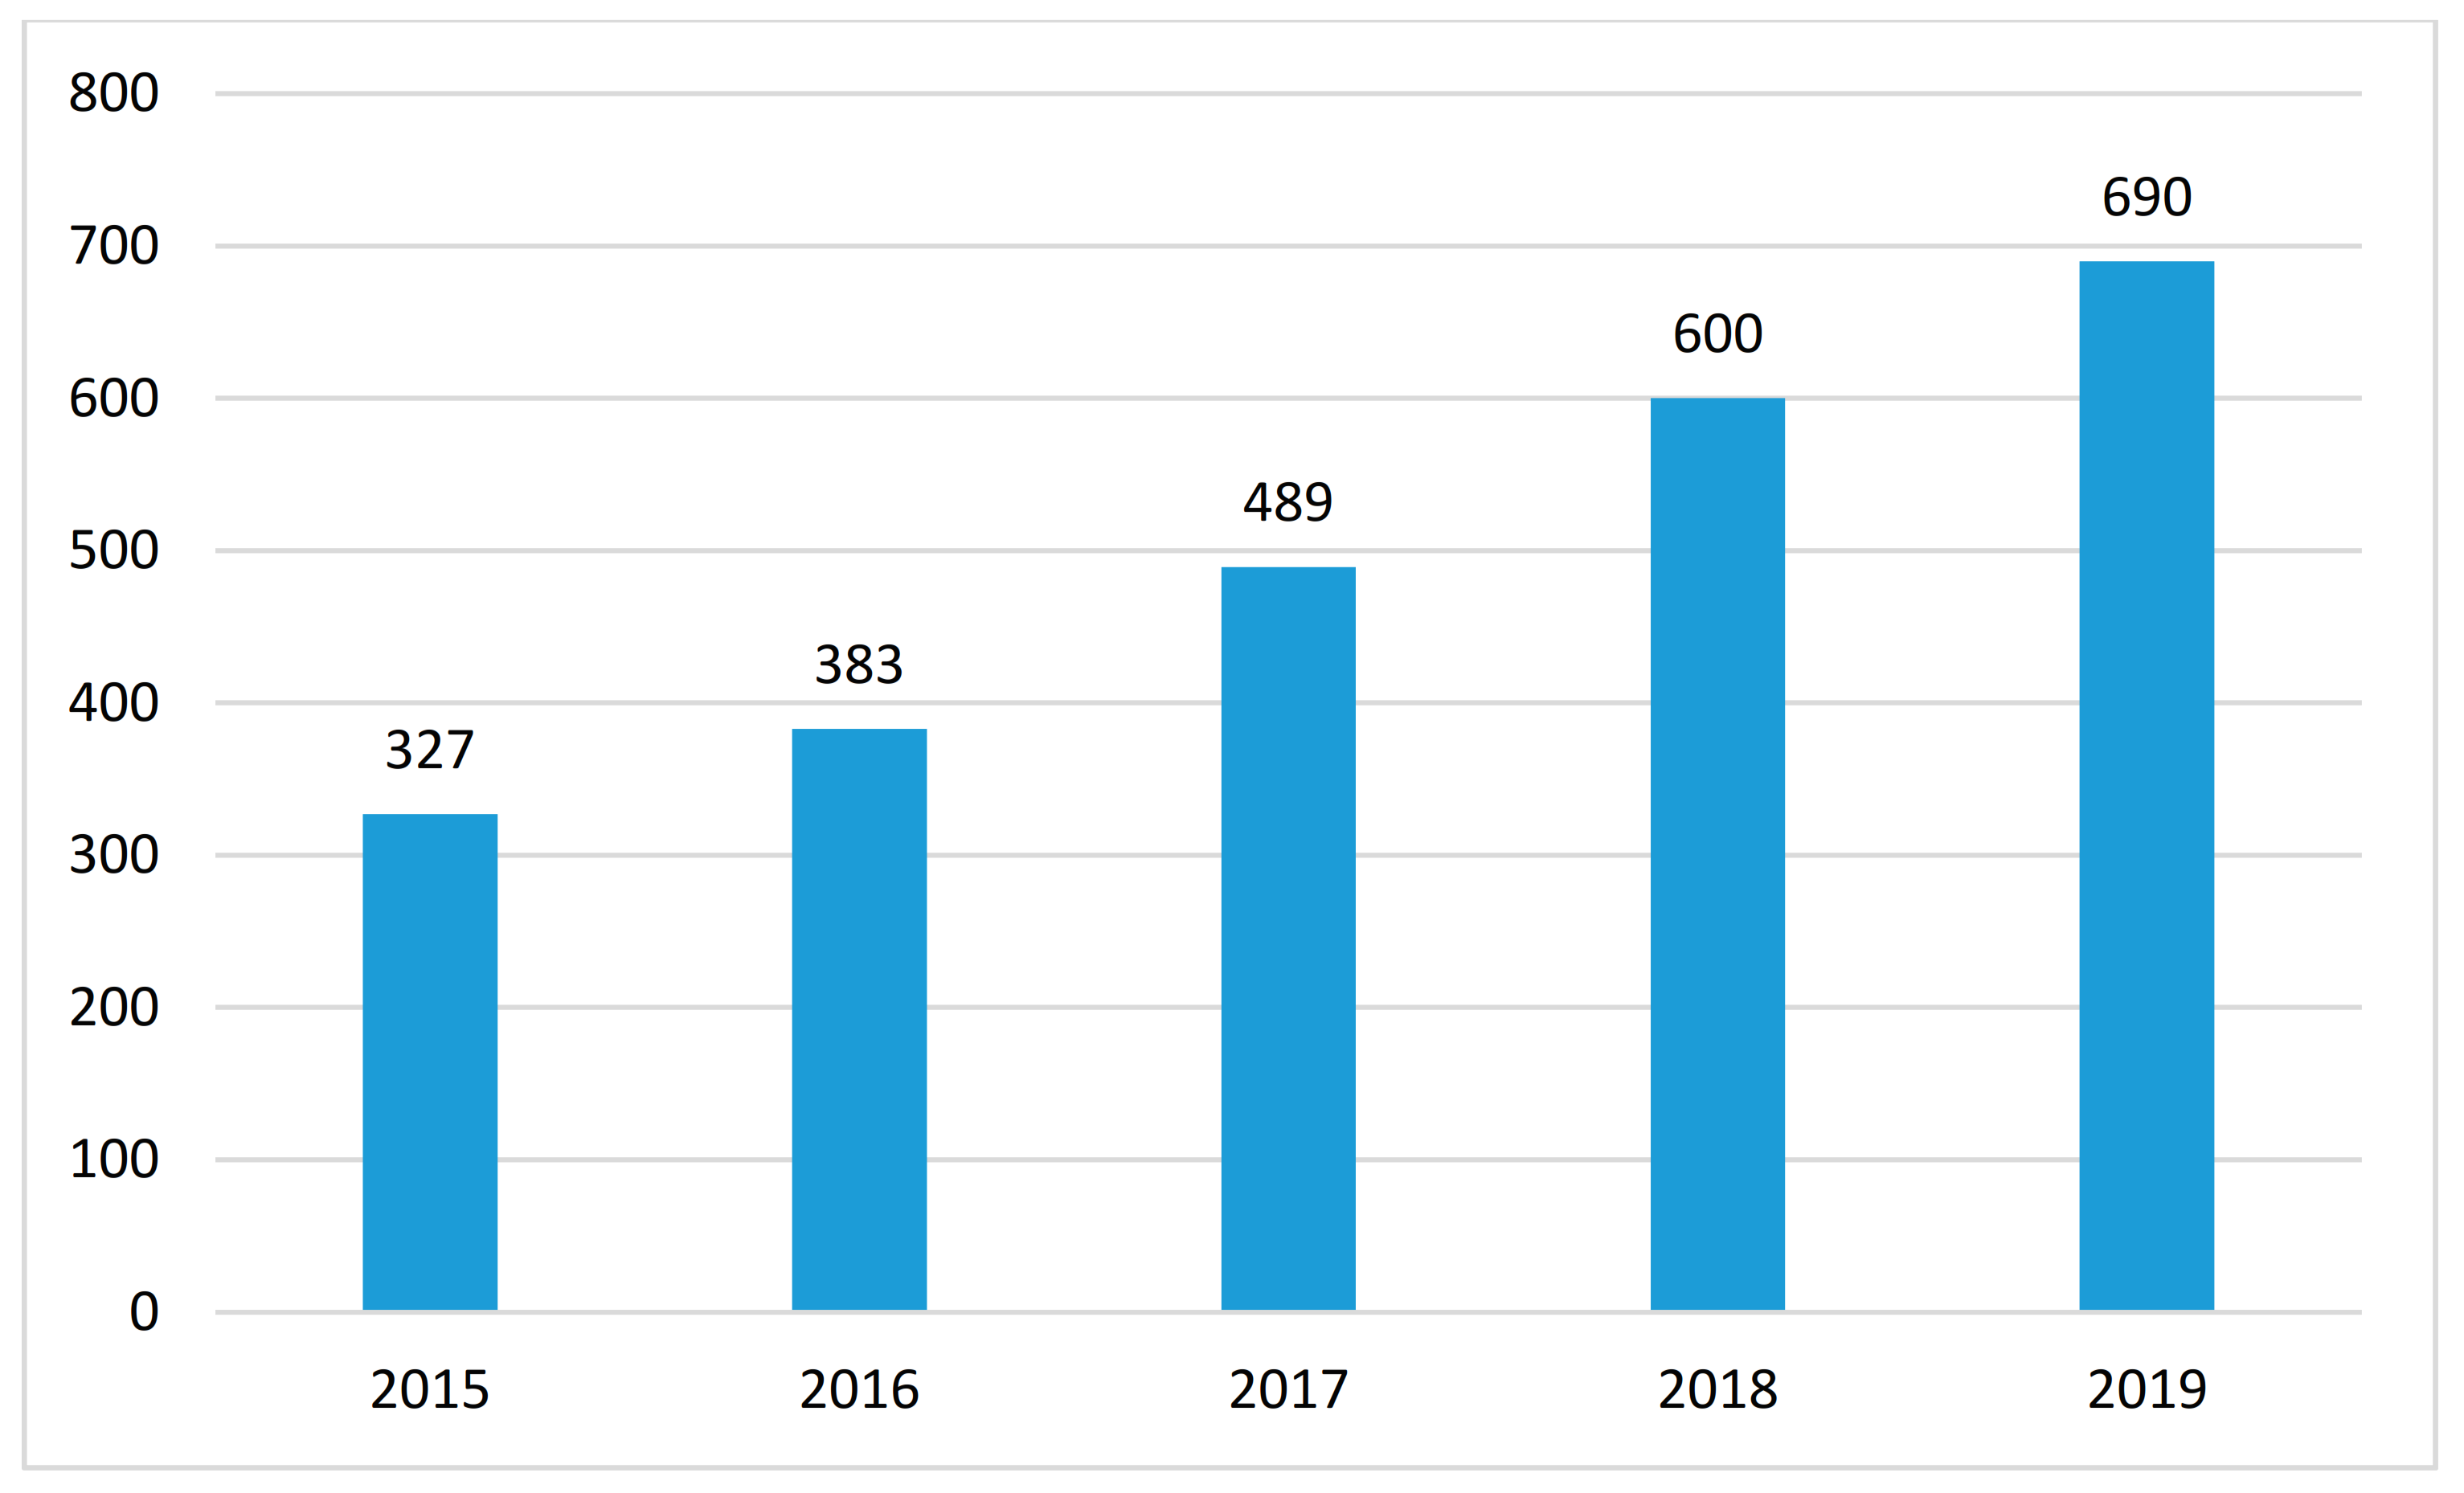
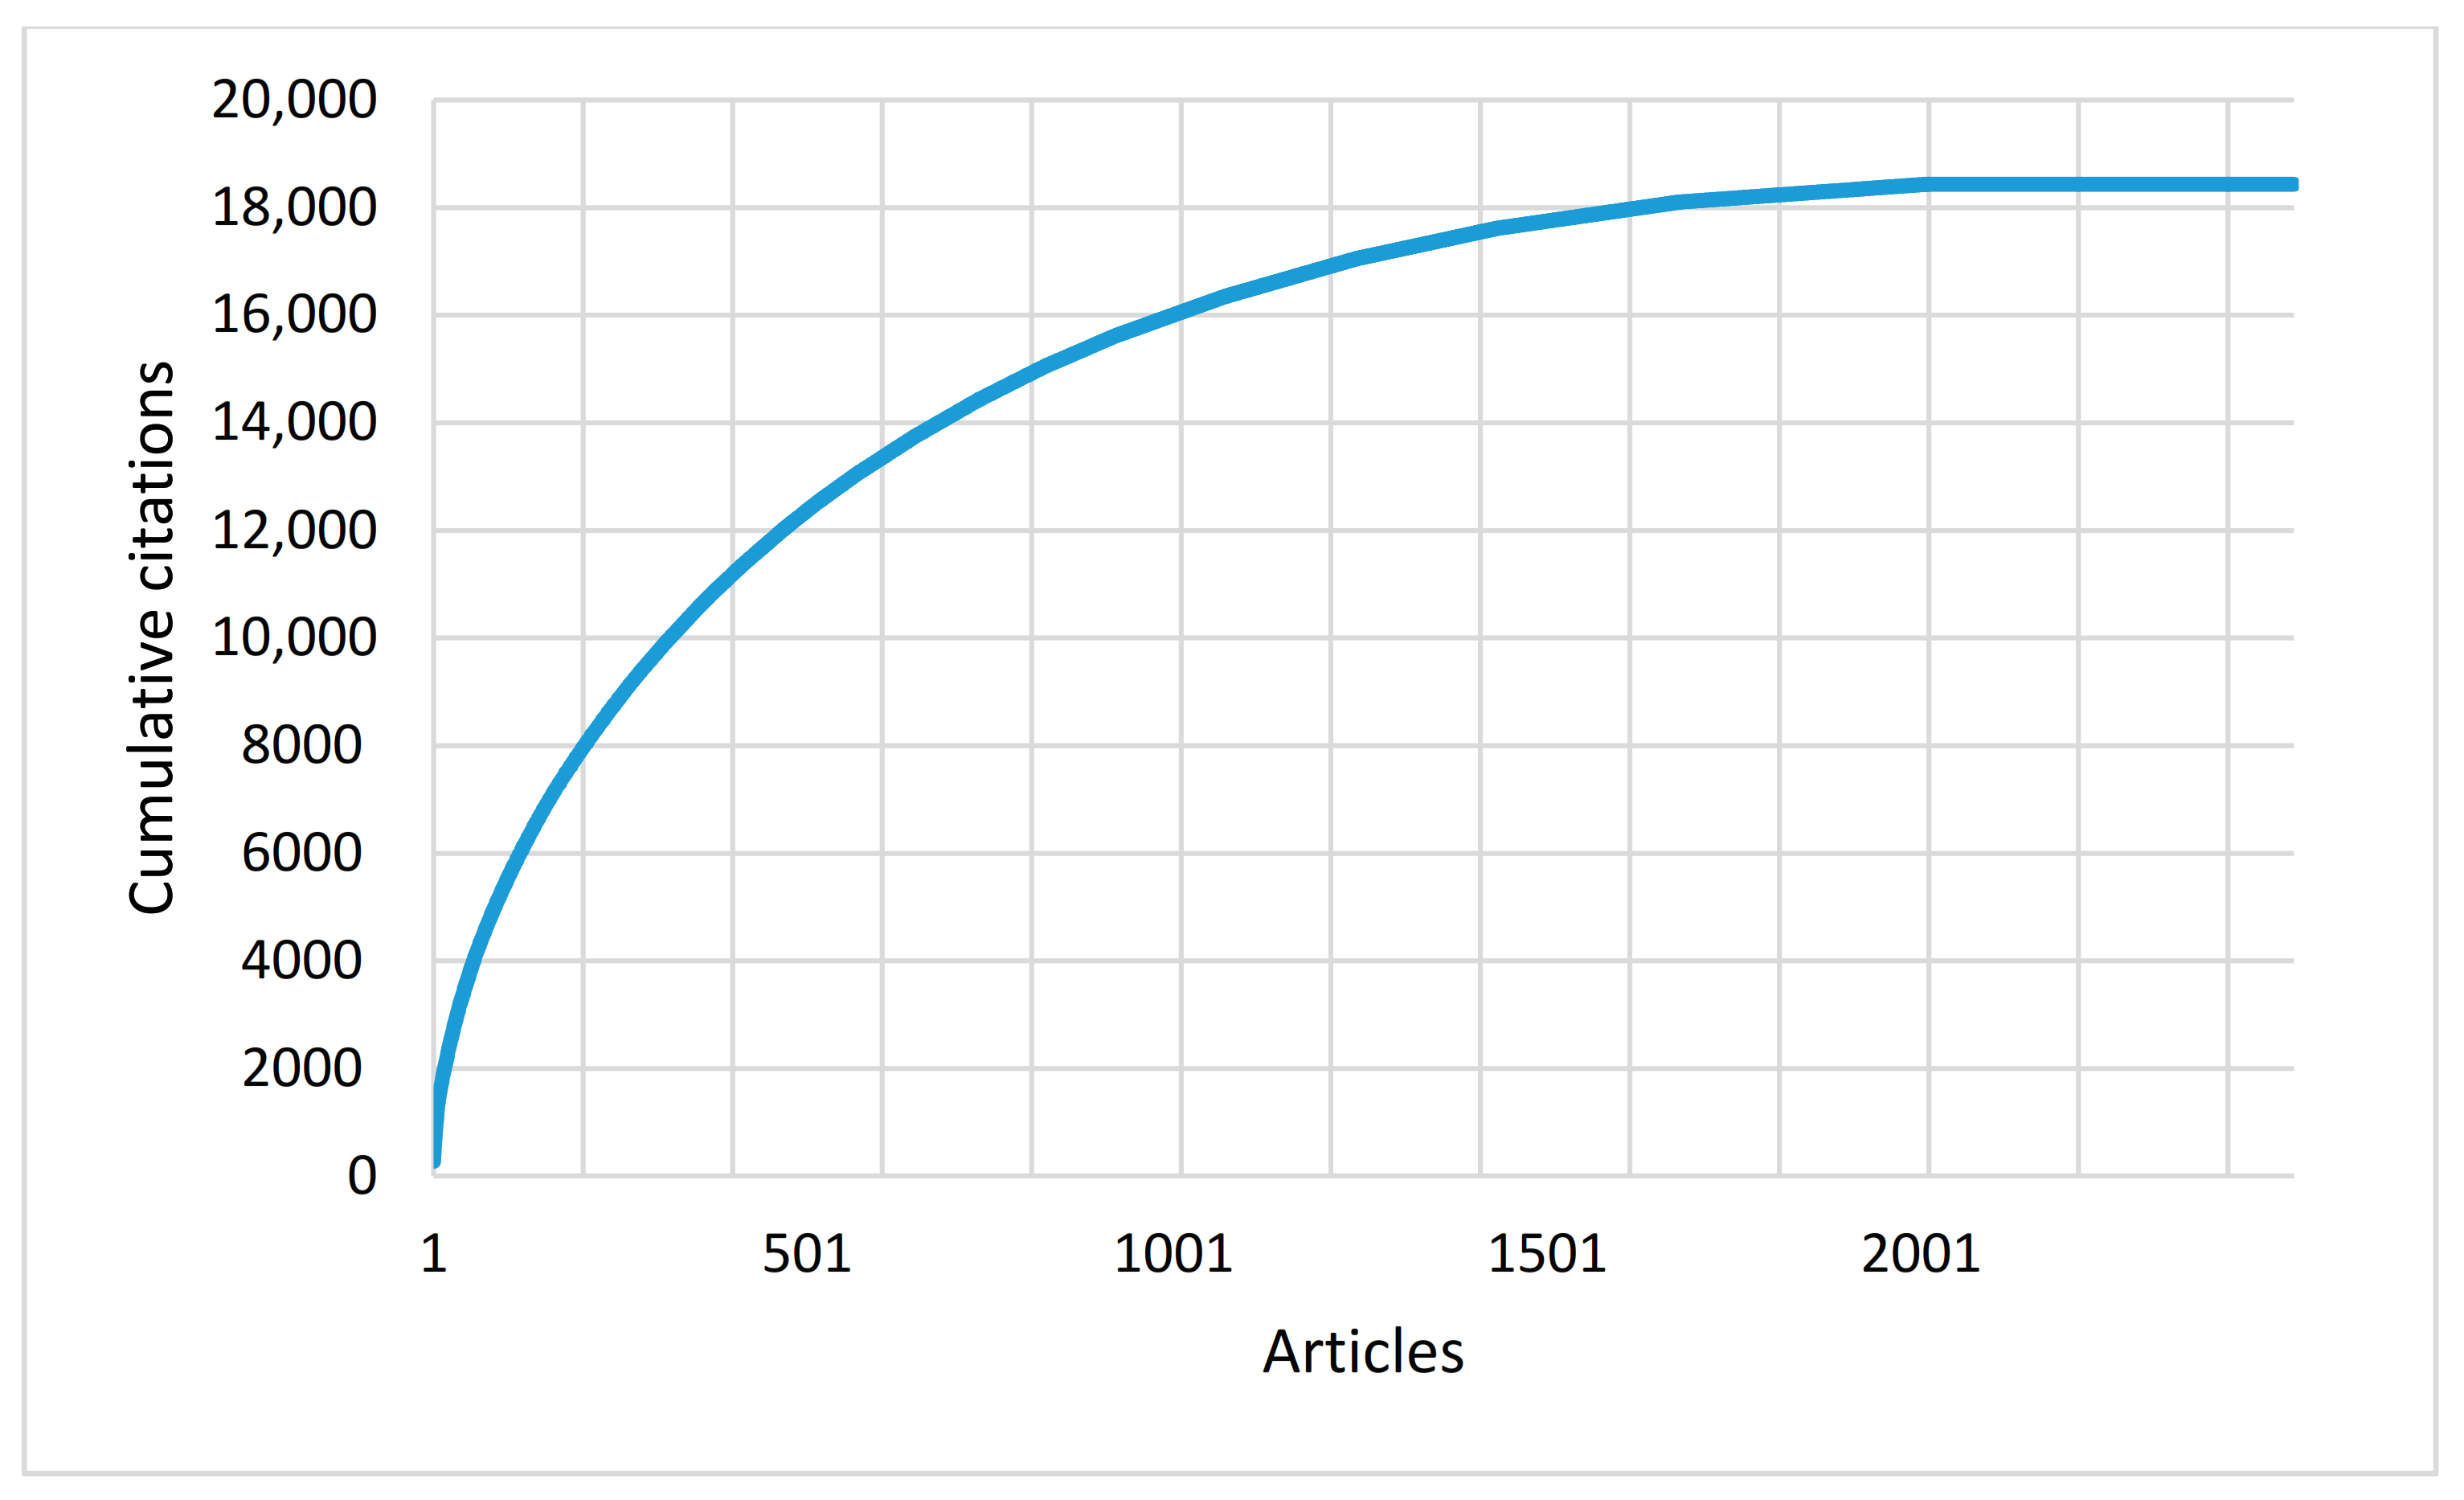
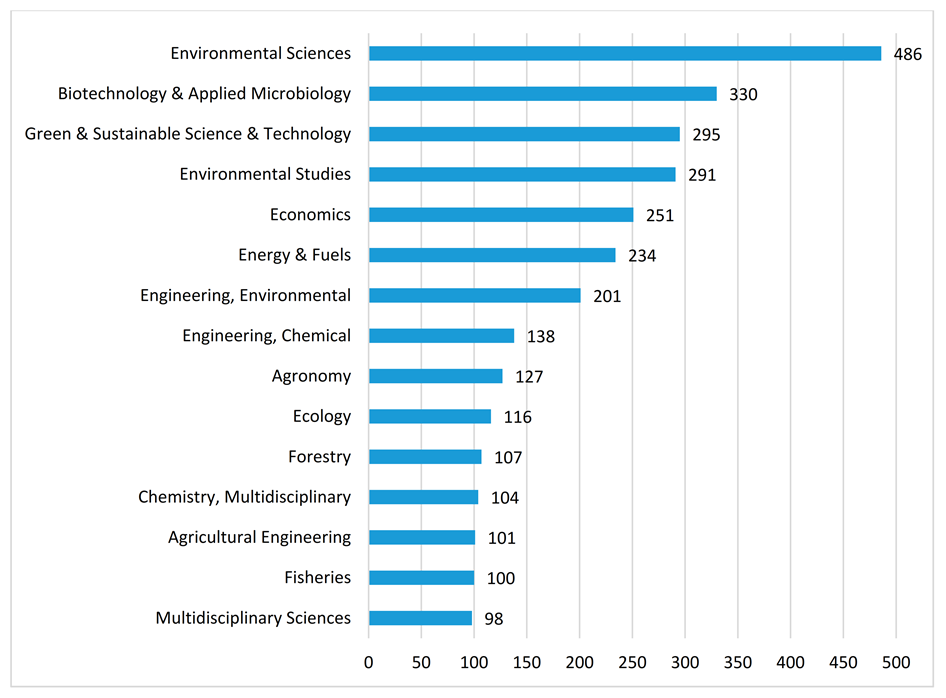
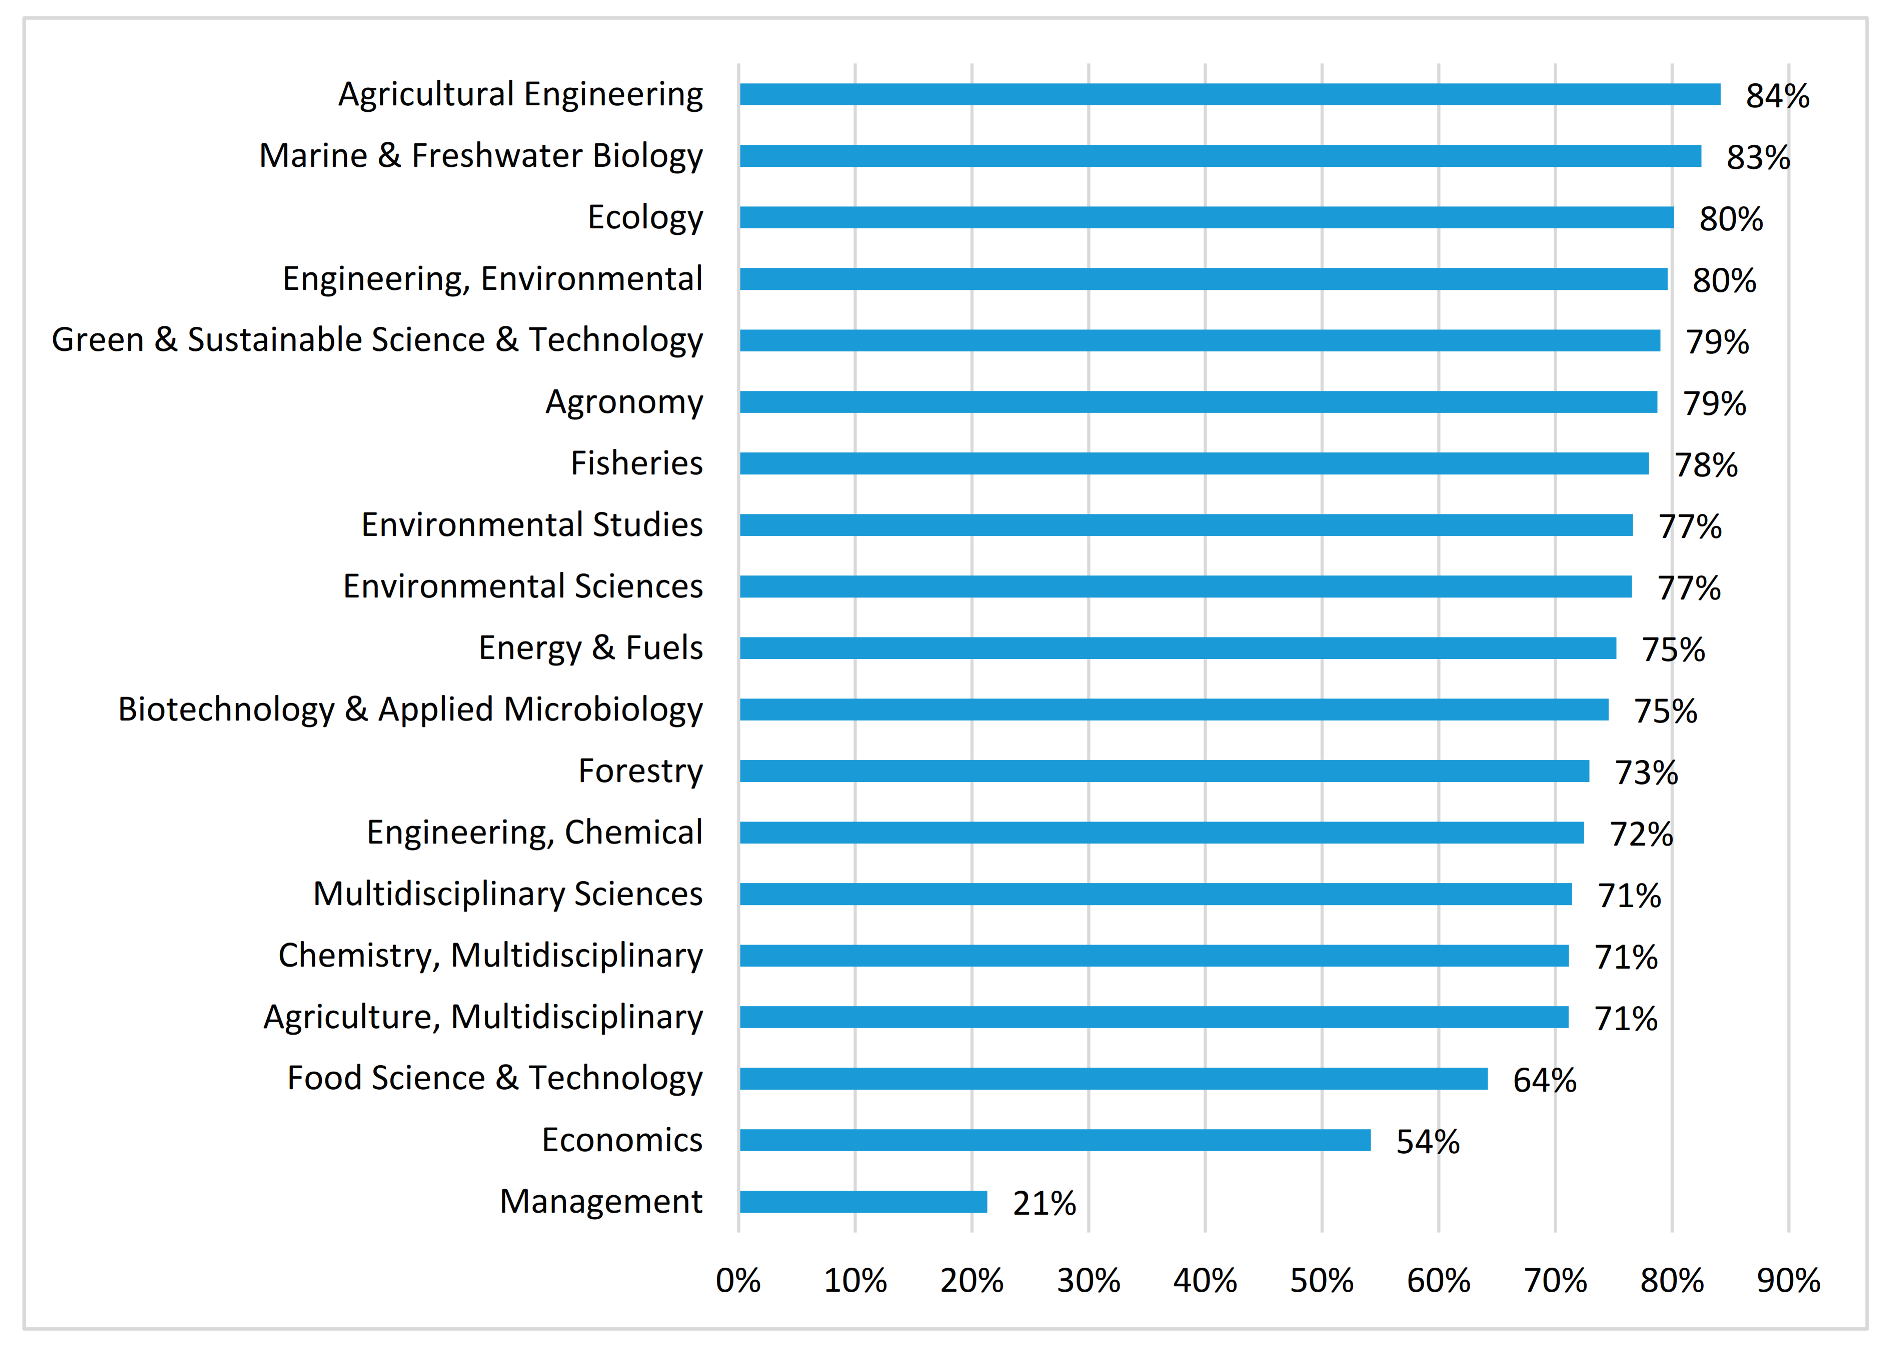
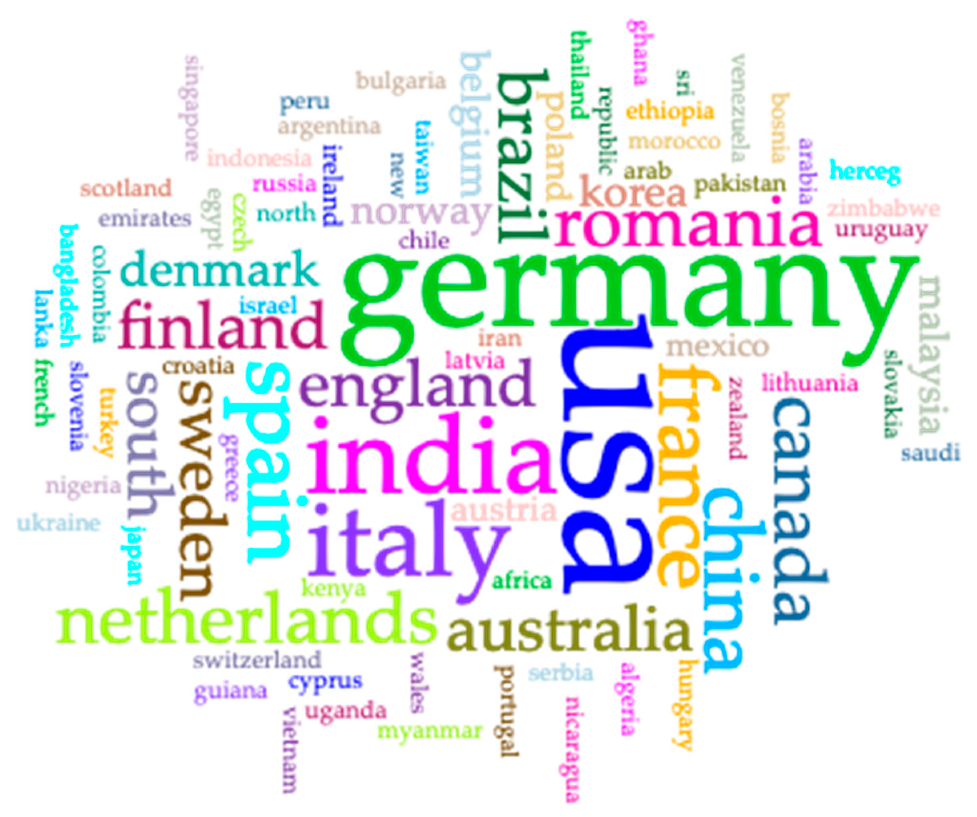
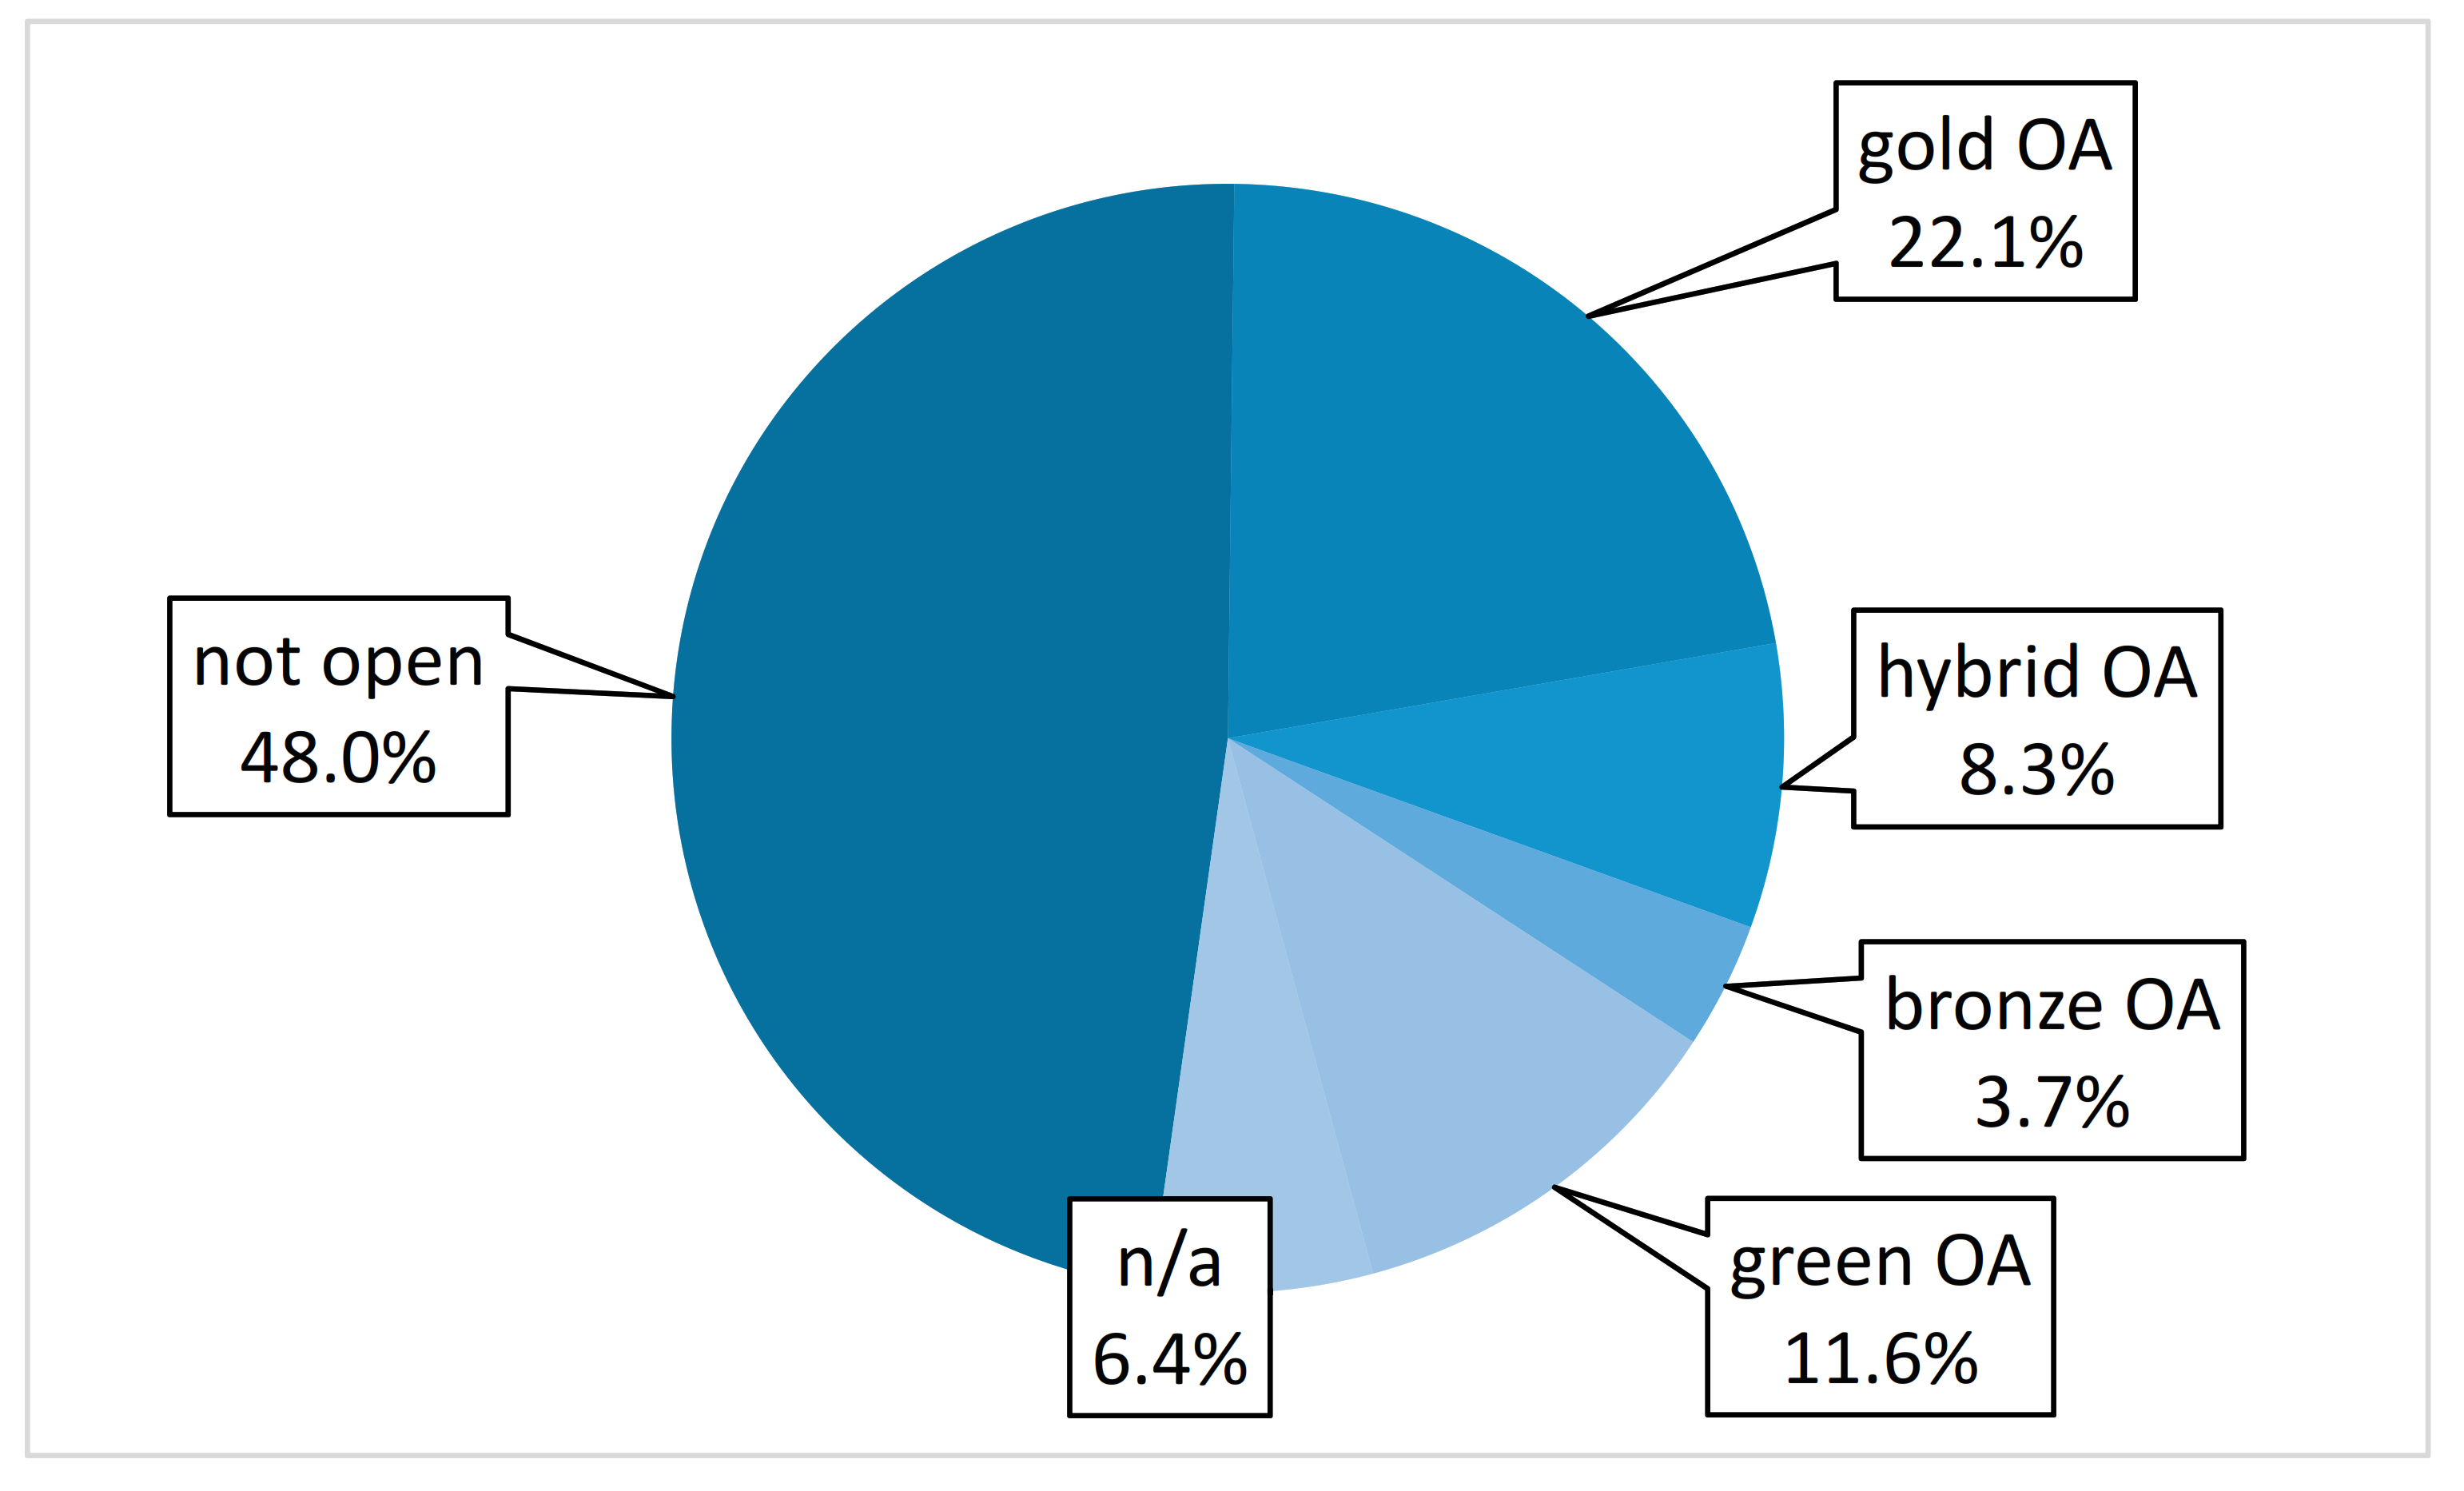
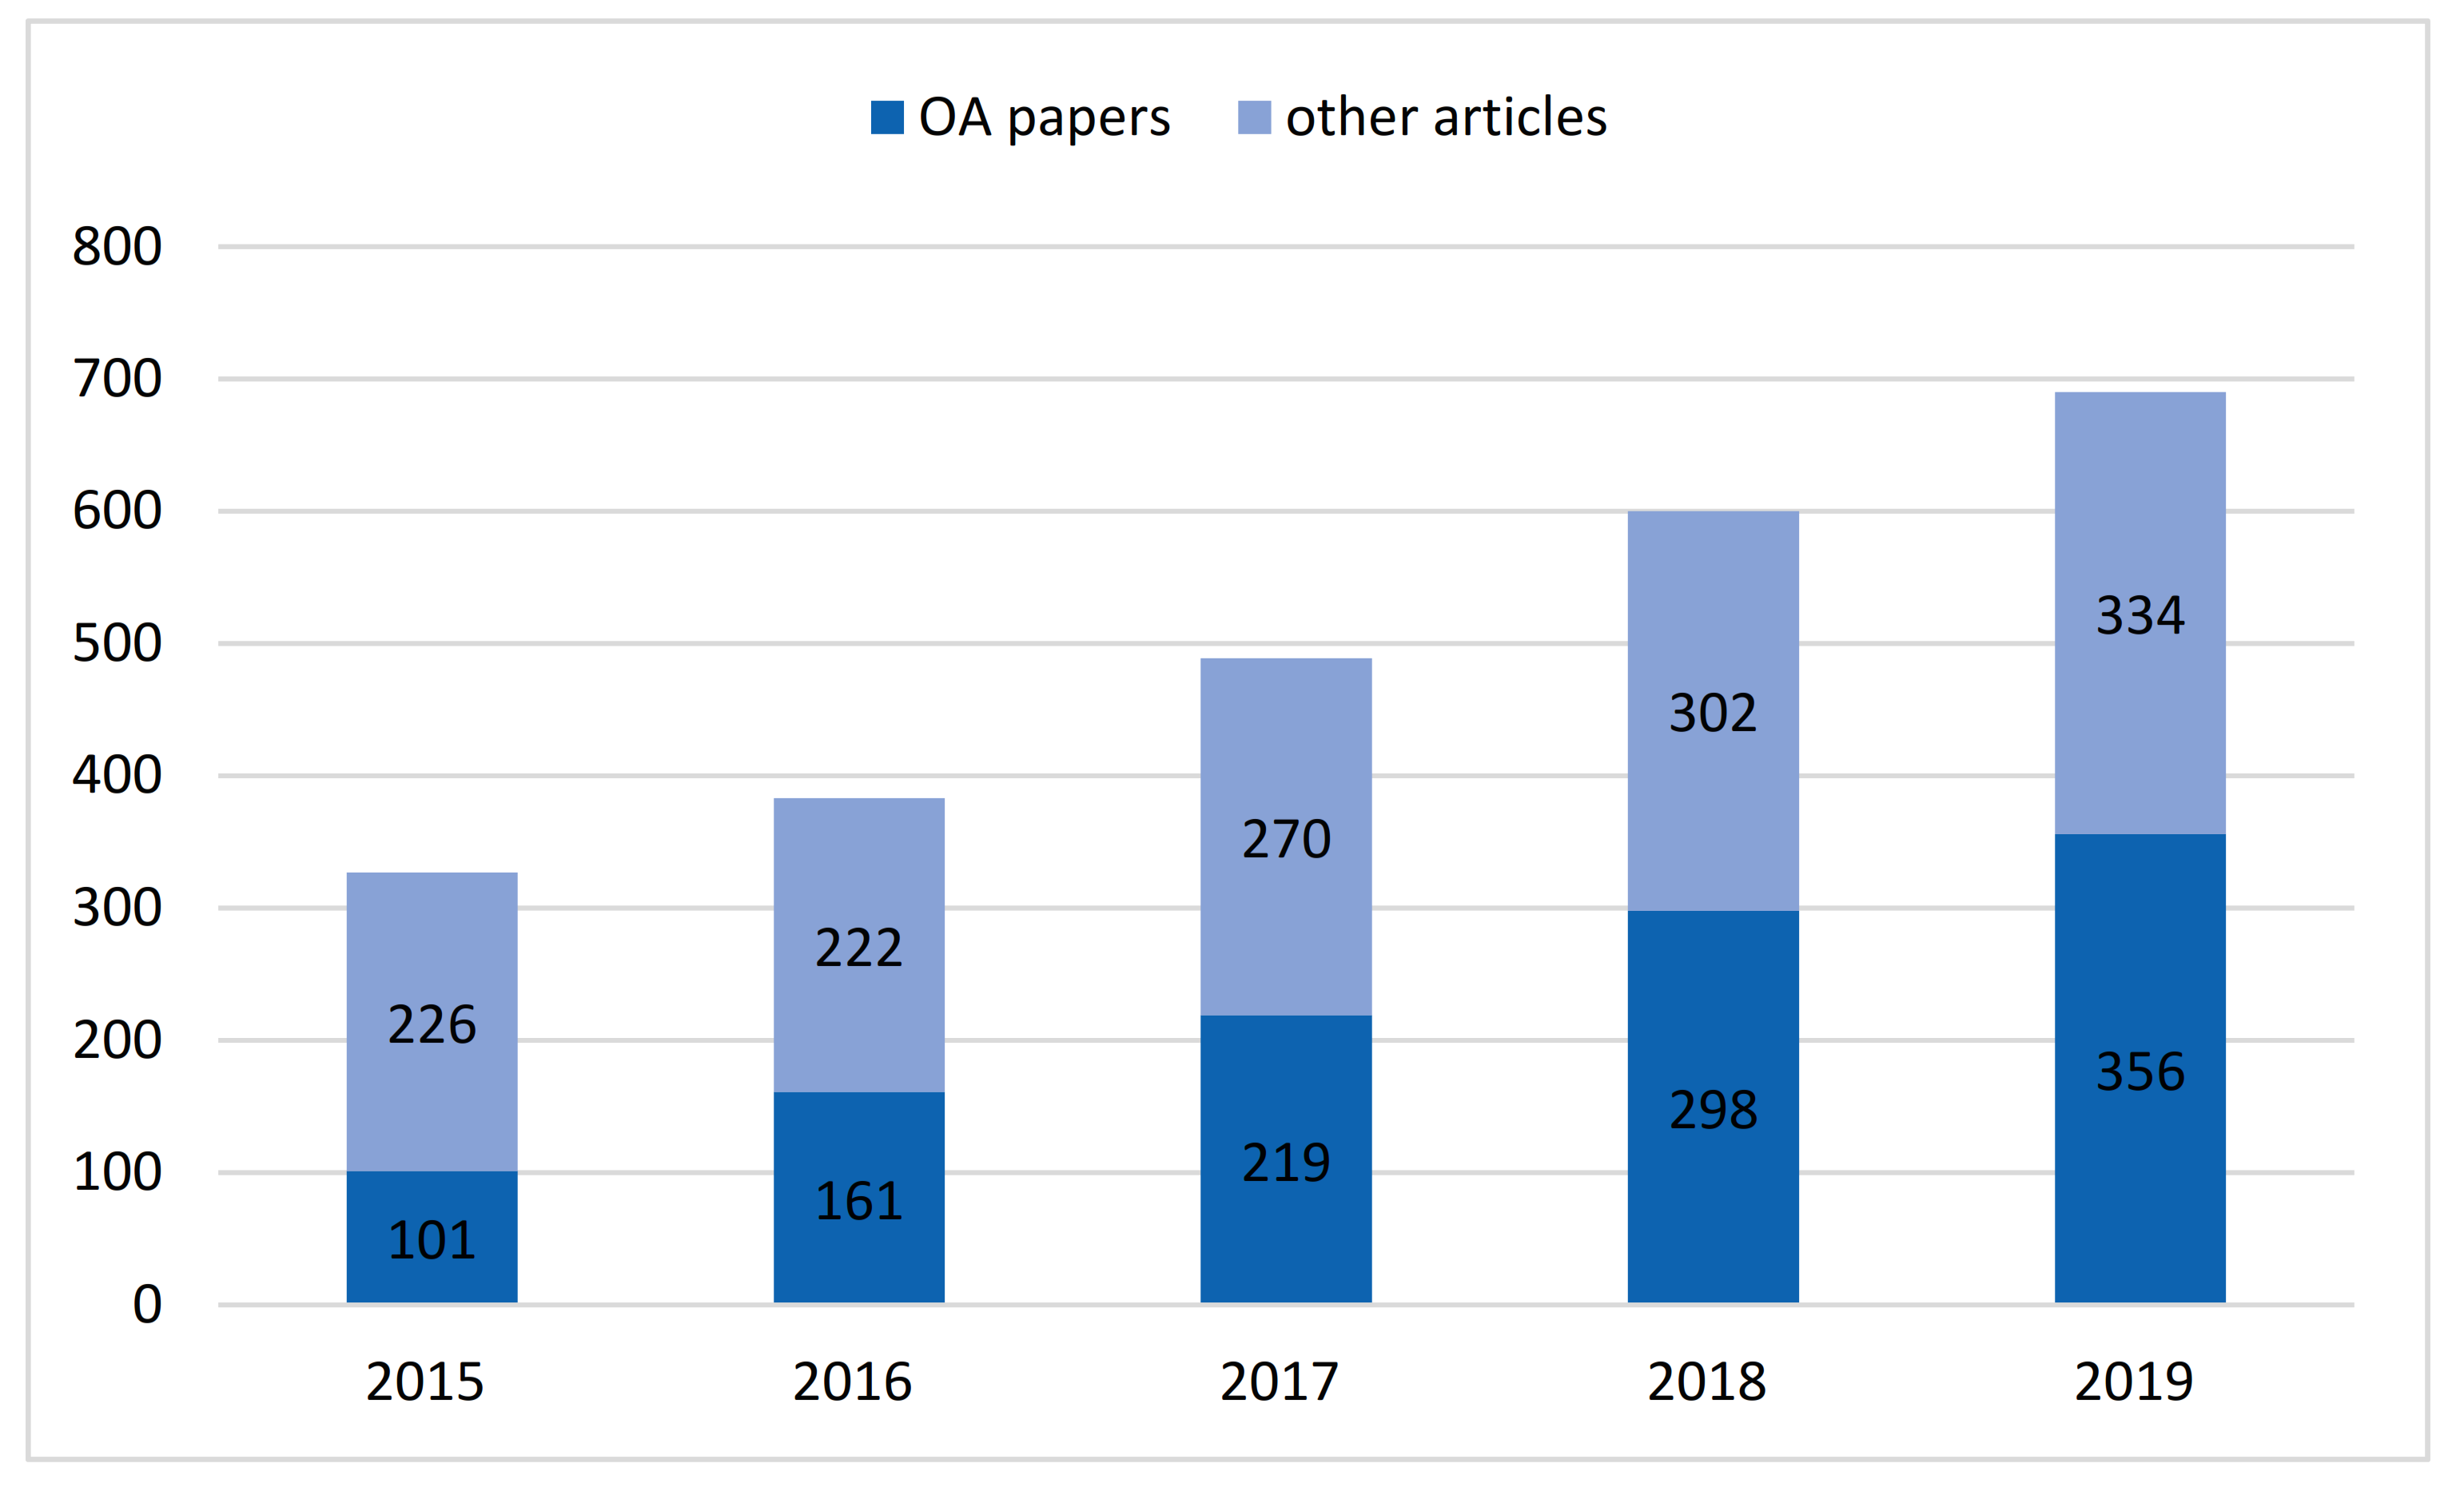
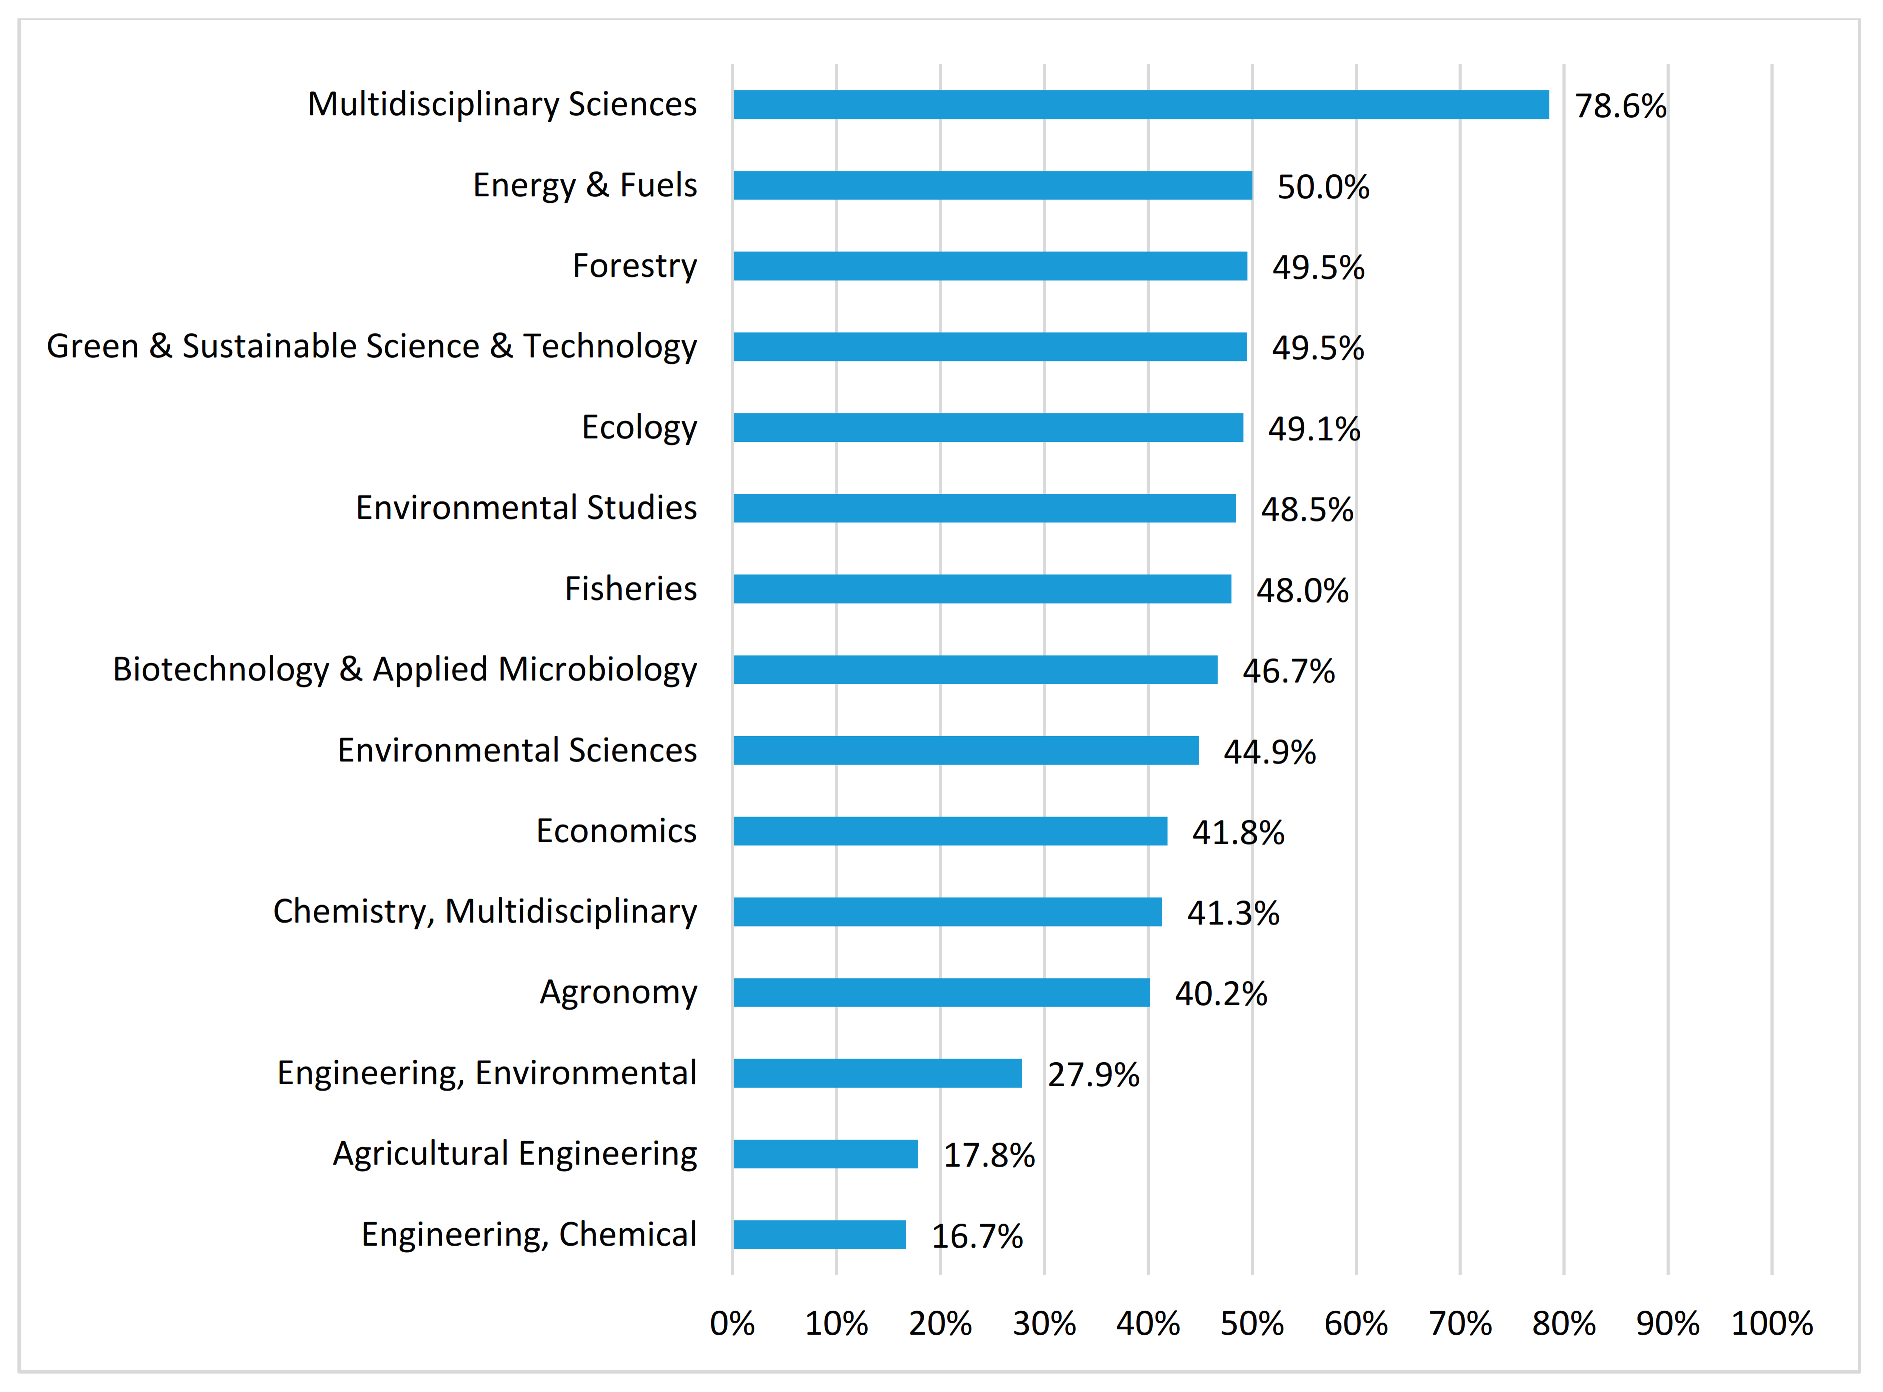
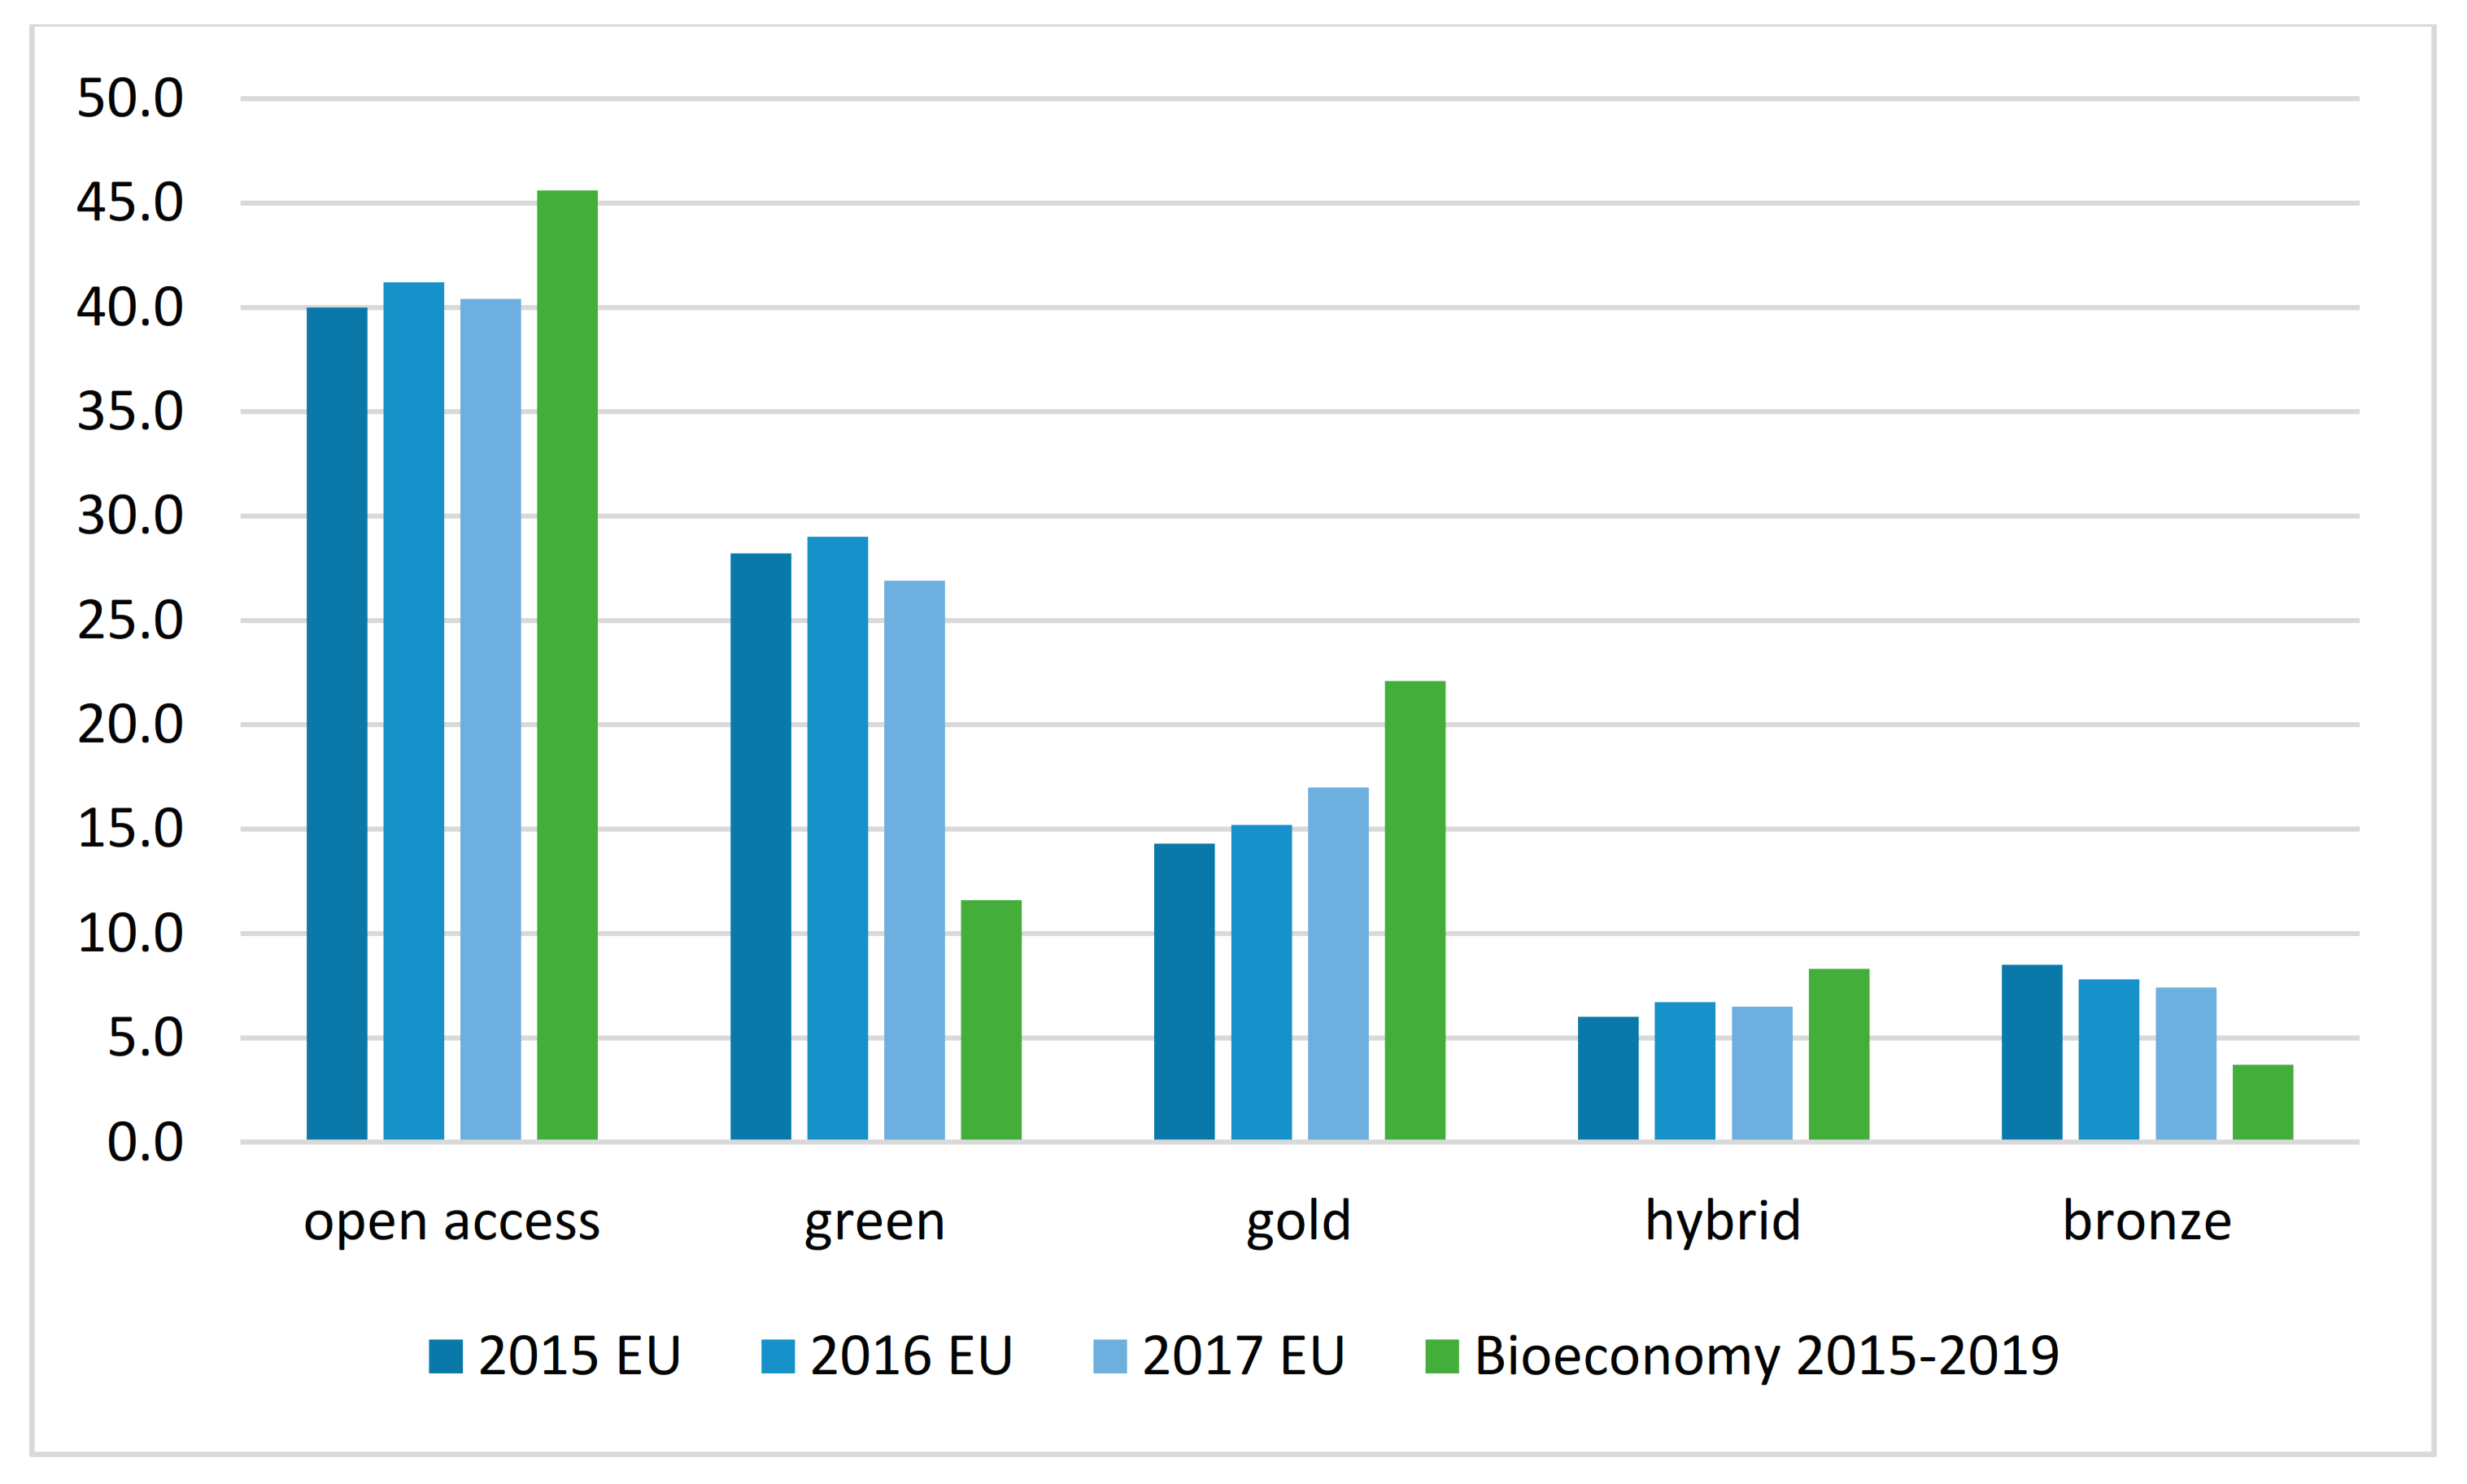
Table 1.
Number of citations received by the five most cited articles.
| Article #1 | Sheldon, R. A. (2017). The E factor 25 years on: the rise of green chemistry and sustainability. Green Chemistry, 19(1), 18–43. https://0-doi-org.brum.beds.ac.uk/10.1039/C6GC02157C | 269 citations |
| Article #2 | Scarlat, N. et al. (2015). The role of biomass and bioenergy in a future bioeconomy: Policies and facts. Environmental Development, 15, 3–34. https://0-doi-org.brum.beds.ac.uk/10.1016/j.envdev.2015.03.006 | 258 citations |
| Article #3 | Schneiderman, D. K., & Hillmyer, M. A. (2017). 50th Anniversary Perspective: There Is a Great Future in Sustainable Polymers. Macromolecules, 50(10), 3733–3749. https://0-doi-org.brum.beds.ac.uk/10.1021/acs.macromol.7b00293 | 207 citations |
| Article #4 | Costello, C. et al. (2016). Global fishery prospects under contrasting management regimes. Proceedings of the National Academy of Sciences, 113(18), 5125–5129. https://0-doi-org.brum.beds.ac.uk/10.1073/pnas.1520420113 | 202 citations |
| Article #5 | Meadows, A. L. et al. (2016). Rewriting yeast central carbon metabolism for industrial isoprenoid production. Nature, 537(7622), 694–697. https://0-doi-org.brum.beds.ac.uk/10.1038/nature19769 | 144 citations |
Table 2.
Median number of citations per year, for all articles (n = 2489).
| Publication Year | Median of Citations |
|---|---|
| 2015 | 7 |
| 2016 | 7 |
| 2017 | 5 |
| 2018 | 3 |
| 2019 | 1 |
| All years | 3 |
Table 3.
The journals with the highest number and share of articles and citations (n = 2489).
| Journal | Nb Art | % Art | Nb Cit | % Cit |
|---|---|---|---|---|
| Journal of Cleaner Production | 121 | 4.86% | 1529 | 8.3% |
| Sustainability | 76 | 3.05% | 596 | 3.23% |
| Agricultural Systems | 49 | 1.97% | 340 | 1.84% |
| Industrial Crops and Products | 47 | 1.89% | 576 | 3.13% |
| Ecological Economics | 39 | 1.57% | 206 | 1.12% |
Table 4.
Most important publishers with number and share of articles and citations (n = 2489).
| Publisher | Nb Art | % Art | Nb Cit | % Cit |
|---|---|---|---|---|
| Elsevier | 792 | 31.8% | 7773 | 42.2% |
| Springer Nature | 273 | 11.0% | 1852 | 10.0% |
| Wiley Blackwell | 244 | 9.8% | 1501 | 8.1% |
| MDPI | 154 | 6.2% | 1007 | 5.5% |
| Taylor & Francis | 102 | 4.1% | 340 | 1.8% |
Table 5.
The ten most prominent authors with number articles and citations (n = 2489).
| Author | Country | Articles | Citations |
|---|---|---|---|
| Mohan, S.V. | India | 17 | 149 |
| Pagliaro, M. | Italy | 16 | 212 |
| Cirminna, R. | Italy | 14 | 212 |
| Zhang, Q. | China | 13 | 146 |
| Sanchirico, J.N. | USA | 13 | 72 |
| Blumberga, D. | Latvia | 12 | 49 |
| Thraen, D. | Germany | 11 | 91 |
| Monti, A. | Italy | 10 | 117 |
| Dragicevic, A.Z. | France | 10 | 19 |
| Zanetti, F. | Italy | 9 | 86 |
Table 6.
The ten most important organizations, with articles and citations (n = 2489).
| Organization | Nb Art | % Art | Nb Cit | % Cit |
|---|---|---|---|---|
| Wageningen University (NL) | 80 | 3.2% | 1064 | 5.8% |
| National Institute of Agricultural Research (F) | 54 | 2.2% | 326 | 1.8% |
| US Department of Agriculture (USA) | 40 | 1.6% | 249 | 1.4% |
| Commonwealth Scientific and Industrial Research Organization (AUS) | 37 | 1.5% | 198 | 1.1% |
| Swedish University of Agricultural Sciences (SE) | 37 | 1.5% | 201 | 1.1% |
| Technical University of Denmark (DK) | 37 | 1.5% | 417 | 2.3% |
| University of Hohenheim (D) | 37 | 1.5% | 260 | 1.4% |
| University of Helsinki (FI) | 32 | 1.3% | 464 | 2.5% |
| National Research Council (I) | 31 | 1.2% | 279 | 1.5% |
| Delft University of Technology (NL) | 30 | 1.2% | 740 | 4.0% |
Table 7.
Number and share of articles and citations per type of organization (n = 2100).
| Type of Organization | Nb Org | % Org | Nb Art | % Art | Nb Cit | % Cit |
|---|---|---|---|---|---|---|
| Higher education institution | 1312 | 53.1% | 2151 | 86.4% | 15,778 | 85.6% |
| Research institute | 456 | 18.5% | 806 | 32.4% | 6577 | 35.7% |
| Company | 128 | 5.2% | 163 | 6.5% | 1658 | 9.0% |
| Government organization | 95 | 3.8% | 232 | 9.3% | 1695 | 9.2% |
| Public agency | 92 | 3.7% | 131 | 5.3% | 1043 | 5.7% |
| International organization | 17 | 0.7% | 45 | 1.8% | 627 | 3.4% |
Table 8.
The ten countries with the highest number of articles (n = 2489).
| Country | Nb Art | Nb Cit |
|---|---|---|
| USA | 436 | 3496 |
| Germany | 299 | 2872 |
| Italy | 200 | 2002 |
| France | 172 | 1151 |
| UK | 166 | 1728 |
| Netherlands | 161 | 2036 |
| Spain | 145 | 1000 |
| India | 142 | 864 |
| People’s Republic of China | 122 | 1239 |
| Australia | 115 | 655 |
Table 9.
The journals with the highest number and share of OA articles (n = 1135).
| Journal | Nb Art OA | % Art OA |
|---|---|---|
| Sustainability | 76 | 6.70% |
| Journal of Cleaner Production | 33 | 2.91% |
| Amfiteatru Economic | 32 | 2.82% |
| Biotechnology for Biofuels | 29 | 2.56% |
| Global Change Biology Bioenergy | 23 | 2.03% |
Table 10.
Most important publishers with number and share of articles and OA articles (n = 2489).
| Publisher | Nb Art | % Art | Nb Art OA | % Art OA |
|---|---|---|---|---|
| Elsevier | 791 | 31.8% | 216 | 27.3% |
| Springer Nature | 273 | 11.0% | 103 | 37.7% |
| Wiley Blackwell | 242 | 9.7% | 107 | 44.2% |
| MDPI | 154 | 6.2% | 154 | 100.0% |
| Taylor & Francis | 102 | 4.1% | 40 | 39.2% |
Table 11.
Ten countries with articles and OA articles (n = 2489).
| Country | Nb Art | Nb Art OA | % Art OA |
|---|---|---|---|
| USA | 436 | 203 | 46.6% |
| Germany | 299 | 170 | 56.9% |
| Italy | 200 | 90 | 45.0% |
| France | 172 | 92 | 53.5% |
| UK | 166 | 115 | 69.3% |
| Netherlands | 161 | 102 | 63.4% |
| Spain | 145 | 86 | 59.3% |
| India | 142 | 32 | 22.5% |
| People’s Republic of China | 122 | 43 | 35.2% |
| Australia | 115 | 44 | 46.6% |
Table 12.
Most cited articles and their part of citations (sources: [8]; own data).
Publisher’s Note: MDPI stays neutral with regard to jurisdictional claims in published maps and institutional affiliations. |
© 2020 by the authors. Licensee MDPI, Basel, Switzerland. This article is an open access article distributed under the terms and conditions of the Creative Commons Attribution (CC BY) license (http://creativecommons.org/licenses/by/4.0/).
Share and Cite
MDPI and ACS Style
Duquenne, M.; Prost, H.; Schöpfel, J.; Dumeignil, F. Open Bioeconomy—A Bibliometric Study on the Accessibility of Articles in the Field of Bioeconomy. Publications 2020, 8, 55. https://0-doi-org.brum.beds.ac.uk/10.3390/publications8040055
AMA Style
Duquenne M, Prost H, Schöpfel J, Dumeignil F. Open Bioeconomy—A Bibliometric Study on the Accessibility of Articles in the Field of Bioeconomy. Publications. 2020; 8(4):55. https://0-doi-org.brum.beds.ac.uk/10.3390/publications8040055
Chicago/Turabian StyleDuquenne, Marianne, Hélène Prost, Joachim Schöpfel, and Franck Dumeignil. 2020. "Open Bioeconomy—A Bibliometric Study on the Accessibility of Articles in the Field of Bioeconomy" Publications 8, no. 4: 55. https://0-doi-org.brum.beds.ac.uk/10.3390/publications8040055
Note that from the first issue of 2016, this journal uses article numbers instead of page numbers. See further details here.