Article

Factors to Improve Publication Productivity in Russian Universities

by
Мarina V. Vasiljeva
1,2,*,
Gennady V. Osipov
3,
Vadim V. Ponkratov
4,
Vitali Ju. Ivlev
5,
Marina I. Ivleva
6,
Svetlana G. Karepova
7,
Zhanna R. Gardanova
8 and
Olesya V. Dudnik
9
1
Top Management, Atlantic Science and Technology Academic Press, Boston, MA 01233, USA
2
Autonomous Non-Profit Organization “Publishing House Scientific Review” (Nauchnoe Obozrenie), 127051 Moscow, Russia
3
Joint Center for Sociology and Economics of Knowledge, Institute of Socio-Political Research of the Federal Center of Theoretical and Applied Sociology of the Russian Academy of Sciences, 6 Fotieva St., bld. 1, 119333 Moscow, Russia
4
Department of Public Finance, Faculty of Finance, Financial University under the Government of the Russian Federation, 49 Leningradsky Ave., 125993 Moscow, Russia
5
Philosophy Department, Social Sciences and Humanities Faculty, Bauman Moscow State Technical University, 5 Baumanskaya 2-ya St., 105005 Moscow, Russia
6
Humanitarian Training Center, History and Philosophy Department, Plekhanov Russian University of Economics, 36 Stremyanny lane, 117997 Moscow, Russia
7
Operational Research Department, Institute of Socio-Political Research of the Federal Center of Theoretical and Applied Sociology of the Russian Academy of Sciences, 6 Fotieva St., bld. 1, 119333 Moscow, Russia
8
Department of Psychotherapy, Pirogov Russian National Research Medical University, 1 Ostrovityanova St., 117997 Moscow, Russia
9
Department of Pediatric Dentistry and Orthodontics, I.M. Sechenov First Moscow State Medical University (Sechenov University), 8-2 Trubetskaya St., 119991 Moscow, Russia
*
Author to whom correspondence should be addressed.
Submission received: 12 February 2021 / Revised: 20 April 2021 / Accepted: 7 May 2021 / Published: 13 May 2021

Abstract

:
One of the most important conditions for the effectiveness of science is the motivation of academic staff of universities as key and direct producers of new knowledge. The purpose of the article was to substantiate the factors of efficiency in managing the publication activity of Russian universities. The nature and density of the relationship between the number of scientific publications and the level of citation of 19 leading countries in the world, including Russia, were determined by means of statistical analysis and the method of clusters. It has been empirically proven that the priority model for the development of publication activity should be an intensive model, which aims at improving the quality of scientific publications and the level of their citation. Moreover, a survey of 1573 young scientists (under the age of 39) and 2461 senior scientists from 14 universities in Russia was conducted. It investigated the factors of effective management of the publication activity at Russian universities. The results contribute to a better understanding on how Russian universities can activate and foster the flow of high-quality publication outputs by their researchers.

1. Introduction

Russian universities’ development has enhanced the country’s innovation and economic growth, causing, in turn, a radical transformation in Russia’s higher education system [1,2]. Alongside the progress made in higher education institutions’ traditional educational mission (formation and development of students’ professional competences [3]), we have also seen rapid scientific activity growth. New university activity areas include developing and transferring scientific technologies and commercializing academic science products [4].
To measure the effectiveness of science in universities and determine research financing, most countries use the following criteria: publications in academic journals, citations and derivative indicators (h-index, scientific publications co-authors number, professional expertise, etc.) [5,6,7]. Despite this method imperfection and the ample criticism it has faced [8,9,10,11], publication productivity is the fundamental and most representative characteristic of national and individual scientific contribution [12,13]. However, it should be noted that, from 2013 to 2018, more than 40% of the total Russian publication flow came from organizations in the Russian Academy of Sciences (RAS) [14], and only one third (30%) of all Russian publications originated in universities participating in Project 5-100 (15 universities) [15]. The remaining publications came from the residual Russian universities (1156 universities), individual researchers and other research organizations [15]. Traditionally, Russian universities only performed an educational function; they were not research centers, as in Western countries [16]. This disadvantage is one fundamental reason their publication productivity is still lower than the world and European averages, especially for such leaders as the USA, Great Britain and China [17].
Currently, stimulating publication productivity in Russian universities is the primary goal of the National Project “Science” of the Russian Government [18] and the draft order “On the Approval of Performance Indicators for Federal Budget and Autonomous Educational Institutions of Higher Education Ministry of Science and Higher Education of the Russian Federation, and the Work of Their Leaders” [19]. The National Project “Science” suggests developing the following aspects [18]:
-
Scientific and industrial cooperation;
-
Advanced infrastructure for research and development in the Russian Federation; and
-
Human resources in research and development.
Quantitative indicators of the Project’s target values in the sphere of publication productivity also include increases in publication quantity and young scientists’ number. The first indicator introduces the Project’s orientation toward extended productivity (i.e., more significant numbers). These publications’ quality is evaluated only by the number of articles in journals in the first and second quartiles. (The quartiles rank the journals from highest to lowest based on their impact factor or impact index. There are four quartiles: Q1, Q2, Q3 and Q4. The most prestigious journals within a subject area are those occupying the first quartiles, Q1 and Q2.) [20] The authors of this National Project consider the number of citations a more accurate measure, as this reflects the relevance of scientific productivity’s results. However, this measure was not studied in the project.
National Project “Science” considers young scientists (under 39) significant to scientific development [18]. Increasing the proportion of young scientists should contribute to the development of publication productivity in Russian universities accordingly, as they are more flexible in learning, creativity and innovation [21,22]. However, it is worth noting that older scientists who are more experienced in scientific and publication activities have both a research reputation and more scientific cooperation opportunities [23]. This fact casts doubt on publication productivity management’s effectiveness, given the substantial recent influx of young scientists.
The aspects of the management and development of publication productivity in Russian universities form our research object. Therefore, this work aims to determine the main management factors that lead to the significant growth of publication productivity in Russian universities. To solve this scientific problem, the authors empirically substantiated the interaction of the publication productivity management quantity and citation in leading countries. The authors also identified and analyzed the primary factors of publication productivity in Russian universities that strike a balance between the numbers of these institutions’ scientific citations in econometric databases.

2. Literature Review

Regardless of the objectives of publication productivity policy, the decision-making in research is based on the relationship between quantity and quality of scientific publications. According to Times Higher Education research, there is a strong correlation between productivity and quality. The more scientific works universities publish, the more significant citation impact they have [24,25]. However, it is worth noting that these data are far from being perfect. They represent only a few of the world’s research universities and reflect the evaluation score. However, other scholars proved in their studies that, at the individual level, an increase of the publications number is often connected with a higher citation impact [26,27,28]. The study of more than 28 million researchers’ publications over 33 years was published in PLoS ONE in 2016. The researchers concluded that, the more publications the researcher has, the more significant the proportion of citations is [29].
Nevertheless, S. de Rijcke, chief of the Centre for Science and Technology Studies at Leiden University and one of the authors of the Leiden Manifesto, declares that pressure to publish “becomes a problem when competition for journal publication leads to tensions in the journal space, the expansion of pay-to-publish and predatory journals, as well as the manipulation of journal impact and citation statistics. It is also a problem for individuals, as the scientific career is explicitly designed to emphasize traditional activity forms. It is harmful to science if these numbers are not correlated with a qualitative evaluation” [30]. It is worth noting that the research conducted by S. Kolesnikov et al. [31] shows that this relationship is ambiguous and much more complex. The researchers concluded that there is a substantial variation in degree and range of this interrelation that depends on the following factors: researchers’ age, gender, work experience, career length, number of staff, culture, academic discipline or institutional environment.
Labor productivity and its payment level directly depend on the quality of human capital, namely the employee’s knowledge and competencies, and is the basis for maintaining the publication productivity of universities, scientists, scientific communities, etc. [32]. G. Becker [33] later classified the term “human capital,” introduced by T. Schultz [34], into two types—general and specific. Available human capital includes knowledge and skills that can be applied to solve a wide range of problems in various fields; the specification describes the skills and techniques used in a particular narrow area and ineffective in others. The latter category includes scientific capital as a set of “active properties of the individual,” which deals with the distribution of academic power and recognition (according to the definition and mathematical operationalization introduced in [35]). The concept of “scientific capital” with a certain degree of conditionality includes the idea of “cumulative advantage” developed by R. Merton. According to the researcher, the cumulative advantage consists of the social characteristics of a scientist (first of all, the professional status and recognition by the colleagues) that facilitate the resources search [36].
Scientists’ productivity is significantly influenced by sociodemographic (age and gender) and psychological factors, work [37] and family and material status [38]. According to domestic studies, male university professors conduct and publish research more frequently than females [39], and older professors more regularly than younger ones. This age asymmetry demonstrates the Matthew Effect described by R. Merton. It is represented in the Hirsch index, which rises as the author ages. This effect reflects a disproportionate number within the scientific community: scientists are more willing to support and encourage their colleagues’ achievements who have already gained fame due to previous work and underestimate or withhold support from their not-so-famous and younger colleagues [40].
Psychological factors can be conditionally divided into individual factors associated with the scientist’s personal qualities and organizational or environmental factors. An analysis of individual factors contributes to the formation of a rather detailed list of markers that determine the researcher’s success, e.g. flexibility, emotional stability and sociability [41,42]. Organizational and environmental factors stimulating researcher work engagement and productivity include not only the resources and infrastructure available [43] but also equal distribution, including the possibility for independent activities [44] and various forms of cooperation [45,46,47]. These conditions influence job satisfaction and, ultimately, the effectiveness of scientists’ activities.
The factors mentioned above impact the development of the publication productivity model, which is focused on quantity and quality. This model, in turn, predetermines the specifics of publication productivity management at universities and research organizations. The authors analyzed the work of J. Wilsdon, a professor of research policy at the University of Sheffield, who studied the application of The Metric Tide in the UK in 2015. He admits that quantitative drivers cannot be considered relevant in these developed systems [48].
The number of publications will remain the critical driver of publication productivity in Russian universities until 2024, according to the National Project “Science” [18], draft order “On the approval of performance indicators for the federal budget and autonomous educational institutions of higher education, subordinate to the Ministry of Science and Higher Education of the Russian Federation, and the work of their leaders” [19]. How effective is this draft order for Russian universities? What factors determine publication productivity in current conditions? These are the issues of the survey. In this study’s framework, the authors identified the following hypotheses that define the current approach to developing and managing publication productivity in Russian universities:
Hypothesis 1 (H1).
For Russia, an effective way to increase the productivity of publication activity is to increase the number of publications, which corresponds to an extensive model of development of publication activity.
Hypothesis 2 (H2).
Factors contributing to publication productivity development differ in structure and relative importance for young and senior university teachers.
Hypothesis 3 (H3).
The academic degree is not a critical factor determining the publication productivity.
Hypothesis 4 (H4).
Increasing students’ interest in scientific research and promoting science as a prestigious activity intensifies their own publication productivity later on during their career.
Hypothesis 5 (H5).
Fostering young scientists is more effective in publication productivity management compared with the development of older scientists.

3. Materials and Methods

3.1. Hypothesis 1 Hypothesis Testing

To test the hypothesis that for Russia an effective way to increase the productivity of publishing activities is to increase the number of publications, the method of correlation analysis was used.
Correlation coefficients (r) are calculated based on the data from the number of publications in Scopus and the number of citations for the countries with the highest publication activity rates. With the effective development of publication activity, a direct close relationship should be observed between the number of publications and the number of citations. This model corresponds to an intensive development model (with focus on citations as quality factor of publication activity). In this study, an extensive model of the development of publication activity means a focus on increasing the number of publications. This extensive model of publication activity can be effective if the number of citations also increases at such or lower rates. The correlation coefficients used in this study make it possible to establish whether there is a relationship between these indicators in Russia and the nature of this relationship (direct or reverse).
Since the citation of publications occurs with a time lag, the values of the indicators in calculating the correlation coefficients were used with a time lag of 1–6 years. The model for managing publication activity by country is determined based on cluster analysis. To cluster countries according to the character of correlation between the qualitative and quantitative drivers of the management of university publication productivity, the authors used correlation coefficient values with a time lag of t = 1(rt=1) and maximum positive among those calculated with a time lag t = 1, …, 6 years of the correlation coefficients (rt). The first of the indicators (rt=1) characterizes the research relevance. As time lag increases, the research relevance may decrease due to constant development in all science areas. The second indicator (rt) characterizes the relevance of research, regardless of whether the article was cited after 1, 2, ..., n years.

3.2. Questionnaires Aimed at Obtaining Quantitative Estimates of the Factors Affecting Publication Productivity

To obtain quantitative estimates regarding the factors affecting publication productivity, the questionnaire method was used. Factors determined based on the results of the questionnaire were used to confirm hypotheses Н25. Surveys were conducted in the following universities: Moscow University of Finance and Law, Moscow State (National Research), the University of Civil Engineering, Russian State Agrarian University–Moscow Timiryazev Agricultural Academy, Pirogov Medical University, Moscow Technical University of Communications and Informatics, Moscow State Institute of Culture, Chelyabinsk State Institute of Culture and Arts, South Ural State Agrarian University, Omsk State Technical University, Siberian Institute of Business and Information Technology, Togliatti State University, Samara Law Institute of the Federal Penitentiary Service of Russia, Rostov State University of Civil Engineering and Ufa State Petroleum Technological University. These universities, selected due to their varied specializations, provided the identification of common problems of publication productivity within different branches of science. Universities that participated in Project 5-100 (15 universities) were not included in the sample. Data analyzed from these leading universities could result in an overestimation of publication productivity rates for the Russian average. On the other hand, the absence of these universities in the sample limits the scope of the findings of the study. The findings are valid for universities not participating in Project 5-100.
A questionnaire, developed in Google Forms, was emailed to 9000 teachers at the universities, from which 4034 responses were received. The sample included respondents of two age categories:
Young scientists (under the age of 39), 1573 people (39%); and
Senior scientists (39 years and above), 2461 people (61%).
According to the National Project “Science” [18], the age limit of 39 was adopted for categorizing scientists as young or senior. Representatives of nine branches of science participated in the survey:
  • Technical sciences, 21%;
  • Medical sciences, 13%;
  • Biological sciences–9%;
  • Chemical sciences, 6%;
  • Agricultural sciences, 11%;
  • Economic sciences, 15%;
  • Law sciences, 12%;
  • Psychological sciences, 2%; and
  • Art studies, 11%.
The main criterion for the survey results representativity was the sufficiency of the sample. It is estimated by Formula (1) for extensive coverage (n > 30) [49]:
s = Z ( p ) 2 × v × ( 1 v ) e 2
where s is the minimum sample, sufficient for the representativity of the survey results, and Z(p) is the standard deviation. Accepted confidence level, when the survey results are representative and statistically significant, comprises 90%. With this confidence level, the standard deviation includes 1.65 [48]. p is the confidence coefficient, v is the sample variation and e is the accepted level of error.
A student t-test was applied to distinguish factors common for all the categories and different for other ones. The exceedance of the empirical value (Formula (2)) over the table value indicates the statistical significance of differences in publication productivity depending on the university, branch of science and age. The exceedance of the table value shows the insignificance [50].
t = | M i M j | σ i 2 N i + σ j 2 N j
where Mi is the arithmetical average of the publication productivity value of the i-sample; Mj is the arithmetical average of the publication productivity value of the j-sample; σi is the standard deviation of the i-sample; σj is the standard deviation of the j-sample; Ni is the i-sample size; and Nj is the j-sample size.

3.3. Determination of the Factors of Publication Productivity. Hypothesis 2 Hypothesis Testing

Through the Principal Component method, factor analysis was conducted to identify the factors, thus contributing to the publication productivity of “young” and “senior” teachers. The dataset for analysis was formed by binary (0; 1) values of indicators X1-X35 for young (Sample 1) as well as senior teachers (Sample 2). Indicators X1-X35 correspond to the assessments of the questionnaire aimed at assessing the factors influencing the development of publication activity. Indicator symbols are given in Appendix A.
Factor weight values were applied to identify the factors’ structure. The factor weight of ≥ |0.7| was accepted as significant for the survey [51]. The sufficiency of the sample determines the representativity of the factor analysis. It comprises 1573 observations for young teachers and 2461 observations for the senior counterparts, which is higher than the standard of 2n+1 by 45 and 70 times, respectively. The factorization proportion also determines the representativity of the factor analysis. It comprises of 89% for young teachers and 97% for the senior ones. Meanwhile, Hypothesis 2 is proved by the differences in factors’ structure and relative importance (dispersion, %) for both young and old teachers. The lack of differences rejects the hypothesis.

3.4. Hierarchical Structuring of Factors of Publication Productivity. Hypotheses 3 and Hypothesis 4 Hypothesis Testing

Various factors can have a direct and indirect impact on the level of publication activity. The need for a hierarchical structuring of factors is because the use of factors of direct and indirect influence in modeling leads to distortion of the results because the influence of indirect factors is already reflected through the factors of direct influence.
To differentiate the selected factors into factors of direct and indirect influence, the method of graphs was used. When testing Hypotheses 3–5, factors of direct influence on publication productivity were used.
The use of the method presupposes the priority construction of a directed graph, which reflects the relationship between the factors under study (the vertices of the graph). To construct the graph, the Granger causality test was used. This test made it possible to establish statistically significant relationships between factors and their direction (direction of influence). Based on the constructed graph, two subsets of vertices (factors) are identified:
S(zi), a subset of reach; and
P(zi), a subset of predecessor vertices.
A vertex zj is called reachable if there is a path in the graph that leads from the vertex zi to the vertex zj [52].
The vertex zi is the predecessor of the vertex zj if it reaches its peak. The vertices satisfying the condition of Formula (3) form the first level of the hierarchy. However, the objects that created the first level of the hierarchy are excluded at the second iteration [51]. The purpose of the hierarchy development is to determine the levels of factors that affect the publication productivity.
P(zi) = S(zi) ∩ P(zi)
The authors applied the Statistica 12.0 program to make a multivariate linear regression model by adopting the systematic exclusion method. In turn, this technique allowed evaluating the degree of impact of indicators on the publication productivity, which was inclusive of the factors that constituted the first level of the hierarchy (direct impact factors). The constructed model made it possible to evaluate the impact of independent variables (in this study, indicators with binary estimates) on the dependent counterparts (the number of citations articles of the respondent in the journals indexed in Scopus and WoS, published over the past five years). Additionally, the researchers undertook a survey on both young scientists (1573 observations) and senior scientists (2461 observations), which led to the development of two regression models. These models’ dependent variable was the number of citations in journals, indexed in Scopus and Web of Science, published separately over the past five years (Y) for young and senior teachers. Independent variables comprise binary values of the indicators X2–X18, X22 and X23 (symbols of indicators are given in Appendix A) according to the respondents. The authors did not consider the impact of the second level of the hierarchy indicators. These qualitative factors indicate the priority approaches for publication productivity management regarding teachers’ motivation. Besides, they influence the publication productivity through the factors of the first level. Regression analysis was possible due to the quantitative assessment of dependent variables and the sufficiency of the sample. The number of observations is 82 times (for young scientists) and 129 times (for senior scientists), respectively, as much as the number of independent variables (with a sufficient level of 6–8 times). The indicators (X2–X18, X22 and X23) influencing the publication productivity rate were assessed using the Student t-criterion. The excess modulo of calculated (empirical) values over the critical ones indicates the indicators’ statistical significance. The higher is the modulo value of the t-criterion, the greater is the influence; a positive value of the criterion indicates a direct character of influence, while a negative value indicates the opposite. The adequacy of the obtained results is proved by:
-
The coefficients of determination of the developed models (R2 = 0.81 for the model developed according to the questionnaire of young scientists, and R2 = 0.88 for the model developed according to the questionnaire of scientists of the older age);
-
Fisher F-test, the calculated values of which (139.4 and 146.1, respectively) exceed the critical value of 1.94; and
-
Normal distribution of the model residuals.
The lack of multicollinearity in the regression models is proved by the fact that the empirical values of Student t-criterion for assessment of the significance of pair correlation coefficients between the independent model indicators do not exceed the critical value of |1.96| at p = 0.05, f = 1571 (for young scientists) and f = 2459 (for scientists of the older age).
If the criterion’s empirical value exceeds the critical one for indicators X2 and X3, Hypothesis 3 is rejected with a 95% probability. Hypothesis 4 is adopted if the empirical value of the t-criterion exceeds the critical one for indicators X16 and X17.

3.5. Hypothesis 5 Hypothesis Testing

The authors conducted a comparative assessment of publication productivity influenced by young and senior teachers’ development. It was proposed to evaluate the correlation of the elasticity in the number of citations of young and senior teachers and changes of factors of direct impact (first level of the hierarchy). For identifying the elasticity coefficients based on the constructed linear multivariate regression models, the following values were calculated:
-
Result indicators ( Y ¯ ) with an average level of independent variables in the corresponding sample; and
-
Value of the result indicator (Y’) with an increase of 1% for each independent variable.
Hypothesis H5 is accepted if the calculated elasticity coefficients for young teachers are higher than the senior ones.

3.6. Data

The analysis of productivity impact on the qualitative component of publication productivity was based on the number of articles and citations in 20 leading countries from 1996 to 2018 [52]. The following countries were analyzed: China, United States, Japan, Germany, India, France, United Kingdom, Russian Federation, Spain, South Korea, Italy, Canada, Poland, Australia, Brazil, Iran, Taiwan, Switzerland, Netherlands and Sweden [52]. The authors highlight that calculating the correlation coefficients between the publications number and the citations number is possible because a linear relationship between these values is observed for all countries studied. Because a scientific publication requires time to accumulate citations, the correlation coefficient’s calculation was carried out with the time lag (t) = 1–6 years. When using a longer time lag (7–15 years), no significant correlation coefficients were found. This suggests that, regardless of the priority area of scientific research by country, the closest relationship between the indicators of the number of publications and their citation appears with a lag of 1–6 years.
The development of significant publication productivity requires a close relationship between the publications number and citation. For the accumulation of citations, a specific time lag is necessary. This type of relationship indicates the qualitative component of published articles. As a result, an intensive model of publication productivity development is observed. The lack of a close relationship between these values leads to the conclusion that the publication number increases do not increase citations.
The authors identified dominant factors of the publication productivity in Russian universities. For this purpose, the questionnaire survey was conducted. The questionnaire included general questions (Block 1) aimed at obtaining information about the university where the respondent works (Question No. 1), their field of science (Question No. 2) and the age of the respondent (Question No. 3). Question No. 1 is open-ended, Question No. 2 suggests one or more possible answers and Question No. 3 presupposes one answer. As a result, factors influencing the publication productivity were differentiated into universal and characteristic for individual teachers’ categories.
The questionnaire included the question of the number of citations of the articles in journals, indexed in Scopus and Web of Science, published over the past three years (Question No. 4). This allowed the determination of the qualitative aspect of publication productivity.
The list of the First Block questions (general questions):
  • The university where you work? ____________
  • Branch of science to which you belong?
    (a)
    technical sciences;
    (b)
    medical sciences;
    (c)
    biological sciences;
    (d)
    pedagogical sciences;
    (e)
    physical-mathematical sciences;
    (f)
    geographical sciences;
    (g)
    chemical sciences;
    (h)
    agricultural sciences;
    (i)
    economic sciences;
    (j)
    philological sciences;
    (k)
    historical sciences;
    (l)
    law sciences;
    (m)
    psychological sciences;
    (n)
    sociological sciences;
    (o)
    art studies;
    (p)
    your own variant ______.
  • Your age:
    (a)
    under 39 years of age;
    (b)
    of 39 and over.
  • The number of your articles citations in journals, indexed in Scopus and Web of Science, published over the past five years?
To test the Hypotheses 2 and 5, Question No 3 was included in the questionnaire. That allowed us to identify the differences in the publication productivity development of young teachers and senior teachers and evaluate the statistical significance of these differences based on the answers to the questions of Block 2 and the number of citations (Question No. 4). To test Hypothesis 3, questions corresponding to indicators X2 and X3, which relate to the presence of a doctor/candidate of science degree, were included. To test Hypothesis 4, the authors analyzed indicators X16 and X17. The list of other questions of Block 2 is based on the literature review, introducing the indicators affecting the rate of publication productivity of young teachers and senior teachers.
Each indicator X1–X35 in Appendix A (Table A1) had a separate question with wording identical to the indicator names in the annex. The research questionnaire is available at: https://docs.google.com/forms/d/1-h9HJjszUUK7jcoP9_jznIAoRAa73JKQNZFbaWjlgYA/edit?usp=drive_web (accessed on 23 April 2021).
The respondents answered (“Yes” or “No”) to the questions of Block 2, evaluating for each position their productivity, the level of human capital development and sociodemographic and psychological state. If the statement applies to the respondents, they answer “Yes.” Otherwise, they answer “No.”
During statistical processing of the survey results, the answer option “Yes” was assigned the value “1” point, while “No” means “0” points.

4. Results

The pair correlation coefficients (rt) are calculated based on publications and citations number across countries for 1996–2018 [53]. The fitted value (rt) of the leading countries in the publication productivity context is presented in Table 1.
The obtained values (rt) contributed to the clusterization of the studied countries based on the characteristics of the interactions of the quantitative and qualitative factors of publication productivity.
Cluster 1 includes China, Japan, India, South Korea, Iran, Taiwan, Spain, Poland, Australia and Brazil. In these countries, publication productivity is based on increasing the volume of relatively high-quality scientific publications. The time lag for these countries is 1 and 2 years. With this condition, a positive, medium and high (according to the Cheddock Scale) correlation was observed between the number of publications and citations. With an increase in the number of publications, the total number of citations increases, which indicates the demand for publications in scientific circles. Moreover, the minimum time lag (1–2 years) indicates a high mobility of the scientific environment, in which newer publications are more cited than old ones.
This impact proves the mobility, dynamism, relevance and demand for the research.
Cluster 2 includes Germany, France, United Kingdom, Italy, Canada, Switzerland and the Netherlands. For these countries, the correlation coefficient of the time lag at 1 year becomes negative. However, after 3–4 years, a significant impact of the number of scientific publications on the number of citations was observed. Thus, the interaction becomes positive medium, high and very high.
Cluster 3 includes the United States and the Russian Federation. These countries were found to have negative correlation coefficients with a time lag of 1–5 years. At the same time, it was observed that, with a time lag of 1 year, the degree to which the number of publications impacts the number of citations at t = 1–5 remained negative despite the decrease in (r). Thus, it can be stated that the quantity does not contribute to the development of a qualitative component of publication productivity in these countries, especially in Russia.
The values of the correlation coefficients between the number of publications and the number of citations at different time lags in the context of clusters are shown in Figure 1.
The values of the correlation coefficients indicate that, for all countries of Custer 1, in contrast to Clusters 2 and 3, there is only a direct relationship between the indicators of the number of publications and citations, regardless of the response time lag. The cluster-average values of the correlation coefficient, depending on the time lag, fluctuate in the range of 0.5–0.862.
The values of the correlation coefficients indicate that, for all countries of Cluster 1, in contrast to Clusters 2 and 3, there is only a direct relationship between the indicators of the number of publications and citations, regardless of the response time lag. The cluster-average values of the correlation coefficient, depending on the time lag, fluctuate in the range of 0.5–0.862.
For Clusters 2 and 3, there is a tendency for the actual values of the correlation coefficients to grow with an increase in the time lag to 6 years. However, for Cluster 2, this growth indicates an increase in the tightness of the relationship between indicators with an increase in the time lag. In addition, for Cluster 3, the increase in the values of the coefficient is not accompanied by an increase in tightness, since the value of the correlation coefficient in modulus decreases. The mean value of the correlation coefficient for the third cluster in absolute value decreased from |0.669| to |0.031|. Negative values of the correlation coefficients and a weak positive relationship (with a time lag of 6 years) between the number of publications and the number of citations in the countries of the third cluster indicate low publication productivity.
The closeness of the relationship between the indicators of the number of publications and the number of citations depends on the field of study. However, the influence of the study area is not decisive in determining the clusters of countries in terms of publication productivity. This is confirmed by the fact that one cluster includes countries that differ in priority areas of scientific research. The first cluster was formed by China, India, Iran, South Korea and Taiwan, for which the priority research industry is engineering, as well as Japan, Spain, Poland, Australia and Brazil, for which medicine is. Along with this, Canada, France, Germany, Italy, the Netherlands, Switzerland and the United Kingdom, for which the priority industry (as well as for some of the countries of the first cluster) is medicine, formed the second cluster. Medicine is also a priority industry for the United States, which entered the third cluster along with Russia, which has the largest number of publications on physics. The priority industry of research by country is determined by the indicator of the share of the number of publications in individual industries in the total number of publications of each country in journals indexed in Scopus for the period 1996–2018.
According to the statistical analysis results, it can be stated that the extensive development of publication productivity at Russian universities does not reflect a qualitative component of scientific publications since it does not affect the increase in their citations. A directly proportional dependence even characterizes it. This conclusion refutes Hypothesis 1 on the necessity to implement an extensive model for developing publication productivity at Russian universities.
Analysis of the answers to the first and second block of questions, which was used to assess the factors related to the publication productivity management, showed that statistically significant differences were only observed in the groups of young and senior teachers. Regarding publication productivity (Question No. 3), the student criterion’s empirical values exceed the table values (at p = 0.05). The excess of the table values of the t-criterion over the empirical ones calculated in pairs by branches of science and universities (Questions No. 1 and No. 2) indicates that the differences in the qualitative component of publication productivity, in terms of universities and the specialization of teachers, are statistically insignificant. Publication productivity problems are common for all Russian universities and branches of science. Thus, it is possible to calculate the average for the entire sample of respondents. The only significant difference was observed for Question No 3. Therefore, two categories of teachers (young and senior researchers) were analyzed. For senior teachers who completed the questionnaire, the average number of citations in Scopus and Web of Science journals published over the past five years was 2.9 times when the questionnaire was conducted. For young researchers, the average number of citations was 1.1, which is 2.6 times lower.
Factor analysis contributed to determining the factor weight values of the binary estimates, which impact the qualitative development of publication productivity at Russian universities (Appendix A, Table A1). The factor weight values were used to determine the publication productivity in universities (Table 2). This analysis made it possible to identify the differences in the list of factors that affect the publication productivity management for young and senior teachers. Their significance was estimated using the dispersion percentage. That confirms Hypothesis H2. The typical percentage of dispersion proves that the selected factors determine publication productivity by 89% (for young scientists) and 97% (for senior scientists). For young teachers, the most significant factors influencing publication productivity development are:
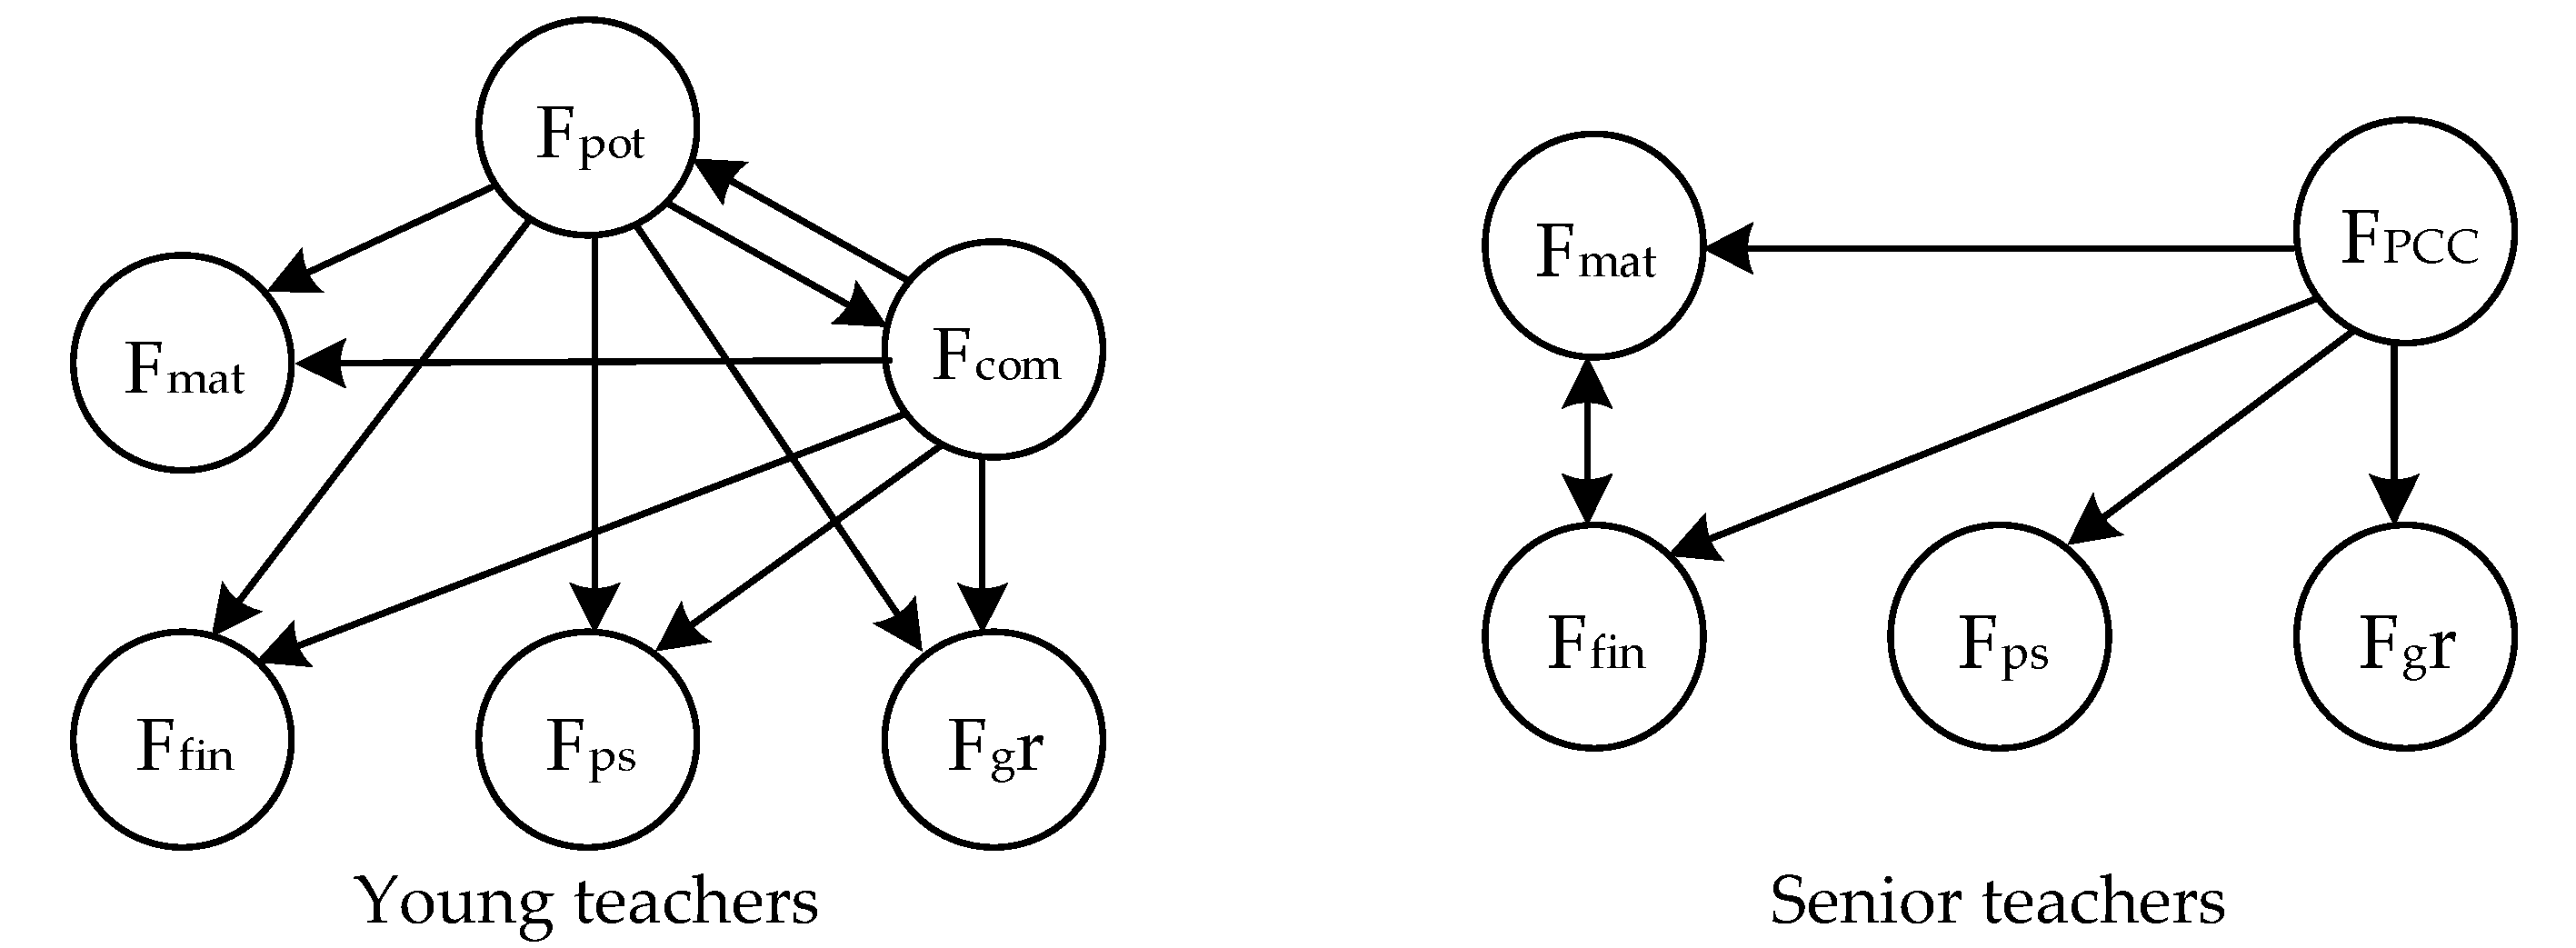
  • Scientific and pedagogical potential (professional competencies of the teacher); and
  • Communicative competence (command of foreign languages) and international activity, which determines the possibilities of international scientific cooperation.
These are factors Fpot and Fcom, respectively.
For senior researchers, due to the lesser degree of communicative competencies (command of foreign languages) and lower international mobility, as a result of applying the principal component method, indicators that shaped factors Fpot and Fcom are united into factor FPCC—factor of professional and communicative competence and international activity.
The next significant factor for young scientists is professional promotion, which provides professional and creative development (Fgr). For senior scientists, this is a factor of financial satisfaction (Ffin). The influence of the material and technical resources and working conditions is less significant; it is estimated to be 4% for young scientists and 4.8% for senior researchers. The selected factors include all indicators, except X1, which characterizes marital status. When this indicator is singled out separately, its significance is 0.9–1%, which is 4–5 times lower than the significance of the previous factor. Thus, marital status does not significantly influence publication productivity; therefore, it is not singled out as a separate factor. The impracticability of denoting this factor is also confirmed by the Kaiser criterion applied to determine the optimal number of factors. The list of indicators that formed each factor is given in Table 2. The composition of factors is determined based on factor loadings, the most significant of which are ≥ |0.7|.
The obtained factors are structured with a directed graph (Figure 2). Causal relationships between factors and their orientation were determined using the Granger causality test. Figure 1 shows statistically significant causal relationships. The statistical significance was assessed by the Prob indicator—the probability of accepting the hypothesis about the non-statistical significance of the causal relationship. For those connections indicated in Figure 1, the indicator Prob < 0.05, which with a probability of 95% indicates the significance of the established relationships between the factors.
Based on the constructed directed graph, subsets of reach and predecessor vertices are determined, and the corresponding iterations assumed by the method are carried out. The results are shown in Table 3.
The direction of the arrow in Figure 1 shows the dependence of the factor lying at the top of the edge (arrow) on another one lying at the base of the graph’s edge.
For young teachers, factors Fpot and Fcom have a cyclic correlation. This is connected to the fact that the development of communicative competencies and international activity contributes to improving the scientific and pedagogical potential of a teacher. Mastering new knowledge, skills and foreign experience are necessary for scientific activity and flexibility in changing scientific activity approaches. Besides, the improvement of scientific and pedagogical potential (defense of a dissertation, obtaining a degree and concluding a long-term contract) requires the development of command of foreign languages, the necessity of international internships and advanced training. Conditions for developing scientific and pedagogical potential, communicative competencies and international activity of young and senior teachers are created with the following factors:
  • The factor of professional growth prospects (Fgr);
  • The factor of psychological satisfaction with the job (Fps);
  • The factor of financial satisfaction (Ffin); and
  • The factor of material and technical resources and working conditions (Fmat).
As a result, a two-level structure of factors influencing publication productivity is determined, for both young and senior teachers. These are factors of direct impact (Fpot and Fcom for young teachers and FPCC for senior teachers) and indirect impact (factors Fgr, Fps, Ffin and Fmat) (i.e., two levels of factors). Factors of direct impact introduce the objective factors (competencies, experience and international communications) that determine the course of scientific activity, researchers’ reputation and the quality of articles. Factors of indirect impact include the factors that characterize the teacher’s motives for scientific activity and the development of factors of the first level: financial and psychological satisfaction, satisfaction with working conditions, professional growth prospects and the material and technical base of the university.
Table 4 introduces the regression models of the first level factors’ influencing the qualitative component of publication productivity for young and senior teachers, indicating the values’ statistical significance. Models presented in Table 5 are developed with a backward selection method. Thus, the influence of all indicators included in the model is statistically significant. This is proved by the excess of Student criterion’s empirical values over the table one at p = 0.05.
Regression analysis proved that the publication productivity is mostly influenced by:
  • Existence of a degree (values of binary ratings X2 and X3);
  • Command of foreign language (Х7); and
  • International activity (values Х9, Х10, Х12 and Х14).
The development of these aspects of the teachers’ scientific activity improves professional and communicative competencies and helps create international cooperation. This will increase the number of publications and their citation. For young scientists, the prestige of science (X16) and scientific activity in the student years (X17) is of great importance. This significance is leveled with the development of the scientific potential of teachers when they become older. The excess of the t-criterion table value for these values proves this fact over the senior teachers’ sample’s empirical ones.
More than one job (official or unofficial) (X18) reduces the publication productivity of young scientists, as the time for scientific activity is limited. However, the reverse effect of this factor is also possible if other jobs do not take up the predominant part of the time but contribute to the development of scientific potential and professional competencies. The result of this impact is reflected in the increased publications citation rate of senior scientists.
An assessment of the significance of publication productivity management values with a probability of 95% made it possible to reject Hypothesis 3 about the scientific degree as a critical factor determining the qualitative features of publication productivity. Although Hypothesis 4 declaring increasing students’ interest in scientific research and promoting science as a prestigious activity helps to intensify the publication productivity was accepted, this hypothesis is confirmed exclusively for young teachers.
Table 5 introduces the elasticity coefficients of the resulting value (the number of the scientist’s citations) of the publication productivity impact (X2, X3, X7, X9, X10, X12 and X14) calculated with the regression models.
According to Table 5, elasticity coefficient values prove that in the context of the values of binary estimates (X3, X7, X9, X10, X12 and X14) characteristic for the model of the publication productivity management of young and senior scientists, the elasticity coefficients are higher for the sample of young teachers. This means that a more significant increase in citations is observed with the development of scientific potential, communicative competencies and young scientists’ international activity. This is induced by their greater flexibility, mobility and adaptability compared to older researchers. The highest elasticity coefficient in the group of senior teachers is observed only for indicator X2 (the existence of a doctor’s degree). That is caused by its significantly higher value in the sample of senior teachers compared to young teachers. Thus, hypothesis H5, that the development of young scientists is more effective for publication productivity management, is accepted.

5. Discussion

In this study, the authors examined the hypotheses behind the strategy of Russian universities to improve publication productivity, which is reflected in Russia’s “Science” national project and “On the approval of performance indicators for the federal budget and autonomous educational institutions of higher education, subordinate to the Ministry of Science and Higher Education of the Russian Federation, and the work of their leaders” [19]. As a result, it was proved that, at modern research institutes in Russia, the number of scientific publications in journals does not affect the publications’ quality. This conclusion supports the results of L. Butler [54] that systemic stimuli, which increase the volume of publications, do not always influence the frequency with which those publications are cited in other scientific publications. The correlation coefficient in Russia between the number of publications and their citation in 1996–2018 has a negative value even with a 1–6 years’ lag.
This conclusion contradicts the results of U. Sandström and P. van den Besselaar’s study, which found a strong correlation between higher productivity and increased citations in scientific publications [27]. The determination of the correlation coefficient between productivity and citations contributed to the different conclusions in the studied countries, from negative to positive. It should be noted that the publication productivity management models and the structure of the education system cause this. The authors of this study conclude that the number of scientific publications does not always determine the quality of publications. This conclusion significantly affects how to determine a useful management model of publication productivity in Russia. Since a complete disregard for the quantitative characteristics of publication activity creates a threat to discredit not only an individual scientist or university, but also Russian science as a whole. The focus on improving the quality and depth of published research will contribute not only to the universal recognition of Russian scientists but also to the possibility of publication in rating journals. However, it can also provide significant participation in determining the priorities of world science and in the fields of scientific and technological development; building and expanding the interaction of universities with industrial clusters and high-tech businesses; internationalization of science and education in Russian universities; and so on. This led us to conclude that the correlation between productivity and the number of citations is much more complicated than that and depends on numerous factors.
The clustering method made it possible, within the framework of this study, to single out several groups of countries that are characterized by a differentiated interaction of qualitative and quantitative characteristics of publication productivity. This, in turn, in contrast to other studies (e.g., [55]), makes it possible to determine an effective strategy for the development of publication productivity in universities, taking into account the peculiarities of development and the state of the scientific environment in each of the countries under consideration.
The hypothesis regarding the influence of university professors’ age on publication productivity is supported and reflected in management models. Evidence of this can be found in [37,40]. The authors showed that an increase in the number of young professors and getting them a scientific degree, due to the national project “Science”, caused an increase in publication productivity in Russia and enhanced its qualitative component. However, this project’s practical implementation is complicated because working as a scientist is considered one of the least prestigious professions in Russia today due to the low level of wages and associated social status [56].
The existence of a scientific degree primarily ensures the qualitative component of publication productivity. This managerial strategy aspect can be implemented by encouraging more postgraduate and doctoral studies in Russian universities. It has been implemented by the national project “Science” [18].
However, it should be noted that state policy for youth education should be changed—not the upbringing of young people in general, but precisely that of those going to university. They must leave the university professionally prepared and able to solve the most severe problems. In this regard, we must talk about the development of state policy in science. It should consider the problem of scientists’ development. One of the main ideas the state should implement to solve the above problems is measures regarding the attraction and consolidation of talented youth in science and higher education. The effectiveness of this strategy was confirmed in this study. The promotion of the students’ interest in scientific research and the popularization of science as a prestigious activity contributes to the development of professors’ publication productivity in Russian universities.
That is, one of the main state tasks aimed at solving the above problems should be the implementation of a set of measures aimed at the widespread attraction and consolidation of talented youth in the field of science and higher education. The effectiveness of this strategy was confirmed in the framework of this study—the increase in students’ interest in scientific research and the popularization of science as a prestigious field of activity contributes to an intensive path of development of the publication activity of teachers in Russian universities.

6. Conclusions

In light of rejecting or accepting the hypotheses about the effectiveness of publication productivity management, the following conclusions were drawn:
  • In modern conditions, the priority areas of the model for managing the publication activity of universities in Russia should be a change from the extensive nature of the development of publication activity to an intensive one, based on creating conditions for improving the qualitative characteristics of scientific research and their importance in the world scientific community.
  • In the management process, the structural difference between the management factors of young and senior researchers’ publication productivity should be considered. For young and senior teachers, the main factors influencing publication productivity are the scientific and pedagogical potential, communicative competencies and international activity, prospects for professional development and psychological satisfaction. The financial aspect is particularly crucial for older teachers. This confirms the existence of differences in factors contributing to the development of publication productivity in these groups.
  • In current conditions, an effective method of publication productivity management in Russian universities is needed to improve staff quality. We should foster the growth of young teachers with a high degree and encourage the promotion of science as a prestigious activity among young people. In this regard, the development and implementation of models for scientific and pedagogical personnel management should also become a significant field for strategic transformation. This would contribute to the improvement of personnel potential for the higher education system in general.

7. Limitations and Study Forward

The study sample was formed by universities not participating in Project 5-100. Thus, the obtained findings on publication productivity are valid for universities not participating in Project 5-100. The study is based on a limited sample of survey respondents from only 14 Russian universities. Although the respondents’ samples’ validity is proven in the study, this limits the application of the results and the consequences of the proven hypotheses on the specifics of managing publication productivity in Russian higher education institutions in general and in each case.

Author Contributions

Conceptualization, M.V.V.; Data curation, M.V.V., G.V.O., V.V.P., V.J.I., M.I.I. and S.G.K.; Formal analysis, M.V.V., G.V.O., V.V.P., V.J.I., M.I.I. and S.G.K.; Investigation, M.V.V., G.V.O., V.V.P., V.J.I., M.I.I. and S.G.K.; Methodology, M.V.V. and G.V.O.; Project administration, M.V.V.; Resources, M.V.V., G.V.O., Z.R.G. and O.V.D.; Supervision, M.V.V.; Validation, M.V.V., G.V.O., V.V.P., V.J.I., M.I.I., S.G.K., Z.R.G. and O.V.D.; Visualization, M.V.V., G.V.O., V.V.P., V.J.I., M.I.I. and S.G.K.; Writing—original draft, M.V.V.; and Writing—review and editing, Z.R.G. and O.V.D. All authors have read and agreed to the published version of the manuscript.

Funding

This research received no external funding.

Data Availability Statement

Publicly available datasets were analyzed in this study. This data can be found here: [https://www.scimagojr.com/countryrank.php] accessed on 13 May 2021.

Acknowledgments

We are very grateful to the Autonomous Non-Profit Organization “Publishing House Scientific Review” (Nauchnoe Obozrenie), Moscow, 127051, Russia for providing free access for data to make scientific research and for technical support.

Conflicts of Interest

The authors declare no conflict of interest.

Appendix A

Table A1. Factor weight values, influencing the development of publication productivity in Russian universities.
Question FormBinary Evaluation ValueYoung Scientists, %Senior Scientists, %
Fpot 23.4 *Fcom 20.6Fgr 16.4Fps 14.3Ffin 10.6Fmat 4%FPCC 34.9Fgr 9.1Fps 18.6Ffin 29.7Fmat 4.8
Marital statusХ10.110.310.16−0.240.460.020.23−0.540.120.060.22
Doctoral degreeХ20.980.320.14−0.130.240.220.950.110.340.19−0.07
Candidate degreeХ30.940.200.140.32−0.18−0.210.840.21−0.220.16−0.04
University work under the terms of a long-term employment contract (more than 3 years)Х40.750.53−0.440.050.360.040.700.29−0.110.080.12
Senior position in the universityХ50.74−0.350.07−0.150.290.040.72−0.080.34−0.150.01
Member of the Council on award of the degreesХ60.660.240.160.340.080.160.750.150.340.190.31
Command of one foreign languageХ70.160.850.140.280.170.070.870.410.320.190.21
Command of two and more foreign languagesХ80.600.790.390.510.490.300.760.270.390.570.34
Work on the dissertation abroad (in the current or retrospective period)Х90.370.870.110.21−0.340.180.900.370.11−0.040.31
Participation in foreign conferencesХ100.190.930.040.090.110.090.920.310.160.080.01
Organization of international conferencesХ110.610.740.240.350.510.180.700.090.270.290.04
Internship abroadХ120.290.910.280.09−0.020.010.880.210.180.310.01
Participation in international scientific or pedagogical projectsХ130.190.780.370.110.060.030.720.180.140.140.09
Teaching abroadХ140.090.860.110.180.110.040.850.340.190.130.09
Management of international scientific projectsХ150.610.730.280.410.340.090.710.260.270.190.05
When you were a student, you formed an opinion that science is prestigiousХ160.890.380.250.310.200.040.680.310.310.140.24
You started participating in the scientific research being a studentХ170.870.210.340.290.210.090.630.250.280.160.09
More than one job (official or unofficial)Х180.740.160.160.280.200.10.820.290.190.340.31
You enjoy your jobХ190.180.190.280.870.190.190.130.190.870.180.18
University promotes personal developmentХ200.280.110.890.360.180.050.240.710.160.210.28
Your university provides career opportunitiesХ210.260.240.860.340.080.160.250.700.340.190.31
Scientific consulting for organizations over the past 5 yearsХ220.760.340.250.540.060.040.710.210.240.080.02
Academic advising for students (top places in national and international competitions of scientific works)Х230.730.320.180.29−0.080.430.710.060.36−0.040.06
The university where you work provides the opportunity for professional growthХ240.270.130.950.210.060.130.110.710.210.080.05
You are satisfied with the payment for the scientific activities resultsХ250.340.060.510.380.790.020.210.010.680.980.04
You repeatedly received awards for your scientific activitiesХ260.260.340.110.410.67−0.030.290.300.240.91−0.08
Your university is characterized with full external financing of the publication productivity (from the university, state, foundations, other countries)Х270.210.310.310.110.750.110.110.250.260.920.24
Your university is characterized with partial external financing of the publication productivity (from the university, state, foundations, other countries)Х280.160.250.270.110.770.280.19−0.010.210.980.28
You are satisfied with the university benefits packageХ290.140.490.060.190.710.160.380.340.020.910.10
Work at the university attracts you because of a long vacationХ300.160.260.050.130.270.760.310.290.010.370.75
You have the opportunity for the creative development in the universityХ310.380.060.940.090.210.110.420.720.230.410.05
You get psychological satisfaction with scientific activityХ320.110.270.190.800.270.010.260.080.920.050.24
You have the opportunity for self-expression in the scientific activityХ330.620.090.340.780.230.110.310.310.920.550.06
Your university is characterized by a developed material and technical base for scientific activityХ340.010.340.410.170.310.770.160.410.310.190.81
You are credible at the universityХ350.360.190.190.710.190.120.160.020.890.210.20
The total share of dispersion—89%Total share of dispersion—97%
Note: *, factor dispersion value, %; Publications 09 00021 i001, significant factor weight, ≥ |0.7|; Fpot, the factor of scientific and pedagogical potential; Fcom, the factor of communicative competencies and international activity; Fmat, the factor of professional and communicative competence and international activity; Fgr, the factor of professional growth prospects; Fps, the factor of psychological satisfaction with the job; Ffin, the factor of financial satisfaction; Fmat, the factor of material and technical resources and working conditions.

References

  1. Vasiljeva, M.; Ponkratov, V.; Volkova, T.; Khairova, S.; Nikitina, N.; Dudnik, O.; Alimova, M.; Kuznetsov, N.; Elyakova, I. The Development of Scientific Activity in Russian Universities. J. Open Innov. Technol. Mark. Complex. 2020, 6, 110. [Google Scholar] [CrossRef]
  2. Bohdan, N. Education and science for innovative development of the Eurasian Economic Union countries (Russia, Belarus, Kazakhstan, Armenia, Kyrgyzstan). In The Essence of Academic Performance; Nchindila, B., Corrigan, T., Eds.; IntechOpen: London, UK, 2019. [Google Scholar] [CrossRef] [Green Version]
  3. Gardanova, Z.; Ponkratov, V.; Kuznetsov, N.; Nikitina, N.; Dudnik, O.; Latypova, E.; Shcherbatykh, S. A model for optimizing the structure of teaching techniques for distance learning in the Russian higher education system. J. Open Innov. 2020, 6, 147. [Google Scholar] [CrossRef]
  4. Van Norman, G.A.; Eisenkot, R. Technology transfer: From the research bench to commercialization: Part 2: The commercialization process. JACC Basic Transl. Sci. 2017, 2, 197–208. [Google Scholar] [CrossRef]
  5. Hicks, D. Performance-based university research funding system. Res. Policy 2012, 41, 251–261. [Google Scholar] [CrossRef]
  6. Osipov, G.; Karepova, S.; Ponkratov, V.; Karaev, A.; Masterov, A.; Vasiljeva, M. Economic and mathematical methods for ranking Eastern European universities. IEMS 2020, 19, 273–288. [Google Scholar] [CrossRef]
  7. Kosyakov, D.; Guskov, A. Impact of national science policy on academic migration and research productivity in Russia. Procedia Comput. Sci. 2019, 146, 60–71. [Google Scholar] [CrossRef]
  8. Bordons, M.; Fernández, M.T.; Gómez, I. Advantages and limitations in the use of impact factor measures for the assessment of research performance. Scientometrics 2002, 53, 195–206. [Google Scholar] [CrossRef]
  9. Hicks, D.; Wouters, P.; Waltman, L.; de Rijcke, S.; Rafols, I. Bibliometrics: The Leiden Manifesto for research metrics. Nature 2015, 520, 429–431. [Google Scholar] [CrossRef] [Green Version]
  10. Stephan, P. Perverse incentives. Nature 2012, 484, 29–31. [Google Scholar] [CrossRef] [PubMed]
  11. Weingart, P. Impact of bibliometrics upon the science system: Inadvertent consequences? Scientometrics 2005, 62, 117–131. [Google Scholar] [CrossRef]
  12. Ball, P. Index aims for fair ranking of scientists. Nature 2005, 436, 900. [Google Scholar] [CrossRef]
  13. Moed, H.F. New developments in the use of citation analysis in research evaluation. AITE 2009, 57, 13. [Google Scholar] [CrossRef]
  14. Erokhina, E. Russian Science at Scopus and WoS: Quantity or Quality. Indicator. 2019. Available online: https://indicator.ru/article/2019/02/08/rossijskaya-nauka-v-scopus-i-wos-kolichestvo-ili-kachestvo/ (accessed on 10 January 2021).
  15. Ministry of Science and Higher Education of the Russian Federation. Publication Productivity in Russia: What Do Scopus and Web of Science Say? 2019. Available online: https://www.5top100.ru/en/news/100908/ (accessed on 12 January 2021).
  16. Podtserob, M. Why Russian Universities Do Not Raise High in International Rankings. Vedomosti. 2017. Available online: https://www.vedomosti.ru/management/articles/2017/10/17/738144-vuzi-ne-podnimayutsya (accessed on 15 January 2021).
  17. QS Rating: 10 Russian Universities Entered the Top 100 in Selected Specializations. Indicator. 2019. Available online: https://indicator.ru/news/2019/02/26/rejting-qs-2019/ (accessed on 15 January 2021).
  18. Presidium of the Presidential Council for Strategic Development and National Projects. National Project. Science. 2018. Available online: http://www.rshu.ru/university/science/documents/get_file.php?id=59 (accessed on 15 January 2021).
  19. Ministry of Science and Higher Education of the Russian Federation. Draft Order “On the Approval of Performance Indicators for Federal Budget and Autonomous Educational Institutions of Higher Education, Subordinate to the Ministry of Science and Higher Education of the Russian Federation, and the Work of Their Leaders”. 2019. Available online: https://regulation.gov.ru/projects#npa=93569 (accessed on 15 January 2021).
  20. Orbay, K.; Miranda, R.; Orbay, M. Building Journal Impact Factor Quartile into the Assessment of Academic Performance: A Case Study. Particip. Educ. Res. 2020, 7. [Google Scholar] [CrossRef]
  21. Akhmetova, Y.M.; Mukhametzyanova, L.K. Youth in Science: Development of a Young Scientist. Theory Pract. Soc. Dev. 2013, 6, 48–50. Available online: http://teoria-practica.ru/rus/files/arhiv_zhurnala/2013/6/s%D0%BEci%D0%BEl%D0%BEgiy%D0%B0/akhmetova-mukhametzyanova.pdf (accessed on 15 January 2021).
  22. Rybakov, A.V. The role of young scientists in strengthening the scientific potential of the academy. Sci. Educ. Probl. Civ. Secur. 2019, 1, 1–3. [Google Scholar]
  23. Ryan, J.C.; Berbegal-Mirabent, J. Motivational recipes and research performance: A fuzzy set analysis of the motivational profile of high performing research scientists. J. Bus. Res. 2016, 69, 5299–5304. [Google Scholar] [CrossRef]
  24. Bornmann, L. Does the normalized citation impact of universities profit from certain properties of their published documents—Such as the number of authors and the impact factor of the publishing journals? A multilevel modeling approach. J. Inform. 2019, 13, 170–184. [Google Scholar] [CrossRef]
  25. Sathianathen, N.J.; Lane, R., III; Murphy, D.G.; Loeb, S.; Bakker, C.; Lamb, A.D.; Weight, C.J. Social media coverage of scientific articles immediately after publication predicts subsequent citations—Some_Impact Score: Observational analysis. J. Med. Internet Res. 2020, 22, e12288. [Google Scholar] [CrossRef] [PubMed]
  26. About KTH Royal Institute of Technology. Times Higher Education. 2019. Available online: https://www.timeshighereducation.com/world-university-rankings/kth-royal-institute-technology (accessed on 17 January 2021).
  27. Matthews, D. Academics Who Publish Frequently Have More Highly Cited Articles. Times Higher Education. 2019. Available online: https://www.timeshighereducation.com/news/academics-who-publish-frequently-have-more-highly-cited-articles (accessed on 17 January 2021).
  28. Else, H. The 1 Percent at the Centre of Research. Times Higher Education. 2019. Available online: https://www.timeshighereducation.com/news/the-1-per-cent-at-the-centre-of-research/2014812.article (accessed on 17 January 2021).
  29. Larivière, V.; Costas, R. How many is too many? On the relationship between research productivity and impact. PLoS ONE 2016, 11, e0162709. [Google Scholar] [CrossRef]
  30. Baker, S. Research Publications: Does Piling Them High Sell Them Short? Times Higher Education. 2019. Available online: https://www.timeshighereducation.com/features/research-publications-does-piling-them-high-sell-them-short?fbclid=IwAR240vJ_ylX1KSrp70RZD7W8XW1MxRonI7Afs-K1BFncmnpGOhtV7k6r6P4 (accessed on 15 January 2021).
  31. Kolesnikov, S.; Fukumoto, E.; Bozeman, B. Researchers’ risk-smoothing publication strategies: Is productivity the enemy of impact? Scientometrics 2018, 116, 1995–2017. [Google Scholar] [CrossRef]
  32. Tarango, J.; Machin-Mastromatteo, J.D. Chapter 4—An Academic Model to Support Scientific Production and Communication. The Role of Information Professionals in the Knowledge Economy. Chandos Publ. 2017, 103–128. [Google Scholar] [CrossRef]
  33. Becker, G. The Economic Approach to Human Behavior; University of Chicago Press: Chicago, IL, USA, 2013. [Google Scholar]
  34. Klein, P.G.; Cook, M.L.T.W. Schultz and the human-capital approach to entrepreneurship. Rev. Agric. Econ. 2006, 28, 344–350. [Google Scholar] [CrossRef]
  35. Katchanov, Y.L.; Shmatko, N.A. Complexity-based modeling of scientific capital: An outline of mathematical theory. Int. J. Math. Math. Sci. 2014, 785058. [Google Scholar] [CrossRef] [Green Version]
  36. Mongardini, C.; Tabboni, S. (Eds.) Robert K. Merton and Contemporary Sociology; Routledge: London, UK, 2018. [Google Scholar]
  37. Yusuf, F.N.; Omolayo, B.O.; Azikiwe, J.C. Influence of gender, work environment, length of service and age of academic staff on attitude to work. People: Int. J. Soc. Sci. 2015, 2, 1481–1489. [Google Scholar] [CrossRef] [Green Version]
  38. Fox, M.F. Gender, family characteristics, and publication productivity among scientists. Soc. Stud. Sci. 2005, 35, 131–150. [Google Scholar] [CrossRef]
  39. Roshchina, Ya. M.; Yudkevich, M.M. Factors of research activities of university teachers: Administration policy, contract incompleteness or environmental impact? Educ. Issues 2009, 3, 203–228. [Google Scholar]
  40. Birkmaier, D.; Wohlrabe, K. The Matthew effect in economics reconsidered. J. Inform. 2014, 8, 880–889. [Google Scholar] [CrossRef] [Green Version]
  41. Hermanowicz, J.C. What does it take to be successful? Sci. Technol. Hum. Values 2006, 31, 135–152. [Google Scholar] [CrossRef]
  42. Grebennikova, V.M.; Bonkalo, T.I.; Nikitina, N.I.; Gardanova, Z.R.; Grebennikov, O.V. A Study of Personality Factors in Inclusive Vocational Education: The Case of Russia. Revista Espacios, 40. 2019. Available online: https://0-www-scopus-com.brum.beds.ac.uk/inward/record.uri?eid=2-s2.0-85077436132&partnerID=40&md5=0076cff63e696d8e68101eb1905d2831 (accessed on 15 January 2021).
  43. Hesli, V.L.; Lee, J.M. Faculty research productivity: Why do some of our colleagues publish more than others? PS Political Sci. Politics 2011, 44, 393–408. [Google Scholar] [CrossRef] [Green Version]
  44. Silman, F. Work-related basic need satisfaction as a predictor of work engagement among academic staff in Turkey. S. Afr. J. Educ. 2014, 34, 1–5. [Google Scholar] [CrossRef]
  45. Lee, S.; Bozeman, B. The impact of research collaboration on scientific productivity. Soc. Stud. Sci. 2005, 35, 673–702. [Google Scholar] [CrossRef]
  46. Carayol, N.; Matt, M. Individual and collective determinants of academic scientists’ productivity. Inf. Econ. Policy 2006, 18, 55–72. [Google Scholar] [CrossRef]
  47. Zhang, M.; Zhang, G.; Liu, Y.; Zhai, X.; Han, X. Scientists’ genders and international academic collaboration: An empirical study of Chinese universities and research institutes. J. Informetr. 2020, 14, 101068. [Google Scholar] [CrossRef]
  48. Jump, P. Metrics: How to Handle Them Responsibly. Times Higher Education. 2019. Available online: https://www.timeshighereducation.com/features/metrics-how-to-handle-them-responsibly (accessed on 17 January 2021).
  49. Reid, N. Statistical sufficiency. In International Encyclopedia of the Social & Behavioral Sciences; Wright, J.D., Ed.; Elsevier: Amsterdam, The Netherlands, 2015; pp. 418–422. [Google Scholar] [CrossRef]
  50. Rousseau, R.; Egghe, L.; Guns, R. Statistics. In Becoming Metric-Wise; Rousseau, R., Egghe, L., Guns, R., Eds.; Chandos Publishing: Amsterdam, The Netherlands, 2018; pp. 67–97. [Google Scholar] [CrossRef]
  51. Menke, W. Factor analysis. In Geophysical Data Analysis, 4th ed.; Menke, W., Ed.; Academic Press: Cambridge, MA, USA, 2018; Chapter 10; pp. 207–222. [Google Scholar] [CrossRef]
  52. Kühn, D.; Osthus, D.; Townsend, T.; Zhao, Y. On the structure of oriented graphs and digraphs with forbidden tournaments or cycles. J. Comb. Theory, Ser. B 2017, 124, 88–127. [Google Scholar] [CrossRef] [Green Version]
  53. Scimago Journal & Country Rank. 2019. Available online: https://www.scimagojr.com/countryrank.php (accessed on 17 January 2021).
  54. Butler, L. What happens when funding is linked to publication counts. In Handbook of Quantitative Science and Technology Research; Moed, H.F., Glänzel, W., Schmoch, U., Eds.; Kluwer Academic Publishers: Amsterdam, The Netherlands, 2005; pp. 389–405. [Google Scholar] [CrossRef]
  55. Delgado, R.-M.; Tarango, J.; Machin-Mastromatteo, J.D. Scientific evaluation models in Latin America and the criteria for assessing researchers. Inf. Dev. 2020, 36, 457–467. [Google Scholar] [CrossRef]
  56. Pavelieva, T.Y. About the Prestige of a Scientist Profession. Socio-Political Sci. 2016, 3, 145–147. Available online: https://rucont.ru/efd/565350 (accessed on 20 January 2021).
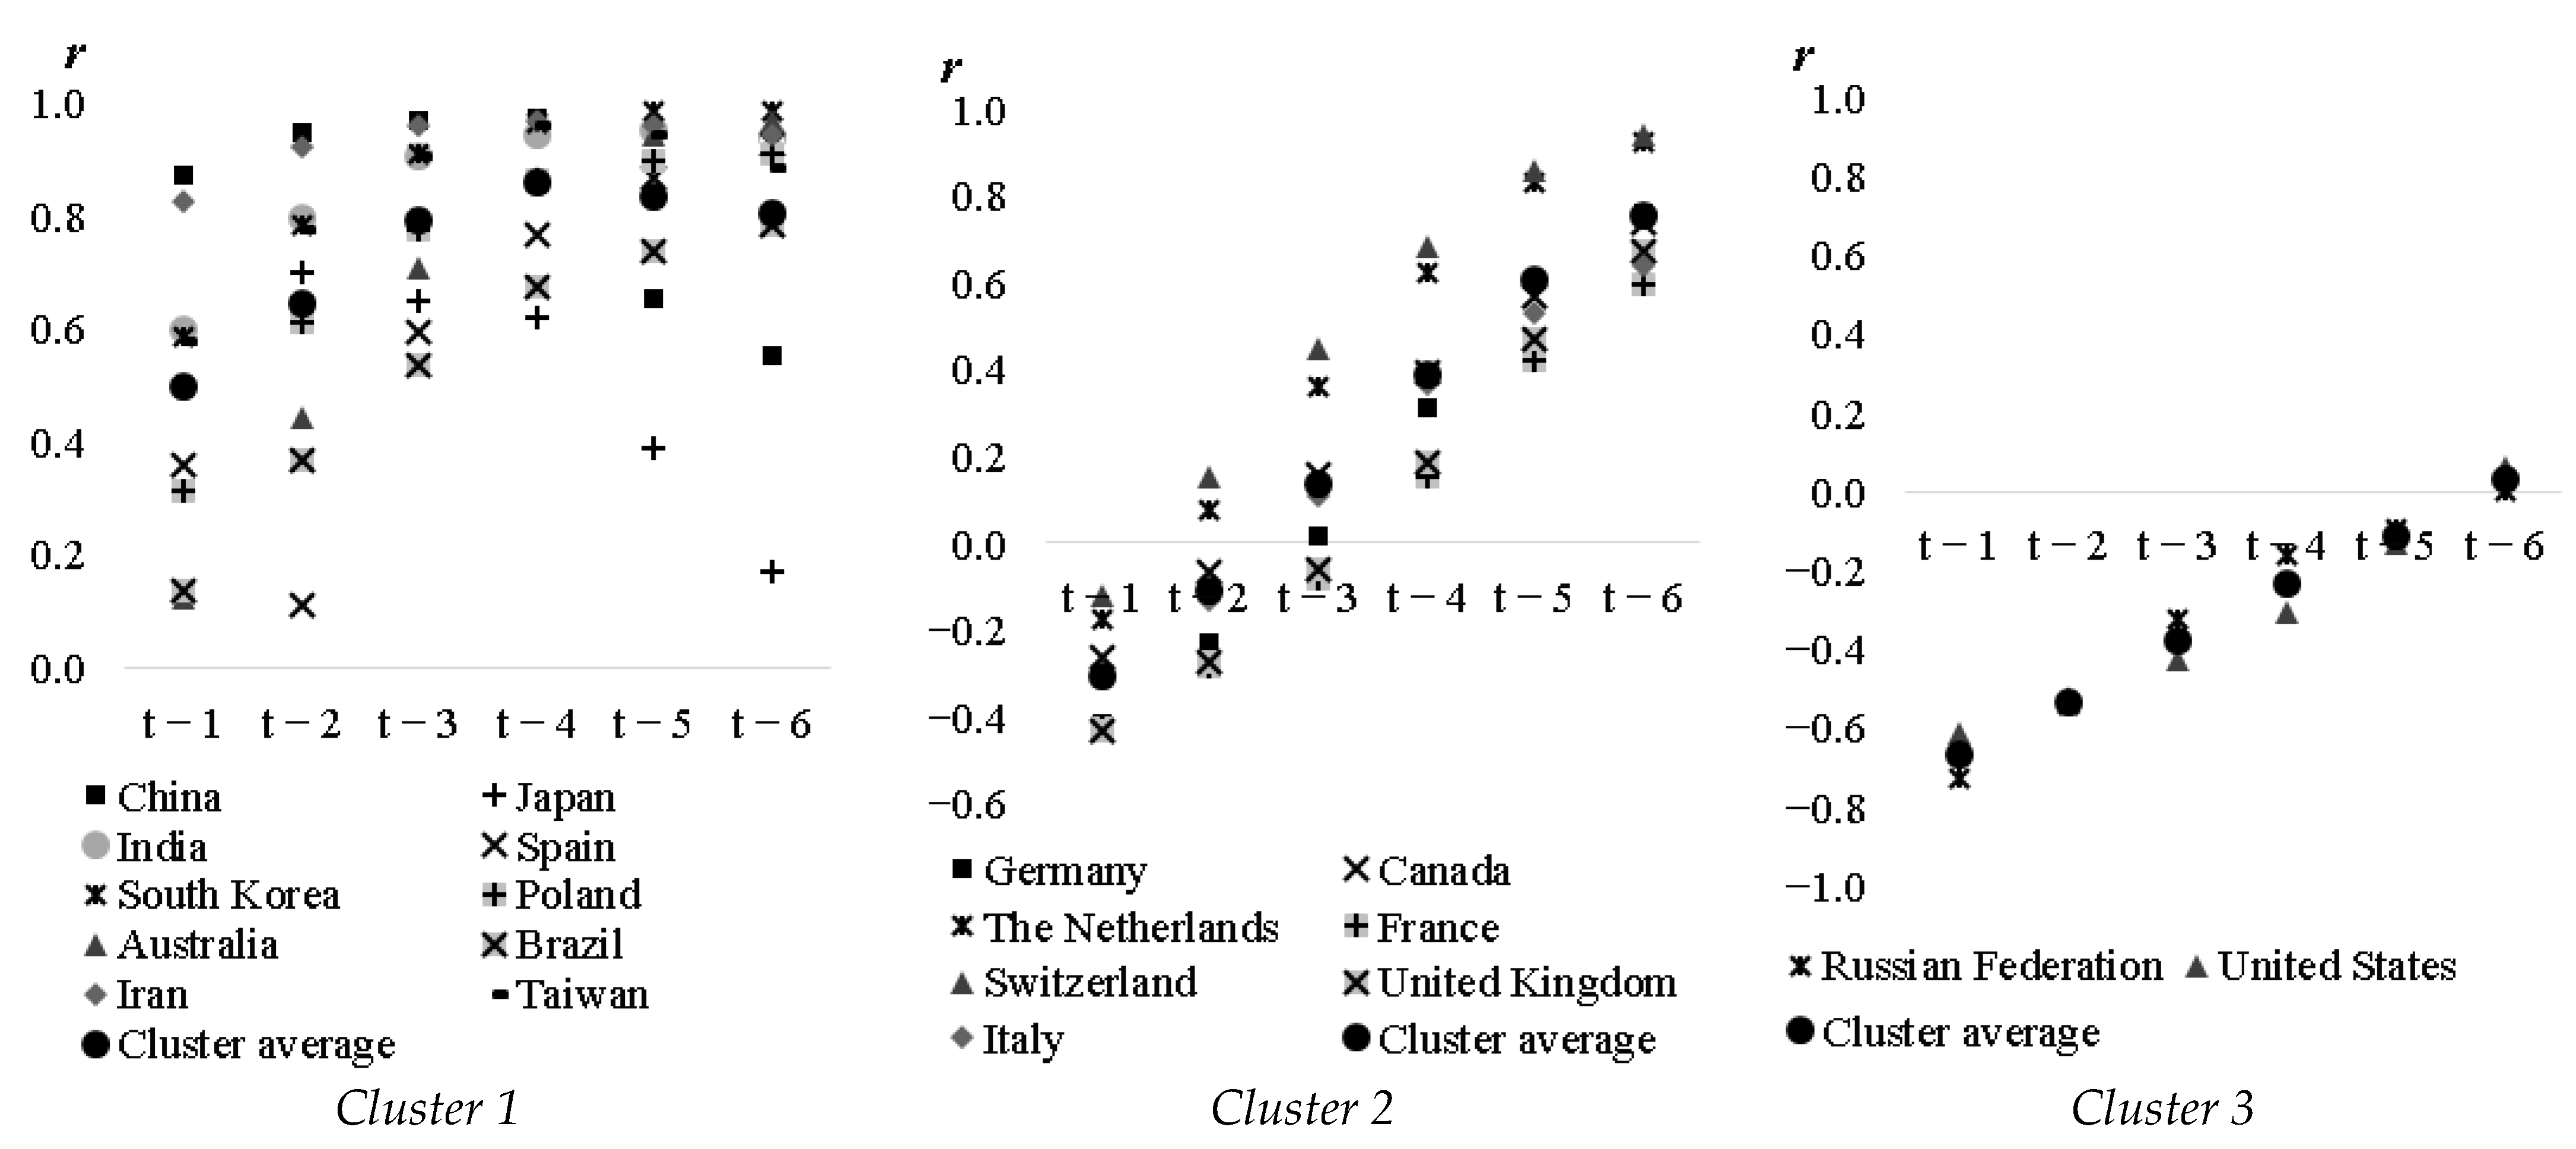
Figure 1. Values of the correlation coefficients between the number of publications and the number of citations at different time lags in the context of clusters.
Publications 09 00021 g001
Figure 2. The graph of the correlation of factors that affect the publication productivity of teachers.
Publications 09 00021 g002
Table 1. The value (rt) of the publication number and citation number in countries with significant publication productivity for 1996–2018.
Country/Lagt − 1t − 2t − 3t − 4t − 5t − 6
China0.8750.9500.9710.9730.6570.556
United States−0.612−0.525−0.427−0.305−0.1350.061
Japan0.5930.7030.6490.6220.3890.172
Germany−0.414−0.2310.0180.3080.5700.757
India0.5990.7990.9060.9450.9530.941
France−0.425−0.284−0.0800.1500.4180.597
United Kingdom−0.434−0.274−0.0610.1860.4710.670
Russian Federation−0.726−0.543−0.328−0.163−0.0950.001
Spain0.3610.1130.5950.7670.8680.929
South Korea0.5860.7860.9100.9660.9860.989
Italy−0.312−0.1310.1090.3640.5280.639
Canada−0.263−0.0690.1550.3950.5690.737
Poland0.3160.6110.7790.8670.8990.910
Australia0.1270.4430.7100.8700.9460.971
Brazil0.1370.3680.5380.6740.7390.787
Iran0.8260.9260.9600.9710.9620.945
Taiwan0.5780.7770.9060.9600.9470.885
Switzerland−0.1200.1520.4500.6810.8580.939
The Netherlands−0.1770.0760.3600.6240.8310.923
Table 2. The factors related to publication productivity for Russian universities teachers.
Factor DescriptionIndicators that Formed Each FactorTeachers (Dispersion, %)
YoungSeniorYoungSenior
The factor of scientific and pedagogical potentialFpotХ2–Х5, Х16–Х18, Х22–Х23-23.4-
The factor of communicative competencies and international activityFcomХ7–Х15-20.6-
The factor of professional and communicative competence and international activityFPCC-Х2–Х15, Х18, Х22–Х23-34.9
The factor of professional growth prospectsFgrХ20–Х21, Х24, Х31Х20–Х21, Х24, Х3116.49.1
The factor of psychological satisfaction with the jobFpsХ19, Х32–Х33, Х35Х19, Х32–Х33, Х3514.318.6
The factor of financial satisfactionFfinХ25, Х27–Х29Х25–Х2910.629.7
The factor of material and technical resources and working conditionsFmatХ30, Х34Х30, Х344.04.8
Table 3. The hierarchy of the factors that affect the publication productivity.
Young TeachersSenior Teachers
iS(zi)P(zi)S(zi)∩ P(zi)Hierarchy LeveliS(zi)P(zi)S(zi)∩ P(zi)Hierarchy Level
First iterationFirst iteration
FpotFpot, Fcom, Fgr, Fps, Ffin, FmatFpot, FcomFpot, Fcom1FPCCFPCC, Fgr, Fps, Ffin, FmatFPCCFPCC1
FcomFpot, Fcom, Fgr, Fps, Ffin, FmatFpot, FcomFpot, Fcom1FgrFgrFgr, FPCCFgr-
FgrFgrFpot, Fcom, FgrFgr-FpsFpsFps, FPCCFps-
FpsFpsFpot, Fcom, FpsFps-FfinFfin, FmatFfin, FPCCFfin-
FfinFfinFpot, Fcom, FfinFfin-FmatFmat, FfinFmat, FPCC, FfinFmat, Ffin-
FmatFmatFpot, Fcom, FmatFmat-
Second iterationSecond iteration
FgrFgrFgrFgr2FgrFgrFgrFgr2
FpsFpsFpsFps2FpsFpsFpsFps2
FfinFfinFfinFfin2FfinFfin, FmatFfinFfin2
FmatFmatFmatFmat2FmatFmat, FfinFmat, FfinFmat, Ffin2
Table 4. The regression models of the first level factors influencing the qualitative component of publication productivity in terms of the age of the university teachers in Russia.
ModelStatistical Significance Indicators
R21Femp2Ftab3Temp4ttab5
Young scientists
Y = 0.44 × X2 + 0.37 × X3 + 0.29 × X7 +
+ 0.36 × X9 + 0.39 × X10 + 0.34 × X12 +
+ 0.33 × X14 + 0.33 × X16 + 0.32 × X17 − 0.28
0.81139.41.94tХ2 = 8.11;
tХ3 = 7.11;
tХ7 = 3.95;
tХ9 = 4.94;
tХ10 = 6.91;
t Х12 = 5.91;
t Х14 = 4.38;
t Х16 = 5.38;
t Х17 = 4.99
1.96
Senior scientists
Y = 0.58 × X2 + 0.26 × X3 + 0.33 × X7 +
+ 0.33 × X9 + 0.41 × X10 + 0.40 × X12 +
+ 0.25 × X14 + 0.31 × X18 + 1.29
0.88146.11.94tХ2 = 7.98;
tХ3 = 3.28;
tХ7 = 4.18;
tХ9 = 5.73;
tХ10 = 6.39;
t Х12 = 5.09;
t Х14 = 3.98;
t Х18 = 2.48
1.96
1 Determination coefficient;2 Empirical value of Fisher F-test; 3 Table value of Fisher F-test; 4 Empirical value of Student t-test; 5 Table value of Student t-test.
Table 5. Values of elasticity coefficients characterizing the publication productivity management in terms of university teachers’ age in Russia.
ValueElasticity Coefficient Value, %
For Young TeachersFor Senior Teachers
Х20.080.16
Х30.310.06
Х70.080.02
Х90.030.01
Х100.140.11
Х120.190.13
Х140.020.01
Publisher’s Note: MDPI stays neutral with regard to jurisdictional claims in published maps and institutional affiliations.

