
Russian University Teachers’ Perceptions of Scientometrics


1
Department of Humanities, Peter the Great St. Petersburg Polytechnic University (SPbPU), Polytechnicheskaya 29, 195251 St. Petersburg, Russia
2
Department of Social Science, Peter the Great St. Petersburg Polytechnic University (SPbPU), Polytechnicheskaya 29, 195251 St. Petersburg, Russia
3
Department of Philosophy, Peter the Great St. Petersburg Polytechnic University (SPbPU), Polytechnicheskaya 29, 195251 St. Petersburg, Russia
*
Author to whom correspondence should be addressed.
Publications 2021, 9(2), 22; https://0-doi-org.brum.beds.ac.uk/10.3390/publications9020022
Submission received: 7 April 2021
/
Revised: 22 May 2021
/
Accepted: 25 May 2021
/
Published: 27 May 2021
(This article belongs to the Special Issue Modern Problems of Scientometric Assessment of Publication Activity)
Abstract
:This article is devoted to the attitude of Russian university teachers toward scientometrics and its indicators, which have been imposed on them by university administrations and the state since 2012. In addition to substantiating the problem’s urgency, the article contains a brief critical outline of the main scientometric parameters and their application in practice in Russia. To evaluate this, 283 people from leading universities in Russia (included in Program 5-100) were questioned. As the study showed, faculties of Russian universities understand the specifics of scientometrics, relate to it relatively positively, and over the past years have been able to adapt to the new requirements of the administration regarding implementing scientometric tasks and standards. The higher the position and scholarly qualification of a respondent, the more complete the knowledge about scientometrics. Scholars in the humanities know and relate comparatively better to scientometrics than representatives of technical and general scientific specialties.
1. Introduction
Digitalization affects increasing areas of human life; quantitative indicators are becoming dominant in areas that previously seemed not intended for this [1]. Scientometrics is a special discipline that researches scholarship using mathematical methods, data collecting, and statistical processing of bibliographic information (the number of published scientific papers, citations, etc.). Despite using mathematical methods, equations, and mathematical analysis, scientometrics can hardly be classified as a full-fledged science since its main indicators rarely give a complete and objective picture of the scientific achievements of specific researchers (which will be discussed below). Nevertheless, scientometric data are now widely used in various countries, and in Russia, since 2012, there has been a real fetishization of scientometric parameters, at least in the country’s leading universities.
The origin of bibliometrics dates back to the end of the 19th century, the scientometrics taking shape in the middle of the 1950s in the United States, founded by the American linguist Eugene Garfield [2]. In 1960, he organized the Institute of Scientific Information (ISI), which since 1963 has regularly published bibliographic indexes of scholarly citation (Science Citation Index). Such bibliographic information was much needed by universities, rating agencies, and other organizations directly or indirectly connected with education and scholarship and, therefore, willing to pay for it [3]. It is not surprising that three decades later, scientometrics in the United States has become a thriving and profitable discipline, especially after the takeover of ISI by the Thomson Reuters Corporation in 1992 and forming the world-famous bibliographic database (BDB) Web of Science (WoS), which Clarivate Analytics took over in October 2016.
Europe was somewhat late in joining this bibliometric business. In 1995, Elsevier Publishing Corporation, based in the Netherlands, created the largest current bibliographic and abstract database Scopus, which indexes more than 24 thousand scholarly journals, materials from the most authoritative international and national conferences, and monographs published by major scientific publishers, mainly in English. Only in 2005 did Russia, on the initiative of the Russian electronic library (eLIBRARY), receive its own bibliographic database of the Russian Science Citation Index (RSCI).
Now in Russia, the bibliographic information and the results of its mathematical processing obtained from all three databases (WoS, Scopus, RSCI) are actively used in planning scientific work and reports, distributing grants, and encouraging leading scientists and scientific departments of universities and institutes, with their ranking and financing depending on the achieved scientometric indicators. At the same time, ministerial and university bureaucrats often treat scientometric parameters and final figures uncritically, allowing various ill-considered decisions and abuse of scientometric information. For example, in January 2020, the Ministry of Science and Higher Education of the Russian Federation sent out a directive letter no. MH-8/6-SK “On adjusting the State Task taking into account the methodology for calculating the integrated score of publication performance.” An analysis of the table attached to the letter, where the scores for various publications were indicated, shows that the ministerial requirements for scientometric indicators have reached complete absurdity. Thus, according to the table, one article published in a journal indexed by the WoS Core Collection database and assigned to the first quartile (Q1) is almost equal to 20 articles registered in the Scopus database (regardless of quartiles) or 40 articles from Russian journals or 20 monographs! However, the work and time expenditures for writing even a small monograph are incomparable with the similar costs for writing even the most high-quality article. Moreover, it is the monographs that are most appreciated by specialists in the field of humanitarian knowledge. Moreover, although then the ministerial table underwent correction, taking into account the specifics of the humanitarian disciplines, the problem of the acceptable use of scientometric indicators does not lose its relevance.
The object of this study is the reflection of the teaching staff on scientometrics and scientometric requirements. Currently, the scientometrics in elite Russian universities are not just a trivial calculation of numbers, their analysis, and interpretation, but a reason for making important managerial decisions with the appropriate reflection of the scientific community.
2. Literature Review
Scientometrics draws its material for mathematical calculations and indexes from bibliographic databases that use three main indicators: (1) the number of publications of the author, (2) the number of citations of his works, and (3) the Hirsch index. In other words, the minimum standard set. For organizations and their divisions, these indicators are usually added to the number of the staff who published their works, with various additional weighting factors and calculations introduced if necessary. In addition to the three main indicators, other markers, metrics, and graphs can be used.
Besides the three main indicators, other markers, metrics, and graphs can be used. For example, Web of Science and Scopus use charts to clearly show the number of publications by year and their citations in the author’s profile. In addition, on the Publons platform, authors can find the average figure of citations of their works and the average number of citations per year in the WoS system. RSCI provides several dozen metrics, including the h-index without self-citation, the number of articles and citations in foreign journals, the number of publications over the past five years, and so on (for scientometric indicators, see more detail [4]). However, all these and other scientometric parameters are of secondary importance compared to the three main ones, and they are usually not used at all in Russian universities in practice and are unknown to either the administration or the teaching staff.
In addition to scientometric indicators, an expert assessment is also used in Russia and other countries, but usually in reviews in journals (or reviews on monographs). Of course, this kind of expert analysis indirectly supplements and corrects scientometric statistics. In university practice, expert analysis is usually not applied, but primitive quantitative indicators are used, for example, the number of publications indexed in the Scopus or WoS databases for the previous three calendar years; Hirsch index according to BDB Scopus or RSCI, etc.
Let us start with the total number of publications—the most common indicator of the effectiveness of the scientific activity of a scholar. Not all of the scholar’s works are recorded in bibliographic databases, sometimes reducing the final figure and significantly. The leading international databases Web of Science and Scopus introduced artificial restrictions on the registration of scholarly papers: articles published in peer-reviewed journals, mainly in English, have absolute priority, which results in discrimination against representatives of non-English-speaking countries [5,6].
In addition to the frequent underestimation of a scholar’s total number of publications, another important disadvantage of the main scientometric indicator is the ignoring of complexity, volume, and quality of scholarly work. After all, a simple mechanical calculation of publications erases the difference between a monograph, journal article, review, etc. Therefore, such a simple indicator as the total number of publications must, on one hand, be detailed, indicating the nature of the publications, and, on the other hand, must be supplemented with other scientometric indicators.
Here it is also necessary to touch upon the issue of co-authorship. This problem is especially relevant for the natural, medical, and technical sciences since humanities specialists usually write their work individually or in small teams. A classic example is an article published after research at the Large Hadron Collider and the discovery of the Higgs boson: almost 3000 physicists are formally considered the authors of this article! [7] (p. 7). It is impossible to imagine that all these people wrote one article. Although fractional counting methods have already been developed in scientometrics [8], they are rarely used in university practice. The main bibliometric databases also give equal co-authorship to all contributors (real and more often imaginary) of the indexed publication.
The problem of co-authorship often, especially in Russia, also lies in the possibility of various abuses, for example, when co-authors forcibly (or voluntarily—to assist in the publication of an article) include the leadership of a department or university in the absence of a real contribution to scientific research [9] (p. 276). In addition, false co-authorship distorts scientometric results, and sometimes very significantly, leading to citation fraud, contributing to corruption, and so on.
Even this brief outline of the most universally used scientometric indicator demonstrates that the number of author’s works appearing in one or another bibliographic database rarely reflects the real number of his/her publications (underestimating or, conversely, overestimating through the mechanism of co-authorship). In parallel, scientometrics offers another indicator that is designed to solve the research impact. This is the citation, which means considering the reference to the author’s work by another author or group of authors. It is believed that the more citations, the higher the demand for the scholarly work, and thus its quality. Currently, the citation index (CI) is a generally recognized indicator of the significance of a scholar’s work in the scholarly world. Although it has no fewer disadvantages than the previous main scientometric indicator, it appears in all the databases because not all of the author’s works are recorded in the leading databases Web of Science and Scopus. Accordingly, the number of citations considered will be artificially reduced. Again, there is the problem of co-authorship: the citation index does not take into account the personal contribution of the author (when calculating the CI, that is, it does not matter if fifty people wrote the article or there was only one author) [10] (pp. 135–141).
In scientometrics, it has long been noted that citation depends on the branch of scientific knowledge and the culture of citation: most often, doctors and biologists are cited, and least often, historians and mathematicians. In addition, the number of citations depends very significantly on the scholarly topic and specialization, even within a single science. For example, it is obvious that in ethnography, a larger topic or study devoted to a larger ethnic group will gather a larger “crop” of citations: links to an article about the material culture of the Chinese will be significantly more than to a publication about totemism among the Haida-Kaigani Indians. Among other things, the number of citations received can be influenced by the “scientific fashion” and personal relationships between scholars (the role of the subjective factor is especially great in Russia with its tradition of informal scholarly relations and corruption).
There are several other obvious disadvantages to the citation index. In particular, the CI registers references even to those works that are subjected to fair criticism and thus reaches the point of complete absurdity: a negative reference, which, in theory (after verification by experts) should be credited with a minus sign, on the contrary, brings the criticized author an additional citation. However, the “father of scientometrics”, Eugene Garfield did not consider this a significant problem since, in his opinion, scholars are not inclined to be distracted by refuting frivolous works [11] (p. 45). He also believed that there is no need to be afraid of self-citation, which from his point of view is to a certain extent justified and considered by all bibliographic databases without exception. Indeed, references to your own work can be useful (within reasonable limits) by referring the reader to more detailed information. However, it is clearly not necessary to take them into account in scientometric calculations since, on this basis, an artificial increase in the citation is possible. Thus, the introduction in Italy in 2010 of the rule to take into account citations when holding the position of professor has led to a sharp increase in self-citation, especially among sociologists [12]. According to a special study, the more people quote themselves, the more often they are quoted by other scholars [13] (p. 433). Wherein men are about one and a half times more likely to refer to their own work than women [14].
A very significant disadvantage of the citation index is, in our opinion, that a single reference to specific work is usually considered in the list of literature used in the article. However, there may be several references to this publication in the text. An equally serious disadvantage of the CI is that it can be artificially increased by various manipulations, for example, when colleagues agree to quote each other’s results. Such unethical methods are not uncommon in Russia and sometimes abroad.
Despite all these disadvantages, the citation of scholarly papers formed the basis of another scientometric index—the impact factor (IF) of journals. The impact factor is a formal numerical indicator of the importance of a scientific journal, which shows how many times, on average, each article published in it is cited over the next two years after publication. The introduction of the impact factor contributed to a better selection of scientific journals by the WoS database, where they are divided into four categories—quartiles—from Q1 (highest) to Q4 (lowest). Currently, the SCImago Journal Rank (SJR) is a convenient and visual system that demonstrates quartiles of journals. It is a publicly accessible portal developed by the University of Granada (Spain) with ratings of journals and countries and is associated with the Scopus database [15].
In addition to the impact factor, the citation of scholarly papers forms the basis of the last of the main scientometric indicators, the Hirsch Index—the h-index. This was developed in 2005 by Jorge Hirsch from the University of San Diego (CA, USA) to assess a researcher’s scientific productivity that can be given by such simple characteristics as the total number of publications and citations. According to the h-index, a scientist has index h if h of his or her Np papers have at least h citations each and the other (Np-h) papers have ≤h citations each [16] (p. 16569). Although the h-index has undeniable positive qualities, such as ease of calculation and a relatively adequate assessment of the scholarly productivity of the researcher, it is not without many disadvantages. Thus, the h-index number cannot exceed the total number of the author’s works; it does not take into account information on the most important highly cited works; two people with the same h-index value may have a total (summary) citation rate (IC), which differs tenfold, etc. [10].
As we can see, none of the three main scientometric parameters is perfect, and their thoughtless use can lead to various misunderstandings and abuses (see in detail [17]). However, the warnings of scientometrics experts had no effect in Russia, where a real fetishization of scientometric indicators began in 2012, which could not but affect the position of teachers in the country’s leading universities. The pressure of the state bureaucracy was especially intensified under President Vladimir Putin, including strengthening the powers of the Ministry of Higher Education and university administration. To prevent a further decline in the country’s prestige in the field of international publication activity, decree no. 599, signed by President Putin, “On Measures to Implement State Policy in the Field of Education and Science,” was issued on 7 May 2012. It set a goal to increase Russian researchers’ work in the total number of publications in world scholarly journals indexed in the Web of Science to 2.44% by 2015.
After the publication of the 2012 presidential decree, all subsequent state policies in the field of scholarship began to adapt to it, including the forced introduction of basic scientometric indicators, which began receiving much more attention. Another consequence of the decree was the inclusion of Russian universities in the rating race both at home and abroad. In 2013, the ambitious government program “5-100-2020” was launched, according to which by 2020, the five best Russian universities should be included in the top 100 universities globally. Considerable funds were allocated to 21 elite Russian universities for this project, including to increase the publication activity and citation of their employees and scholars. In general, the experience was quite successful, and according to WoS data for 2017, Russia’s share was 2.56% of the world’s scholarly publications, which corresponded to 13th place globally [18,19] (p. 828). Now, in 2021, according to the SJR rating, Russia is in 12th place globally in terms of the number of scientific publications, slightly ahead of South Korea and behind Spain.
In this situation, Russian scholars and teachers are forced to adapt to the state and university bureaucracy regulations. Similar processes are observed in other countries. For example, the rush toward rating indicators in Pakistan, where a similar program to include five of the best universities in the top 300 higher educational establishments of the world had been adopted, led not only to the monetary stimulation of publication activity but also to various abuses and the deterioration of the quality of scientific publications [20] (pp. 442–447). Likewise, in China, young scientists are forced to publish in journals indexed by prestigious international databases [21]. Even in Italy, some authors, albeit insignificant, either unknowingly or quite deliberately give their works to so-called “predatory” journals for faster publication and indexing of articles for getting a citation [22] (pp. 14–15, 26).
The same is observed in Russia. To meet targets, not always honest methods are used that will allow one to achieve, and sometimes even exceed, the formal requirements of superiors. In recent years, the number of articles with multiple authors has increased significantly (especially among scholars in the humanities). The usual method has been to divide a large article into several smaller ones to increase the total number of publications; publication of the same work, but with different titles and minimal changes in content, has the same effect. The unrestrained mutual citation has also been used [23] (pp. 64–66).
3. Methods
In preparing this article, such standard theoretical methods of scholarship were used as induction and deduction, analysis and synthesis, a systematic approach, and the comparative–typological and comparative–analytical methods.
In addition to theoretical methods, practical methods, such as working with documents, analysis of printed and electronic sources of information, and especially computer-assisted web interviewing, were widely used in writing this article. The use of the latter helped to gather the main blocks of information on the research topic. In addition, statistical and mathematical methods were also used when processing questionnaires and respondent’s answers.
For a more detailed study of the attitude of Russian university teachers to scientometrics and its indicators, the authors developed a questionnaire of 22 questions for a survey, the results of which are given in the Appendix A (see Table A1). The survey, conducted in the first three months of 2020, involved 283 respondents. In the Russian Federation in 2020, 227 thousand teachers worked in all universities; this information was published in the statistical collection “Education in Figures: 2020”. This short statistical compilation is the main source of information on the entire system of Russian education. The collection uses data from the Ministry of Education of the Russian Federation, the Ministry of Education and Science of the Russian Federation, and the Federal Treasury, as well as its own developments at the Institute for Statistical Research and Economics of Knowledge of the National Research University Higher School of Economics. Thus, observing a confidence level of 90 and a confidence interval of 5%, we have the minimum required sample size of 272 respondents (283 university professors were interviewed in the study). In addition, forming the sample being influenced by the number of teachers with a university degree should have been at the average for the Russian Federation (74.1%). The distribution of respondents by universities is presented as follows: Peter the Great St. Petersburg Polytechnic University (30 respondents), ITMO University (30 respondents), Ural Federal University (30 respondents), University of Tyumen (30 respondents), the National Research Tomsk State University (30 respondents), the Herzen State Pedagogical University of Russia ( 30 respondents), St Petersburg University, Saint Petersburg State University (30 respondents), etc. (17 universities in total, including Nizhny Novgorod State University, Far Eastern Federal University, Kazan Federal University, Moscow University of Physics and Technology, Moscow Pedagogical State University, Higher School of Economics, Novosibirsk State University, Kemerovo State University, Ugra State University, Surgut State University (73 respondents). These are mainly educational institutions included in the 5-100 Program, and therefore, their teachers were generally better oriented in the problems of scientometrics than representatives of ordinary Russian universities (the Herzen State Pedagogical University of Russia was chosen as a control University not included in the 5-100 Program, which provided 10% of respondents). Statistical materials were collected both through direct questionnaires and through Internet surveys. At the same time, the number of respondents from provincial universities—150 people—slightly exceeded the number of respondents from St. Petersburg (133). Among the respondents, just over half were women—50.5%, men—45.6%, and only a very few refused to answer the question about their gender (3.5%) or indicated another gender—0.4%. The age distribution gave the following figures: young people under 34 years of age made up 36.7%, middle-aged (35–49 years)—39.9%, and 50 years and older—23.4%, which roughly reflects the gender and age structure of teachers at Russian universities. As for ethnicity, the vast majority of respondents identified themselves as Russian—96.5%; several people identified themselves as Jews, Kazakhs, Tatars, or Ukrainians. As for the respondents’ professional and official structure, professors made up 10.6%, associate professors—44.2%, senior teachers—19.8%, and assistants—25.4%, which approximately corresponds to the standard number of each category in a normal Russian university. Half of the respondents identified themselves as scholars in the humanities—49.8%, and 50.2% identified themselves as natural and technical sciences representatives. Of the respondents, 46.3% preferred not to reveal their specialty, indicating only which sciences could be attributed. Information on those who indicate their specialty is presented in the Appendix A with information on the universities (see Appendix A, Table A2).
4. Analysis of the Perception of Scientometric Indicators in Leading Russian Universities
Interest in the problem of scholars’ attitudes to scientometric indicators arose initially in the West in the 1990s [24]. One of the most extensive studies of this phenomenon was done in 2012 when an Internet survey of 1704 researchers representing all branches of scholarship from 86 countries was conducted. However, this survey concerned only one scientometric indicator—the impact factor. The results showed that the positive attitude of scholars to it only slightly exceeded the negative one, but for 88% of the respondents, the IF is important or very important for evaluating scholarly performance in their country [25] (pp. 286–289). Research in this direction is continuing, although not very intensively. For example, a comparative analysis of the surveys of 420 humanities scholars in Australia and Sweden concerning bibliometric (scientometric) indicators was recently conducted. The survey found, in particular, that a third (32%) of respondents used scientometric parameters for evaluation or self-promotion in attachments and resumes [26] (p. 927).
In Russia, almost the only work devoted to the topic of interest was an article published in 2016 by Igor Filippov, “How Scholars of Humanities Profile Evaluate Scientometrics,” in the journal Siberian Historical Research. Forty people from among the humanities folk took part in the interview he conducted, i.e., the representativeness of the research is clearly insufficient, which the author of the article admitted. At the same time, all of Filippov’s respondents were united in the opinion that the proposed new ways of evaluating scientific activity using scientometric indicators are unsatisfactory since they differ in a high degree of formalism, do not allow evaluation of the merits of the work of scholars, and therefore, are unfair. At the same time, the interviews revealed that many respondents were not well aware of scientometrics, its goals, heuristic capabilities, limits, and experience of application: many, even experts, were unable to report their data in the Russian science citation index or in foreign bibliometric databases (specific figures are not given in Filippov’s article) [27] (p. 14).
After a preliminary review of the main parameters of respondents, we will go directly to the results of their survey. To the question, “Do you know what ‘scientometrics’ is?” the most popular answer was: “Yes, I know very well”—54.8% of responses; another 35% of respondents noted “vaguely imagine,” and 10.2%—“do not know.” Thus, a little more than half of the Russian university teachers are very familiar with scientometrics, and only 10% do not know about it. At the same time, the share of those who do not have a clear knowledge of this discipline is significant—just over one-third. At the same time, only 18.7% of respondents heard the term “scientometrics” for the first time in 2012 when scientometric indicators were widely introduced into practice, while the rest gradually became acquainted with it only recently. By year, it looks like this: in 2012–2013: 11.7%, in 2014–2015: 19.8%, in 2016–2017: 19.4%, in 2018–2019: 15.9% and 14.5% of respondents learned the term “scientometrics” only during our survey. From the given response figures, it can be seen that familiarity with the term gradually increased up to 2016, after which it began to decline.
Most respondents have a neutral attitude to scientometrics (56.9%); 26.9% have a positive attitude to this discipline, and 16.2% have a negative attitude. These figures show that, in general, the teaching community has already adapted to the administration’s requirements and is relatively favorable to scientometrics (definitely—about a quarter), and opponents are outnumbered. It is also likely that the desire of some teachers, especially from provincial universities, to indirectly demonstrate their loyalty to the university authorities (whose primary concern is to formally increase the scientometric indicators for reporting to the ministry) has affected this situation.
Of the respondents, 63.3% could boast a good knowledge of all bibliometric databases (RSCI, Web of Science, and Scopus). “Something familiar, but there are no clear ideas” was the answer of 17% of respondents. Only 14.1% of respondents know well the Russian science citation index, 3.2% do not know any of the bibliometric databases at all, and 2.4% of respondents gave their own version of the answer, which in terms of semantic content is closer to a good knowledge of all three databases. Thus, only a very small percentage of Russian teachers do not know anything about bibliometric databases.
Next in our questionnaire were clarifying questions related to scientometric indicators. To the question, “Do you know what the ‘h-index’ is?” “yes” was answered by 77.4%, “very approximately”—17%, “no”—5.6%. It is interesting to note that respondents know the h-index much better than scientometrics itself. Perhaps the reason lies in the exotic-sounding term that periodically pops up in the scientific press, administration orders, and private conversations of teachers. As for knowing the value of their own h-index, Russian university teachers show much less awareness: in the RSCI database, about a third—32.5%—do not know the value of their own h-index. The situation is even worse regarding knowledge of their indicators in international databases: more than half of Russian respondents have no idea about their h-index figure in the Web of Science (61.5%) and in Scopus (56.2%). This is not surprising, given that not all Russian teachers, and especially young ones, have registered citations in international databases and, accordingly, a nonzero h-index.
To the question, “Do you know what the journal’s impact factor and its quartile are?” a little more than half of the respondents answered: “I know both terms very well and understand their meaning” (55.1%). Almost 30% of respondents have a vague idea about them (“I have encountered them somewhere”—29.7%), and 11.3% first learned about the existence of these terms during the survey. The last figure agrees well with the negative answer about knowledge of the term “scientometrics” (10.2%) in one of the previous questions.
The next question was: “Do you keep track of your scientometric indicators in the main bibliographic databases?” It turned out that a little more than half of the respondents monitor their scientometric indicators from time to time (55.1%), 20.9% monitor constantly, and never—almost a quarter (24%). The last figure is very significant and surprising. An additional review of the questionnaire showed that of the 67 people, who ignore their data in WoS, Scopus, and RSCI, most are people, who occupy the lower levels of the official hierarchy (assistants and senior teachers—88%), and most are young men, who, due to their age, do not yet have decent publication indicators that it would make sense to monitor.
To the question, “How does managing your university treat scientometric indicators?” 44.2% of respondents answered: “The university management pays some attention to scientometric indicators,” 41% believe that the administration regularly monitors the scientometric indicators of teachers, and according to 14.8% of respondents, it ignores them. Thus, most teachers (85.2%) are aware of administrative control and are probably trying to adapt to it, including correcting their publication strategy. At the same time, the authors should note a relatively high percentage of responses (almost 15%) that deny monitoring of scientometric parameters by the university administration. It is obvious that the respondents who answered this way are at the lowest levels of the official hierarchy and simply do not know the administrative policy of university management. It is also striking that most such respondents (56%) are concentrated at the Herzen State Pedagogical University of Russia, where control over the scientometric results of teachers is of secondary importance since the university is not included in the 5-100 Program.
According to our survey, most universities have incentives for high scientometric achievements. Almost half of the respondents (46.7%) reported that their superiors sometimes reward subordinates for good scientometric reporting, and 31.4% said that such incentives are regularly based on the school year’s results and during recertification. At the same time, 21.9% of respondents stated that there is no reward for high scientometric indicators. Most likely, we are again faced with the results of the responses of young teachers and specialists, who still have very few publications, their scientometric indicators being minimal. Therefore, they cannot count on any awards from their superiors, and thus they have the illusion that the university does not have any incentive system for scholarly achievements.
To the question, “What specific sanctions are applied to stimulate the increase of scientometric indicators in your university?” the following information was received: the administration of more than a quarter of universities pays bonuses for publications indexed in the WoS and/or Scopus database (28.6%), and almost the same number of universities do not use any sanctions at all (28.3%). One-fifth of respondents (19.8%) pointed to the link between scientometric indicators and wages, while another 3.2% found it difficult to answer. The remaining 20.1% of the surveyed teachers offered their own options, including dismissal/non-promotion to pass the competition due to the lack of publications indexed in the WoS and Scopus databases and various sanctions for different academic branches or departments of the university.
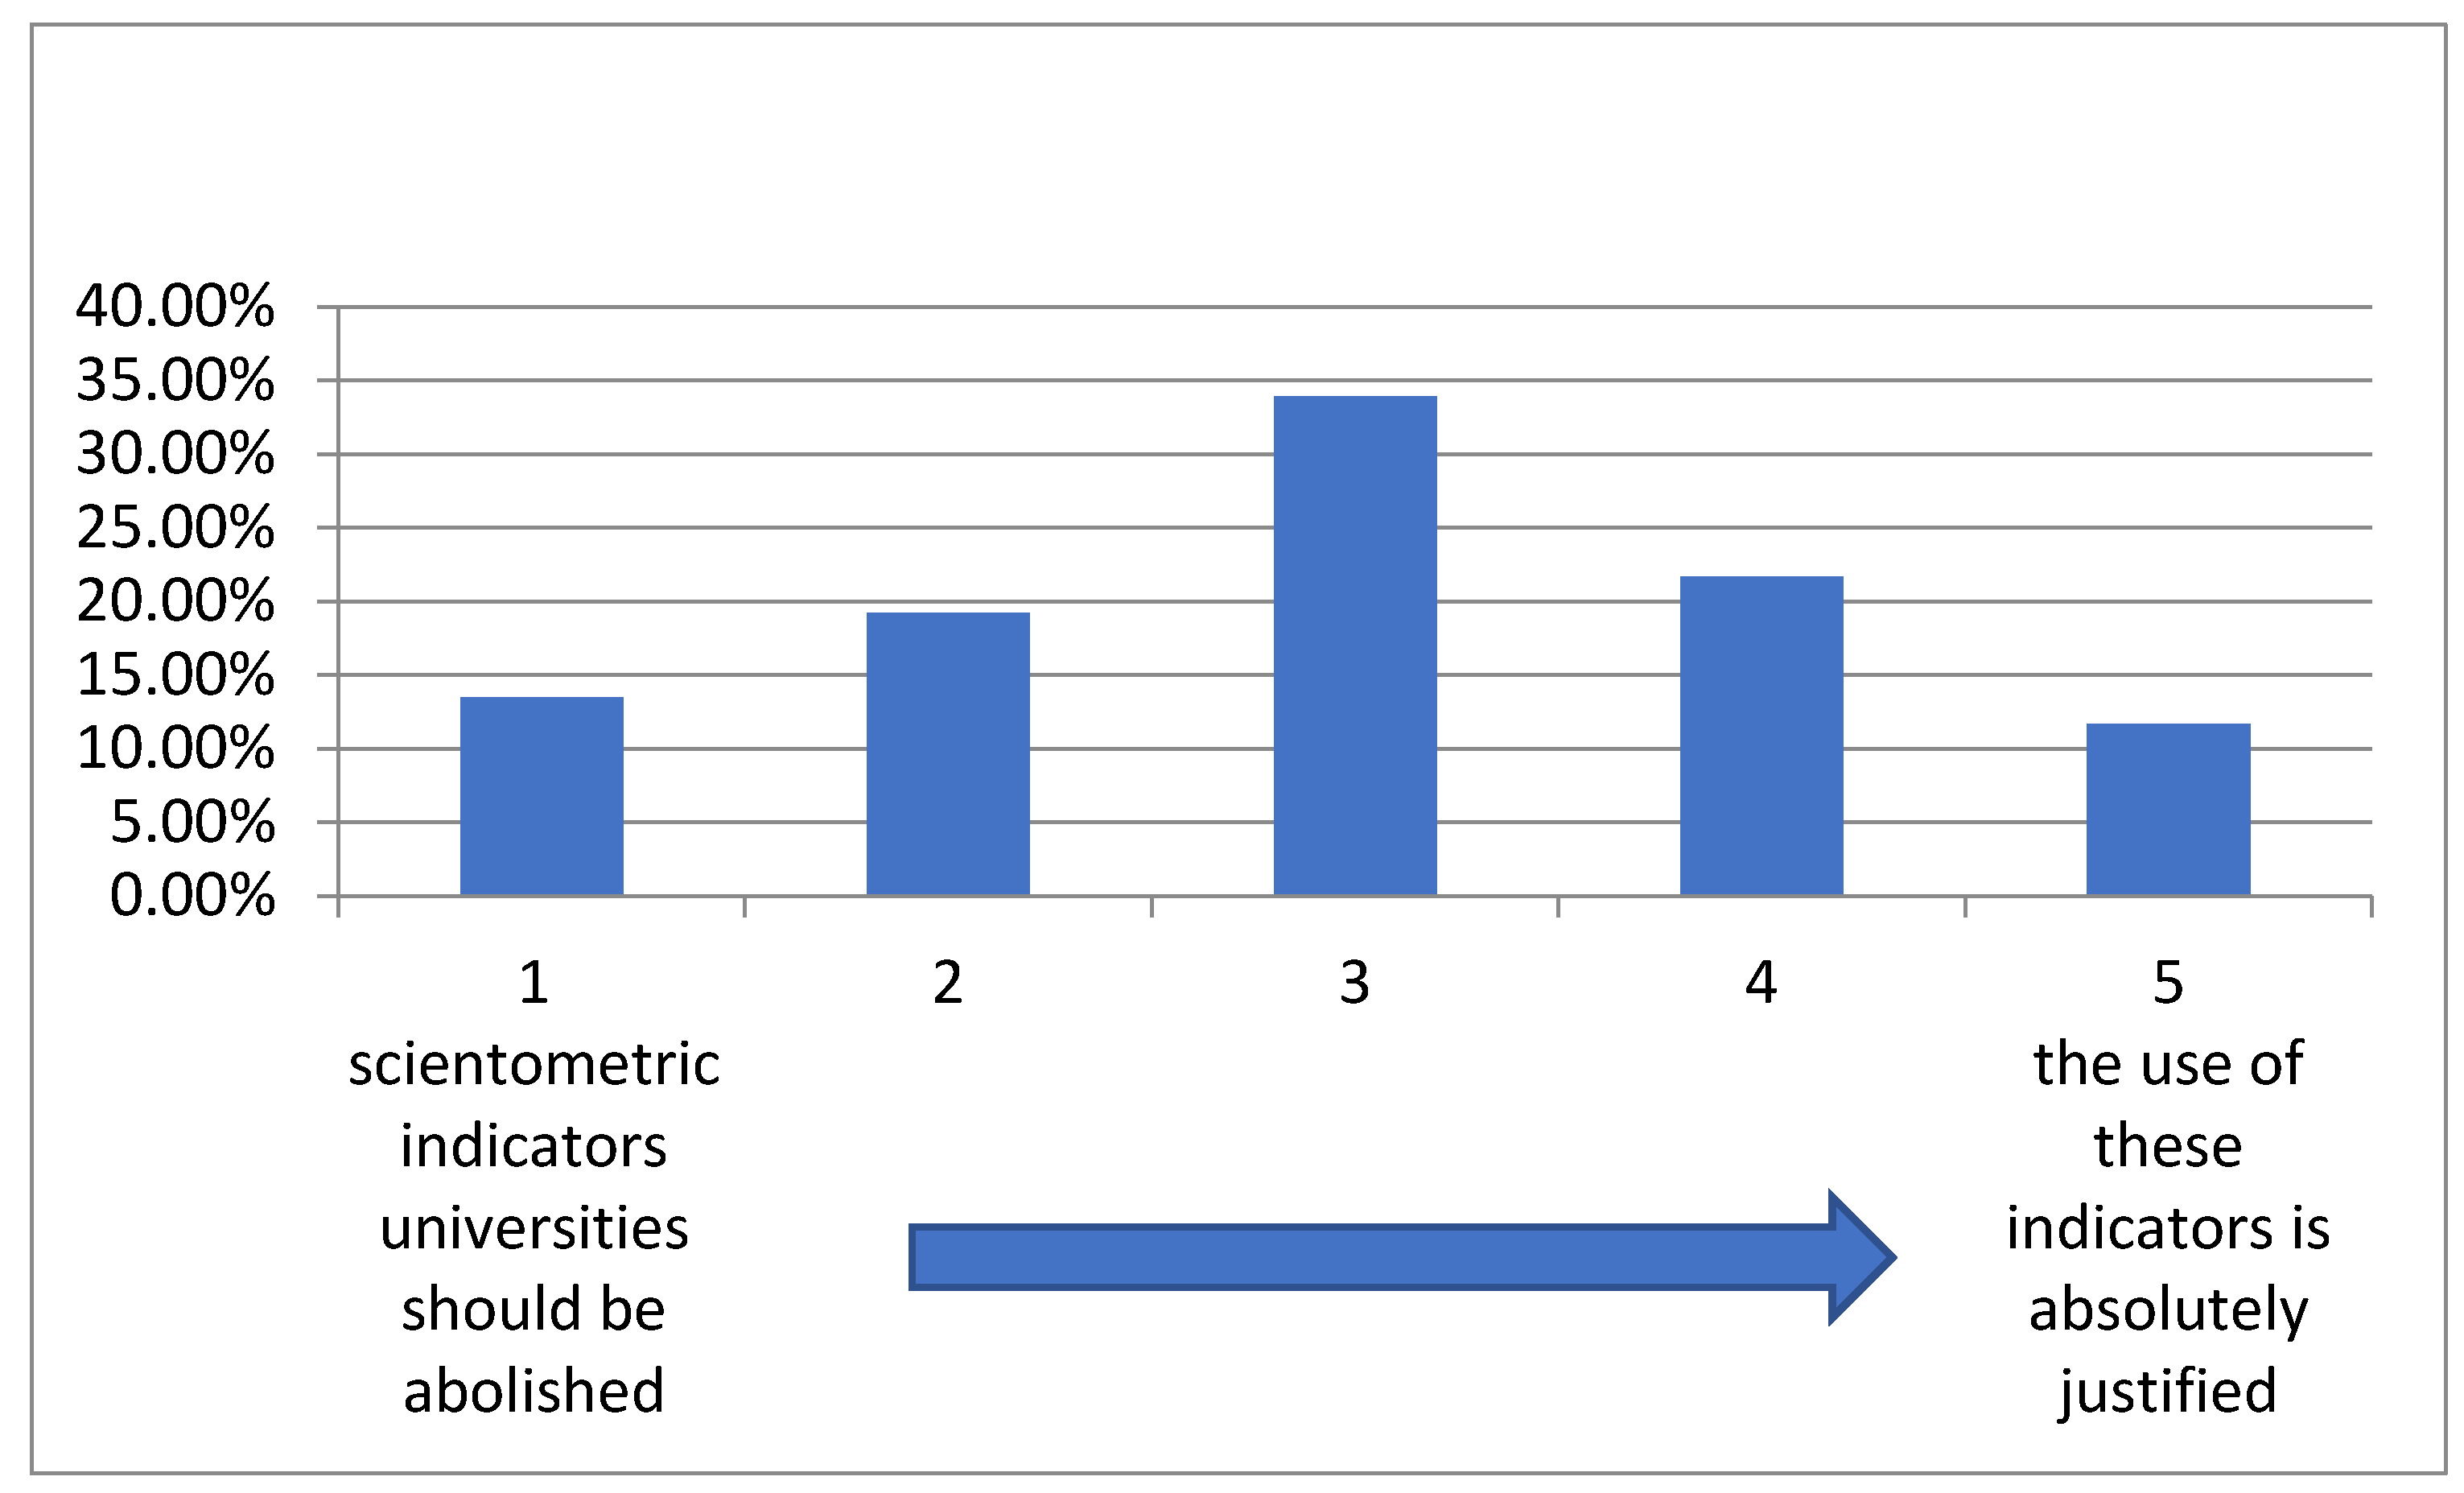
At the end of the general survey, respondents were asked to evaluate the attitude toward using scientometric indicators in universities on a scale from negative to positive in the range from 1 to 5. The results are as follows: 1: 13.5%, 2: 19.2%, 3: 33.9%, 4: 21.7%, 5: 11.7%. Summing up the negative and positive responses, we get 32.7% and 33.4%, which indicates that the number of respondents who are sympathetic to using scientometric indicators is only 0.7% higher than the number of opponents of this practice. This information is presented in Figure 1.
After reviewing the overall indicators and figures, let us get a little more detailed picture and analyze the answers to the main questions in the questionnaire in terms of gender, age, department, and job affiliation. The data obtained during the respondents’ responses show that women are better acquainted with scientometrics than men. For example, almost 63% of women and only 45% of men know this discipline very well; 30.1% and 41% have vague ideas, respectively, and 7% of women and 14% of men are not familiar with scientometrics at all. This ratio in favor of the fair sex can be explained by the greater responsibility inherent in women (this quality is developed by generations of women, who bear the main concern for the welfare of their offspring). At the same time, the greater responsibility and awareness of women affected the answers to other questions in our questionnaire. Although in general, a neutral attitude to scientometrics prevails in almost equal proportions between women (55.9%) and men (58.1%), simultaneously, a significant share of women (32.2%) perceive this discipline positively, which is not true for men (only 21.7%), and also, the number of men, who have a negative attitude to scientometrics (20.2%) is almost double that of women (11.9%). In addition, women are more familiar with bibliometric databases and with the h-index, and they know the value of this index better in their author profile in the RSCI, but slightly worse than men in the WoS and Scopus database. Women are also more attentive to the dynamics of their scientometric indicators in bibliometric databases: 27.3% carry out constant monitoring (men—only 14.7%). Moreover, if the opinion of both sexes mostly coincides in assessing the control of the university administration over scientometric indicators, there are clear discrepancies in the responses to the question about incentives for high scientific achievements (for example, 41.3% of women and only 21.75% of men noted the presence of incentives at the end of the academic year). Some, but not critical, variation between the sexes is observed in responses to the question about sanctions used to stimulate scientometric indicators. Finally, as expected, the proportion of women positively evaluating using scientometric indicators in universities (36.5%) exceeds the share of those who negatively perceive such practices (26.4%); among men, the proportion is quite different: 40.6% of them think negatively about using scientometric indicators, and only 29.4% approve of their implementation.
Age also has a certain impact on the perception of scientometrics and its main parameters. For example, people of middle age (34–50 years) know best what scientometrics is—66.3%, and only 1.8% of them do not have any idea about it; older people (over 50 years old) have slightly worse knowledge, while the weakest indicators are among young people: only 39.4% of them are well versed in scientometrics, and 18.3% know almost nothing about it. Of respondents, middle-aged people have a positive attitude to scientometrics—34.6% of respondents (only 8.8% have a negative attitude, while the figure for young people is twice as high—16.3%). Again, primarily middle-aged people demonstrate knowledge of bibliometric databases (RSCI, WoS, and Scopus)—77.9% of respondents; awareness is slightly worse among the elderly—62.1%, and young people are noticeably weaker in orientation in the databases—48.1%. In answer to the question: “Do you know what the ‘h-index’ is?” the leaders are again middle-aged people with 88.5% positive responses; but the ignorance of this index was shown primarily by the elderly—15% of them do not have any idea about it; among the youth, only 4.8% have no idea. At the same time, all three age categories show poor knowledge of the h-index value in their author’s profile in various bibliometric databases. However, even here, representatives of the middle generation are ahead—only 22.8% do not know the value of their h-index in the RSCI, while the share of young people who do not have an idea about it reaches 40% and the elderly—35.8%. Even worse is the situation with the personal Hirsch index in foreign databases: among young people, 71.4% do not know their figure in WoS, among the middle-aged—about half (50.9%), and among the elderly—61.2%. In light of what has already been said, the answers to the question, “Do you keep track of your scientometric indicators in the main bibliographic databases?” were fairly predictable. Among young people, only 17.3% of respondents constantly carry out such monitoring, and 37.5% are never interested in it; among middle-aged people, figures were 26.6% and 10.6%, respectively, and among the elderly—16.7% and 25.8%. Here it can repeat what was already mentioned above: young people, due to natural causes, usually have nothing or almost nothing to track in bibliometric databases. However, the number of young people who have a negative attitude toward using scientometric parameters in universities is only slightly higher than the number of supporters (a ratio of 27.1% and 25.5%), but among the elderly, the number of opponents of using scientometric indicators is almost 2 times higher—52.4%. Obviously, the more conservative older generation is skeptical of scientometric innovations, and therefore, there are half as many supporters of scientometric standards among them—25.3%. In contrast, among the middle age group, the number of adherents of scientometric parameters is 43%, while the number of opponents is only 21%, i.e., a mirror ratio compared to the older generation.
There was a definite surprise with the questionnaire analysis regarding the criterion of humanities folk/technicians. Thus, it turned out that scholars in the humanities are relatively better at knowing what scientometrics is than representatives of technical and general scientific specialties: 59.6% against 50%, while on the other hand, 14.8% of technicians and only 5.6% of humanities folk do not know anything about this discipline. Moreover, if the number of both who have a negative attitude toward scientometrics is approximately the same (15.5% and 17%), then for scholars in the humanities, who have a positive attitude toward scientometrics (32.6%) significantly exceeds the share of techies (21.1%). The weaker interest of representatives of natural and technical disciplines in scientometrics may be since they are used to collective scientific work, which brings equal scientometric bonuses to all participants of the project and, therefore, does not stimulate interest in evaluating personal scientific contributions. Some techies, for example, at ITMO University, work in other firms (often with higher earnings) in parallel with their work at the university, and therefore, the data of scientometrics is not critical for their career and material prosperity. However, when answering other questions in the questionnaire, the differences between humanities folk and technicians are generally insignificant. As our study shows, scholars in the humanities are twice as aware of their data in the RSCI and more often monitor their indicators in the main BDB. Again, on the issue of using scientometric indicators in universities, there is a discrepancy in the views of humanities folk and techies: if only 27.5% of scholars in the humanities perceive introducing metrics negatively, then 36.5% of techies do, and, conversely, 40.1% of humanities folk and 29% of techies welcome introducing scientometric indicators.
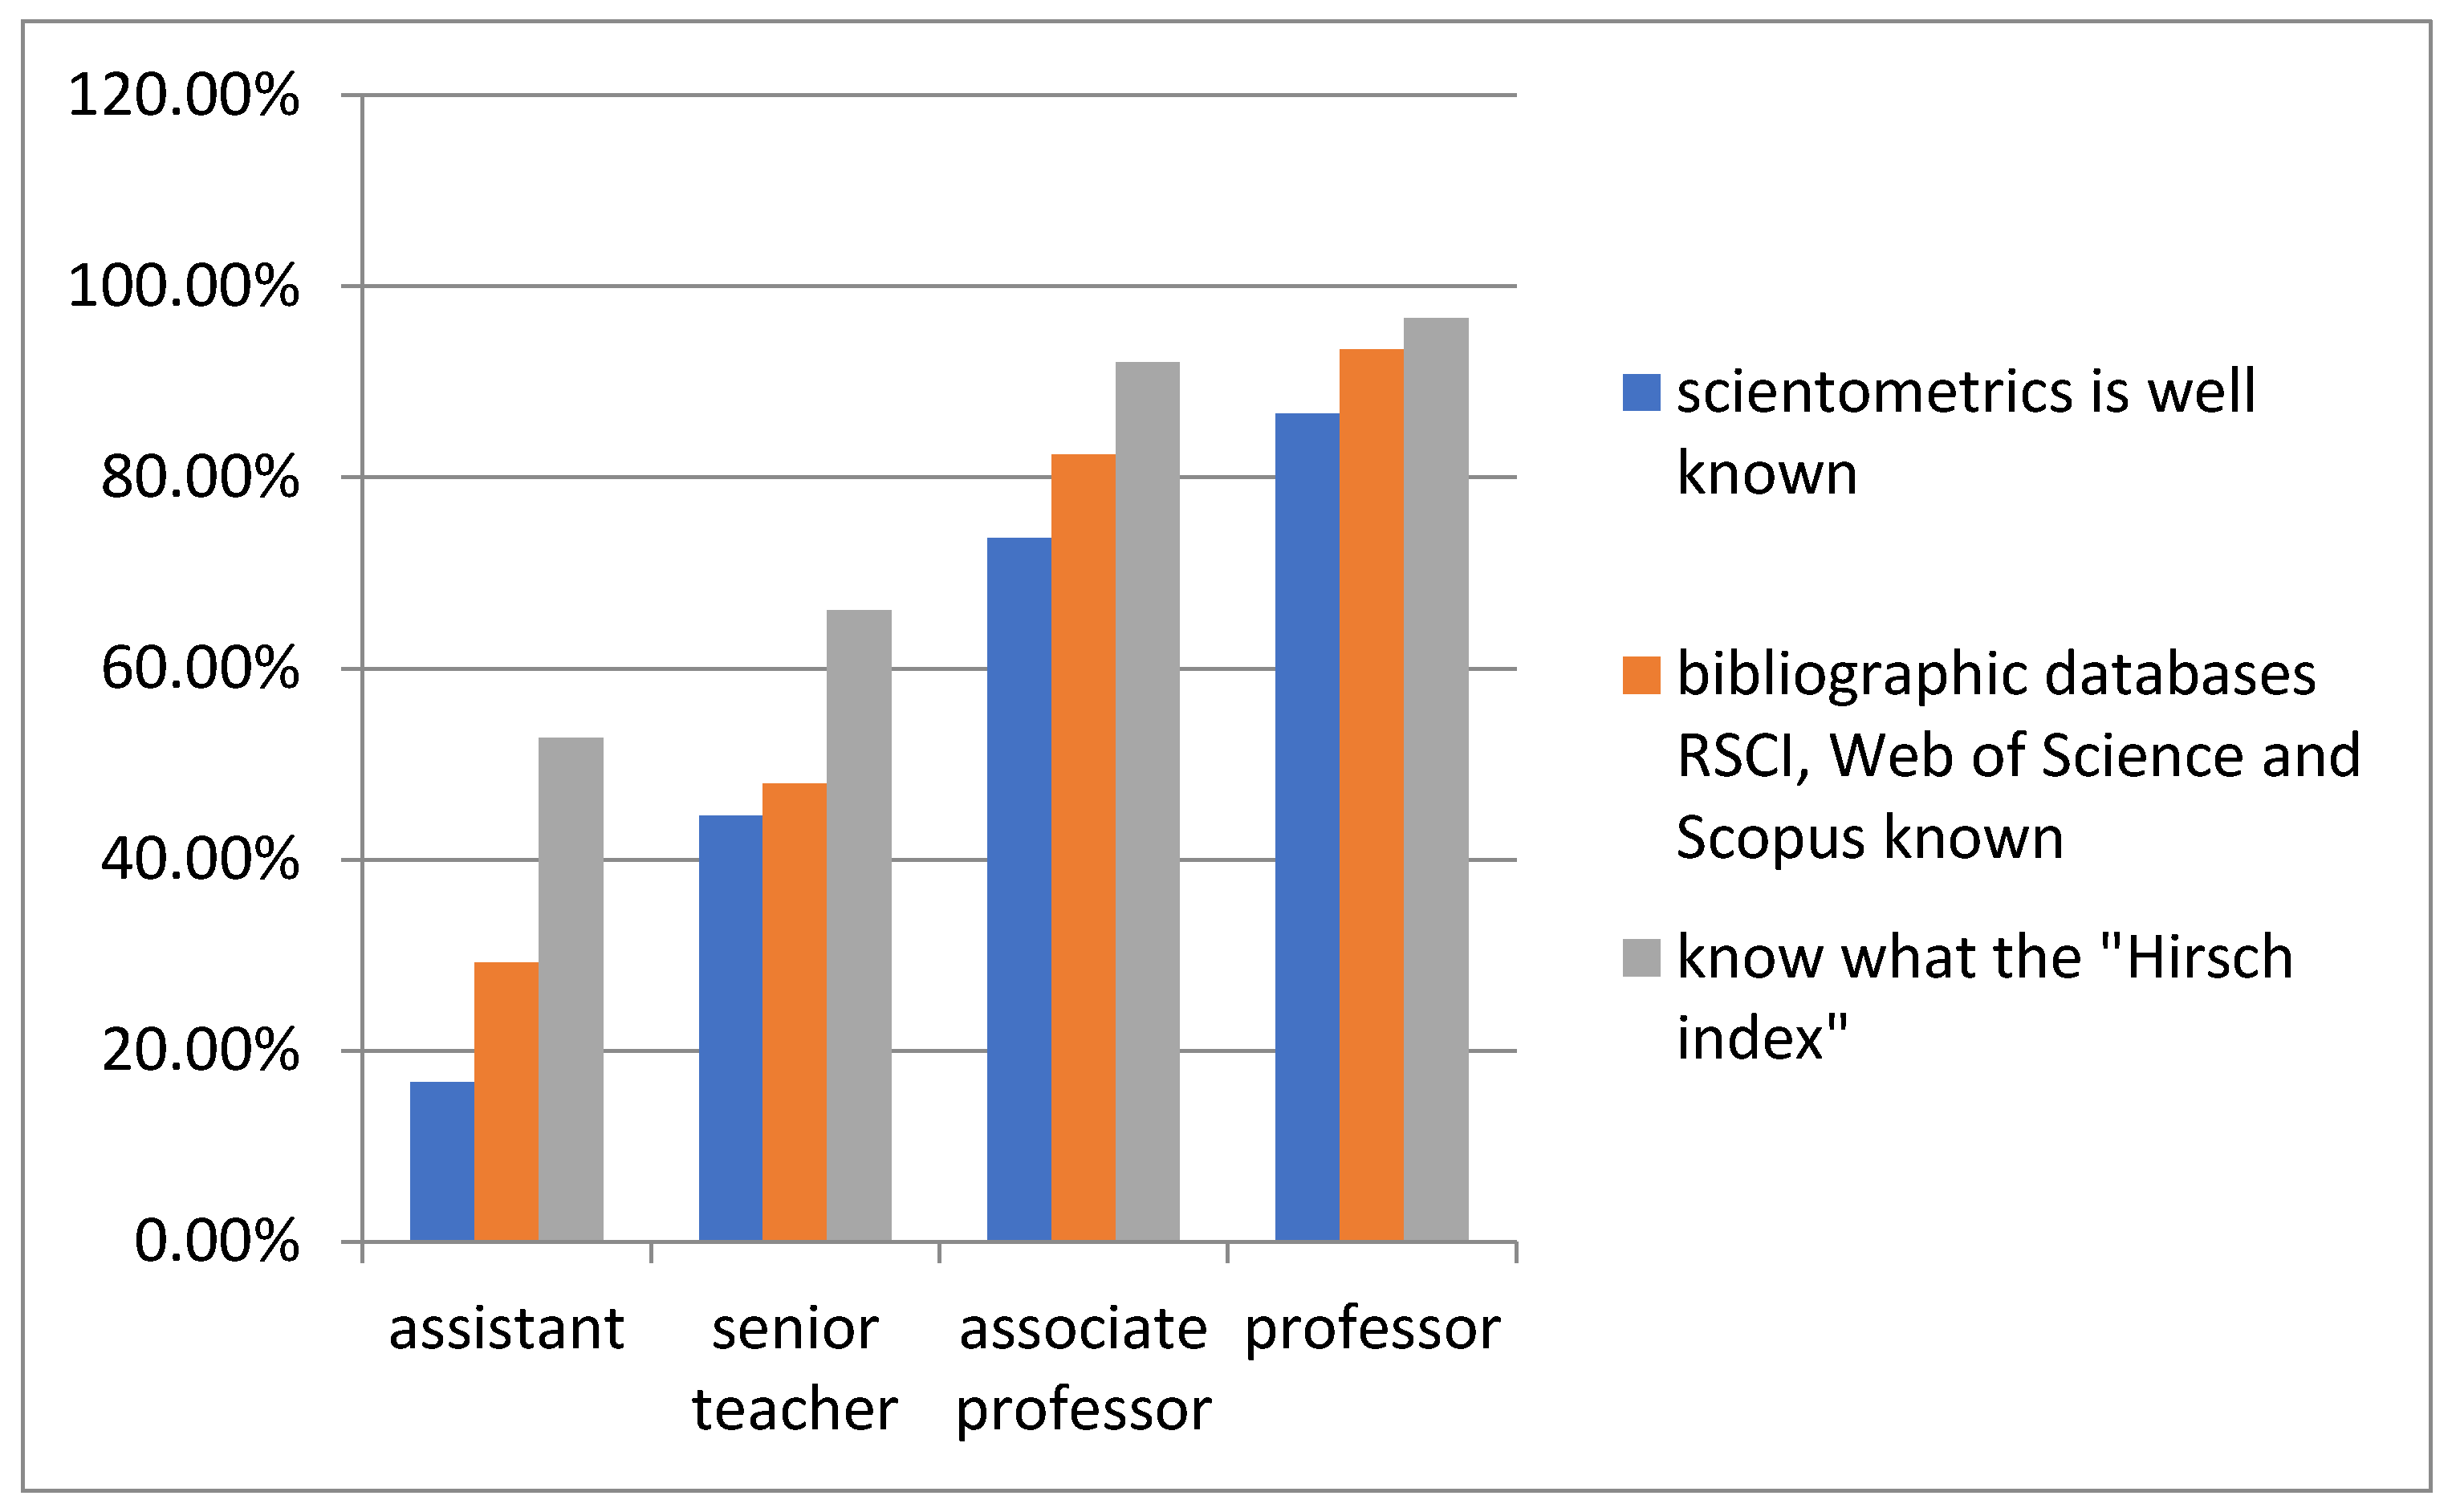
Now let us look at the main questions of our questionnaire through the prism of answers from people who are at different levels of the professional and official hierarchy. As a result of analyzing the answers to the question about scientometrics and familiarity with the name of the discipline, a linear pattern emerges: the higher the position and scholarly qualification, the more complete the knowledge. Hence, if only 16.7% of assistants know what scientometrics is, and 30.6% do not have the slightest idea about it, while among professors, the corresponding figures are 86.7% and 0%. In this regard, the attitude toward scientometrics is also very revealing: among university employees of lower categories (assistants, senior teachers), the negative perception of the discipline is clearly predominant—22.2% against 13.9%, and 14.3% of the responses in which scientometrics was evaluated from a positive point of view. Associate professors, by contrast, have a positive perception of scientometrics (36%), and only 8.8% of them have a negative attitude toward it. It is even better perceived by professors (43.3%), though there are many people who have a negative attitude to scientometrics—20% (a figure close to the indicators of assistants and senior teachers). The opposition to scientometrics on the part of lower categories of university employees has explained above—these usually are young people who do not have a significant number of publications and citations and, therefore, are not worthy of scientometric attention. On the other hand, professors and associate professors usually have sufficient symbolic “capital” in the form of publications and citations. This thesis is confirmed by the answers about the respondents’ knowledge of bibliometric databases: 29.2% of assistants, 48% of senior teachers, 82.4% of associate professors and 93.4% of professors know all the databases. A similar linear progression is built when answering the question about h-index knowledge (52.8% of assistants and 96.7% of professors are familiar with it). A similar result is observed when answering other questions. Only sometimes do associate professors begin to challenge the palm of superiority (from professors), in particular, when answering the question, “Do you keep track of your scientometric indicators in the main bibliographic databases?” 32% of associate professors admitted to constant monitoring of their scientometric data, while professors gave only 23.3% such answers. At the same time, according to the opinion of a significant share of assistants (20.8%) and senior teachers (28.6%), the university administration ignores scientometric indicators, which confirms the above hypothesis about the relationship of age/position (youth/low status) with the denial of the remuneration system for high scientometric indicators. It is characteristic that only 4.8% of associate professors deny such a system in their universities, and as for professors, there was not a single one who would say that the university administration ignores scientometric data. It is not surprising that 37.3% of assistant professors and 42% of senior teachers do not approve of using scientometric indicators in universities (24.2% and 22%, respectively, have the opposite view), while associate professors are clear supporters of using scientometric data: 51.2% (against only 24%). However, most professors negatively affect metrics (46.7%; only 36.6% have a positive attitude). It may be due to a certain conservatism inherent in older people or a deeper understanding of the shortcomings and formalism of scientometrics criteria. More detailed information on these issues is presented in Figure 2.
Finally, we need to consider the attitude toward scientometrics and its indicators in terms of the respondents’ capital/regional affiliation. It is hardly appropriate to analyze in detail the main answers of teachers of St. Petersburg and provincial universities since the latter is superior in all parameters. Thus, among representatives of universities in the northern capital, only 44.4% know what scientometrics is, while among their provincial colleagues, this figure reaches 64%; all three bibliometric databases are well-known by 55.6% of St. Petersburg respondents and 70% of teachers at provincial universities. At the same time, residents of St. Petersburg evaluate scientometrics mostly negatively—39.2% of negative reviews against 29.3% of positive ones, while in the provinces, the opposite picture is observed (27.4% and 36.8%). These figures can be explained by the fact that teachers in provincial universities want to make a better impression and protect themselves from the displeasure of their superiors. On the other hand, the most depressing indicators among St. Petersburg teachers were given by employees of the Herzen State Pedagogical University, which was selected as a control institution not included in the 5-100 Program. For example, out of 30 respondents from this university, only 3 people know well what scientometrics is, and the rest either have a vague idea of what it is (16) or do not know at all (9); again, only three respondents know all three bibliometric databases, etc. This indicates that scientometrics and its data have not yet been adequately applied in ordinary Russian universities, in contrast to a limited number of leading universities in the country.
5. Discussion
The research conducted has shown that among the teachers of the leading Russian universities, the vast majority have more or less clear ideas about scientometrics. In general, respondents have a relatively positive perception of this discipline and do not object to using its indicators. This shows that in just a few years, the representatives of the teaching corps have managed to adapt to the requirements of the university and ministerial administrations. The survey revealed two statistical patterns: the better teachers know scientometrics, the better they feel about it, and vice versa; the younger the respondent and lower their position, the more negatively they feel about scientometrics and the less they know about its parameters. At the same time, the fact of a better attitude toward scientometrics and knowledge of scientometric standards and their monitoring by representatives of the humanities, in contrast to natural and technical disciplines, turned out to be surprising. Similarly, but even more clearly, the teachers of provincial universities are superior in all respects to their colleagues from St. Petersburg. This was probably due in some way to the inclusion of data from the Herzen State Pedagogical University of Russia—which was selected as a control organization that was not included in the 5-100 Program—in the general sample of St. Petersburg universities. As expected, scientometric indicators at HSPU play a secondary role, and the knowledge of its teachers about scientometrics is significantly inferior to the knowledge of representatives of leading universities included in the government program.
Summing up the results of our research, we should say that we are only at the very beginning of the road, and in the future, we need more extensive mass surveys and in-depth interviews, as well as a comparison of Russian data with similar data from foreign colleagues for a comprehensive illumination of the chosen topic
Author Contributions
Conceptualization, A.V.G. and D.S.B.; methodology, A.V.G. and V.V.L.; validation, A.V.G. and V.V.L., formal analysis, D.S.B. and V.V.L.; investigation, V.V.L. and D.S.B.; data curation, A.V.G. and V.V.L.; writing—original draft preparation, A.V.G., D.S.B. and V.V.L.; writing—review and editing, A.V.G. All authors have read and agreed to the published version of the manuscript.
Funding
This research received no external funding.
Data Availability Statement
Research data can be provided by the authors upon request.
Acknowledgments
The authors wish to thank Richard L. Bland (University of Oregon, USA) for his excellent translation of the manuscript of this article.
Conflicts of Interest
The authors declare no conflict of interest.
Appendix A

Table A1.
Survey form and results.
| The Questionnaire is Anonymous, But We Would Like to Know Which University You Are from | Answers |
|---|---|
| Branch of scientific knowledge | Natural sciences: 27.2% Humanitarian sciences: 49.8% Technical science: 23% |
| Do you know what “scientometrics” is? | Yes, I know very well: 54.8% I vaguely imagine: 35% I do not know at all: 10.2% |
| When did you first learn (hear) the word (term) “scientometrics”? | Just now: 14.5% Until 2012: 18.7% In 2012–2013: 11.7% In 2014–2015: 19.8% In 2016–2017: 19.4% In 2018–2019: 15.9% |
| Your attitude to scientometrics | Positive: 26.9% Neutral: 56.9% Negative: 16.2% |
| Do you know such bibliographic databases as RSCI, Web of Science and Scopus? | No, I do not know: 3.2% Something familiar, but no clear ideas: 17% I only know well the RSCI: 14.1% I know all three bases well: 63.3% Other: 2.4% |
| Do you know what the “Hirsch index” is? | Yes: 77.4% Very approximate: 17% Not: 5.6% |
| Do you know your Hirsch index in the RSCI database? (please mark “no” or write a number) | Not: 32.5% Other: 67.5% |
| Do you know your Hirsch index in the Web of Science database? (please mark “no” or write a number) | Not: 61.5% Other: 38.5% |
| Do you know your Hirsch index in the Scopus database? (please mark “no” or write a number) | Not 56.2% Other: 43.8% |
| Do you know what the impact factor of a journal and its quartile are? | First time I hear these terms: 11.3% Somewhere they have already met me: 29.7% I know both terms very well and understand their meaning: 55.1% Other: 3.9% |
| Do you follow your scientometric indicators in the main bibliographic databases? | Yes, I constantly follow 20.9% Occasionally 55.1% Never: 24% |
| How does managing your university relate to scientometric indicators? | It ignores them: 14.8% The university administration pays some attention to scientometric indicators: 44.2% Regularly monitors the scientometric indicators of teachers: 41% |
| Are there any rewards in your university for high scientometric indicators? | Yes, there is at the end of the academic year and upon recertification: 31.4% No at all: 21.9% Sometimes such indicators are used: 46.7% |
| What specific sanctions are being applied to stimulate increased scientometric indicators at your university? | No special sanctions are provided: 28.3% Bonuses are paid for publications indexed in the WoS and/or Scopus databases: 28.6% I find it difficult to answer: 3.2% There is a relationship between scientometric indicators and wages: 19.8% Other: 20.1% |
| Assess your attitude to using scientometric indicators in universities | 1: 13.5% 2: 19.2% 3: 33.9% 4: 21.7% 5: 11.7% |
| Gender | Male: 45.6% Female: 50.5% Other: 0.4% I do not want to report: 3.5% |
| Your age | up to 34 years old 36.7% 35–49 years old: 39.9% Over 50: 23.4% |
| Nationality | Russian (th): 96.5% Other: 3.5% |
| Position held | Assistant: 25.4% Senior lecturer: 19.8% Assistant professor: 44.2% Professor: 10.6% |
Table A2.
Data on the main universities studied.
| University, Full and Abbreviated Name | Year of Foundation | Number of Teachers | Number of Students | The main Scientific Specialties of the Respondents | Percentage of Faculty with PhD Degree | Place in the QS World University Rankings |
|---|---|---|---|---|---|---|
| Peter the Great St. Petersburg Polytechnic University (SPbPU) | 1899 | 1945 | 33,000 | Energy, physics, biochemistry, philosophy, sociology, linguistics | 75.5 | 401 |
| ITMO University (ITMO) | 1900 | 1300 | 13,400 | Programming, it, economics, philosophy | 74.5 | 360 |
| Ural Federal University was named after the first President of Russia B.N. Yeltsin (URFU) | 1920 | 3900 | 36,200 | Computer science, economics, physics | 73.1 | 331 |
| The Herzen State Pedagogical University of Russia (Herzen University) | 1797 | 1400 | 18,000 | Geography, cultural studies, music, economics | 74.9 | - |
| St Petersburg University, Saint Petersburg State Universit (SPbU) | 1724 | 6000 | 30,000 | Economics, philosophy, history, earth sciences | 76.2 | 225 |
| Tomsk State University (TSU) | 1878 | 3500 | 23,000 | Mathematics, computational mechanics, history, linguistics | 75.4 | 250 |
| University of Tyumen (UTMN) | 1930 | 1800 | 27,000 | Anatomy, geography, political science, bioinformatics, economics | 74.9 | - |
References
- Kramsch, C. The Political Power of the Algorithm. Technol. Lang. 2020, 1, 45–48. [Google Scholar] [CrossRef]
- Garfield, E. Citation Indexes for Science: A New Dimension in Documentation through Association of Ideas. Science 1955, 122, 108–111. [Google Scholar] [CrossRef] [PubMed]
- Garfield, E.; Sher, I.H. New Factors in the Evaluation of Scientific Literature, Through Citation Indexing. Am. Doc. 1963, 14, 195–201. [Google Scholar] [CrossRef]
- Glänzel, W.; Moed, H.F.; Schmoch, U.; Thelwall, M. (Eds.) Springer Handbook of Science and Technology Indicators; Springer Nature: Cham, Switzerland, 2019. [Google Scholar]
- Kolasa, W. Specific Character of Citations in Historiography (Using the Example of Polish History). Scientometrics 2012, 90, 905–923. [Google Scholar] [CrossRef] [PubMed] [Green Version]
- Fejes, A.; Nylander, E. The economy of publications and citations in educational research: What about the “Anglophone bias”? Res. Educ. 2017, 99, 19–30. [Google Scholar] [CrossRef] [Green Version]
- Mingers, J.; Leydesdorff, L. A review of theory and practice in scientometrics. Eur. J. Oper. Res. 2015, 246, 1–19. [Google Scholar] [CrossRef] [Green Version]
- Waltman, L.; van Eck, N.J. Field-normalized Citation Impact Indicators and the Choice of an Appropriate Counting Method. J. Informetr. 2015, 9, 872–894. [Google Scholar] [CrossRef] [Green Version]
- Gureev, V.N.; Mazov, N.A.; Il’ichëv, A.A. Career Path of Researchers in Relation to Public Ethics. Her. Acad. Sci. 2019, 89, 270–278. [Google Scholar]
- Polyanin, A.D. Disadvantages of the Citation and Hirsch Indices. Maximum Citation Indices. Math. Model. Numer. Methods 2014, 1, 131–144. [Google Scholar]
- Garfield, E. Is it Possible to Identify and Evaluate Scientific Achievements and Scientific productivity? Her. Acad. Sci. 1982, 7, 42–50. [Google Scholar]
- Seeber, M.; Meoli, M.; Malighetti, P. Self-citations as strategic response to the use of metrics for career decisions. Res. Policy 2019, 48, 478–491. [Google Scholar] [CrossRef]
- Fowler, J.H.; Aksnes, D.W. Does Self-Citation Pay? Scientometrics 2007, 72, 427–437. [Google Scholar] [CrossRef]
- King, M.M.; Bergstrom, C.T.; Correll, S.J.; Jacque, J.; West, J.D. Men Set Their Own Cites High: Gender and Self-citation across Fields and over Time. Socius Sociol. Res. A Dyn. World 2017, 3, 1–22. [Google Scholar] [CrossRef] [Green Version]
- González-Pereira, B.; Guerrero-Bote, V.P.; Moya-Anegó, F. A New Approach to the Metric of Journals’ Scientific Prestige: The SJR Indicator. J. Informetr. 2010, 4, 379–391. [Google Scholar] [CrossRef]
- Hirsch, J.E. An Index to Quantify an Individual’s Scientific Research Output. Proc. Natl. Acad. Sci. USA 2005, 102, 16569–16572. [Google Scholar] [CrossRef] [PubMed] [Green Version]
- Grinäv, A.V. The Disadvantages of Using Scientometric Indicators in the Digital Age. IOP Conf. Ser. Mater. Sci. Eng. 2020, 940, 012149. [Google Scholar] [CrossRef]
- Pol’din, O.V.; Matveeva, N.N.; Sterligov, I.A.; Yudkevich, M.M. The Publication Activity of Universities: Effect of the Project “5-100”. Quest. Educ. 2017, 2, 10–33. [Google Scholar]
- Mokhnacheva, Y.V.; Tsvetkova, V.A. Russia in the World Massif of Scientific Publications. Her. Acad. Sci. 2019, 89, 820–830. [Google Scholar]
- Shoaib, S.; Mujtaba, B. Perverse Incentives and Peccable Behavior in Professionals—A Qualitative Study of the Faculty. Public Organ. Rev. 2018, 18, 441–459. [Google Scholar] [CrossRef]
- Tian, M.; Su, Y.; Ru, X. Perish or Publish in China: Pressures on Young Chinese Scholars to Publish in Internationally Indexed Journals. Publications 2016, 4, 9. [Google Scholar] [CrossRef] [Green Version]
- Bagues, M.; Sylos-Labini, M.; Zinovyeva, N. A Walk on the Wild Side: ‘Predatory’ Journals and Information Asymmetries in Scientific Evaluations. Res. Policy 2017, 48, 462–477. [Google Scholar] [CrossRef] [Green Version]
- Artemenko, N.A. The Scientific Expediency of an Expert Assessment of a Scholar’s Work Efficiency: In Search of a Lost Meaning. Scientific publication of the international level. In Proceedings of the Materials of the 5th International Scientific-Practical Conference, Yekaterinburg, Russia, 17–20 May 2016; pp. 63–73. [Google Scholar]
- Hargens, L.L.; Schuman, H. Citation counts and social comparisons: Scientists’ use and evaluation of citation index data. Soc. Sci. Res. 1990, 19, 205–221. [Google Scholar] [CrossRef] [Green Version]
- Buela-Casal, G.; Zych, I. What do the scientists think about the impact factor? Scientometrics 2012, 92, 281–292. [Google Scholar] [CrossRef]
- Hammarfelt, B.; Haddow, G. Conflicting Measures and Values: How Humanities Scholars in Australia and Sweden Use and React to Bibliometric Indicators. J. Assoc. Inf. Technol. 2018, 69, 924–935. [Google Scholar] [CrossRef]
- Filippov, I.S. How Scholars of Humanities Profile Evaluate Scientometrics. SIB Hist. Res. 2016, 3, 6–27. [Google Scholar]
Figure 1.
Attitude of respondents to the use of scientometric indicators in the university.

Figure 2.
Differentiation of awareness of scientometric indicators depending on the position held at the university.
Figure 2.
Differentiation of awareness of scientometric indicators depending on the position held at the university.

Publisher’s Note: MDPI stays neutral with regard to jurisdictional claims in published maps and institutional affiliations. |
© 2021 by the authors. Licensee MDPI, Basel, Switzerland. This article is an open access article distributed under the terms and conditions of the Creative Commons Attribution (CC BY) license (https://creativecommons.org/licenses/by/4.0/).
Share and Cite
MDPI and ACS Style
Grinëv, A.V.; Bylieva, D.S.; Lobatyuk, V.V. Russian University Teachers’ Perceptions of Scientometrics. Publications 2021, 9, 22. https://0-doi-org.brum.beds.ac.uk/10.3390/publications9020022
AMA Style
Grinëv AV, Bylieva DS, Lobatyuk VV. Russian University Teachers’ Perceptions of Scientometrics. Publications. 2021; 9(2):22. https://0-doi-org.brum.beds.ac.uk/10.3390/publications9020022
Chicago/Turabian StyleGrinëv, Andrei V., Daria S. Bylieva, and Victoria V. Lobatyuk. 2021. "Russian University Teachers’ Perceptions of Scientometrics" Publications 9, no. 2: 22. https://0-doi-org.brum.beds.ac.uk/10.3390/publications9020022
Note that from the first issue of 2016, this journal uses article numbers instead of page numbers. See further details here.