
Health- or Environment-Focused Text Messages as a Potential Strategy to Increase Plant-Based Eating among Young Adults: An Exploratory Study


Abstract
:1. Introduction
1.1. Health and Environmental Effects of Plant-Based Diets
1.2. Facilitators and Barriers to Adoption of Plant-Based Diets
1.3. Text-Message Intervention as a Tool for Nutrition/Health Behavior Change
2. Theoretical Framework
The Current Study
3. Methodology
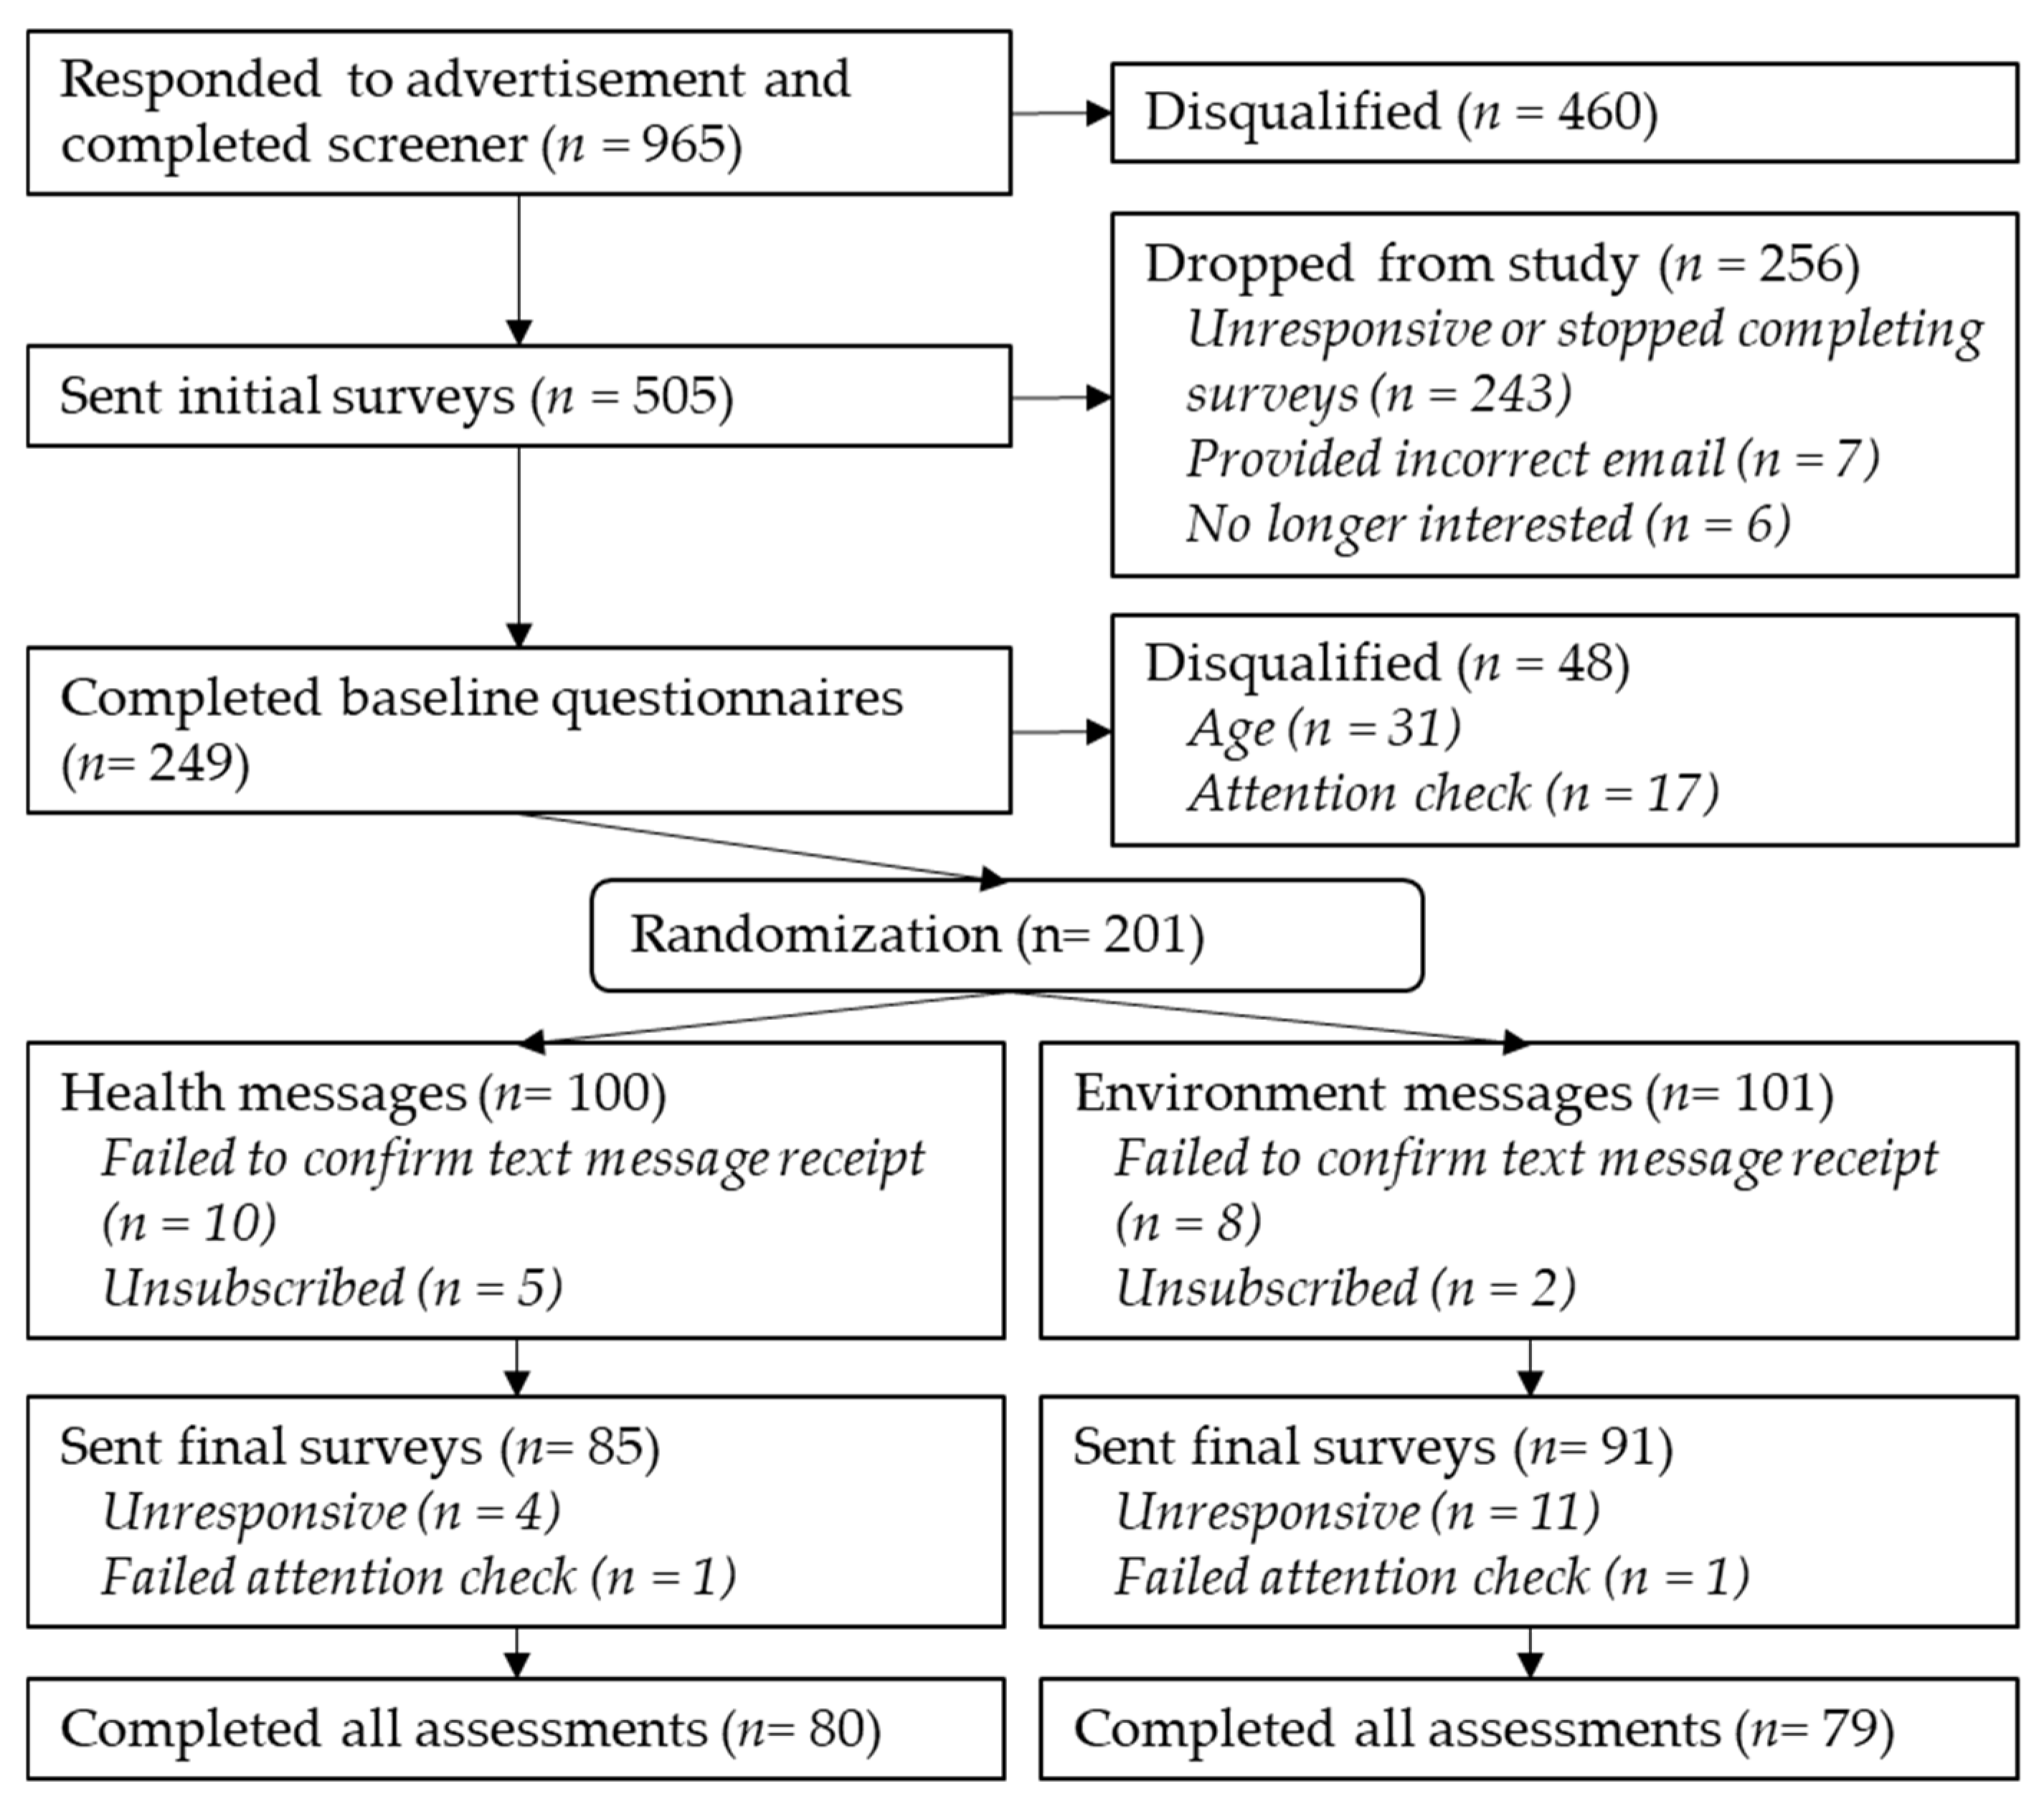
3.1. Participants
3.2. Survey Instruments
3.2.1. Dietary Assessment
3.2.2. Study Questionnaire
3.3. Text Message Intervention
3.4. Statistical Analysis
4. Results
4.1. Effect of SMS on Predictor Variables and Dietary Outcomes
4.2. Relationships among Predictor and Outcome Variables
4.2.1. Relationships among Baseline Values and Other Predictor Variables
4.2.2. Relationships among Dietary Intentions and Predictor Variables
4.2.3. Relationships among Actual Intake and Predictor Variables
5. Discussion
5.1. Implications for Plant Protein
5.2. Implications for Animal Protein
5.3. Health vs. Environmental Messaging
5.4. Limitations, Strengths and Future Directions
6. Conclusions
Author Contributions
Funding
Institutional Review Board Statement
Informed Consent Statement
Data Availability Statement
Acknowledgments
Conflicts of Interest
Appendix A

| Constructs | Example Item | Cronbach’s α |
|---|---|---|
| Food consumption intention (Adapted from [52]) | Q1 On a scale of 0% to 100%, how likely is it that you will regularly eat plant-based protein sources over the next month? Q2 On a scale of 0% to 100%, how likely is it that you will regularly eat animal-based protein sources over the next month? Q3 On a scale of 0% to 100%, how likely is it that you will regularly eat fruits and vegetables over the next month? | NA |
| Green consumer values (Adapted from [53]) | Q1 It is important to me that the products I use do not harm the environment. Q2 I consider the potential environmental impact of my actions when making many of my decisions. Q3 My purchase habits are affected by my concern for our environment. Q4 I am concerned about wasting the resources of our planet. Q5 I would describe myself as environmentally responsible. Q6 I am willing to be inconvenienced in order to take actions that are more environmentally friendly. | 0.904 |
| Health values (Adapted from [53]) | Q1 Having good health means a lot to me. Q2 I often think about my health. Q3 I think of myself as a person who is interested in healthful foods. Q4 I consider the potential health impact of my actions when making many of my decisions. Q5 My purchase habits are affected by my concern for my health. Q6 I would describe myself as health conscious. Q7 I am willing to be inconvenienced in order to take actions that are better for my health. | 0.887 |
| Perceived benefits: Health (Adapted from [34,35]) | Q1 Shifting my current diet to more plant-based foods is good for my overall health. Q2 Eating less animal-based foods will help reduce my chances of heart disease or cancer. Q3 I have a lot to gain by eating more plant-based foods. Q4 Eating less animal products is better for my health. | 0.898 |
| Perceived benefits: Environment (Adapted from [34,35]) | Q1 I can help improve our environment when I shift my current diet to more plant-based foods. Q2 Eating plenty of plant-based foods will protect the environment. Q3 Eating more plant-based foods is better for the environment. Q4 If I consume less animal-based products, it will be better for our environment. | 0.920 |
| Perceived susceptibility: Health (Adapted from [34,35]) | Q1 I feel I have a good chance of getting diseases such as heart disease and cancer in the future if I continue eating a lot of animal-based foods. Q2 My chances of getting diseases such as heart disease and cancer are large if I fail to eat more plant-based foods. Q3 My physical health will be jeopardized if I fail to eat more plant-based foods. Q4 If I don’t eat more plant-based foods, I think my chances of getting diseases such as heart disease and cancer sometime in the future would be high. | 0.927 |
| Perceived susceptibility: Environment (Adapted from [34,35]) | Q1 The well-being of the environment will be jeopardized if I fail to eat more plant-based foods. Q2 There is a good possibility that I will cause more damage to our environment if I fail to shift my current diet to more plant-based foods. Q3 I worry a lot about our environment if I continue to eat plenty of animal-based foods. Q4 Sometime in the future, our environment will be more damaged if I fail to shift my current diet to more plant-based foods. | 0.929 |
| Perceived severity: Health (Adapted from [34,35]) | Q1 The thought of having diseases such as heart disease and cancer scares me. Q2 Having a poor diet would have major consequences on my life. Q3 Eating a poor diet will negatively impact my life goals. | 0.710 |
| Perceived severity: Environment (Adapted from [34,35]) | Q1 Harming the environment would be very upsetting for me. Q2 It would be very serious if I my diet harms the environment. Q3 Our environment would be put in danger if I don’t change my diet. | 0.733 |
| Self-Efficacy (Adapted from [34,35]) | Q1 I feel confident in my ability to shift to more plant-based foods, even if it means finding the time to look up recipes. Q2 I can eat less animal products even if it is an adjustment for me. Q3 I am confident that I can incorporate more plant-based foods in my diet. Q4 I believe I have the ability to change my current diet for my health. Q5 I believe I have the ability to change my current diet for the environment. | 0.910 |
| Subjective norms: Health (Adapted from [34,35]) | Q1 Most people who are important to me would approve of me eating more plant-based foods to improve my health. Q2 Most people who are important to me would want me to eat more plant-based foods to improve my health. Q3 Most people who are important to me think I should eat more plant-based foods to improve my health. | 0.896 |
| Subjective norms: Environment (Adapted from [34,35]) | Q1 Most people who are important to me would approve of me eating more plant-based foods to protect the environment. Q2 Most people who are important to me think I should eat more plant-based foods to protect the environment. Q3 Most people who are important to me would want me to eat more plant-based foods to protect the environment. | 0.890 |
| Week | Health Messages [1,2,4,11,12,70,71,72] | Environment Messages [1,2,4,14,70,73,74] |
|---|---|---|
| 1 | Did you know by eating more plant-based products (like nuts and black beans) and less animal-based proteins (like beef), you can reduce your risk of getting heart disease, type 2 diabetes, hypertension, obesity, some cancers, and most chronic diseases? What’s a plant-based diet? Plant-Based Diet (psu.edu, accessed on 1 March 2021) Psst…. Plant proteins cost far less than animal proteins. It’s a twofer that you’re protecting your health and your wallet! Is plant-based budget friendly? 2 easy, affordable, plant-centered dinners-Harvard Health | Did you know by eating more plant-based products (like nuts and black beans) and less animal-based proteins (like beef), you can reduce your environmental footprint on the use of land, water, and fossil energy? What’s a plant-based diet? Plant-Based Diet (psu.edu, accessed on 1 March 2021) Psst…. Plant proteins cost far less than animal proteins. It’s a twofer that you’re protecting your planet and your wallet! Is plant-based budget friendly? 2 easy, affordable, plant-centered dinners-Harvard Health |
| 2 | A plant-based diet (especially fruits and veggies!) is full of nutrients and lower in calories. It’s a great way to be lean or stay lean! Need help setting goals? Watch video from Start Simple with MyPlate app-YouTube Eating a plant-based diet lowers your risk of dying from heart disease just as much as regular exercise does! Up your plant intake while lowering your disease risk. Wondering how to get started? Look through these 8-tips for eating more plant-based. How likely are you to focus on eating plant-based protein next week? Text back 1 (not at all), 2 (maybe), or 3 (likely) | A plant-based diet (especially fruits and veggies!) significantly lowers water and air pollution. It’s a great way to be green or stay green! Need help setting goals? Watch video from Start Simple with MyPlate app-YouTube Every serving of plant protein you choose in place of meat saves the pollution of a 100-mile car trip! Up your plant intake while lowering your environmental foot print. Wondering how to get started? Look through these 8-tips for eating more plant-based. How likely are you to focus on eating plant-based protein next week? Text back 1 (not at all), 2 (maybe), or 3 (likely) |
| 3 | FYI, plants are rich in antioxidants, which protect you from cancer, heart disease, osteoporosis, and enhance your immunity! Need help taking the first step? Tips> Enjoy Vegetarian Meals | MyPlate Health-friendly AND tasty? Try a plant-based burger or other meatless dish and see for yourself! Who knew being nutritious could taste so good? See these 5 tips for shifting to more plant-based food choices | FYI, plant-based foods use far fewer natural resources for production than animal-based foods, which protect our planet from environmental damage! Need help taking the first step? Tips> Enjoy Vegetarian Meals | MyPlate Eco-friendly AND tasty? Try a plant-based burger or other meatless dish and see for yourself! Who knew saving the planet could taste so good? See these 5 tips for shifting to more plant-based food choices |
| 4 | Eating more plant foods is for everyone, not just vegetarians. Improve your health by joining the thousands of people that are eating a plant-forward diet. If you’re a meat lover, enjoy it on occasion and in smaller amounts as a garnish. Looking for more plant-based recipes? Explore these resources from the Recipes | MyPlate Lower your health risk by passing on the extra meat next time. Try veggie days or smaller meat portions. See these 5 tips for shifting to more plant-based food choices How likely are you to focus on eating more fruits and vegetables next week? Text back 1 (not at all), 2 (maybe), or 3 (likely) | Eating more plant foods is for everyone, not just vegetarians. Protect the environment by joining the thousands of people that are eating a plant-forward diet. If you’re a meat lover, enjoy it on occasion and in smaller amounts as a garnish. Looking for more plant-based recipes? Explore these resources from the Recipes | MyPlate Lower your environmental impact by passing on the extra meat next time. Try veggie days or smaller meat portions. See these 5 tips for shifting to more plant-based food choices How likely are you to focus on eating more fruits and vegetables next week? Text back 1 (not at all), 2 (maybe), or 3 (likely) |
| 5 | Eating too much of animal products and too little of plant products can have major consequences on your health and your life goals. Once you lose your health, you lose what you love to do! Need help setting goals? Watch video from Start Simple with MyPlate app-YouTube Animal products have a higher amount of saturated fats. High intakes of saturated fat may lead to the development of cardiovascular disease! Wondering how to get started? Look through these 8-tips for eating more plant-based. | Eating too much of animal products and too little of plant products can have major consequences on our environment and its biodiversity. Once earth loses its biodiversity, we can’t get it back! Need help setting goals? Watch video from Start Simple with MyPlate app-YouTube Animal agriculture produces higher amounts of harmful nutrient runoff into our lakes and rivers than production of plant-based foods. This environmental pollution destroys wildlife and leads to toxic algae growth! Wondering how to get started? Look through these 8-tips for eating more plant-based. |
| 6 | Some compounds in meat are converted to a harmful byproduct, trimethylamine N-oxide (TMAO), by gut bacteria. High levels of TMAO byproduct are associated with atherosclerosis, heart attack, and stroke! Need help taking the first step? Tips > Enjoy Vegetarian Meals | MyPlate 1 in 4 Americans ate more plant-based protein last year. You could do the same! Let’s join in. What’re you waiting for? It’s about time to make your health a priority. How to choose plant-based when eating out? See these tips! How likely are you to focus on eating plant-based protein next week? Text back 1 (not at all), 2 (maybe), or 3 (likely) | Some animals (especially cows) produce large amounts of a harmful greenhouse gas, methane, by their gut bacteria. High levels of methane contribute to global warming! Need help taking the first step? Tips > Enjoy Vegetarian Meals | MyPlate 1 in 4 Americans ate more plant-based protein last year. You could do the same! Let’s join in. What’re you waiting for? It’s about time to make our planet a priority. How to choose plant-based when eating out? See these tips! How likely are you to focus on eating plant-based protein next week? Text back 1 (not at all), 2 (maybe), or 3 (likely) |
| 7 | Are you aware that many plant foods are a good source of protein too? Beans, chickpeas, split peas, edamame, lentils, quinoa, soybeans, tofu, and tempeh are some examples of lean protein. Try a simple protein swap for your next meal! PS: Lean plant protein is better for your health. Looking for simple plant-based swaps when cooking? Check these ideas out! Did you know legumes (beans and peas) are considered both vegetable and protein food? You only need 1 ½ cup a week for a 2000 daily calorie intake. It’s a great way to eat both veggies and plant protein! You already know consuming lean protein and more veggies is good for your health. Looking for more plant-based recipes? Explore these resources from the Recipes | MyPlate | Are you aware that many plant foods are a good source of protein too? Beans, chickpeas, split peas, edamame, lentils, quinoa, soybeans, tofu, and tempeh are some examples of lean protein. Try a simple protein swap for your next meal! PS: Lean plant protein is better for our environment. Looking for simple plant-based swaps when cooking? Check these ideas out! Did you know legumes (beans and peas) are considered both vegetable and protein food? You only need 1 ½ cup a week for a 2000 daily calorie intake. It’s a great way to eat both veggies and plant protein! You already know consuming lean protein and more veggies is good for our planet. Looking for more plant-based recipes? Explore these resources from the Recipes | MyPlate |
| 8 | Did you know 56% of people say they try to eat healthy? You can do the same by choosing plant proteins to improve your health. Your friends and family want you to be healthy too! How to choose plant-based when eating out? See these tips! Eat a little more plant-based food… a little less animal-based food… You can make small changes to your diet and have a big impact on your health! Eating plant-based doesn’t mean giving up meat or dairy, but just choosing plants in higher proportions. Looking for simple plant-based swaps when cooking? Check these ideas out! How likely are you to focus on eating more fruits and vegetables next week? Text back 1 (not at all), 2 (maybe), or 3 (likely) | Did you know 54% of people say they try to eat in an environmentally sustainability way? You can do the same by choosing plant proteins to reduce your environmental footprint. Your friends and family want you to protect their planet too! How to choose plant-based when eating out? See these tips! Eat a little more plant-based food… a little less animal-based food… You can make small changes to your diet and have a big impact on the planet! Eating plant-based doesn’t mean giving up meat or dairy, but just choosing plants in higher proportions. Looking for simple plant-based swaps when cooking? Check these ideas out! How likely are you to focus on eating more fruits and vegetables next week? Text back 1 (not at all), 2 (maybe), or 3 (likely) |
References
- U.S. Department of Health and Human Services; U.S. Department of Agriculture. 2015–2020 Dietary Guidelines for Americans, 8th ed.; 2015. Available online: https://www.dietaryguidelines.gov/about-dietary-guidelines/previous-editions/2015-dietary-guidelines (accessed on 10 September 2021).
- U.S. Department of Agriculture; U.S. Department of Health and Human Services. Dietary Guidelines for Americans, 2020–2025, 9th ed. Available online: DietaryGuidelines.gov (accessed on 10 September 2021).
- Hoy, K.; Clemens, J.; Moshfegh, A. Estimated Protein Intake from Animal and Plant Foods by U.S. Adults, What We Eat in America, NHANES, 2015–2016. Curr. Dev. Nutr. 2021, 5, 133. [Google Scholar] [CrossRef]
- Pasiakos, S.M.; Agarwal, S.; Lieberman, H.R.; Fulgoni, V.L. Sources and Amounts of Animal, Dairy, and Plant Protein Intake of US Adults in 2007–2010. Nutrients 2015, 7, 7058–7069. [Google Scholar] [CrossRef] [Green Version]
- Smit, E.; Nieto, F.J.; Crespo, C.J.; Mitchell, P. Estimates of Animal and Plant Protein Intake in US Adults: Results from the Third National Health and Nutrition Examination Survey, 1988–1991. J. Am. Diet. Assoc. 1999, 99, 813–820. [Google Scholar] [CrossRef]
- Cotton, P.A.; Subar, A.F.; Friday, J.E.; Cook, A. Dietary sources of nutrients among US adults, 1994 to 1996. J. Am. Diet. Assoc. 2004, 104, 921–930. [Google Scholar] [CrossRef] [PubMed]
- Popkin, B.M. Global nutrition dynamics: The world is shifting rapidly toward a diet linked with noncommunicable diseases. Am. J. Clin. Nutr. 2006, 84, 289–298. [Google Scholar] [CrossRef] [PubMed]
- Popkin, B.M. Relationship between shifts in food system dynamics and acceleration of the global nutrition transition. Nutr. Rev. 2017, 75, 73–82. [Google Scholar] [CrossRef] [Green Version]
- Yamane, T.; Kaneko, S. Is the younger generation a driving force toward achieving the sustainable development goals? Survey experiments. J. Clean. Prod. 2021, 292, 125932. [Google Scholar] [CrossRef]
- Powell, P.K.; Durham, J.; Lawler, S. Food Choices of Young Adults in the United States of America: A Scoping Review. Adv. Nutr. 2019, 10, 479–488. [Google Scholar] [CrossRef] [PubMed]
- Tuso, P.J.; Ismail, M.H.; Ha, B.P.; Bartolotto, C. Nutritional update for physicians: Plant-based diets. Perm. J. 2013, 17, 61–66. [Google Scholar] [CrossRef] [PubMed] [Green Version]
- Hever, J. Plant-Based Diets: A Physician’s Guide. Perm. J. 2016, 20, 15–082. [Google Scholar] [CrossRef]
- Koeth, R.A.; Wang, Z.; Levison, B.S.; Buffa, J.A.; Org, E.; Sheehy, B.T.; Britt, E.B.; Fu, X.; Wu, Y.; Li, L.; et al. Intestinal microbiota metabolism of l-carnitine, a nutrient in red meat, promotes atherosclerosis. Nat. Med. 2013, 19, 576–585. [Google Scholar] [CrossRef] [Green Version]
- Sabaté, J.; Soret, S. Sustainability of plant-based diets: Back to the future. Am. J. Clin. Nutr. 2014, 100, 476S–482S. [Google Scholar] [CrossRef] [PubMed]
- McGuire, M. Scientific Report of the 2015 Dietary Guidelines Advisory Committee. Washington, DC: US Departments of Agriculture and Health and Human Services, 2015. Adv. Nutr. 2016, 7, 202–204. [Google Scholar] [CrossRef] [PubMed] [Green Version]
- Nelson, M.E.; Hamm, M.W.; Hu, F.B.; Abrams, S.A.; Griffin, T.S. Alignment of Healthy Dietary Patterns and Environmental Sustainability: A Systematic Review. Adv. Nutr. 2016, 7, 1005–1025. [Google Scholar] [CrossRef] [Green Version]
- Grummon, A.H.; Goodman, D.; Jaacks, L.M.; Taillie, L.S.; Chauvenet, C.A.; Salvia, M.G.; Rimm, E.B. Awareness of and reactions to health and environmental harms of red meat among parents in the United States. Public Health Nutr. 2021, 1–11. [Google Scholar] [CrossRef] [PubMed]
- Neff, R.A.; Edwards, D.; Palmer, A.; Ramsing, R.; Righter, A.; Wolfson, J. Reducing meat consumption in the USA: A nationally representative survey of attitudes and behaviours. Public Health Nutr. 2018, 21, 1835–1844. [Google Scholar] [CrossRef] [Green Version]
- Graça, J.; Truninger, M.; Junqueira, L.; Schmidt, L. Consumption orientations may support (or hinder) transitions to more plant-based diets. Appetite 2019, 140, 19–26. [Google Scholar] [CrossRef]
- Vainio, A.; Niva, M.; Jallinoja, P.; Latvala, T. From beef to beans: Eating motives and the replacement of animal proteins with plant proteins among Finnish consumers. Appetite 2016, 106, 92–100. [Google Scholar] [CrossRef] [Green Version]
- International Food Information Council. 2021 Food & Health Survey. 2021. Available online: https://foodinsight.org/2021-food-health-survey (accessed on 23 October 2021).
- Leiserowitz, A.; Ballew, M.; Rosenthal, S.; Semaan, J. Climate Change and the American Diet; Yale Program on Climate Change Communication: New Haven, CT, USA, 2020. [Google Scholar]
- Pew Research Center. Mobile Fact Sheet. 2021. Available online: https://www.pewresearch.org/internet/fact-sheet/mobile/ (accessed on 5 November 2021).
- Brown, O.N.; O’Connor, L.E.; Savaiano, D. Mobile MyPlate: A Pilot Study Using Text Messaging to Provide Nutrition Education and Promote Better Dietary Choices in College Students. J. Am. Coll. Health 2014, 62, 320–327. [Google Scholar] [CrossRef]
- Santo, K.; Hyun, K.; De Keizer, L.; Thiagalingam, A.; Hillis, G.S.; Chalmers, J.; Redfern, J.; Chow, C.K. The effects of a lifestyle-focused text-messaging intervention on adherence to dietary guideline recommendations in patients with coronary heart disease: An analysis of the TEXT ME study. Int. J. Behav. Nutr. Phys. Act. 2018, 15, 45. [Google Scholar] [CrossRef] [Green Version]
- O’Brien, L.M.; Palfai, T.P. Efficacy of a brief web-based intervention with and without SMS to enhance healthy eating behaviors among university students. Eat. Behav. 2016, 23, 104–109. [Google Scholar] [CrossRef]
- Carfora, V.; Caso, D.; Conner, M. Correlational study and randomised controlled trial for understanding and changing red meat consumption: The role of eating identities. Soc. Sci. Med. 2017, 175, 244–252. [Google Scholar] [CrossRef]
- Taufik, D.; Verain, M.C.D.; Bouwman, E.P.; Reinders, M.J. Determinants of real-life behavioural interventions to stimulate more plant-based and less animal-based diets: A systematic review. Trends Food Sci. Technol. 2019, 93, 281–303. [Google Scholar] [CrossRef]
- Hekler, E.B.; Gardner, C.D.; Robinson, T.N. Effects of a College Course About Food and Society on Students’ Eating Behaviors. Am. J. Prev. Med. 2010, 38, 543–547. [Google Scholar] [CrossRef] [PubMed]
- Malan, H.; Challamel, G.A.; Silverstein, D.; Hoffs, C.; Spang, E.; Pace, S.A.; Malagueño, B.L.R.; Gardner, C.D.; Wang, M.C.; Slusser, W.; et al. Impact of a Scalable, Multi-Campus “Foodprint” Seminar on College Students’ Dietary Intake and Dietary Carbon Footprint. Nutrients 2020, 12, 2890. [Google Scholar] [CrossRef] [PubMed]
- Larson, N.; Laska, M.N.; Neumark-Sztainer, D. Do young adults value sustainable diet practices? Continuity in values from adolescence to adulthood and linkages to dietary behaviour. Public Health Nutr. 2019, 22, 2598–2608. [Google Scholar] [CrossRef]
- Pelletier, J.E.; Laska, M.N.; Neumark-Sztainer, D.; Story, M. Positive Attitudes toward Organic, Local, and Sustainable Foods Are Associated with Higher Dietary Quality among Young Adults. J. Acad. Nutr. Diet. 2013, 113, 127–132. [Google Scholar] [CrossRef] [Green Version]
- Webb, T.L.; Joseph, J.; Yardley, L.; Michie, S. Using the Internet to Promote Health Behavior Change: A Systematic Review and Meta-analysis of the Impact of Theoretical Basis, Use of Behavior Change Techniques, and Mode of Delivery on Efficacy. J. Med. Internet Res. 2010, 12, e4. [Google Scholar] [CrossRef] [Green Version]
- McClenahan, C.; Shevlin, M.; Adamson, G.; Bennett, C.; O’Neill, B. Testicular self-examination: A test of the health belief model and the theory of planned behaviour. Health Educ. Res. 2007, 22, 272–284. [Google Scholar] [CrossRef] [PubMed]
- Gerend, M.A.; Shepherd, J.E. Predicting Human Papillomavirus Vaccine Uptake in Young Adult Women: Comparing the Health Belief Model and Theory of Planned Behavior. Ann. Behav. Med. 2012, 44, 171–180. [Google Scholar] [CrossRef] [Green Version]
- Rosenstock, I.M. Historical Origins of the Health Belief Model. Health Educ. Monogr. 1974, 2, 328–335. [Google Scholar] [CrossRef]
- Dehdari, T.; Dehdari, L.; Jazayeri, S. Diet-Related Stomach Cancer Behavior among Iranian College Students: A Text Messaging Intervention. Asian Pac. J. Cancer Prev. 2016, 17, 5165–5172. [Google Scholar] [CrossRef] [PubMed]
- Hidarnia, A.; Jeihooni, A.K.; Kaveh, M.H.; Hajizadeh, E.; Askari, A. The effect of an educational program based on health belief model on preventing osteoporosis in women. Int. J. Prev. Med. 2015, 6, 115. [Google Scholar] [CrossRef] [PubMed]
- Ajzen, I. The Theory of Planned Behavior. Organ. Behav. Hum. Decis. Process. 1991, 50, 179–211. [Google Scholar] [CrossRef]
- Wallston, K. Control Beliefs: Health Perspectives. In International Encyclopedia of the Social & Behavioral Sciences; Smelser, N.J., Baltes, P.B., Eds.; Pergamon: Oxford, UK, 2001; pp. 2724–2726. ISBN 978-0-08-043076-8. [Google Scholar]
- Dean, M.; Raats, M.M.; Shepherd, R. The Role of Self-Identity, Past Behavior, and Their Interaction in Predicting Intention to Purchase Fresh and Processed Organic Food. J. Appl. Soc. Psychol. 2011, 42, 669–688. [Google Scholar] [CrossRef] [Green Version]
- O’Connor, E.L.; Sims, L.; White, K.M. Ethical food choices: Examining people’s Fair Trade purchasing decisions. Food Qual. Prefer. 2017, 60, 105–112. [Google Scholar] [CrossRef] [Green Version]
- Dowd, K.; Burke, A.K.J. The influence of ethical values and food choice motivations on intentions to purchase sustainably sourced foods. Appetite 2013, 69, 137–144. [Google Scholar] [CrossRef] [PubMed]
- Vermeir, I.; Verbeke, W. Sustainable food consumption among young adults in Belgium: Theory of planned behaviour and the role of confidence and values. Ecol. Econ. 2008, 64, 542–553. [Google Scholar] [CrossRef]
- Bratanova, B.; Vauclair, C.-M.; Kervyn, N.; Schumann, S.; Wood, R.; Klein, O. Savouring morality. Moral satisfaction renders food of ethical origin subjectively tastier. Appetite 2015, 91, 137–149. [Google Scholar] [CrossRef] [Green Version]
- Sparkman, G.; Walton, G.M. Dynamic Norms Promote Sustainable Behavior, Even if It Is Counternormative. Psychol. Sci. 2017, 28, 1663–1674. [Google Scholar] [CrossRef]
- Lindsey, L.L.M. The influence of persuasive messages on healthy eating habits: A test of the theory of reasoned action when attitudes and subjective norm are targeted for change. J. Appl. Biobehav. Res. 2017, 22, e12106. [Google Scholar] [CrossRef]
- Asril, N.M.; Tabuchi, K.; Tsunematsu, M.; Kobayashi, T.; Kakehashi, M. Predicting Healthy Lifestyle Behaviours among Patients with Type 2 Diabetes in Rural Bali, Indonesia. Clin. Med. Insights Endocrinol. Diabetes 2020, 13, 1–13. [Google Scholar] [CrossRef]
- U.S. Department of Agriculture, Agricultural Research Service. Nutrient Intakes from Food and Beverages: Mean Amounts Consumed per Individual, by Gender and Age. 2020, What We Eat in America, NHANES 2017–2019. Available online: www.ars.usda.gov/nea/bhnrc/fsrg (accessed on 20 October 2021).
- Park, Y.; Dodd, K.W.; Kipnis, V.; Thompson, F.E.; Potischman, N.; Schoeller, D.A.; Baer, D.J.; Midthune, D.; Troiano, R.; Bowles, H.; et al. Comparison of self-reported dietary intakes from the Automated Self-Administered 24-h recall, 4-d food records, and food-frequency questionnaires against recovery biomarkers. Am. J. Clin. Nutr. 2018, 107, 80–93. [Google Scholar] [CrossRef] [PubMed] [Green Version]
- Subar, A.F.; Potischman, N.; Dodd, K.W.; Thompson, F.E.; Baer, D.J.; Schoeller, D.A.; Midthune, D.; Kipnis, V.; Kirkpatrick, S.I.; Mittl, B.; et al. Performance and Feasibility of Recalls Completed Using the Automated Self-Administered 24-Hour Dietary Assessment Tool in Relation to Other Self-Report Tools and Biomarkers in the Interactive Diet and Activity Tracking in AARP (IDATA) Study. J. Acad. Nutr. Diet. 2020, 120, 1805–1820. [Google Scholar] [CrossRef] [PubMed]
- Plotnikoff, R.C.; Lippke, S.; Trinh, L.; Courneya, K.S.; Birkett, N.; Sigal, R.J. Protection motivation theory and the prediction of physical activity among adults with type 1 or type 2 diabetes in a large population sample. Br. J. Health Psychol. 2010, 15, 643–661. [Google Scholar] [CrossRef] [PubMed]
- Haws, K.L.; Winterich, K.P.; Naylor, R.W. Seeing the world through GREEN-tinted glasses: Green consumption values and responses to environmentally friendly products. J. Consum. Psychol. 2014, 24, 336–354. [Google Scholar] [CrossRef]
- Hair, J.F.J.; Black, W.C.; Babin, B.J.; Anderson, R.E. Multivariate Data Analysis, 7th ed.; Pearson Education Limited: London, UK, 2013; ISBN 978-1-292-02190-4. [Google Scholar]
- Sekaran, U.; Bougie, R. Research Methods for Business: A Skill Building Approach, 8th ed.; Wiley: Hoboken, NJ, USA, 2019; ISBN 978-1-119-56124-8. [Google Scholar]
- Bock, B.C.; Heron, K.E.; Jennings, E.G.; Magee, J.C.; Morrow, K.M. User Preferences for a Text Message–Based Smoking Cessation Intervention. Health Educ. Behav. 2012, 40, 152–159. [Google Scholar] [CrossRef]
- Cole, D.A.; Maxwell, S.E. Testing Mediational Models with Longitudinal Data: Questions and Tips in the Use of Structural Equation Modeling. J. Abnorm. Psychol. 2003, 112, 558–577. [Google Scholar] [CrossRef] [PubMed] [Green Version]
- Schwartz, S.H. Are There Universal Aspects in the Structure and Contents of Human Values? J. Soc. Issues 1994, 50, 19–45. [Google Scholar] [CrossRef]
- Onwezen, M.C.; Bouwman, E.P.; Reinders, M.J.; Dagevos, H. A systematic review on consumer acceptance of alternative proteins: Pulses, algae, insects, plant-based meat alternatives, and cultured meat. Appetite 2021, 159, 105058. [Google Scholar] [CrossRef]
- Jaeger, S.R.; Chheang, S.L.; Prescott, J. Variations in the Strength of Association between Food Neophobia and Food and Beverage Acceptability: A Data-Driven Exploratory Study of an Arousal Hypothesis. Nutrients 2021, 13, 3657. [Google Scholar] [CrossRef]
- Hoek, A.C.; Pearson, D.; James, S.W.; Lawrence, M.A.; Friel, S. Healthy and environmentally sustainable food choices: Consumer responses to point-of-purchase actions. Food Qual. Prefer. 2017, 58, 94–106. [Google Scholar] [CrossRef]
- Gallup Inc. In U.S., More Say Animals Should Have Same Rights as People. Available online: https://news.gallup.com/poll/183275/say-animals-rights-people.aspx (accessed on 15 November 2021).
- Van Loo, E.J.; Hoefkens, C.; Verbeke, W. Healthy, sustainable and plant-based eating: Perceived (mis)match and involvement-based consumer segments as targets for future policy. Food Policy 2017, 69, 46–57. [Google Scholar] [CrossRef]
- Graham, D.J.; Pelletier, J.E.; Neumark-Sztainer, D.; Lust, K.; Laska, M.N. Perceived Social Ecological Factors Associated with Fruit and Vegetable Purchasing, Preparation, and Consumption among Young Adults. J. Acad. Nutr. Diet. 2013, 113, 1366–1374. [Google Scholar] [CrossRef] [PubMed] [Green Version]
- Munt, A.E.; Partridge, S.R.; Allman-Farinelli, M. The barriers and enablers of healthy eating among young adults: A missing piece of the obesity puzzle: A scoping review. Obes. Rev. 2017, 18, 1–17. [Google Scholar] [CrossRef]
- Hall, A.K.; Cole-Lewis, H.; Bernhardt, J.M. Mobile Text Messaging for Health: A Systematic Review of Reviews. Annu. Rev. Public Health 2015, 36, 393–415. [Google Scholar] [CrossRef] [PubMed] [Green Version]
- Cole-Lewis, H.; Kershaw, T. Text Messaging as a Tool for Behavior Change in Disease Prevention and Management. Epidemiol. Rev. 2010, 32, 56–69. [Google Scholar] [CrossRef] [Green Version]
- Pollard, C.M.; Howat, P.A.; Pratt, I.S.; Boushey, C.J.; Delp, E.J.; Kerr, D.A.; Buchholz, S.; Pfammatter, A. Preferred Tone of Nutrition Text Messages for Young Adults: Focus Group Testing. JMIR mHealth uHealth 2016, 4, e1. [Google Scholar] [CrossRef] [PubMed] [Green Version]
- Henchion, M.; Hayes, M.; Mullen, A.M.; Fenelon, M.; Tiwari, B. Future Protein Supply and Demand: Strategies and Factors Influencing a Sustainable Equilibrium. Foods 2017, 6, 53. [Google Scholar] [CrossRef] [Green Version]
- International Food Information Council. 2019 Food & Health Survey. 2019. Available online: https://foodinsight.org/2019-food-and-health-survey/ (accessed on 23 September 2021).
- Kim, H.; Caulfield, L.E.; Garcia-Larsen, V.; Steffen, L.M.; Coresh, J.; Rebholz, C.M. Plant-Based Diets Are Associated with a Lower Risk of Incident Cardiovascular Disease, Cardiovascular Disease Mortality, and All-Cause Mortality in a General Population of Middle-Aged Adults. J. Am. Hear. Assoc. 2019, 8, e012865. [Google Scholar] [CrossRef] [PubMed]
- Myers, J. Exercise and Cardiovascular Health. Circulation 2003, 107, e2–e5. [Google Scholar] [CrossRef] [PubMed] [Green Version]
- Ritchie, H.; Roser, M. Environmental Impacts of Food Production. Our World in Data. 2020. Available online: https://ourworldindata.org/environmental-impacts-of-food (accessed on 23 September 2021).
- Poore, J.; Nemecek, T. Reducing food’s environmental impacts through producers and consumers. Science 2018, 360, 987–992. [Google Scholar] [CrossRef] [PubMed] [Green Version]

| Demographic | Total | HM | EM | Pearson χ2 Sig. |
|---|---|---|---|---|
| Gender | ||||
| Female | 107 | 55 | 52 | 0.743 |
| Male | 49 | 23 | 26 | |
| Other | 3 | 2 | 1 | |
| Education Levels | ||||
| Less than high school degree | 0 | 0 | 0 | 0.244 |
| High school graduate (high school diploma or equivalent including GED) | 9 | 4 | 5 | |
| Some college but no degree | 39 | 14 | 25 | |
| Associate degree in college (2-year) | 9 | 6 | 3 | |
| Bachelor’s degree in college (4-year) | 50 | 28 | 22 | |
| Some graduate (Master’s, doctorate) or professional (MD, JD, etc.) | 30 | 14 | 16 | |
| Graduate or professional degree | 22 | 14 | 8 | |
| Annual Income | ||||
| $0–$24,999 | 33 | 11 | 22 | 0.296 |
| $25,000–$49,999 | 42 | 22 | 20 | |
| $50,000–74,999 | 25 | 13 | 12 | |
| $75,000–$99,999 | 19 | 12 | 7 | |
| $100,000–$149,000 | 24 | 12 | 12 | |
| $150,000 or more | 16 | 10 | 6 | |
| Total | 159 | 80 | 79 |
| Total | Health Messages (HM) | Environment Messages (EM) | ||||||||||
|---|---|---|---|---|---|---|---|---|---|---|---|---|
| T1 (SD) | T2 (SD) | Δ | p | T1 (SD) | T2 (SD) | Δ | p | T1 (SD) | T2 (SD) | Δ | p | |
| Values | 5.32 (1.03) | 5.44 (0.93) | 0.11 | 0.048 | 5.72 (0.82) | 5.70 (0.87) | −0.02 | 0.743 | 4.92 (1.08) | 5.17 (0.92) | 0.25 | 0.007 |
| Health value | 5.69 (0.84) | 5.69 (0.85) | 0.00 | 0.924 | 5.72 (1.05) | 5.70 (0.87) | −0.02 | 0.743 | 5.66 (0.86) | 5.69 (0.83) | 0.03 | 0.654 |
| Green consumer value | 5.02 (1.07) | 5.18 (1.04) | 0.16 | 0.007 | 5.12 (0.82) | 5.19 (1.16) | 0.07 | 0.362 | 4.92 (1.08) | 5.17 (0.92) | 0.25 | 0.007 |
| Moral satisfaction | 4.41 (1.52) | 4.81 (1.40) | 0.39 | --- | 4.35 (1.56) | 4.74 (1.47) | 0.39 | 0.009 | 4.47 (1.47) | 4.87 (1.34) | 0.40 | 0.002 |
| Perceived benefits | 5.24 (1.28) | 5.54 (1.26) | 0.30 | --- | 5.20 (1.34) | 5.53 (1.36) | 0.33 | 0.010 | 5.29 (1.23) | 5.56 (1.15) | 0.27 | 0.011 |
| Perceived susceptibility | 4.13 (1.47) | 4.38 (1.52) | 0.26 | 0.017 | 4.22 (1.51) | 4.55 (1.51) | 0.33 | 0.028 | 4.03 (1.43) | 4.21 (1.52) | 0.18 | 0.241 |
| Perceived severity | 5.36 (1.18) | 5.49 (1.20) | 0.12 | 0.111 | 6.00 (0.86) | 6.08 (0.97) | 0.08 | 0.387 | 4.73 (1.12) | 4.89 (1.11) | 0.16 | 0.180 |
| Subjective norms | 4.34 (1.54) | 4.51 (1.50) | 0.17 | 0.089 | 4.43 (1.57) | 4.67 (1.46) | 0.25 | 0.103 | 4.25 (1.51) | 4.34 (1.52) | 0.09 | 0.490 |
| Self-efficacy | 5.40 (1.15) | 5.56 (1.11) | 0.16 | 0.031 | 5.53 (1.15) | 5.68 (1.10) | 0.15 | 0.185 | 5.26 (1.15) | 5.43 (1.12) | 0.17 | 0.080 |
| Total protein foods | 5.44 (3.40) | 5.74 (3.98) | 0.30 | 0.341 | 5.03 (3.09) | 5.65 (3.77) | 0.62 | 0.182 | 5.85 (3.66) | 5.84 (4.21) | −0.02 | 0.969 |
| Meat, poultry, seafood | 4.06 (3.07) | 4.29 (3.54) | 0.23 | 0.431 | 3.81 (2.67) | 4.20 (3.40) | 0.39 | 0.328 | 4.31 (3.42) | 4.39 (3.71) | 0.07 | 0.868 |
| Meat | 1.14 (1.85) | 1.13 (1.78) | −0.02 | 0.936 | 1.13 (1.72) | 1.03 (1.49) | −0.10 | 0.698 | 1.16 (2.00) | 1.22 (2.04) | 0.07 | 0.801 |
| Poultry | 1.64 (1.98) | 1.74 (2.26) | 0.10 | 0.644 | 1.54 (1.81) | 1.82 (2.40) | 0.28 | 0.292 | 1.75 (2.15) | 1.66 (2.12) | −0.09 | 0.794 |
| Seafood | 0.98 (1.22) | 0.72 (1.87) | −0.25 | 0.146 | 0.89 (1.22) | 0.58 (1.29) | −0.30 | 0.118 | 1.07 (1.22) | 0.87 (2.32) | −0.20 | 0.486 |
| Eggs | 0.26 (0.64) | 0.66 (0.95) | 0.40 | --- | 0.21 (0.57) | 0.62 (0.79) | 0.41 | --- | 0.31 (0.71) | 0.70 (1.10) | 0.39 | 0.012 |
| Nuts and seeds | 0.54 (0.94) | 0.50 (0.90) | −0.04 | 0.622 | 0.48 (0.70) | 0.53 (0.96) | 0.05 | 0.640 | 0.60 (1.13) | 0.47 (0.85) | −0.12 | 0.296 |
| Legumes | 0.45 (0.89) | 0.50 (0.97) | 0.05 | 0.593 | 0.46 (0.88) | 0.49 (0.93) | 0.03 | 0.839 | 0.43 (0.90) | 0.51 (1.02) | 0.08 | 0.594 |
| Soy | 0.18 (0.63) | 0.29 (0.77) | 0.12 | 0.145 | 0.18 (0.69) | 0.30 (0.77) | 0.12 | 0.283 | 0.17 (0.56) | 0.28 (0.78) | 0.11 | 0.328 |
| Total dairy | 1.46 (1.41) | 1.31 (1.24) | −0.15 | 0.234 | 1.55 (1.69) | 1.45 (1.42) | −0.10 | 0.592 | 1.36 (1.06) | 1.17 (1.01) | −0.19 | 0.233 |
| Total fruits | 0.80 (0.93) | 0.82 (0.96) | 0.02 | 0.801 | 0.79 (0.97) | 0.82 (1.05) | 0.03 | 0.793 | 0.80 (0.89) | 0.81 (0.88) | 0.01 | 0.934 |
| Total vegetables | 1.43 (0.98) | 1.61 (1.05) | 0.17 | 0.068 | 1.50 (1.06) | 1.50 (0.93) | 0.00 | 0.999 | 1.37 (0.90) | 1.72 (1.16) | 0.35 | 0.015 |
| Total grains | 6.75 (3.03) | 6.96 (4.57) | 0.20 | 0.578 | 6.69 (2.74) | 6.75 (4.23) | 0.07 | 0.902 | 6.82 (3.32) | 7.17 (4.92) | 0.35 | 0.501 |
| Whole grains | 1.16 (1.69) | 1.54 (2.64) | 0.38 | 0.069 | 0.96 (0.86) | 1.55 (3.14) | 0.58 | 0.099 | 1.36 (2.22) | 1.54 (2.02) | 0.18 | 0.430 |
| Plant protein | 1.16 (1.39) | 1.29 (1.79) | 0.13 | 0.431 | 1.12 (1.34) | 1.32 (1.97) | 0.20 | 0.400 | 1.20 (1.45) | 1.27 (1.60) | 0.05 | 0.811 |
| Plant protein intention | 62.06 (27.92) | 64.42 (26.49) | 2.36 | 0.222 | 61.34 (26.56) | 62.72 (26.75) | 1.38 | 0.623 | 62.77 (29.37) | 66.11 (26.28) | 3.34 | 0.214 |
| Animal protein intention | 75.22 (26.15) | 65.17 (29.33) | −10.05 | --- | 75.68 (26.19) | 63.55 (27.84) | −12.13 | --- | 74.76 (26.28) | 66.83 (30.87) | −7.92 | 0.013 |
| Fruits, veg, intention | 85.30 (18.35) | 87.50 (15.42) | 2.21 | 0.050 | 85.51 (18.19) | 88.33 (14.53) | 2.81 | 0.098 | 85.08 (18.62) | 86.67 (16.31) | 1.60 | 0.283 |
| Education | Income | Gender | ||||
|---|---|---|---|---|---|---|
| r | p | r | p | Δ | p | |
| Values | −0.055 | 0.487 | 0.003 | 0.970 | −0.130 | 0.425 |
| Moral satisfaction | 0.109 | 0.171 | 0.153 | 0.053 | −0.266 | 0.199 |
| Perceived benefits | 0.045 | 0.576 | 0.098 | 0.221 | −0.279 | 0.108 |
| Perceived susceptibility | 0.091 | 0.256 | 0.157 | 0.048 | −0.152 | 0.567 |
| Perceived severity | 0.083 | 0.296 | −0.094 | 0.239 | −0.139 | 0.405 |
| Subjective norms | 0.145 | 0.068 | 0.040 | 0.620 | −0.079 | 0.689 |
| Self-efficacy | 0.061 | 0.441 | −0.047 | 0.557 | −0.086 | 0.600 |
| Total protein | 0.183 | 0.021 | −0.042 | 0.599 | −0.318 | 0.687 |
| Meat, poultry, and seafood | 0.202 | 0.011 | −0.006 | 0.942 | −0.460 | 0.477 |
| Meat | 0.128 | 0.109 | 0.033 | 0.677 | −0.170 | 0.715 |
| Poultry | 0.067 | 0.402 | −0.087 | 0.276 | −0.860 | 0.062 |
| Seafood | −0.030 | 0.710 | 0.013 | 0.874 | 0.831 | 0.028 |
| Eggs | 0.151 | 0.058 | 0.020 | 0.807 | −0.497 | 0.047 |
| Soy | −0.020 | 0.801 | −0.056 | 0.481 | 0.174 | 0.436 |
| Nuts and seeds | 0.011 | 0.893 | −0.094 | 0.238 | 0.314 | 0.073 |
| Legumes | −0.059 | 0.462 | 0.224 | 0.005 | −0.455 | 0.083 |
| Total dairy | −0.091 | 0.253 | 0.097 | 0.223 | −0.124 | 0.643 |
| Total fruits | 0.079 | 0.320 | −0.031 | 0.698 | 0.095 | 0.576 |
| Total vegetables | 0.056 | 0.480 | −0.002 | 0.980 | −0.090 | 0.662 |
| Total grains | 0.070 | 0.379 | 0.142 | 0.074 | −1.850 | 0.067 |
| Whole grains | 0.009 | 0.914 | 0.043 | 0.587 | −0.697 | 0.268 |
| Plant protein | −0.044 | 0.584 | 0.061 | 0.446 | 0.025 | 0.954 |
| Plant protein intention | −0.155 | 0.052 | −0.093 | 0.243 | −0.226 | 0.957 |
| Animal food intention | −0.056 | 0.488 | −0.161 | 0.043 | 7.563 | 0.124 |
| Fruits and vegetables intention | 0.008 | 0.918 | 0.021 | 0.795 | −0.942 | 0.700 |
| Predictor | Outcome | B | p | B (Group) | p (Group) | r | p (Corr.) |
|---|---|---|---|---|---|---|---|
| Values | Meat, poultry, and seafood | 0.210 | 0.009 | 0.076 | 0.341 | −0.011 | 0.891 |
| Meat | −0.018 | 0.831 | 0.046 | 0.590 | 0.119 | 0.134 | |
| Fruits | 0.100 | 0.194 | 0.030 | 0.692 | 0.030 | 0.704 | |
| Vegetables | 0.097 | 0.233 | 0.164 | 0.045 | 0.069 | 0.385 | |
| Plant protein | 0.071 | 0.409 | 0.006 | 0.940 | 0.090 | 0.258 | |
| Plant protein intention | 0.076 | 0.305 | 0.079 | 0.262 | 0.128 | 0.109 | |
| Animal food intention | −0.169 | 0.027 | −0.002 | 0.978 | −0.072 | 0.372 | |
| Fruits and vegetables intention | 0.069 | 0.291 | −0.019 | 0.766 | 0.033 | 0.683 | |
| Perceived benefits | 0.063 | 0.341 | 0.014 | 0.834 | 0.176 | 0.026 | |
| Perceived susceptibility | 0.185 | 0.010 | −0.005 | 0.936 | 0.026 | 0.749 | |
| Perceived severity | 0.255 | --- | −0.162 | 0.015 | 0.103 | 0.196 | |
| Subjective norms | 0.148 | 0.036 | −0.020 | 0.754 | 0.166 | 0.037 | |
| Self-efficacy | 0.175 | 0.018 | 0.022 | 0.740 | 0.139 | 0.081 | |
| Moral satisfaction | 0.181 | 0.007 | 0.093 | 0.149 | 0.084 | 0.291 | |
| Perceived benefits | Meat, poultry, and seafood | 0.019 | 0.804 | −0.006 | 0.941 | −0.007 | 0.935 |
| Meat | −0.056 | 0.483 | 0.055 | 0.484 | −0.053 | 0.509 | |
| Fruits | 0.099 | 0.163 | −0.012 | 0.868 | −0.090 | 0.257 | |
| Vegetables | 0.040 | 0.604 | 0.125 | 0.098 | −0.026 | 0.744 | |
| Plant protein | 0.155 | 0.048 | −0.027 | 0.728 | 0.015 | 0.856 | |
| Plant protein intention | 0.091 | 0.158 | 0.046 | 0.469 | 0.179 | 0.024 | |
| Animal food intention | −0.049 | 0.489 | 0.066 | 0.345 | −0.082 | 0.305 | |
| Fruits and vegetables intention | −0.084 | 0.161 | −0.043 | 0.473 | 0.064 | 0.423 | |
| Perceived susceptibility | Meat, poultry, and seafood | 0.156 | 0.037 | 0.004 | 0.959 | −0.105 | 0.188 |
| Meat | 0.111 | 0.162 | 0.060 | 0.446 | −0.118 | 0.138 | |
| Fruits | −0.009 | 0.902 | −0.009 | 0.902 | −0.004 | 0.961 | |
| Vegetables | −0.091 | 0.233 | 0.123 | 0.105 | 0.124 | 0.119 | |
| Plant protein | 0.022 | 0.779 | −0.020 | 0.796 | 0.090 | 0.262 | |
| Plant protein intention | 0.140 | 0.030 | 0.059 | 0.356 | 0.007 | 0.931 | |
| Animal food intention | −0.070 | 0.330 | 0.059 | 0.396 | −0.107 | 0.183 | |
| Fruits and vegetables intention | −0.057 | 0.342 | −0.049 | 0.410 | 0.027 | 0.740 | |
|
Perceived severity | Meat, poultry, seafood | 0.093 | 0.292 | 0.045 | 0.610 | −0.050 | 0.533 |
| Meat | 0.029 | 0.759 | 0.068 | 0.464 | −0.057 | 0.477 | |
| Fruits | 0.059 | 0.485 | 0.023 | 0.781 | 0.033 | 0.676 | |
| Vegetables | −0.004 | 0.963 | 0.125 | 0.163 | 0.100 | 0.211 | |
| Plant protein | 0.051 | 0.585 | 0.006 | 0.952 | 0.103 | 0.196 | |
| Plant protein intention | 0.185 | 0.015 | 0.149 | 0.048 | −0.069 | 0.390 | |
| Animal food intention | 0.034 | 0.687 | 0.083 | 0.319 | −0.164 | 0.040 | |
| Fruits and vegetables intention | 0.041 | 0.562 | −0.024 | 0.740 | −0.089 | 0.263 | |
| Subjective norms | Meat, poultry, and seafood | 0.164 | 0.028 | 0.003 | 0.967 | −0.049 | 0.541 |
| Meat | 0.119 | 0.129 | 0.060 | 0.445 | −0.061 | 0.443 | |
| Fruits | 0.027 | 0.700 | −0.007 | 0.925 | −0.049 | 0.541 | |
| Vegetables | 0.100 | 0.185 | 0.133 | 0.078 | 0.008 | 0.925 | |
| Plant protein | 0.069 | 0.386 | −0.017 | 0.827 | 0.082 | 0.302 | |
| Plant protein intention | 0.189 | 0.004 | 0.062 | 0.325 | 0.009 | 0.909 | |
| Animal food intention | −0.150 | 0.038 | 0.054 | 0.438 | −0.062 | 0.438 | |
| Fruits and vegetables intention | −0.068 | 0.259 | −0.050 | 0.405 | 0.001 | 0.989 | |
| Self-efficacy | Meat, poultry, seafood | 0.103 | 0.170 | 0.007 | 0.928 | −0.043 | 0.593 |
| Meat | −0.003 | 0.970 | 0.053 | 0.507 | −0.171 | 0.031 | |
| Fruits | 0.099 | 0.164 | 0.003 | 0.961 | −0.056 | 0.482 | |
| Vegetables | 0.053 | 0.493 | 0.133 | 0.081 | 0.029 | 0.718 | |
| Plant protein | 0.165 | 0.036 | −0.001 | 0.985 | <0.001 | 0.997 | |
| Plant protein intention | 0.214 | 0.001 | 0.077 | 0.220 | 0.118 | 0.139 | |
| Animal food intention | −0.041 | 0.572 | 0.060 | 0.399 | −0.241 | 0.002 | |
| Fruits and vegetables intention | 0.002 | 0.974 | −0.046 | 0.450 | 0.092 | 0.250 | |
|
Moral satisfaction | Meat, poultry, and seafood | −0.051 | 0.500 | −0.002 | 0.981 | 0.001 | 0.993 |
| Meat | −0.184 | 0.021 | 0.061 | 0.432 | −0.118 | 0.140 | |
| Fruits | 0.077 | 0.279 | −0.011 | 0.872 | −0.037 | 0.640 | |
| Vegetables | 0.028 | 0.714 | 0.126 | 0.096 | −0.029 | 0.714 | |
| Plant protein | 0.123 | 0.117 | −0.026 | 0.739 | −0.069 | 0.388 | |
| Plant protein intention | 0.147 | 0.023 | 0.045 | 0.479 | 0.083 | 0.298 | |
| Animal food intention | −0.182 | 0.010 | 0.070 | 0.309 | 0.019 | 0.817 | |
| Fruits and vegetables intention | 0.005 | 0.933 | −0.046 | 0.443 | −0.049 | 0.539 |
Publisher’s Note: MDPI stays neutral with regard to jurisdictional claims in published maps and institutional affiliations. |
© 2021 by the authors. Licensee MDPI, Basel, Switzerland. This article is an open access article distributed under the terms and conditions of the Creative Commons Attribution (CC BY) license (https://creativecommons.org/licenses/by/4.0/).
Share and Cite
Lim, T.J.; Okine, R.N.; Kershaw, J.C. Health- or Environment-Focused Text Messages as a Potential Strategy to Increase Plant-Based Eating among Young Adults: An Exploratory Study. Foods 2021, 10, 3147. https://0-doi-org.brum.beds.ac.uk/10.3390/foods10123147
Lim TJ, Okine RN, Kershaw JC. Health- or Environment-Focused Text Messages as a Potential Strategy to Increase Plant-Based Eating among Young Adults: An Exploratory Study. Foods. 2021; 10(12):3147. https://0-doi-org.brum.beds.ac.uk/10.3390/foods10123147
Chicago/Turabian StyleLim, Tze Joo, Richard Nii Okine, and Jonathan C. Kershaw. 2021. "Health- or Environment-Focused Text Messages as a Potential Strategy to Increase Plant-Based Eating among Young Adults: An Exploratory Study" Foods 10, no. 12: 3147. https://0-doi-org.brum.beds.ac.uk/10.3390/foods10123147