
Separation of Fructosyl Oligosaccharides in Maple Syrup by Using Charged Aerosol Detection

Pathological and Biomolecule Analyses Laboratory, Faculty of Pharmacy, Kindai University, 3-4-1 Kowakae, Higashiosaka 577-8502, Japan
*
Author to whom correspondence should be addressed.
Foods 2021, 10(12), 3160; https://doi.org/10.3390/foods10123160
Submission received: 4 November 2021
/
Revised: 7 December 2021
/
Accepted: 16 December 2021
/
Published: 20 December 2021
/
Corrected: 31 May 2023
(This article belongs to the Special Issue Application of Chromatography to Food Analysis)
Abstract
:Fructosyl oligosaccharides, including fructo-oligosaccharide (FOS), are gaining popularity as functional oligosaccharides and have been found in various natural products. Our previous study suggested that maple syrup contains an unidentified fructosyl oligosaccharide. Because these saccharides cannot be detected with high sensitivity using derivatization methods, they must be detected directly. As a result, an analytical method based on charged aerosol detection (CAD) that can detect saccharides directly was optimized in order to avoid relying on these structures and physical properties to clarify the profile of fructosyl oligosaccharides in maple syrup. This analytical method is simple and can analyze up to hepta-saccharides in 30 min. This analytical method was also reliable and reproducible with high validation values. It was used to determine the content of saccharides in maple syrup, which revealed that it contained not only fructose, glucose, and sucrose but also FOS such as 1-kestose and nystose. Furthermore, we identified neokestose as a maple syrup content. It has only been found in a few natural foods as a fructosyl oligosaccharide. These findings help to shed light on the saccharides profile of maple syrup.
Keywords:
HPLC; charged aerosol detection; CAD; fructosyl oligosaccharide; FOS; maple syrup; neokestose; 1-kestose; nystose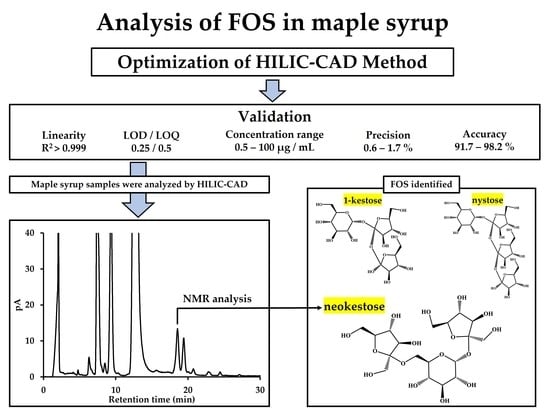
1. Introduction
Maple syrup is a popular natural sweetener made by boiling sap from sugar maple trees. As the season progresses, maple syrup’s color darkens, and it is classified into four grades: golden, amber, dark, and very dark [1]. Maple syrup has various biological effects, and it has also been reported that different grades of maple syrup could have different biological effects [2,3,4,5,6]. Although maple syrup has a low glycemic index (GI), it is mostly sucrose with a small amount of glucose and fructose [5,7,8,9]. It was reported that maple syrup contains pentoses, such as xylose, arabinose, and ribose, and polysaccharides, such as inulin [10,11]. Our previous study discovered that maple syrup contains a fructosyl oligosaccharide known as blastose [12]. Furthermore, this study also suggested the presence of an unidentified compound in maple syrup that was considered to be fructosyl oligosaccharide with a polymerization degree of at least three.
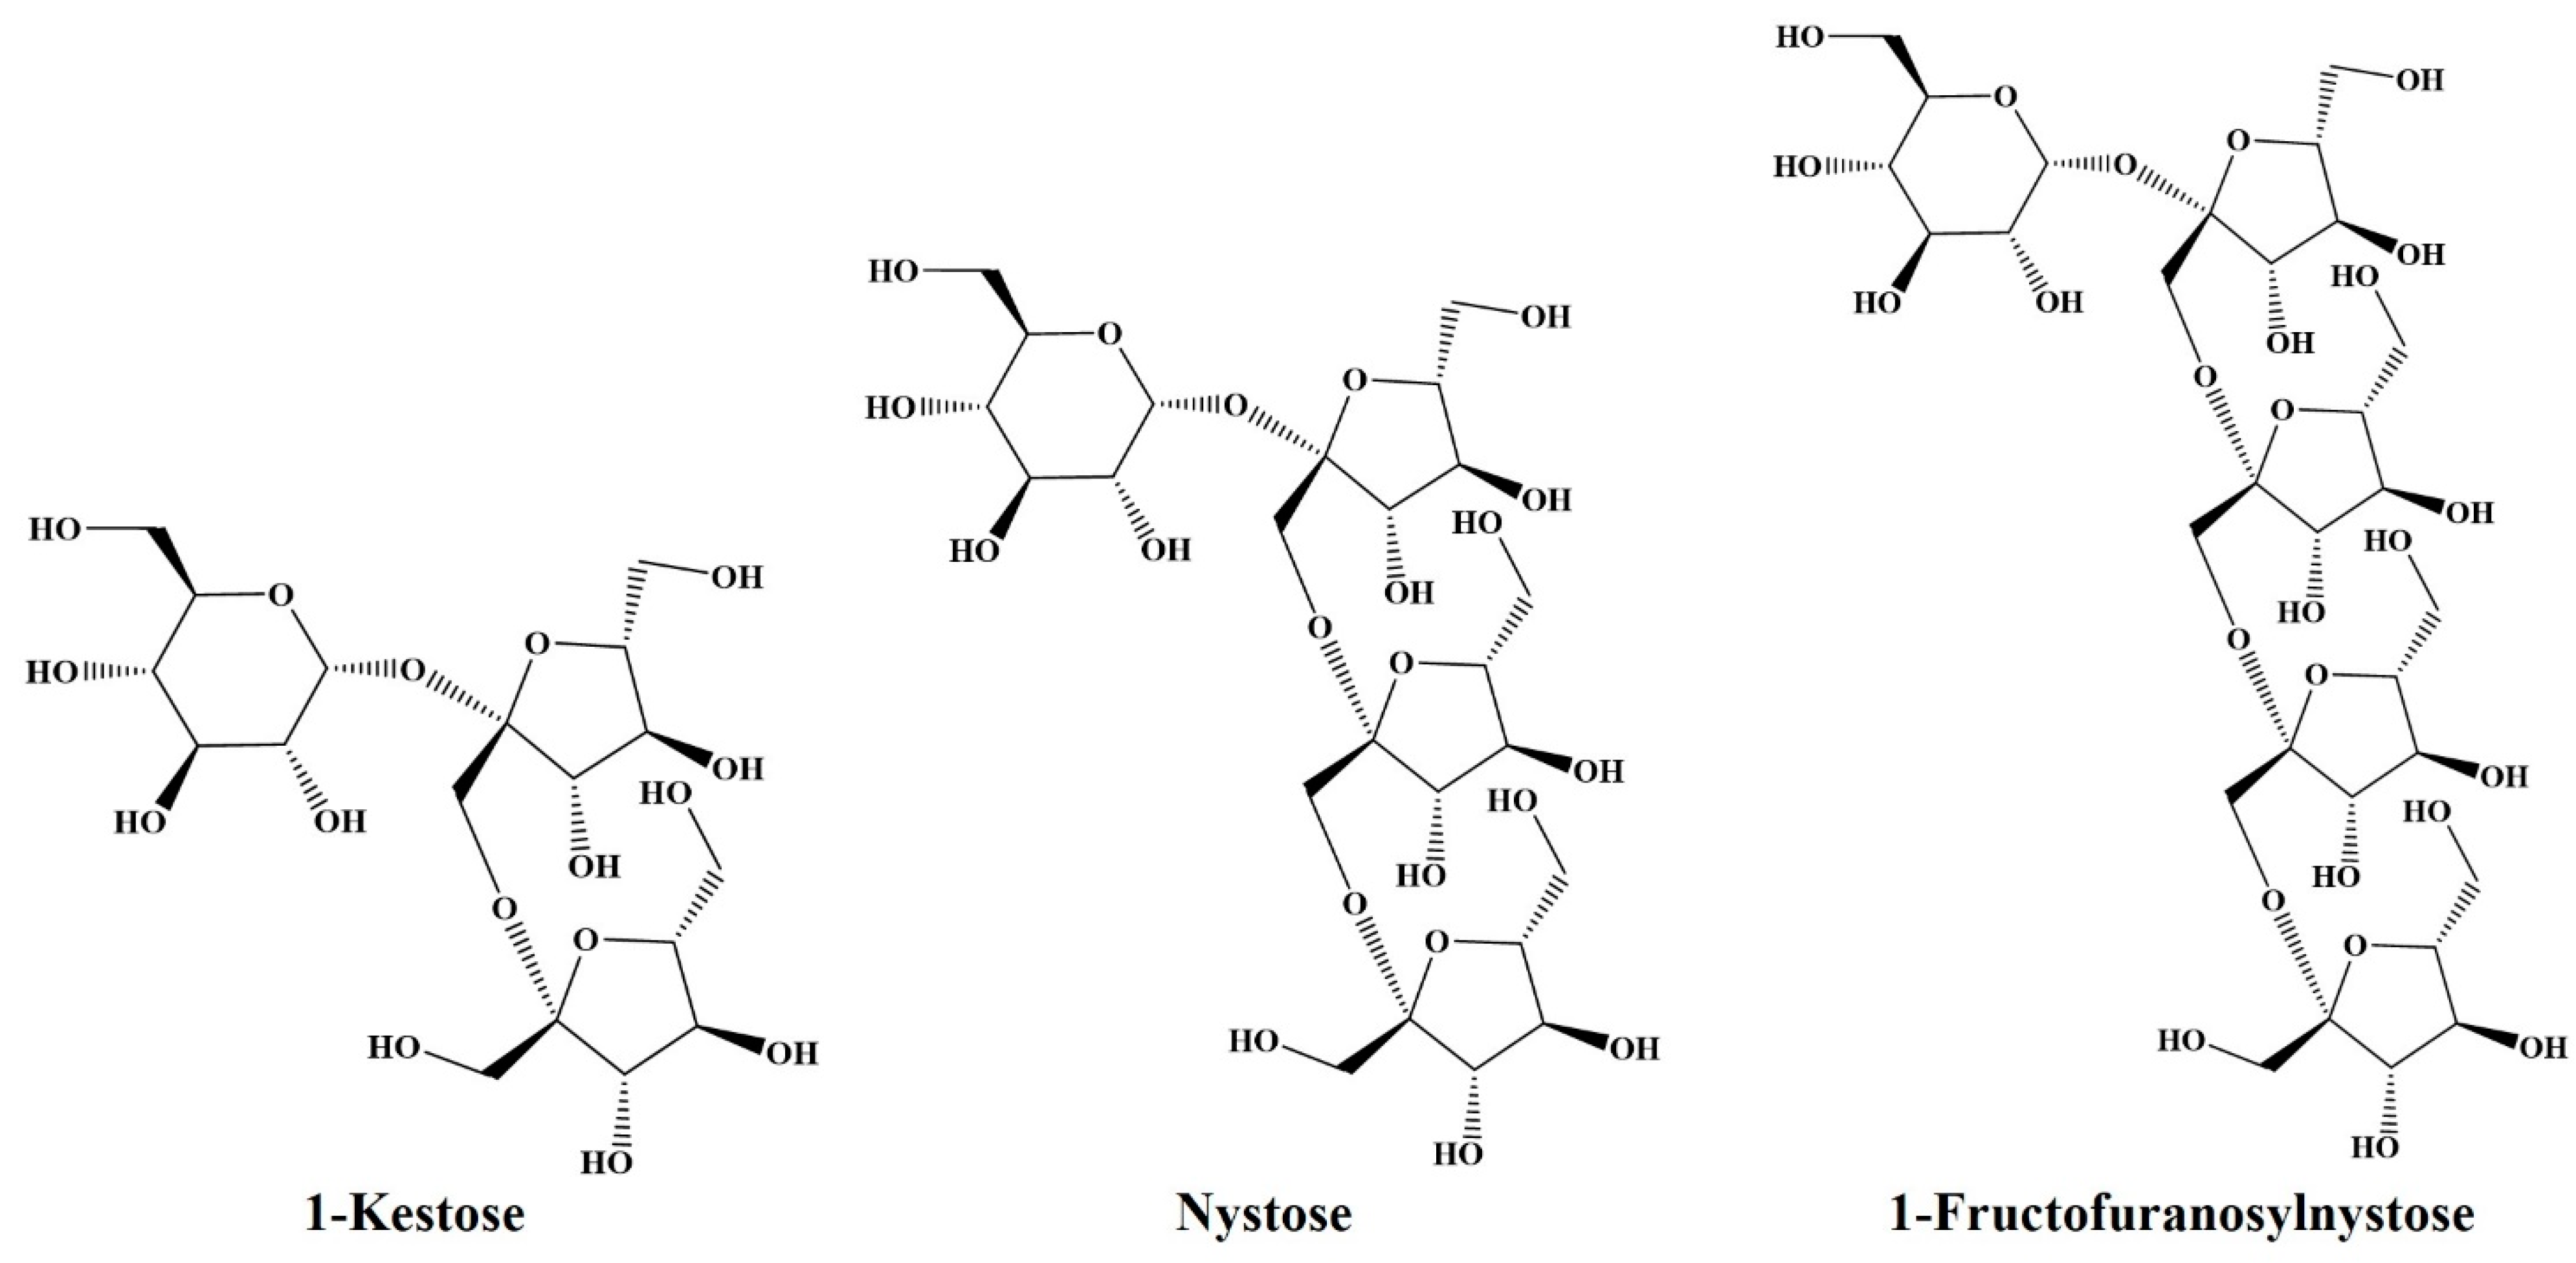
Recently, fructosyl oligosaccharides have gained popularity, with a 1-kestose, nystose and 1-fructofuranosylnystose serving as examples (Figure 1). These saccharides are known as fructo-oligosaccharides (FOS); they have been reported to have functions such as indigestibility and prebiotics, which are beneficial to human health [13,14]. Although these saccharides have been found in natural products such onion, burdock, and banana [15,16,17,18,19], the amounts are minute. It is critical to quantify FOS in order to make effective use of natural products containing FOS as functional foods. However, due to the capping of the aldose-reducing terminal by fructose, FOS cannot be analyzed with high sensitivity using derivatization methods. As a result, there is a need for an analytical approach with high sensitivity that can directly analyze FOS.
Charged aerosol detection (CAD), refractive index detection (RID), and pulsed amperometric detection (PAD) are analytical methods for saccharide detection [20,21,22]. Although RID is used for routine analysis and the analysis of known compounds, it has been reported that the LOQ for saccharides analysis by HPLC-RID is in the 0.18–0.30 g/L range [22]. On the other hand, PAD can analyze several saccharides with high resolution; it requires an anion exchange column and sodium hydroxide as the mobile phase. Because desalting is required, it is challenging to identify unidentified compounds in natural products. As a solution to these issues, CAD has become widely used in recent years. CAD is more versatile and has a more comprehensive detection range than RID. Its capabilities include detecting a wide range of semi- and non-volatile compounds such as saccharides but also lipids, amino acids, and peptides [23,24,25,26]. Its responsiveness is independent of the analyte’s molecular structure or physical properties. Therefore, unknown compounds can be quantified using known compounds [27]. These properties are ideal for quantifying neutral saccharides with no UV absorption and analyzing compounds that cannot be derivatized, such as FOS. Because gradient elution for CAD is possible, it is possible to analyze unidentified oligosaccharides that are likely to be overlooked by RID methods in the analysis of natural products. As a result, CAD can detect trace amounts of unidentified oligosaccharides found in natural products. Although several CAD applications for analyzing aldoses such as glucose have been reported [20,23], it has not been reported for analyzing saccharides fructosyl oligosaccharides including FOS.
This study aims to optimize the analysis method using FOS standards by hydrophilic interaction chromatography (HILIC)-CAD to clarify the profile of fructosyl oligosaccharides, including FOS in maple syrup. This optimized method is simple, compact, reliable, and reproducible. While the RID method could only detect sucrose, glucose, and fructose, this optimized method using CAD was able to observe the several rare saccharides as well as the major saccharides such as sucrose. In addition, its quick application was used to identify and quantify several FOS in maple syrup precisely. Furthermore, we showed that maple syrup contained neokestose [28], which is rarely reported in natural foods, as a constituent of maple syrup.
2. Materials and Methods
2.1. Reagents and Chemicals
Fructose, glucose, and sucrose were purchased from Nacalai Tesque, Inc. (Kyoto, Japan). Nystose, 1-kestose, and 1-fructofuranosylnystose were purchased from FUJIFILM-Wako Pure Chemicals Co (Osaka, Japan). Maple Farms Japan, Inc. (Osaka, Japan) generously provided all maple syrup of grade A and sap. These maple syrups are made from sugar maple (Acer saccharum) and produced by Bascom Maple Farms, Inc. (Acworth, NH, USA). All other chemicals were of the highest purity and obtained from Nacalai Tesque, Inc. (Kyoto, Japan).
2.2. Sample Preparation
All saccharide standards were prepared at the following concentrations: 0.5, 1.0, 5.0, 10, 25, 50, 75, and 100 μg/mL. The maple syrup was dried and then dissolved in water. This solution was centrifuged for 5 min at 3000× g. The supernatant was filtered via a 0.45 μm filter (Merck Millipore, Darmstadt, Germany), and acetonitrile was added to the filtrate to adjust the solvent concentration to 75% acetonitrile.
2.3. Analysis by High-Performance Liquid Chromatography with CAD (HPLC-CAD)
Maple syrup samples were analyzed using an LC 10 Advp system (Shimadzu Corporation, Kyoto, Japan) equipped with a Corona Veo detector (Thermo Fisher Scientific, Inc., Waltham, MA, USA). Separation was performed using an Asahipak NH2P-50 4E column (5 µm, 4.6 mm internal diameter ×250 mm, Showa Denko K.K., Tokyo, Japan) as an HILIC column. The mobile phase consisted of deionized water (solvent A) and acetonitrile (solvent B) with multi-gradient elution in 75% solvent B from 0 to 10 min and 75 to 50% B from 10 to 30 min. At room temperature (~23 °C), the flow rate of 1 mL/min. The injection volume was set to 20 µL. The data processing was carried out using Chromeleon 7.2.2 software (Thermo Fisher Scientific, Massachusetts, MA, USA). The pure nitrogen gas for the CAD was flowed by an AT-2NP-CAD (AIR-TEC Co., Kanagawa, Japan). The sampling rate was set to 5.0 Hz with a filter constant of 5.0 s. The response and signal correction power function was set to 1.0. The fractionate of a target oligosaccharide was carried out using an Asahipak NH2P-50 10E column (5 µm, 10.0 mm internal diameter ×250 mm; Showa Denko K.K.) with 75% acetonitrile as the mobile phase was. A flow rate of 2 mL/min was used for isocratic elution with Adjustable Flow Splitter (Thermo Fisher Scientific Inc., Waltham, MA, USA) as a post-column type splitter. The split ratio was 1:20, with the low-flow outlet directed to CAD. The remaining (~95%) volume was then collected from the splitter’s high-flow outlet. The other conditions were as previously described.
2.4. HPLC-CAD Method Validation
Based on the International Council for Harmonization and Technical Requirements (ICH) guidelines [29], the developed HPLC-CAD method was validated in terms of concentration range, linearity, limit of detection (LOD), limit of quantitation (LOQ), precision, and recovery. All experiments were performed at least three times.
2.4.1. Linearity
The linearity experiments were performed with eight different concentrations (0.5–100 µg/mL) of standards. Each calibration curve was fitted to a linear, quadratic, or logarithmic equation, and each equation’s correlation coefficient was calculated. Additionally, the concentration error was calculated by fitting the area value of eight standards to each equation.
2.4.2. LOD and LOQ
The LOD and quantification (LOQ) were estimated in accordance with ICH guidelines [29]. LOD and LOQ are defined as a signal-to-noise ratio of 3:1 and 10:1, respectively.
2.4.3. Precision
The repeatability of the analytical method was calculated to assess its precision. The precision was measured in terms of the relative standard deviation (RSD, %). Equation (1) was used to calculate the RSD of the area value obtained from each standard of 50 μg/mL. Furthermore, intra-day and inter-day precision were obtained by consecutively injecting nine working standards on the same day and three working standards on different days.
2.4.4. Accuracy
To investigate the recovery and validity of the analytical method, the recovery was calculated using Equation (2). FOSs, monosaccharides, di-saccharides standards (50 µg/mL) were added 10 mg, 1 mg, and 100 μg/mL very dark-grade maple syrup samples, respectively. The recovery was then calculated from the area values of the added sample, standard product, and maple syrup sample using the following equation.
where Cmaple is the determined concentration of saccharides in maple syrup.
2.5. Size Exclusion Chromatography
The excluding of the large-molecular-weight components in the maple sap was carried out by Ultracel 10 kDa ultrafiltration discs (Merck Millipore, Darmstadt, Germany). To separate the target oligosaccharide and other saccharides in maple sap, the filtrate was applied on an Econo-column (1 m × 25 mm internal diameter; Bio-Rad Laboratories, Inc., Hercules, CA, USA) packed with Sephadex G-15 gel (GE Healthcare, Boston, MA, USA). A Bio-Rad fraction collector Model 2110 (Bio-Rad Laboratories, Inc.) was used to collect each fraction, which consisted of 200 drops. Water was used for elution and washing.
2.6. Nuclear Magnetic Resonance (NMR)
The structural analysis of the target oligosaccharide was carried out using a JNM-ECA 800 model (Jeol Resonance, Inc., Tokyo, Japan) and 1H and 13C-NMR spectroscopic data were recorded at 800 and 200 MHz, respectively. The unidentified oligosaccharide for NMR analysis was dissolved in D2O. Radiant-selected pulse sequences were used to 1H–1H correlation spectroscopy (COSY), 1H–13C heteronuclear single-quantum correlation spectroscopy (HSQC), 1H–13C heteronuclear multiple-bond correlation spectroscopy (HMBC) and 1H–1H nuclear overhauser effect spectroscopy (NOESY) spectra. Chemical shifts are given in the δ-scale (ppm), and coupling constants J H,H are given in Hz.
2.7. Statistical Analysis
The statistical analyses were performed using Microsoft Office Excel 365 (Redmond, Washington, WA, USA). All experiments were performed at least three times. All data are expressed as the mean ± standard deviations (S.D.) of the mean.
3. Results
3.1. Developments of the Method for the Separation of FOSs
To analyze FOS using HPLC with CAD, the separation method was optimized using glucose, fructose, sucrose, and FOSs (1-kestose, nystose, and 1-fructofuranosylnystose) standards (Figure 1). At room temperature, isocratic runs were investigated at a flow rate of 1 mL/min flow with acetonitrile:water ratios of 60:40, 65:35, 70:30, 75:25, and 80:20 were investigated (Figure S1). When performing the isocratic elution with acetonitrile at a concentration of 70% or higher, good resolution between each standard was obtained.
Subsequently, to compactly separate FOSs while maintaining the separation of mono- and disaccharides, we decided to perform gradient elution after 10 min. The mobile phase consisted of a 70:30 isocratic ratio for 10 min, followed by a 70% to 50% acetonitrile linear gradient for 20 min (Figure 2A). A linear gradient elution had a slight effect on the 1-kestose and nystose peaks, but it did shorten the retention time of the 1-fructofuranosylnystose peak. The retention times for 1-kestose, nystose, and 1-fructofuranosylnystose were significantly reduced for a linear gradient of 75% to 50% acetonitrile (Figure 2B). In addition, the shapes of these peaks were improved. The retention times of the sucrose, 1-kestose, nystose, and 1-fructofranosylnystose peaks were significantly reduced in linear gradients of acetonitrile from 80% to 50%. The peak retention times for 1-kestose, nystose, and 1-fructofuranosylnystose were 24.2 min, 26.4 min, and 28.1 min, respectively. Tri-, tetra-, and penta-saccharides were retained for about 4 min, narrowing the separation window (Figure 2C). These findings indicated that the multi-gradient method using 75% acetonitrile as the starting eluent can be used to analyze mono- to penta-saccharides including FOSs uniformly with high resolution. Therefore, since it may provide sufficient resolution for the analysis of small oligosaccharides as well as fructosyl oligosaccharides in maple syrup, isocratic gradient elution with 75% acetonitrile was selected as the optimal condition. On the other hand, the polymerization degree of oligosaccharides that could be analyzed by this analytical method was investigated. This analytical method was able to analyze up to hepta-saccharides 30 min after analyzing inulin oligosaccharides (Figure S2).
3.2. Validation of the Optimized Method
The nonlinear calibration range, correlation coefficient (R2), LOD, LOQ, intra-day precision, inter-day precision, and recovery of this analytical method were all evaluated. Table 1 summarizes the data pertaining to method validation. Each quantification range for all standards includes 0.5–100 μg/mL, with three digits including LOQ. It can be presented as a quadratic equation y = ax2 + bx + c from the responses of evaluated ranges. The correlation coefficient (R2) expressed linearity of at least R2 > 0.999 for all saccharides. The LOD and LOQ for all standards were 0.25 μg/mL and 0.5 μg/mL, respectively. Precision was 0.9% or less intra-day and 1.8% or less inter-day. The recovery of all standards was calculated using the maple syrup sample described below, and good values of 91% or higher were obtained for all standards.
3.3. Analysis of Carbohydrates Observed in Maple Syrup
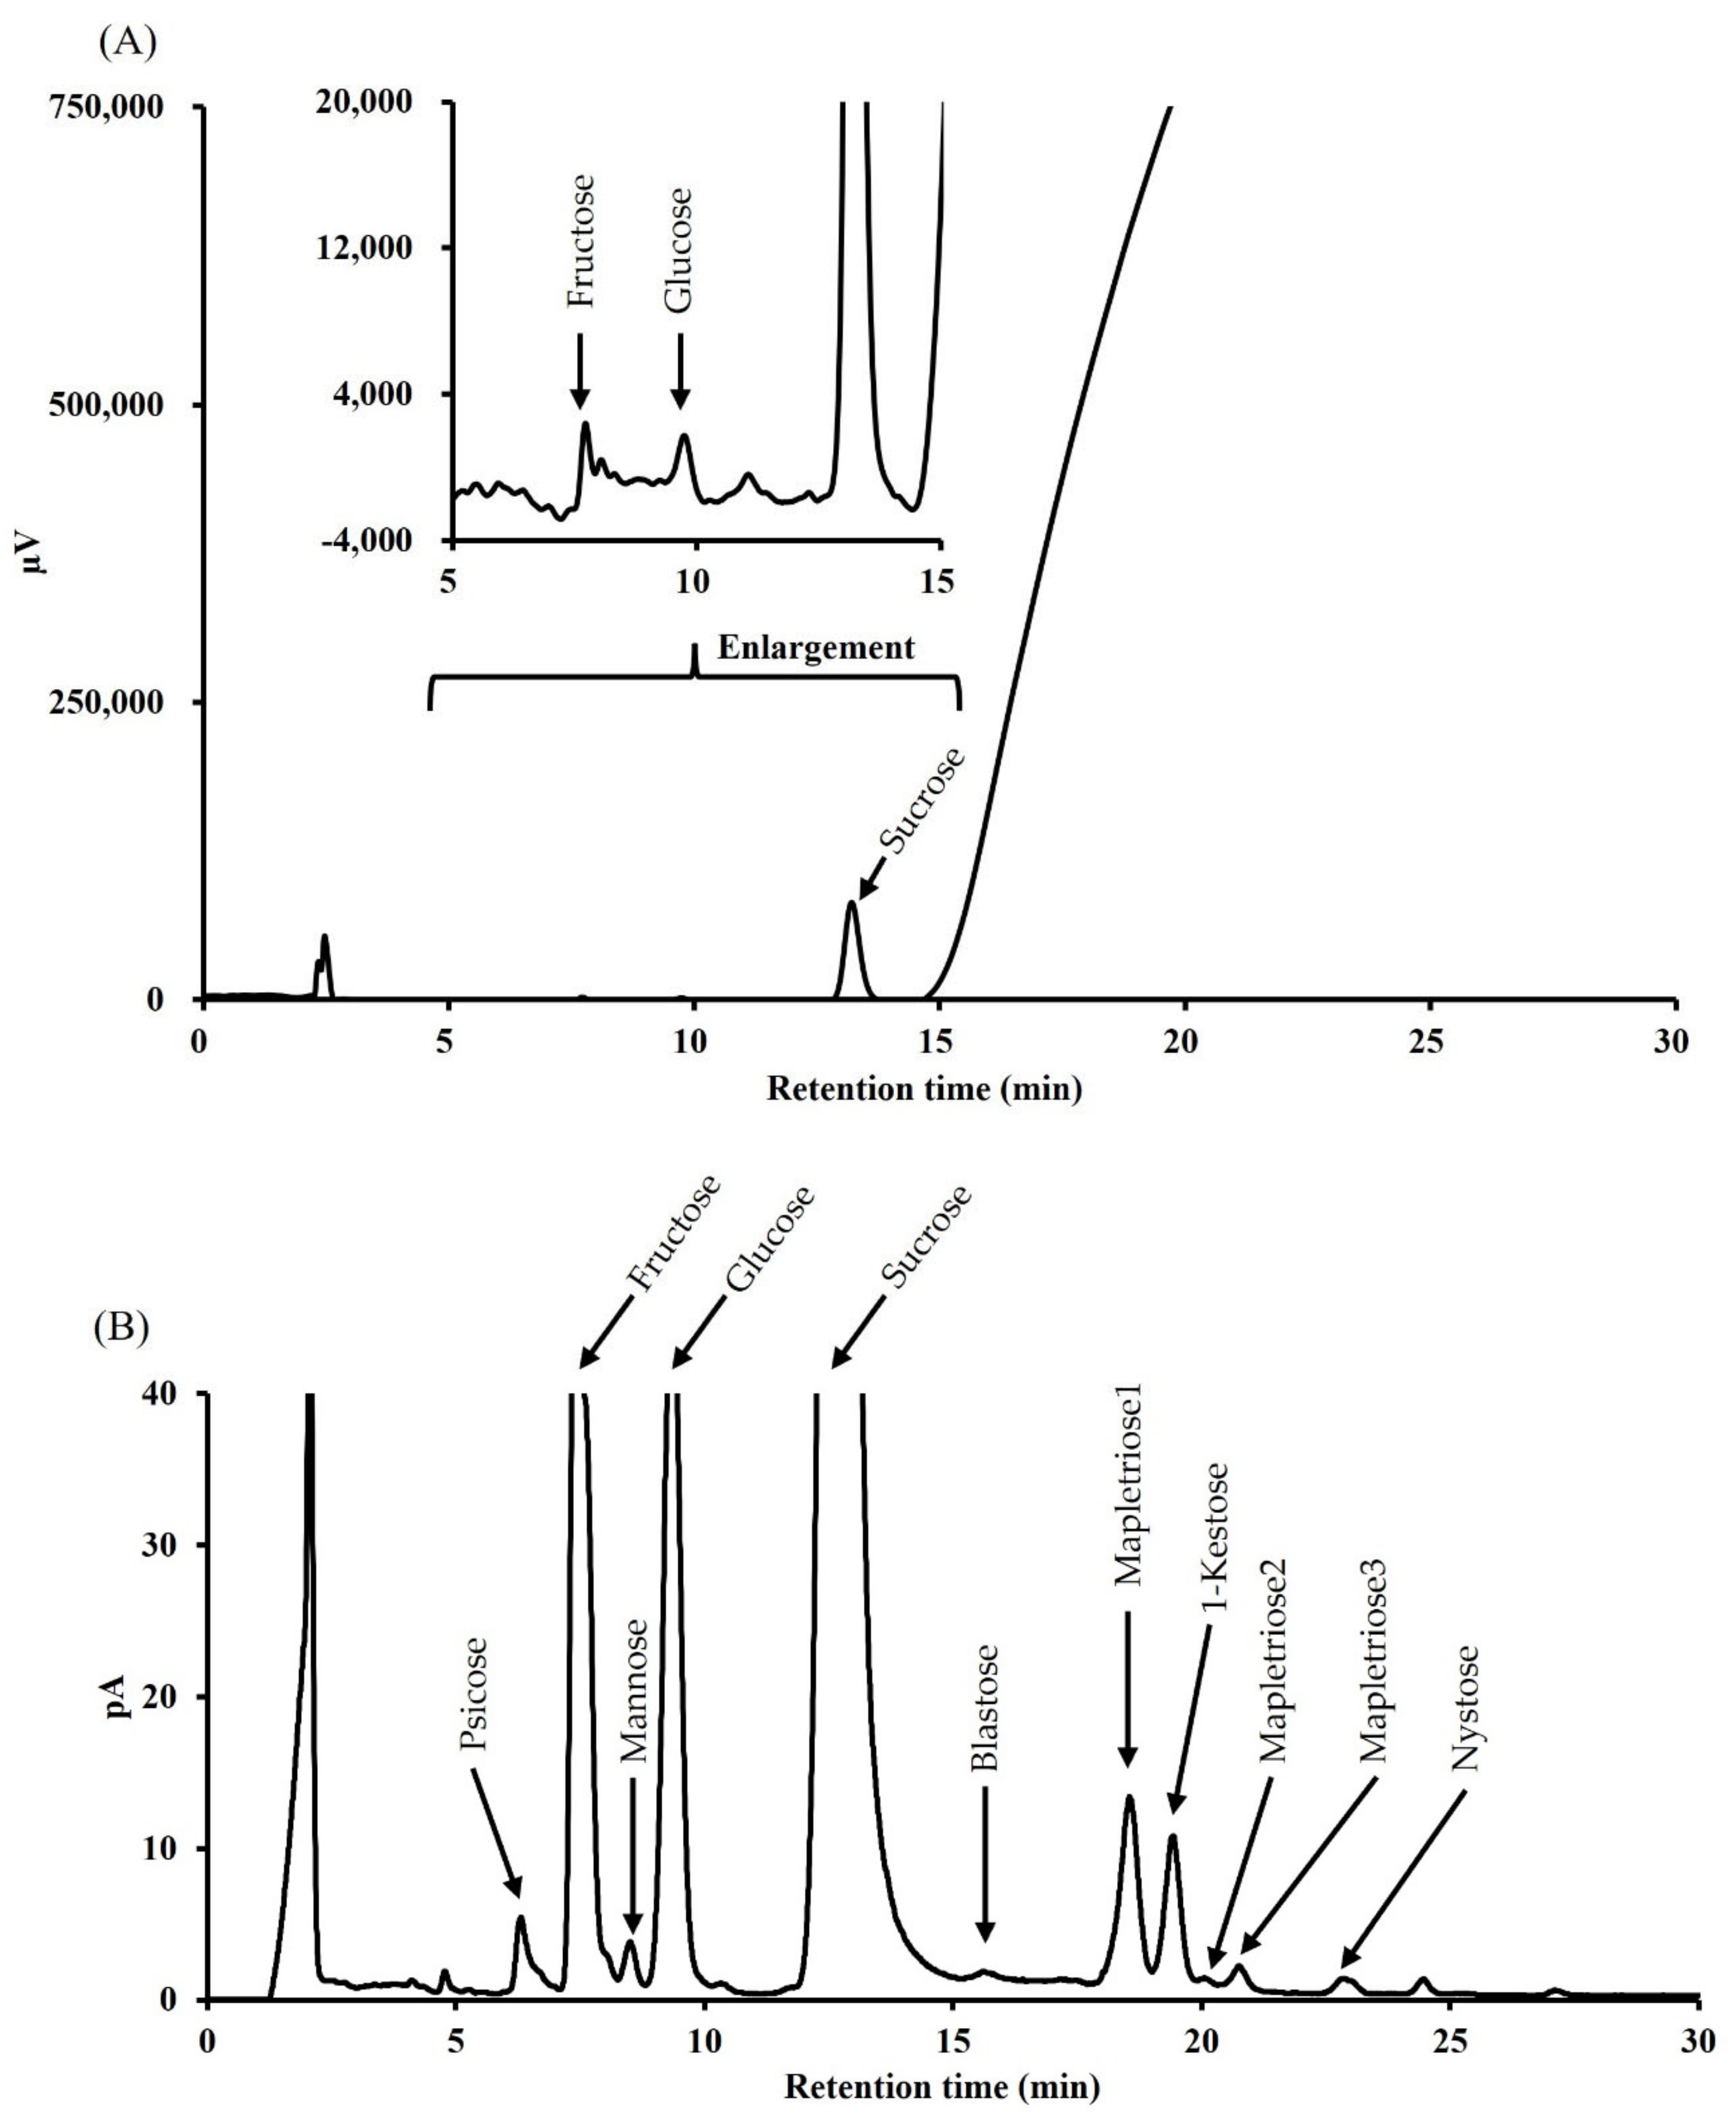
This optimized method was compared to the RID method by analyzing maple syrup samples. Figure 3 showed the carbohydrates found in very dark-grade maple syrup using RID and CAD. The mobile phase consisted of a 75:25 isocratic ratio for 10 min, followed by a 75% to 50% acetonitrile linear gradient for 20 min. As a result, only major saccharides such as sucrose were observed by the RID method. However, due to the baseline drift caused by linear gradient elution, peaks could not be observed after sucrose (Figure 3A). On the other hand, in the CAD method, for monosaccharides, the peak of psicose was observed, which could not be derivatized, as well as fructose. This optimized method separated the saccharides found in maple syrup into a tetra-saccharide. The peaks of 1-kestose and nystose were observed, but 1-fructofuranosylnystose was not found in maple syrup (Figure 3B).
On the other hand, any unidentified peaks were observed at 18–21 min of this chromatogram, which was predicted to be a trisaccharide based on the retention time. We called these unidentified saccharides “mapletrioses” in this manuscript. Mapletrioses were identified as three distinct peaks and were numbered in ascending order of retention time. Mapletriose1 was the fourth highest peak in maple syrup after sucrose, glucose, and fructose, and it slightly overlapped with the peak of 1-kestose. Mapletriose1 and 1-kestose had a resolution of 1.4. On the other hand, mapletriose2 and 3 were present in trace amounts. Although we attempted to identify mapletrioses using standards available on the general reagent market, these saccharides were unable to be identified.
Subsequently, saccharides quantification in all grades of maple syrup was performed using standard calibration curves (Table 2). The amount of fructose and glucose in maple syrup increased as the season progressed. Though sucrose amount did not change significantly by well controlled brix, the sucrose amount decreased to approximately 55% in the very dark grade. Additionally, 1-kestose and nystose levels increased as the season progressed, as did monosaccharides. On the other hand, we also attempted to quantify mapletriose1 from its area value using the 1-kestose calibration curve. The predictive quantity of mapletriose1 increased with the late season, and each grade maple syrup contained 20.6, 19.6, 31.2, and 40.6 μg/10 mg. Since the predicted values of mapletriose1 in the saccharides composition of maple syrup were not negligible, we decided to identify it.
3.4. Structural Analysis of Mapletriose1 by NMR
The LC-ESI-MS/MS spectrum of mapletriose1, which was isolated from maple sap according to the method reported by us [12], showed a peak at m/z 503.1 due to a qua-si-molecular ion [M–H]–, suggesting that mapletriose1 has a trisaccharide structure. Its 200 MHz 13C NMR spectrum showed 18 peaks reasonably related to the 18 carbons of a trisaccharide as shown in Table 3. Chemical shift values of these 13C NMR signals showed perfect correlations with those of β-d-fructofuranosyl 6-O-β-d-fructofuranosyl-β-d-glucopyranoside (neokestose) [30] with respect to all the signals with deviations within ca. 0.1 ppm. The connections from C1-F to C6-F and from C1”-F to C6”-F of two d-fructofuranose units as well as that from C1’-G to C6’-G of d-glucopyranose unit were clearly confirmed by COSY, HSQC, and HMBC experiments. All signals in the 800 MHz 1H NMR spectrum were also unambiguously assigned as shown in Table 3. However, signals due to C2-F and C2″-F carbons were indistinguishable from each other because of their very close chemical shift values (δC 106.42 and δC 106.43). Therefore, although the signals due to C2-F and C2″-F carbons showed HMBC correlations with signals due to H1-G (δH 5.39) and H6-G (δH 3.92) protons of d-glucose, the detailed assignment regarding the connecting positions of the fructose units with the d-glucose unit was impossible. Fortunately, the depicted structure of neokestose in Figure 4 was supported by the NOESY correlations between H4-F (δH 4.05) and H1-G protons.
4. Discussion
An HILIC column is commonly used for saccharide analysis. In this study, an amino-type HILIC column was used. Its distinguishing feature is the separation of saccharides based on the degree of polymerization. The retention time can, thus, be used to predict the degree of polymerization of unidentified saccharides. However, using only isocratic elution, it is difficult to rapidly analyze the saccharide with a degree of polymerization of three or more. As a result, multi-gradient elution was used to analyze these saccharides rapidly and with high sensitivity. If highly polymerizable saccharides or mono- and di-saccharides are expected to be present in samples, it may be preferable to analyze them with acetonitrile at 70 and 80% concentrations, respectively. However, because our target in this study was fructosyl oligosaccharides in maple syrup, we used 75% acetonitrile isocratic elution for 10 min followed by linear gradient to 50% acetonitrile. In addition, inulin was analyzed using this optimized method, and up to hepta-saccharides could be analyzed within 30 min, which is comparable to the analysis time of PAD-based methods specialized for saccharides analysis [9,31,32,33]. Furthermore, we validated this optimized method and demonstrated its reliability with good results. Therefore, this optimized method is also suitable for routine analysis of fructosyl oligosaccharides such as FOS.
Subsequently, we used this optimized method to analyze saccharides in maple syrup. In the current study, we found 1-kestose, nystose, and several unidentified tri-saccharides referred to as “mapletrioses” from maple syrup based on the carefully analyzed FOSs of maple syrup. Recent studies have analyzed the saccharides in maple syrup using analytical methods using PAD, but there are no reports of these saccharides [9]. Because 1-kestose is the smallest unit of inulin and nystose is fructosylated 1-kestose, these results support previous studies that suggested that maple syrup contained inulin [11]. Our previous studies could suppress the rise in plasma glucose levels [2,3]. This function became increasingly noticeable as the season progressed. Because maple syrup contains various saccharides, including fructosyl oligosaccharides, we hypothesized that this function is related to the saccharide content of maple syrup. As a result of quantifying FOSs in maple syrup in the current study, it was discovered that FOSs contents increased as the season progressed, as with maple syrup’s function. These FOS have been linked to the indigestible function [14]. Therefore, the content of these FOSs may be related to maple syrup’s function in suppressing the increase in plasma glucose level.
Our previous study found blastose in maple syrup [12]. This study also showed that blastose levels were rising due to invertase digestion of maple syrup. Invertase, also known as β-fructofuranosidase, can cleave a glycosyl bond between fructose and glucose from the fructose side. This occurrence suggested that maple syrup contained an unidentified fructosyl oligosaccharide that was considered to be fructosyl blastose. On the other hand, blastose is a disaccharide composed of fructose and glucose with a β(2→6) linkage, and its structure is not shared by 1-kestose or nystose, but neokestose, which is a fructosyl blastose having β(2→6) linkage, is also known as neo-inulin type fructosyl oligosaccharide or neo-FOS. Although neokestose was isolated from maple sap by Haq, S., et al., in 1961 [28] and was reported as a transfructosylation product by levansucrase [34,35], few papers have reported on the qualitative and quanti-tative analyses of neokestose in natural foods, because its standard is not available on the general reagent market.
In blastose, C-2 of fructose is linked to C-1 of glucose, a structural feature of neokestose (Figure S4). In addition, blastose has been reported to inhibit glycosidase activity. Because the structure of neokestose includes blastose, a functional oligosaccharide, we expect neokestose to have some function similar to blastose. As a result, in future research, we should examine the function of neokestose. Furthermore, we believe that clarifying this observation will lead to the detailed mechanism by which maple syrup suppresses the rise in plasma glucose level.
In contrast, four unidentified peaks, including mapletriose2 and 3, were confirmed in the current study. It is expected that qualitative analysis will be complicated without standards. However, further studies are needed to identify these peaks via isolation, purification, and structural analysis of these compounds to reveal the saccharide profile of maple syrup fully.
5. Conclusions
In this study, we used CAD to optimize the analysis methods for fructosyl oligosaccharides in order to clarify the saccharide profile in maple syrup. This method is simple and compact, and it can analyze up to hepta-saccharides within 30 min. In addition, we used this analytical method to precisely determine the mono- and di-saccharides and fructosyl oligosaccharides, including FOS, in maple syrup of all grades. Maple syrup contained sucrose, glucose, and fructose as major saccharides; it also contained FOS such as 1-kestose and nystose. Furthermore, we identified a fructosyl oligosaccharide neokestose in maple syrup. This fructosyl oligosaccharide is rarely reported in natural foods. Because of their structural characteristics, these fructosyl oligosaccharides, including FOSs, may be related to the function of maple syrup.
Supplementary Materials
The following are available online at https://0-www-mdpi-com.brum.beds.ac.uk/2304-8158/10/12/3160/s1, Figure S1: Chromatograms of saccharide standards in different isocratic conditions, Figure S2: Chromatograms of inulin saccharides, Figure S3: The 2D NMR spectra of neokestose, Figure S4: The structures of blastose and neokestose with the blastose part depicted in red.
Author Contributions
Conceptualization, A.T.; methodology, K.S. and K.M.; software, K.S. and K.M.; validation, K.S., K.M. and A.T.; formal analysis, K.S., K.M. and A.T.; investigation, K.S., T.Y. and A.T.; resources, A.T.; data curation, K.S. and A.T.; writing—original draft preparation, K.S. and T.Y.; writing—review and editing, T.Y. and A.T.; visualization, K.S.; supervision, A.T.; project administration, A.T.; funding acquisition, A.T. All authors have read and agreed to the published version of the manuscript.
Funding
This research received no external funding.
Data Availability Statement
The data presented in this study are available in the article and its supplementary materials.
Acknowledgments
This sample for this study was provided by Maple Farms Japan, Inc.
Conflicts of Interest
The authors declare no conflict of interest.
References
- Skinner, C.B.; DeGaetano, A.T.; Chabot, B.F. Implications of twenty-first century climate change on Northeastern United States maple syrup production: Impacts and adaptations. Clim. Chang. 2009, 100, 685–702. [Google Scholar] [CrossRef]
- Nagai, N.; Ito, Y.; Taga, A. Comparison of the enhancement of plasma glucose levels in type 2 diabetes Otsuka Long-Evans Tokushima fatty rats by oral administration of sucrose or maple syrup. J. Oleo Sci. 2013, 62, 737–743. [Google Scholar] [CrossRef]
- Nagai, N.; Yamamoto, T.; Tanabe, W.; Ito, Y.; Kurabuchi, S.; Mitamura, K.; Taga, A. Changes in plasma glucose in Otsuka Long-Evans Tokushima fatty rats after oral administration of maple syrup. J. Oleo Sci. 2015, 64, 331–335. [Google Scholar] [CrossRef] [PubMed]
- Yamamoto, T.; Nishita, T.; Taga, A. Dark-colored maple syrup treatment induces S-phase cell cycle arrest via reduced proliferating cell nuclear antigen expression in colorectal cancer cells. Oncol. Lett. 2019, 17, 2713–2720. [Google Scholar] [CrossRef]
- Yamamoto, T.; Sato, K.; Kubota, Y.; Mitamura, K.; Taga, A. Effect of dark-colored maple syrup on cell proliferation of human gastrointestinal cancer cell. Biomed. Rep. 2017, 7, 6–10. [Google Scholar] [CrossRef] [PubMed]
- Yamamoto, T.; Uemura, K.; Moriyama, K.; Mitamura, K.; Taga, A. Inhibitory effect of maple syrup on the cell growth and invasion of human colorectal cancer cells. Oncol. Rep. 2015, 33, 1579–1584. [Google Scholar] [CrossRef] [PubMed]
- Ball, D.W. The chemical composition of maple syrup. J. Chem. Educ. 2007, 84, 1647–1650. [Google Scholar] [CrossRef]
- Perkins, T.D.; van den Berg, A.K. Chapter 4 maple syrup-production, composition, chemistry, and sensory characteristics. Adv. Food Nutr. Res. 2009, 56, 101–143. [Google Scholar]
- Mellado-Mojica, E.; Seeram, N.P.; López, M.G. Comparative analysis of maple syrups and natural sweeteners: Carbohydrates composition and classification (differentiation) by HPAEC-PAD and FTIR spectroscopy-chemometrics. J. Food Compos. Anal. 2016, 52, 1–8. [Google Scholar] [CrossRef]
- Taga, A.; Kodama, S. Analysis of reducing carbohydrates and fructosyl saccharides in maple syrup and maple sugar by CE. Chromatographia 2012, 75, 1009–1016. [Google Scholar] [CrossRef]
- Sun, J.; Ma, H.; Seeram, N.P.; Rowley, D.C. Detection of inulin, a prebiotic polysaccharide, in maple syrup. J. Agric. Food Chem. 2016, 64, 7142–7147. [Google Scholar] [CrossRef]
- Sato, K.; Nagai, N.; Yamamoto, T.; Mitamura, K.; Taga, A. Identification of a novel oligosaccharide in maple syrup as a potential alternative saccharide for diabetes mellitus patients. Int. J. Mol. Sci. 2019, 20, 5041. [Google Scholar] [CrossRef]
- Hidaka, H.; Tashiro, Y.; Eida, T. Proliferation of bifidobacteria by oligosaccharides and their useful effect on human health. Bifid-Microflora 1991, 10, 65–79. [Google Scholar] [CrossRef]
- Molis, C.; Flourie, B.; Ouarne, F.; Gailing, M.F.; Lartigue, S.; Guibert, A.; Bornet, F.; Galmiche, J.P. Digestion, excretion, and energy value of fructooligosaccharides in healthy humans. Am. J. Clin. Nutr. 1996, 64, 324–328. [Google Scholar] [CrossRef]
- Li, J.; Liu, X.; Zhou, B.; Zhao, J.; Li, S. Determination of fructooligosaccharides in burdock using HPLC and microwave-assisted extraction. J. Agric. Food Chem. 2013, 61, 5888–5892. [Google Scholar] [CrossRef]
- Der Agopian, R.G.; Soares, C.A.; Purgatto, E.; Cordenunsi, B.R.; Lajolo, F.M. Identification of fructooligosaccharides in different banana cultivars. J. Agric. Food Chem. 2008, 56, 3305–3310. [Google Scholar] [CrossRef] [PubMed]
- Chikkerur, J.; Samanta, A.K.; Kolte, A.P.; Dhali, A.; Roy, S. Production of short chain fructo-oligosaccharides from inulin of chicory root using fungal endoinulinase. Appl. Biochem. Biotechnol. 2019, 191, 695–715. [Google Scholar] [CrossRef]
- Zeaiter, Z.; Regonesi, M.E.; Cavini, S.; Labra, M.; Sello, G.; Di Gennaro, P. Extraction and characterization of inulin-type fructans from artichoke wastes and their effect on the growth of intestinal bacteria associated with health. BioMed. Res. Int. 2019, 2019, 1083952. [Google Scholar] [CrossRef] [PubMed]
- Kosasih, W.; Pudjiraharti, S.; Ratnaningrum, D.; Priatni, S. Preparation of inulin from Dahlia Tubers. Procedia Chem. 2015, 16, 190–194. [Google Scholar] [CrossRef]
- Agblevor, F.A.; Hames, B.R.; Schell, D.; Chum, H.L. Analysis of biomass sugars using a novel HPLC method. Appl. Biochem. Biotechnol. 2007, 136, 309–326. [Google Scholar] [CrossRef] [PubMed]
- Farine, S.; Versluis, C.; Bonnici, P.; Heck, A.; Peschet, J.; Puigserver, A.; Biagini, A. Separation and identification of enzymatic sucrose hydrolysis products by high-performance anion-exchange chromatography with pulsed amperometric detection. J. Chromatogr. A 2001, 920, 299–308. [Google Scholar] [CrossRef]
- Hadjikinova, R.; Petkova, N.; Hadjikinov, D.; Denev, P.; Hrusavov, D. Development and validation of HPLC-RID method for determination of sugars and polyols. J. Pharm. Sci. Res. 2017, 9, 1263–1269. [Google Scholar]
- Pitsch, J.; Weghuber, J. Hydrophilic interaction chromatography coupled with charged aerosol detection for simultaneous quantitation of carbohydrates, polyols and ions in food and beverages. Molecules 2019, 24, 4333. [Google Scholar] [CrossRef] [PubMed]
- Edwards, C.; Lawton, L.A. Assessment of microcystin purity using charged aerosol detection. J. Chromatogr. A 2010, 1217, 5233–5238. [Google Scholar] [CrossRef] [PubMed]
- Moreau, R.A. The analysis of lipids via HPLC with a charged aerosol detector. Lipids 2006, 41, 727–734. [Google Scholar] [CrossRef]
- Socia, A.; Foley, J.P. Direct determination of amino acids by hydrophilic interaction liquid chromatography with charged aerosol detection. J. Chromatogr. A 2016, 1446, 41–49. [Google Scholar] [CrossRef]
- Fukushima, K.; Hashiguchi, K.; Suzuki, T.; Okawara, M.; Sekiguchi, Y. Recent developments in charged aerosol detection technology and applications. Chromatogr. J. Sep. Detect. Sci. 2011, 32, 161–170. [Google Scholar]
- Haq, S.; Adams, G.A. Oligosaccharides from the sap of sugar maple (Acer saccharum Marsh). Can. J. Chem. 1961, 39, 1165–1170. [Google Scholar] [CrossRef]
- ICH Expert Working Group ICH Topic Q 2 (R1) Validation of Analytical Procedures: Text and Methodology Step 5 Note for Guidance on Validation of Analytical Procedures: Text and Methodology (cpmp/ich/381/95) Approval by Cpmp November 1994 Date for Coming into Operation. 1995. Available online: https://www.ema.europa.eu/en/documents/scientific-guideline/ich-q-2-r1-validation-analytical-procedures-text-methodology-step-5_en.pdf (accessed on 7 August 2021).
- Fukushi, E.; Onodera, S.; Yamamori, A.; Shiomi, N.; Kawabata, J. NMR analysis of tri- and tetrasaccharides from asparagus. Magn. Reson. Chem. 2000, 38, 1005–1011. [Google Scholar]
- Eggleston, G.; Wartelle, L.; Cyr, E.S. Detecting adulterated commercial sweet sorghum syrups with ion chromatography oligosaccharide fingerprint profiles. Separations 2016, 3, 20. [Google Scholar] [CrossRef]
- Carabetta, S.; Di Sanzo, R.; Campone, L.; Fuda, S.; Rastrelli, L.; Russo, M. High-performance anion exchange chromatography with Pulsed Amperometric Detection (HPAEC–PAD) and chemometrics for geographical and floral authentication of honeys from Southern Italy (Calabria region). Foods 2020, 9, 1625. [Google Scholar] [CrossRef]
- Corradini, C.; Cavazza, A.; Bignardi, C. High-performance anion-exchange chromatography coupled with Pulsed Electrochemical Detection as a powerful tool to evaluate carbohydrates of food interest: Principles and applications. Int. J. Carbohydr. Chem. 2012, 2012, 487564. [Google Scholar] [CrossRef]
- Homann, A.; Biedendieck, R.; Götze, S.; Jahn, D.; Seibel, J. Insights into polymer versus oligosaccharide synthesis: Mutagenesis and mechanistic studies of a novel levansucrase from Bacillus megaterium. Biochem. J. 2007, 407, 189–198. [Google Scholar] [CrossRef] [PubMed]
- Raga-Carbajal, E.; Munguia, A.L.; Alvarez, L.; Olvera, C. Understanding the transfer reaction network behind the non-processive synthesis of low molecular weight levan catalyzed by Bacillus subtilis levansucrase. Sci. Rep. 2018, 8, 15035. [Google Scholar] [CrossRef] [PubMed]
Figure 1.
The structures of 1-kestose, nystose, and 1-fructofuranosylnystose as the representative FOS.
Figure 1.
The structures of 1-kestose, nystose, and 1-fructofuranosylnystose as the representative FOS.

Figure 2.
Chromatographic differences using saccharide standard by multi-gradient elution with (A) 70% acetonitrile, (B) 75% acetonitrile, and (C) 80% acetonitrile isocratic elution for 0 to 10 min, followed by reduction to 50% acetonitrile over 10 to 30 min.
Figure 2.
Chromatographic differences using saccharide standard by multi-gradient elution with (A) 70% acetonitrile, (B) 75% acetonitrile, and (C) 80% acetonitrile isocratic elution for 0 to 10 min, followed by reduction to 50% acetonitrile over 10 to 30 min.

Figure 3.
Comparison of the chromatograms of maple syrup at a common concentration of 10 mg/mL detected by RID (A) and CAD (B).
Figure 3.
Comparison of the chromatograms of maple syrup at a common concentration of 10 mg/mL detected by RID (A) and CAD (B).

Figure 4.
The structure of neokestose.


Table 1.
Validation data for the optimized analytical method using HILIC-CAD, including concentration range, linear equation, correlation coefficients, LOD, LOQ, intra- and inter-day precision, and accuracy.
Table 1.
Validation data for the optimized analytical method using HILIC-CAD, including concentration range, linear equation, correlation coefficients, LOD, LOQ, intra- and inter-day precision, and accuracy.
| Saccharides | Fructose | Glucose | Sucrose | 1-Kestose | Nystose | Fructofuranosyl Nystose | |
|---|---|---|---|---|---|---|---|
| Concentration range (µg/mL) | 0.5–100 | 0.5−100 | 0.5−100 | 0.5−100 | 0.5−100 | 0.5−100 | |
| Linear equation | y = −0.0003x2 + 0.1193x + 0.0279 | y = −0.0003x2 + 0.1268x + 0.0577 | y = −0.0003x2 + 0.1237x + 0.0781 | y = −0.0003x2 + 0.1149x + 0.0539 | y = −0.0002x2 + 0.0980x + 0.0329 | y = −0.0002x2 + 0.0995x + 0.0241 | |
| R2 | 0.9998 | 0.9998 | 0.9996 | 0.9998 | 0.9997 | 0.9999 | |
| LOD/LOQ (µg/mL) | 0.25/0.5 | 0.25/0.5 | 0.25/0.5 | 0.25/0.5 | 0.25/0.5 | 0.25/0.5 | |
| Precision (%) | Intra-day (n = 9) | 0.733 | 0.768 | 0.639 | 0.668 | 0.848 | 0.840 |
| Inter-day (n = 3) | 0.630 | 1.46 | 1.02 | 1.67 | 1.46 | 1.71 | |
| Accuracy (%) | 96.5 | 91.7 | 94.3 | 92.3 | 98.2 | 97.9 | |
Table 2.
The concentration of saccharides in all grades of maple syrup under investigation.
| Variables | Golden | Amber | Dark | Very Dark |
|---|---|---|---|---|
| Fructose (µg/10 mg) | 21.3 ± 0.146 | 41.7 ± 0.295 | 65.6 ± 0.442 | 163 ± 1.46 |
| Glucose (µg/10 mg) | 31.6 ± 0.152 | 55.1 ± 0.396 | 83.3 ± 0.464 | 198 ± 2.12 |
| Sucrose (mg/10 mg) | 5.98 ± 0.159 | 5.94 ± 0.138 | 6.04 ± 0.115 | 5.49 ± 0.0506 |
| Mapletriose1 (*) (µg/10 mg) | 20.6 ± 1.23 | 19.6 ± 0.474 | 31.2 ± 0.491 | 40.6 ± 0.573 |
| 1-Kestose (µg/10 mg) | 5.05 ± 0.357 | 10.1 ± 0.383 | 13.6 ± 0.142 | 25.3 ± 0.510 |
| Nystose (µg/10 mg) | 0.244 ± 0.0155 | 0.593 ± 0.00395 | 1.45 ± 0.0191 | 3.08 ± 0.0483 |
Data are presented as mean ± S.D. (*) The concentration of mapletriose1 was predicted using the calibration curve of 1-kestose.
Table 3.
1H (800 MHz) and 13C (200 MHz)-NMR spectral data of neokestose in D2O.
| Chemical Shift | |||
|---|---|---|---|
| Residue | Position | Observed (200 MHz) in D2O δC | Observed (800 MHz) in D2O δH |
| Fruf β | 1 | 64.15 | 3.64 (d, 12.6) |
| 3.656 (d, 12.6) | |||
| 2 | 106.42 * | - | |
| 3 | 78.92 | 4.21 (d, 8.9) | |
| 4 | 76.64 | 4.05 (dd-like, ca. 8.9, ca. 8.5) | |
| 5 | 84.07 | 3.88 (ddd, 8.5, 7.3, 3.0) | |
| 6 | 65.14 | 3.78 (dd-like, ca. 12.4, ca. 7.3) | |
| 3.83 (dd-like, ca. 12.4, 3.0) | |||
| Glcp α | 1′ | 94.72 | 5.39 (d, 3.9) |
| 2′ | 73.73 | 3.55 (dd, 9.9, 3.9) | |
| 3′ | 75.15 | 3.736 (dd-like, ca. 9.9, ca. 9.5) | |
| 4′ | 71.89 | 3.51 (dd-like, ca. 10.3, ca. 9.5) | |
| 5′ | 74.25 | 3.93 (ddd-like, ca. 10.3, 4.1, 2.1) | |
| 6′ | 63.02 | 3.78 (dd-like, ca. 11.5, ca. 4.1) | |
| 3.92 (dd-like, ca. 11.5, 2.1) | |||
| Fruf β | 1″ | 62.90 | 3.660 (d, 12.1) |
| 3.744 (d, 12.1) | |||
| 2″ | 106.43 * | - | |
| 3″ | 79.48 | 4.18 (d, 8.7) | |
| 4″ | 77.04 | 4.13 (dd-like, ca. 8.7, ca. 7.8) | |
| 5″ | 83.86 | 3.86 (ddd, 7.8, 6.6, 3.0) | |
| 6″ | 65.07 | 3.69 (dd, 12.4, 6.6) | |
| 3.82 (dd-like, ca. 12.4, 3.0) | |||
* signals are not determined.
Publisher’s Note: MDPI stays neutral with regard to jurisdictional claims in published maps and institutional affiliations. |
© 2021 by the authors. Licensee MDPI, Basel, Switzerland. This article is an open access article distributed under the terms and conditions of the Creative Commons Attribution (CC BY) license (https://creativecommons.org/licenses/by/4.0/).
Share and Cite
MDPI and ACS Style
Sato, K.; Yamamoto, T.; Mitamura, K.; Taga, A. Separation of Fructosyl Oligosaccharides in Maple Syrup by Using Charged Aerosol Detection. Foods 2021, 10, 3160. https://0-doi-org.brum.beds.ac.uk/10.3390/foods10123160
AMA Style
Sato K, Yamamoto T, Mitamura K, Taga A. Separation of Fructosyl Oligosaccharides in Maple Syrup by Using Charged Aerosol Detection. Foods. 2021; 10(12):3160. https://0-doi-org.brum.beds.ac.uk/10.3390/foods10123160
Chicago/Turabian StyleSato, Kanta, Tetsushi Yamamoto, Kuniko Mitamura, and Atsushi Taga. 2021. "Separation of Fructosyl Oligosaccharides in Maple Syrup by Using Charged Aerosol Detection" Foods 10, no. 12: 3160. https://0-doi-org.brum.beds.ac.uk/10.3390/foods10123160
Note that from the first issue of 2016, this journal uses article numbers instead of page numbers. See further details here.