
Biodegradable Active Packaging as an Alternative to Conventional Packaging: A Case Study with Chicken Fillets

Abstract
:1. Introduction
2. Materials and Methods
2.1. Compounding and Film Blowing
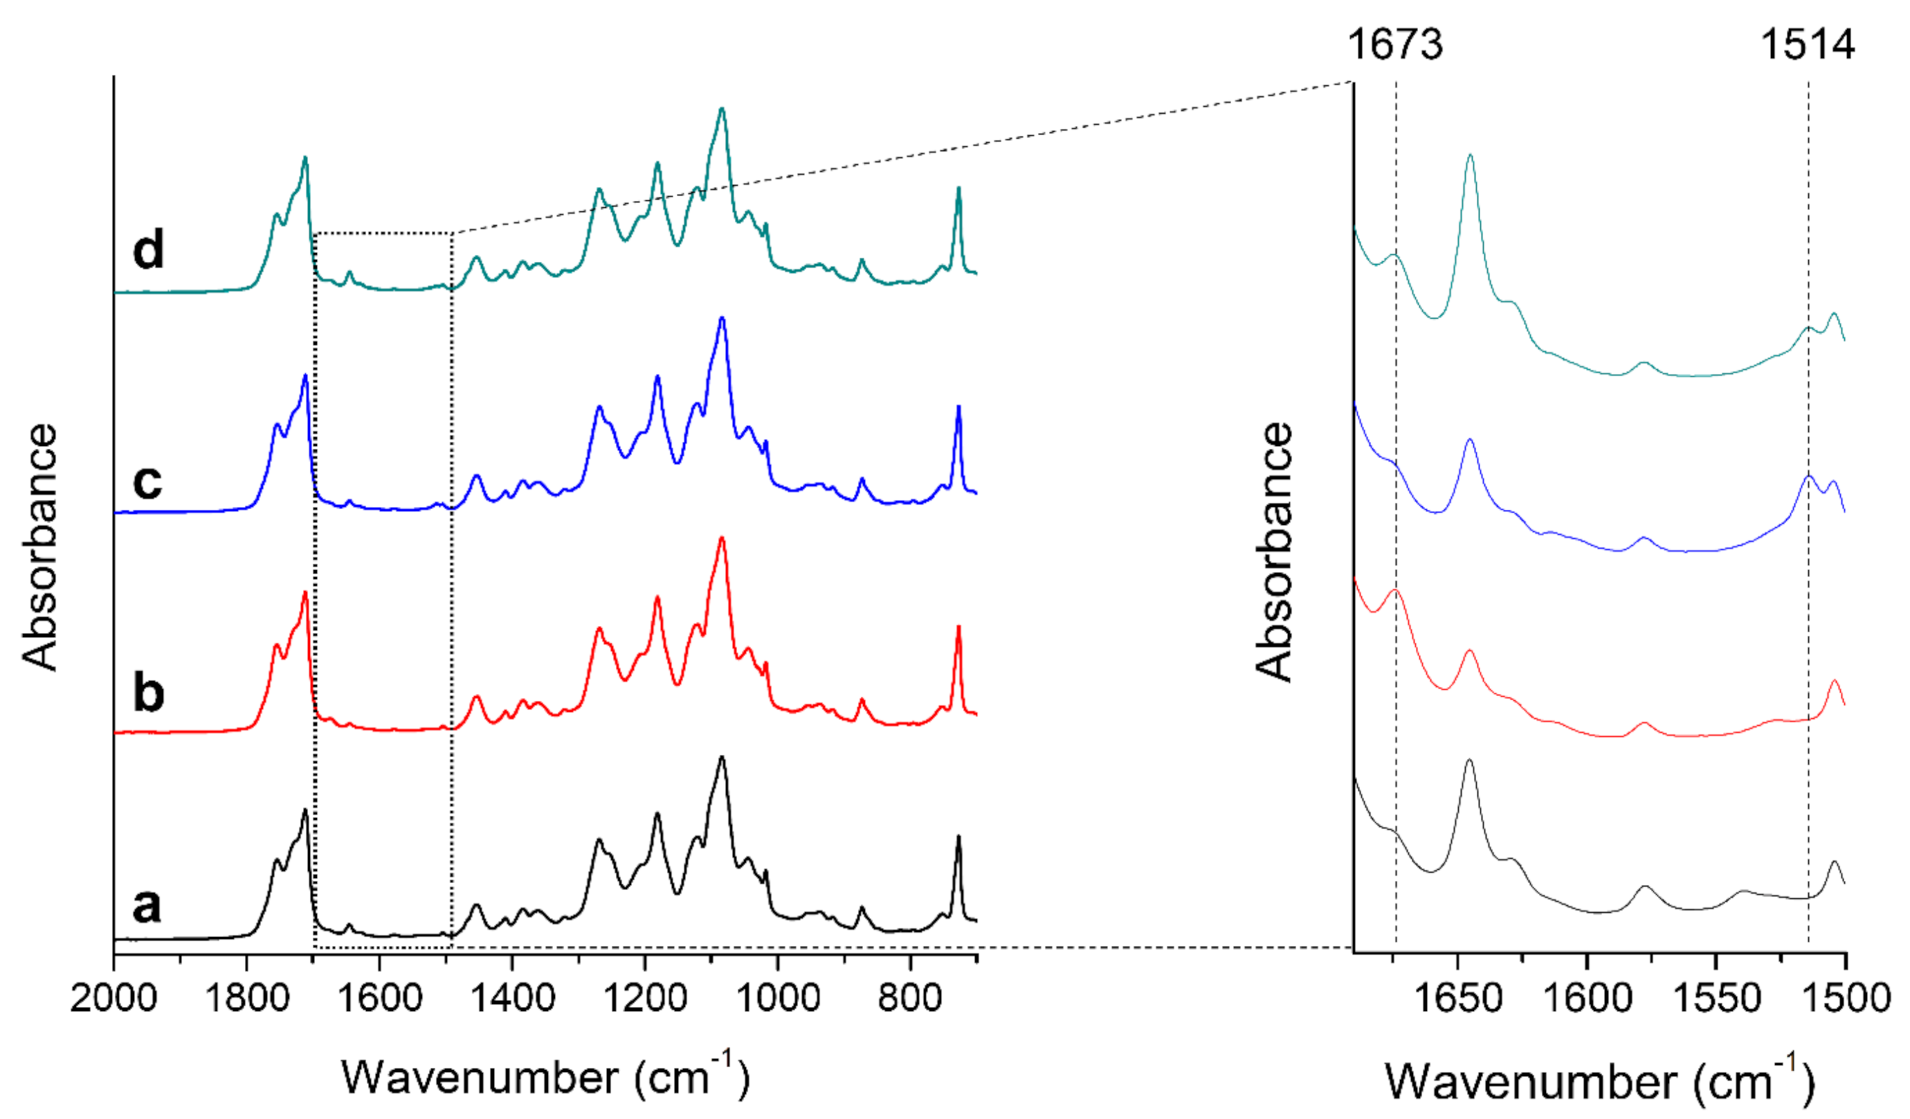
2.2. FTIR
2.3. Packaging and Storage Conditions
2.4. Head Space Gas Chromatography/Mass Spectrometry (GC/MS)
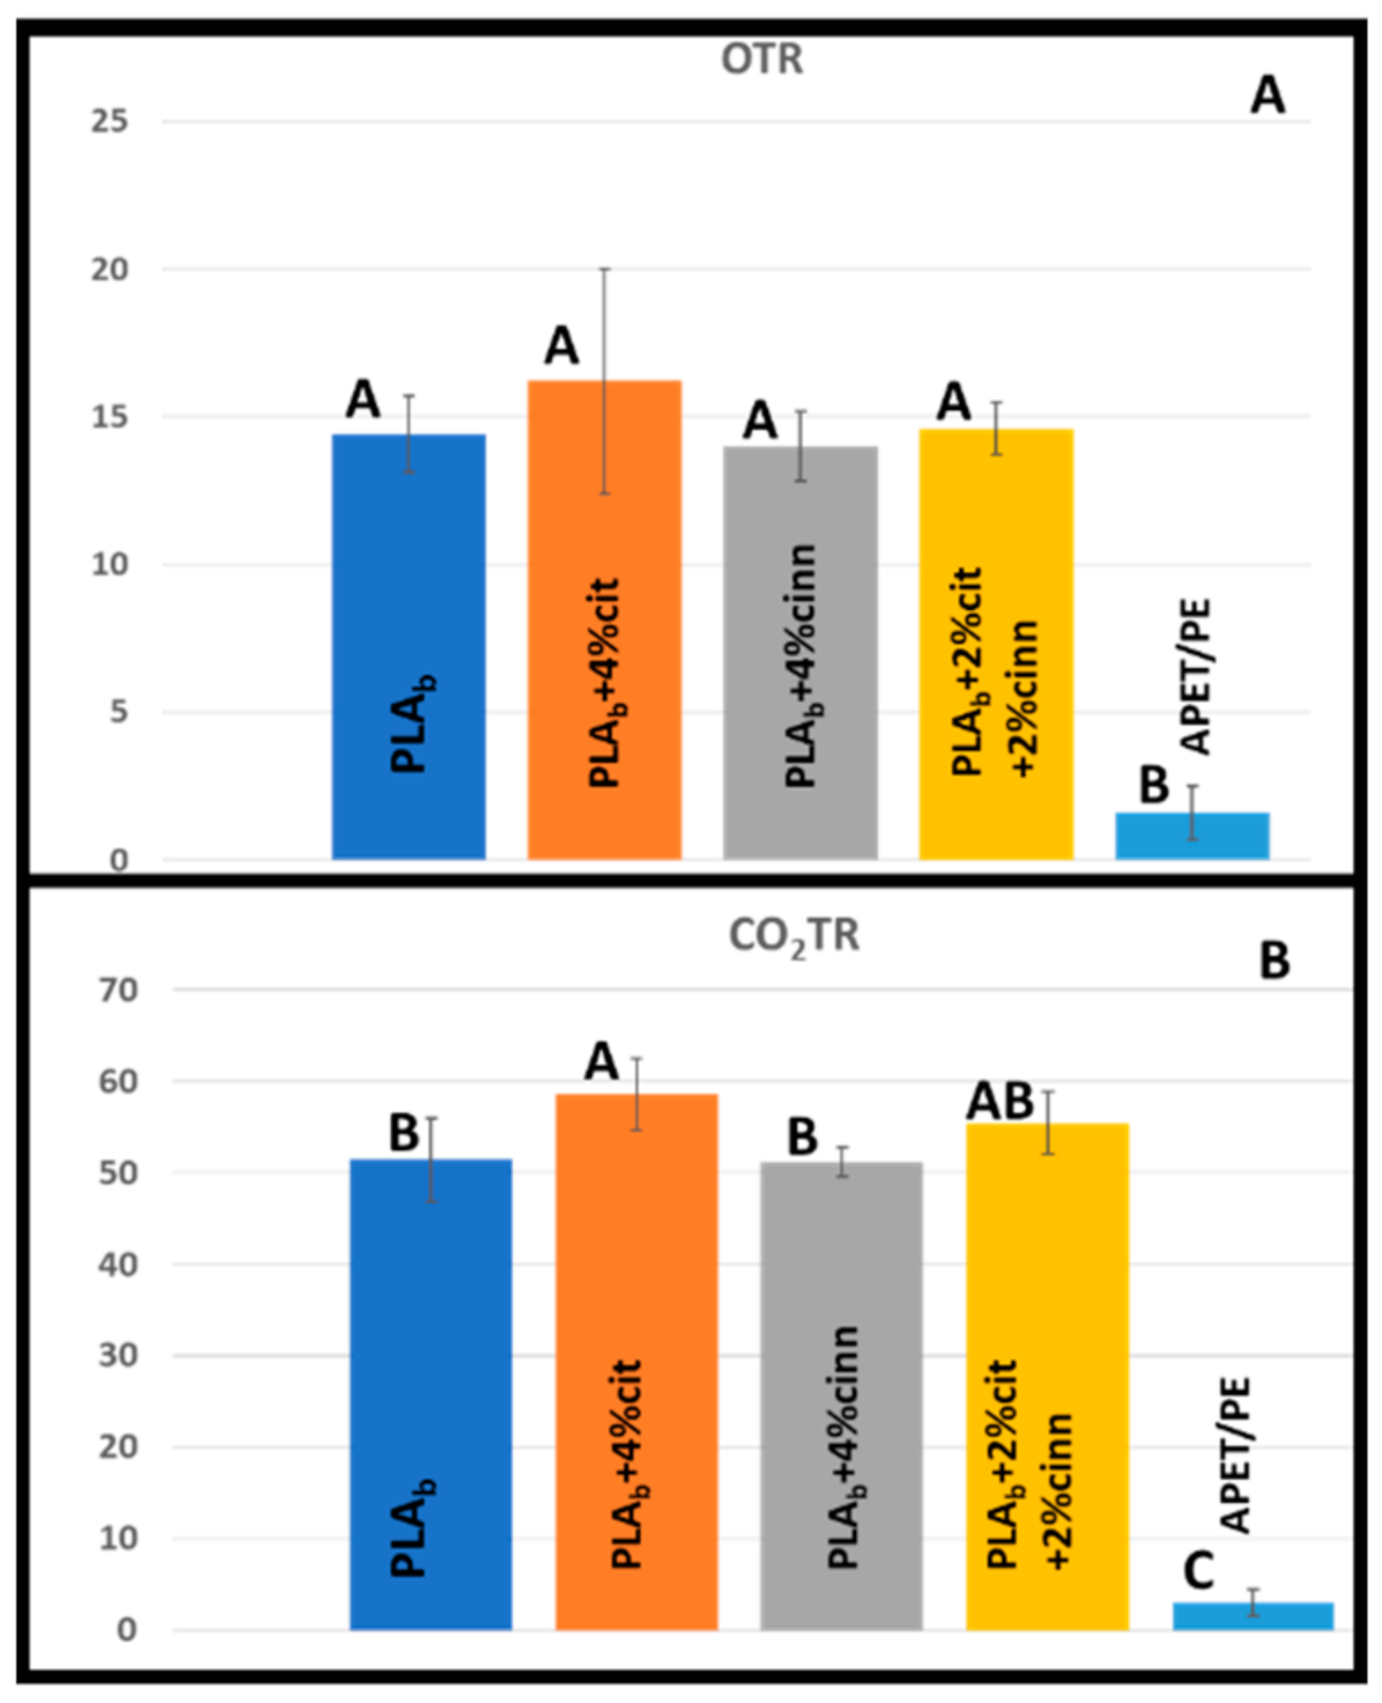
2.5. Gas Transmission Rates
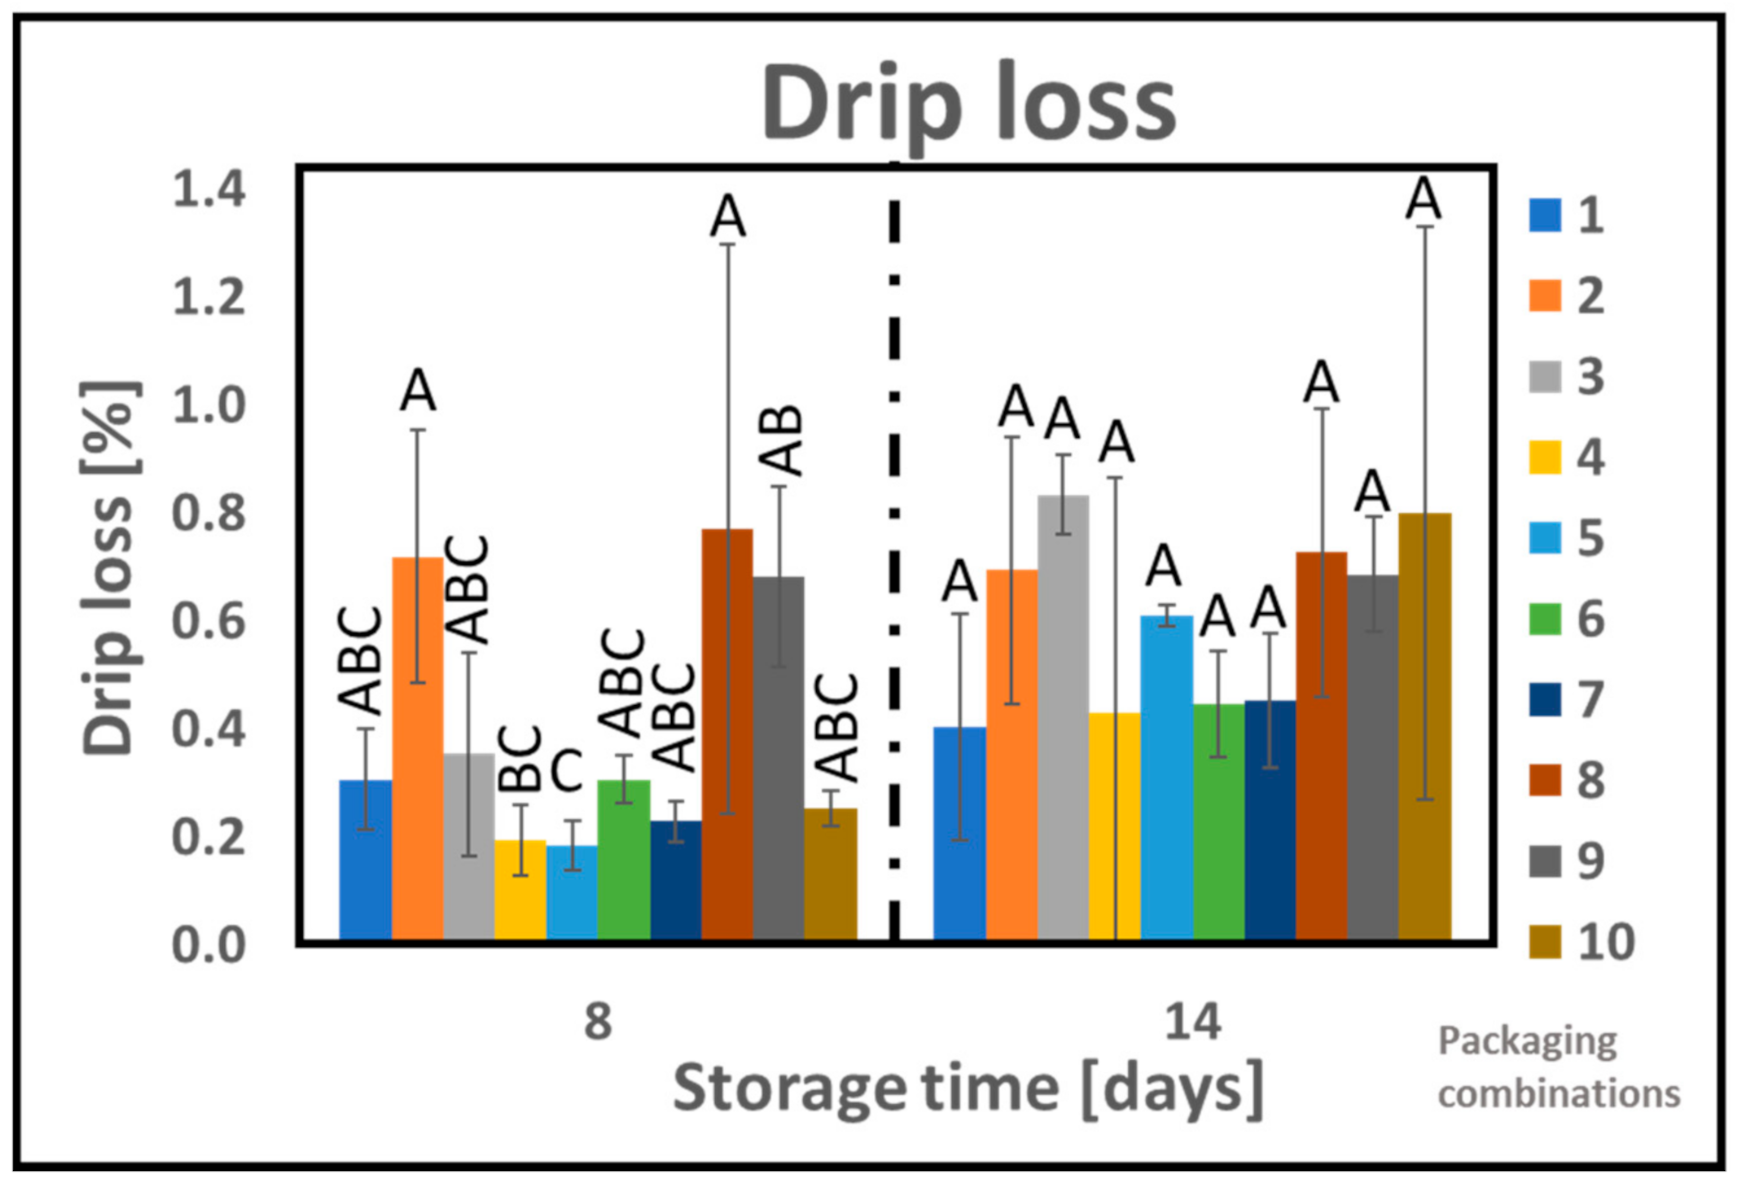
2.6. Drip Loss
2.7. Dry Matter
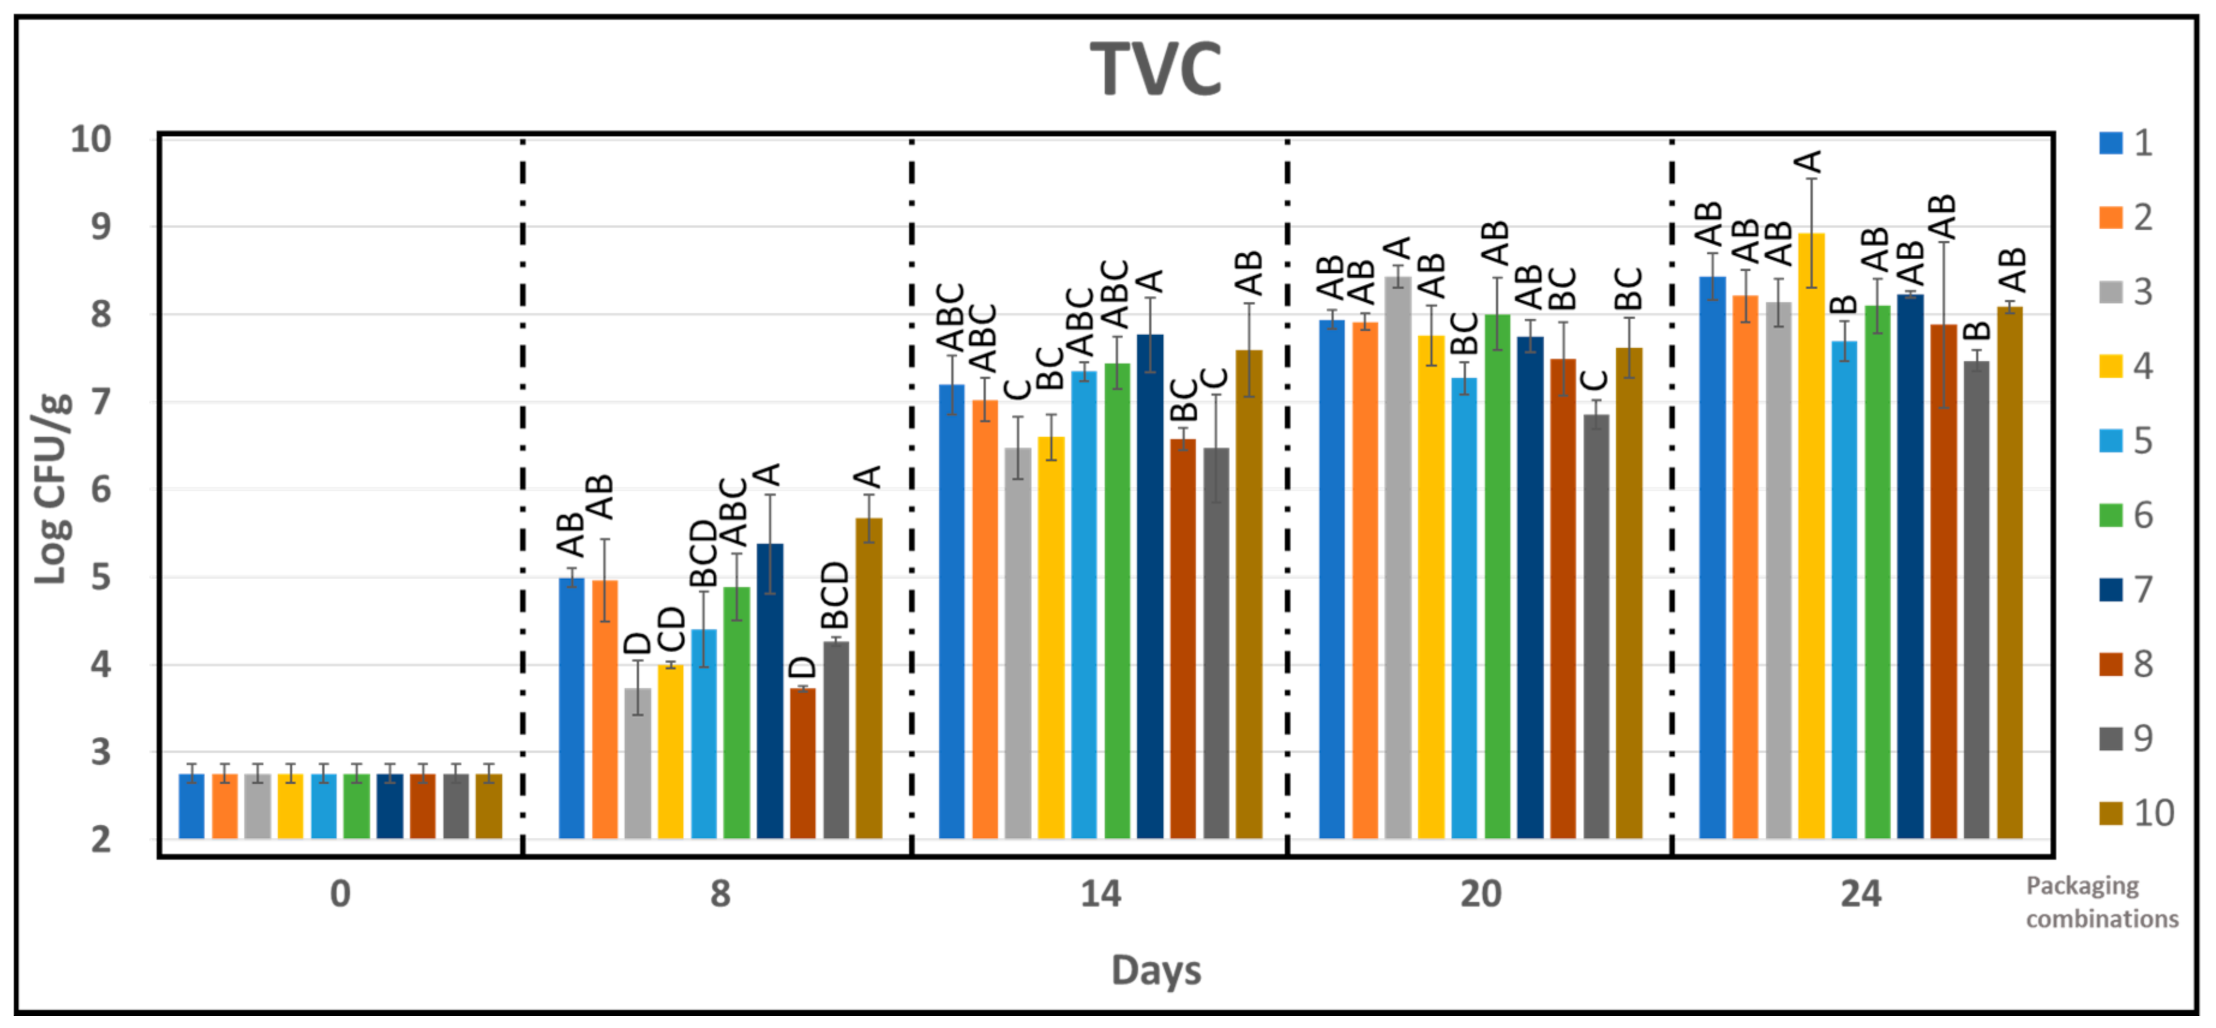
2.8. Microbiology
- Plate count agar (PCA; Difco, Difco Laboratories, Detroit, MI, USA) for total viable counts (TVC): incubation temperature 30 °C, 72 h, aerobic incubation. (NMKL No. 86);
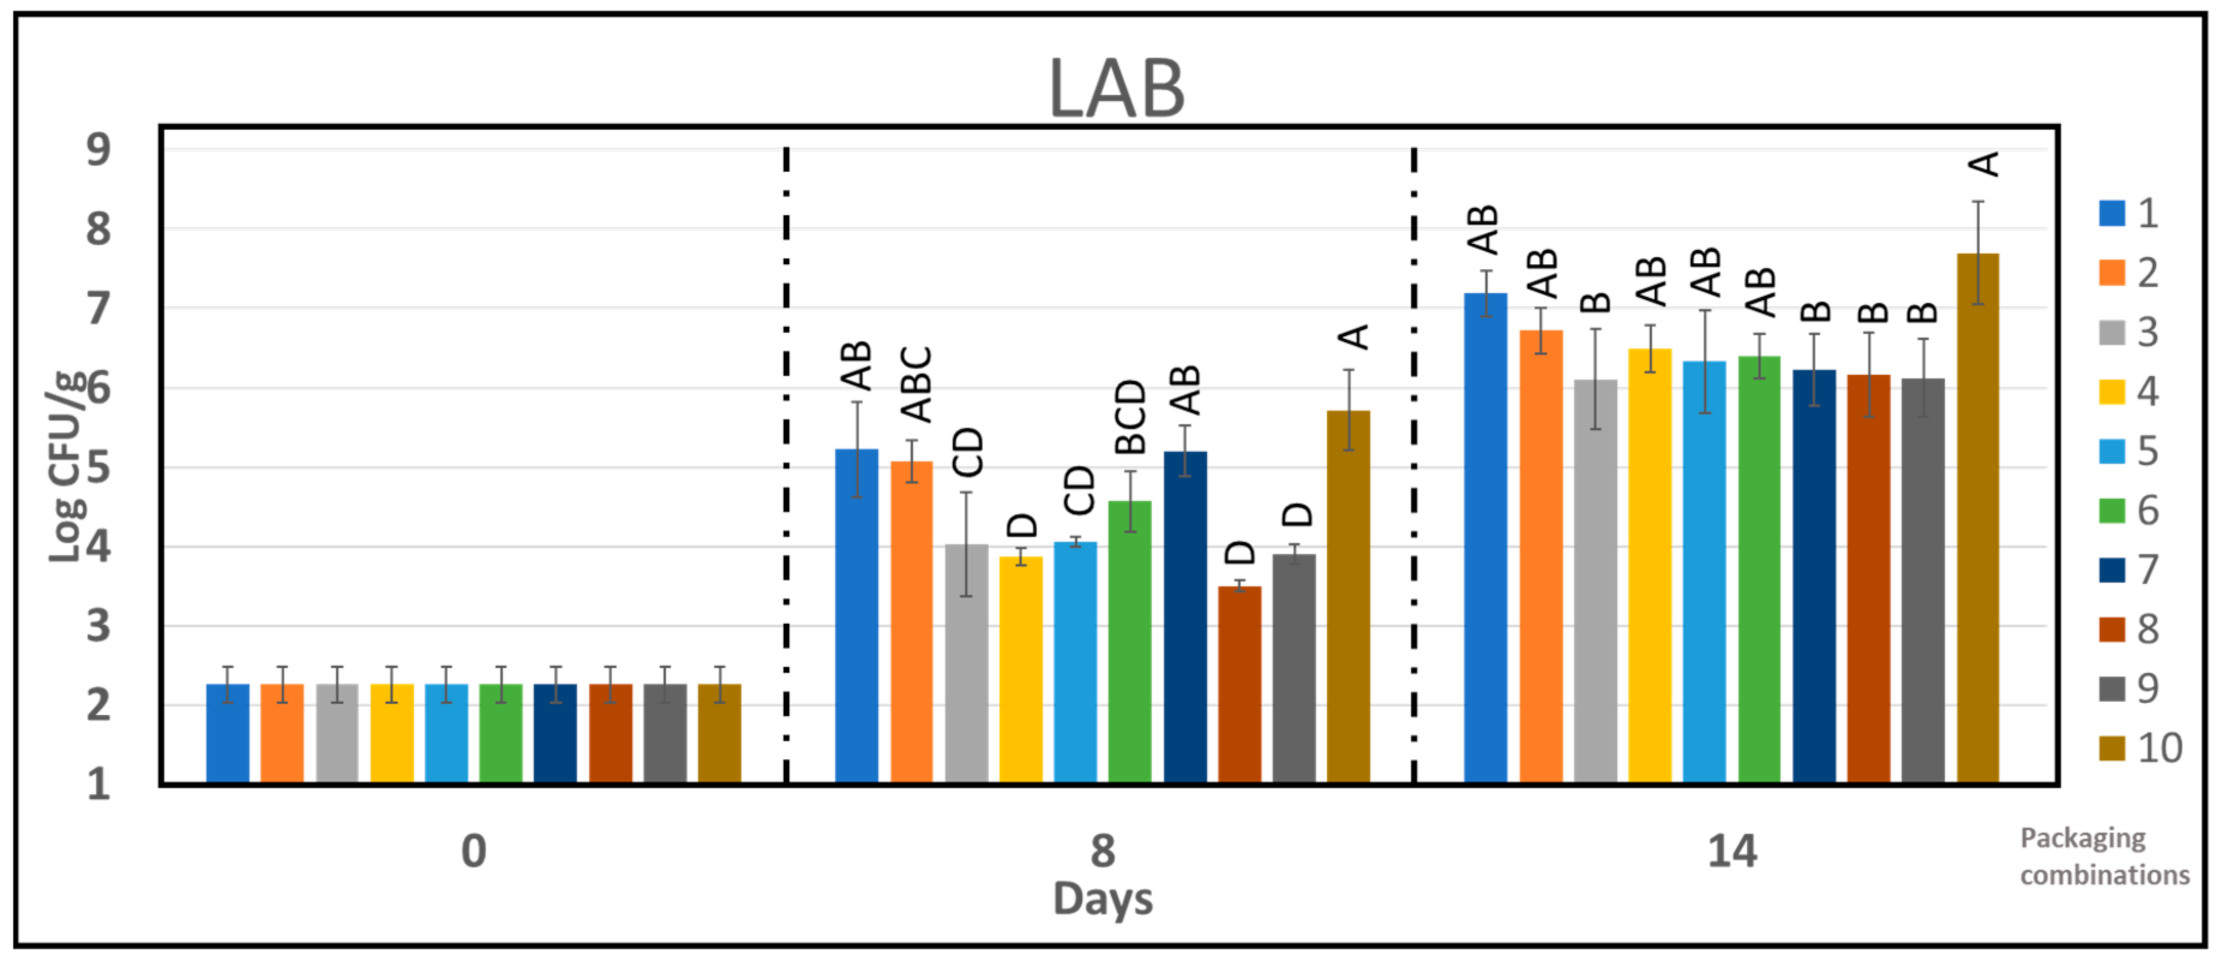
- De Man, Sharpe, and Rogosa agar (MRS; Oxoid, Unipath Ltd., Basingstoke, Hampshire, UK,) for lactic acid bacteria (LAB): 25–30 °C, 48 h, aerobic incubation. (NMKL No. 140);
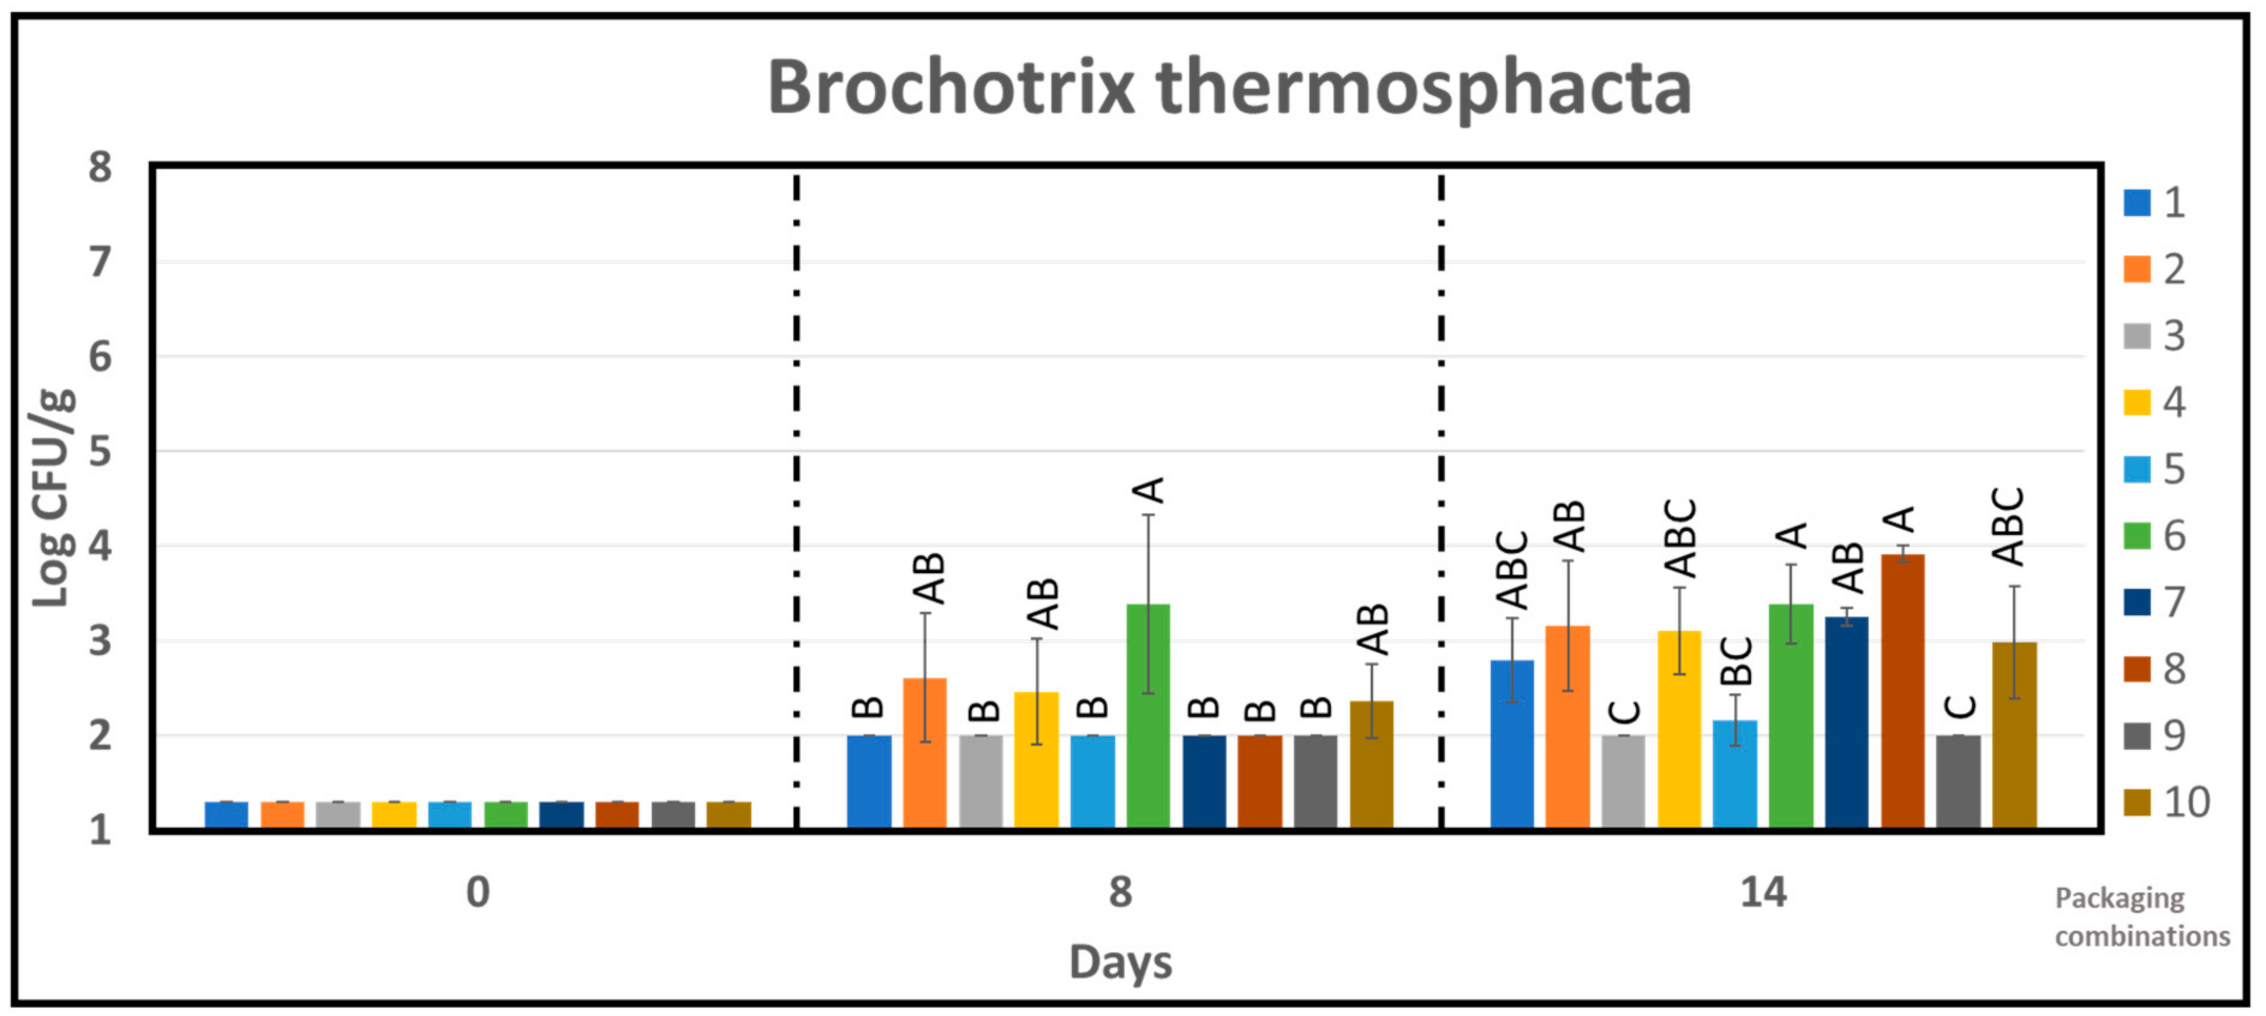
- Streptomycin thallous acetate actidione (STAA) agar base (CM 0881 with selective supplement SR 0151E, Oxoid, Hampshire, England) for Brochothrix thermosphacta; 25 °C for 48 h, aerobic incubation. (NMKL No. 141);
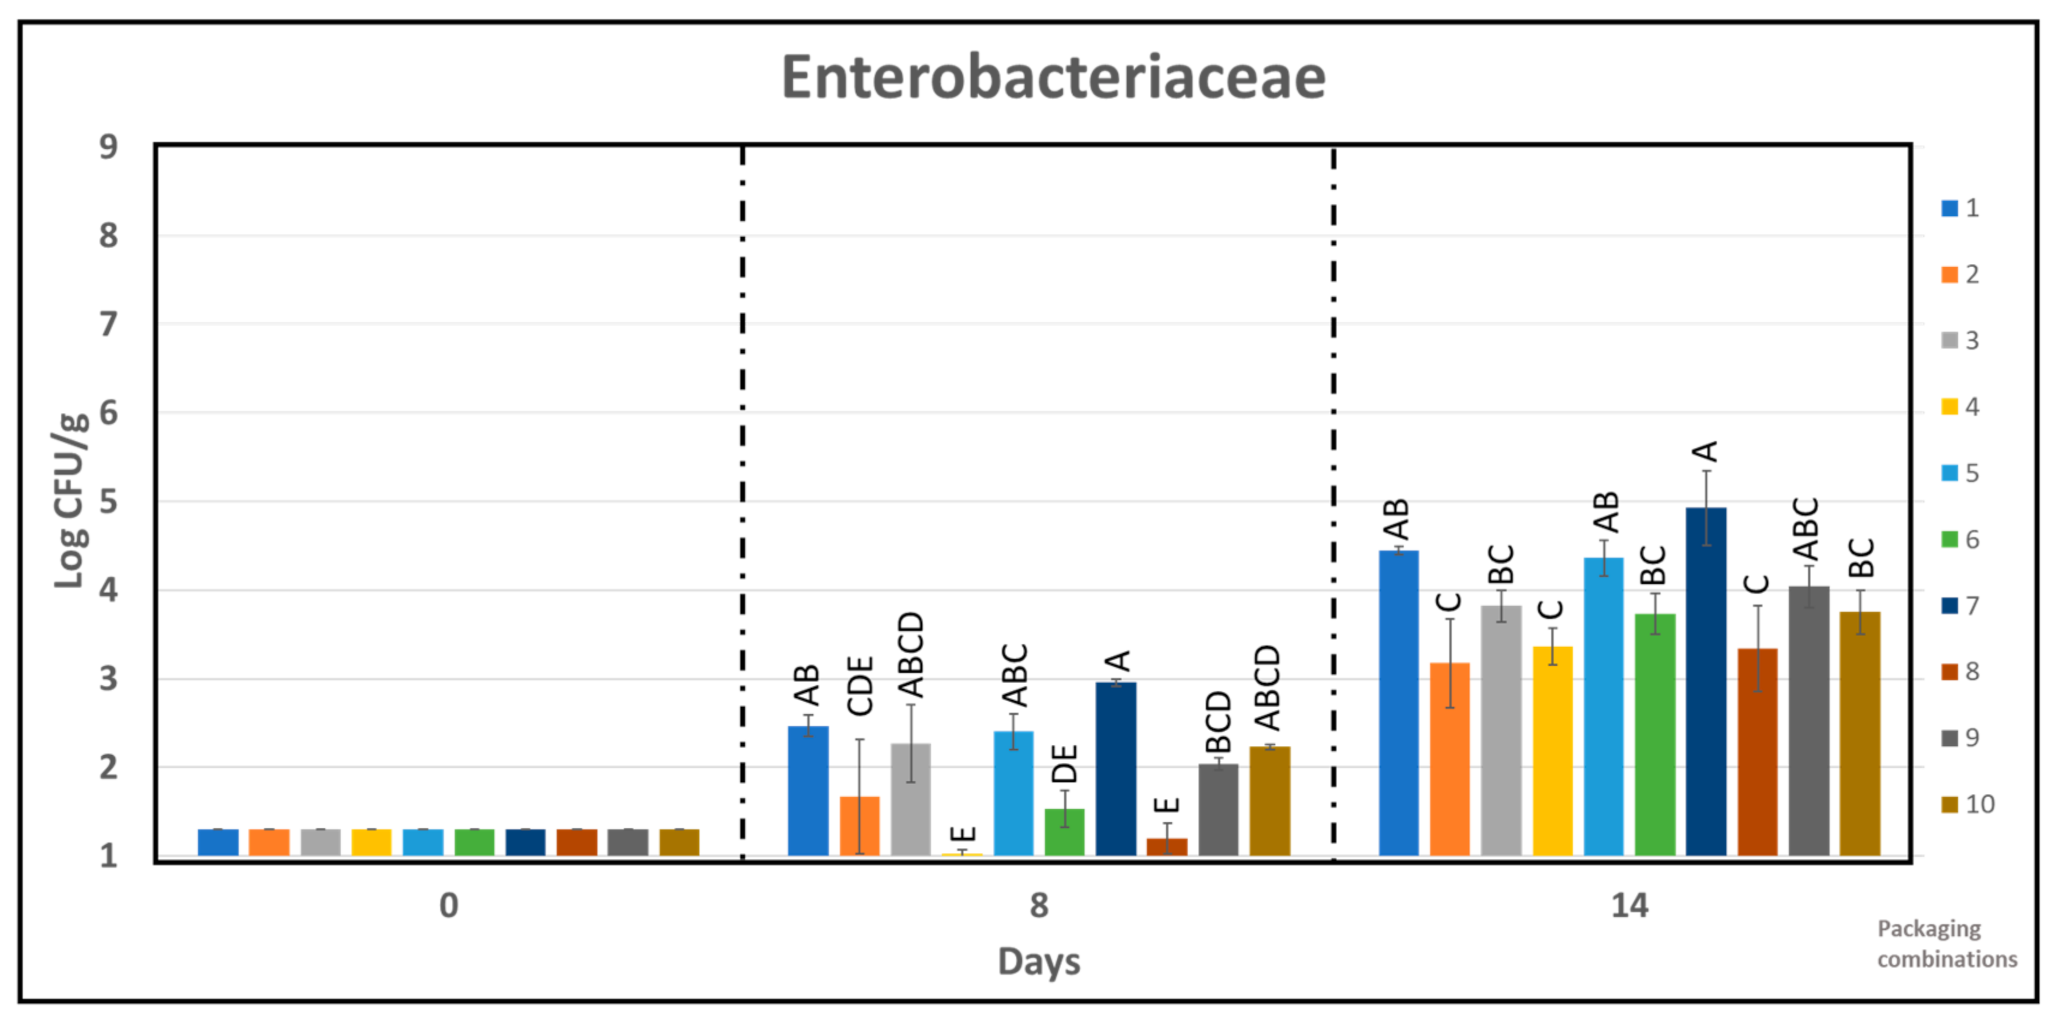
- Violet Red Bile Glucose Agar (VRBGA, Oxoid, Hampshire, UK) for Enterobacteriace; 37 °C, 24–48 h, semi-aerobic conditions, cells embedded in agar with sterile overlay. (NMKL No. 144).
2.9. Sensory Analysis
2.10. Statistical Analyses
3. Results and Discussion
3.1. FTIR
3.2. Gas Barrier Properties
3.3. Drip Loss and Dry Matter
3.4. Microbiological Growth
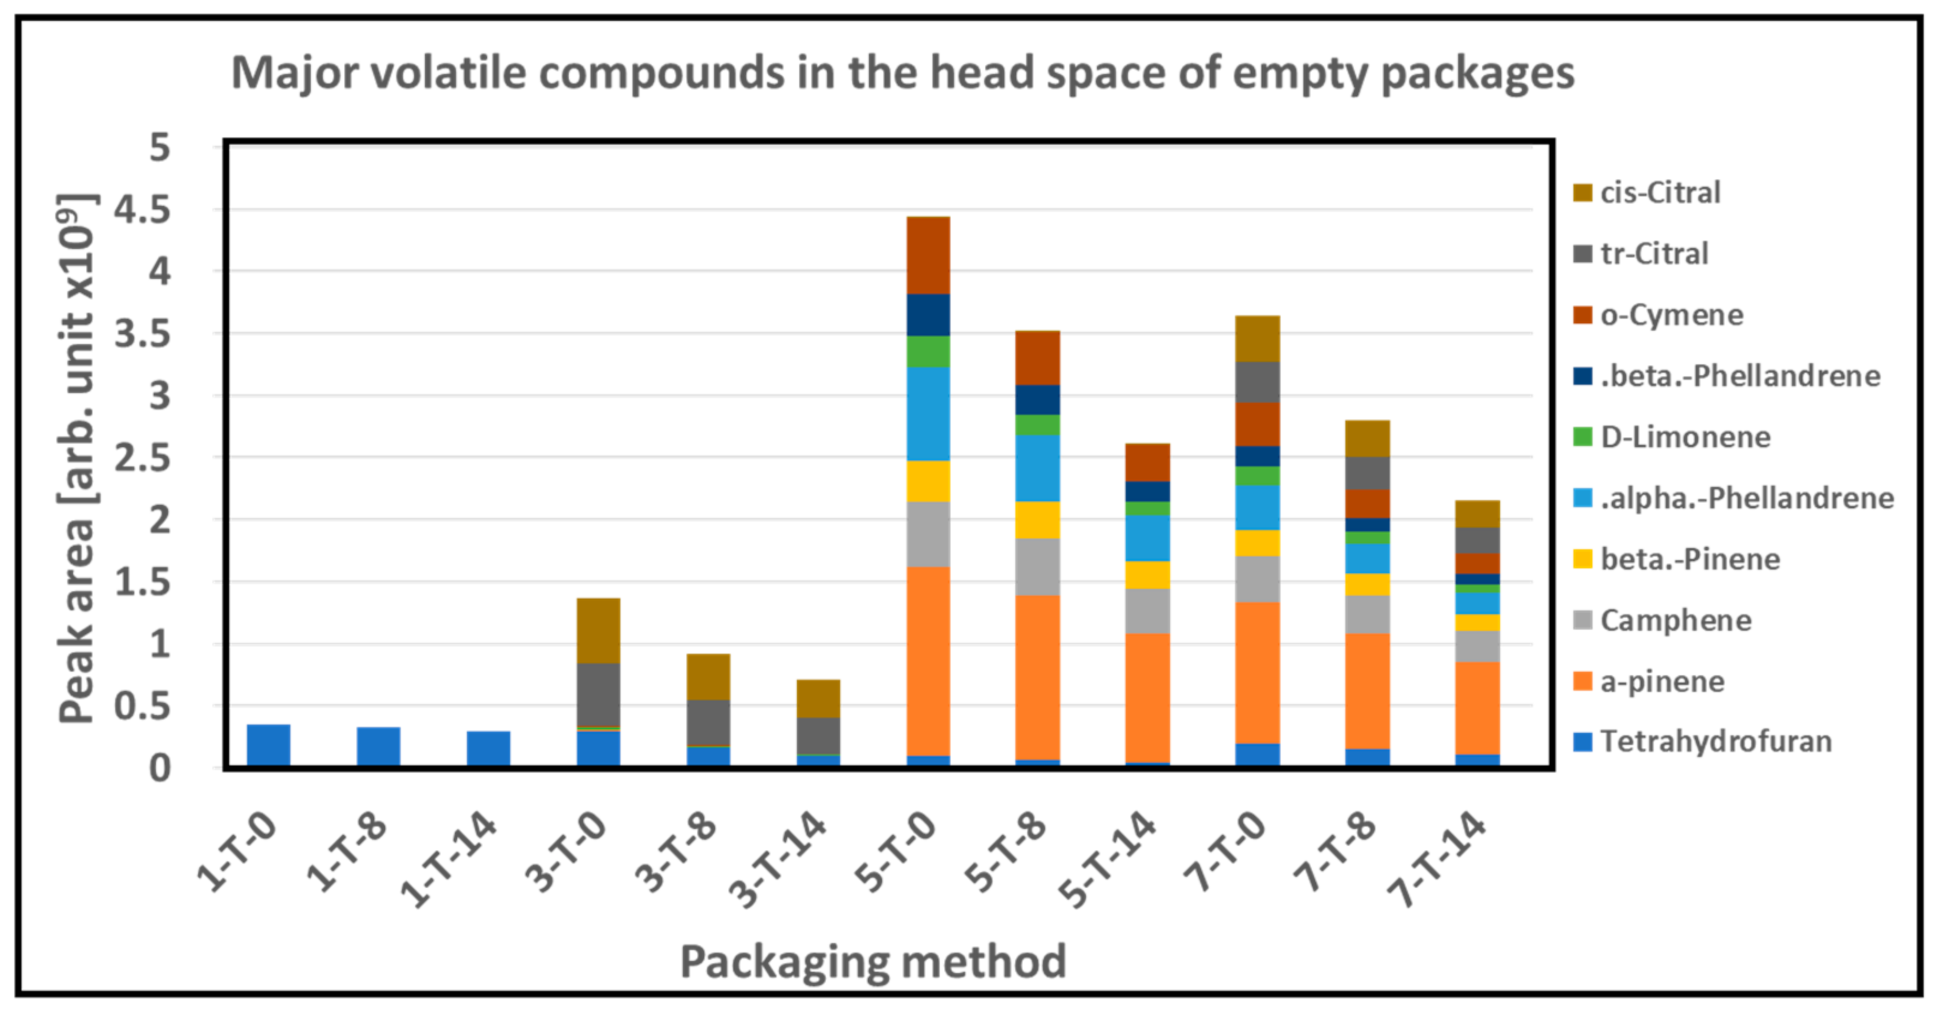
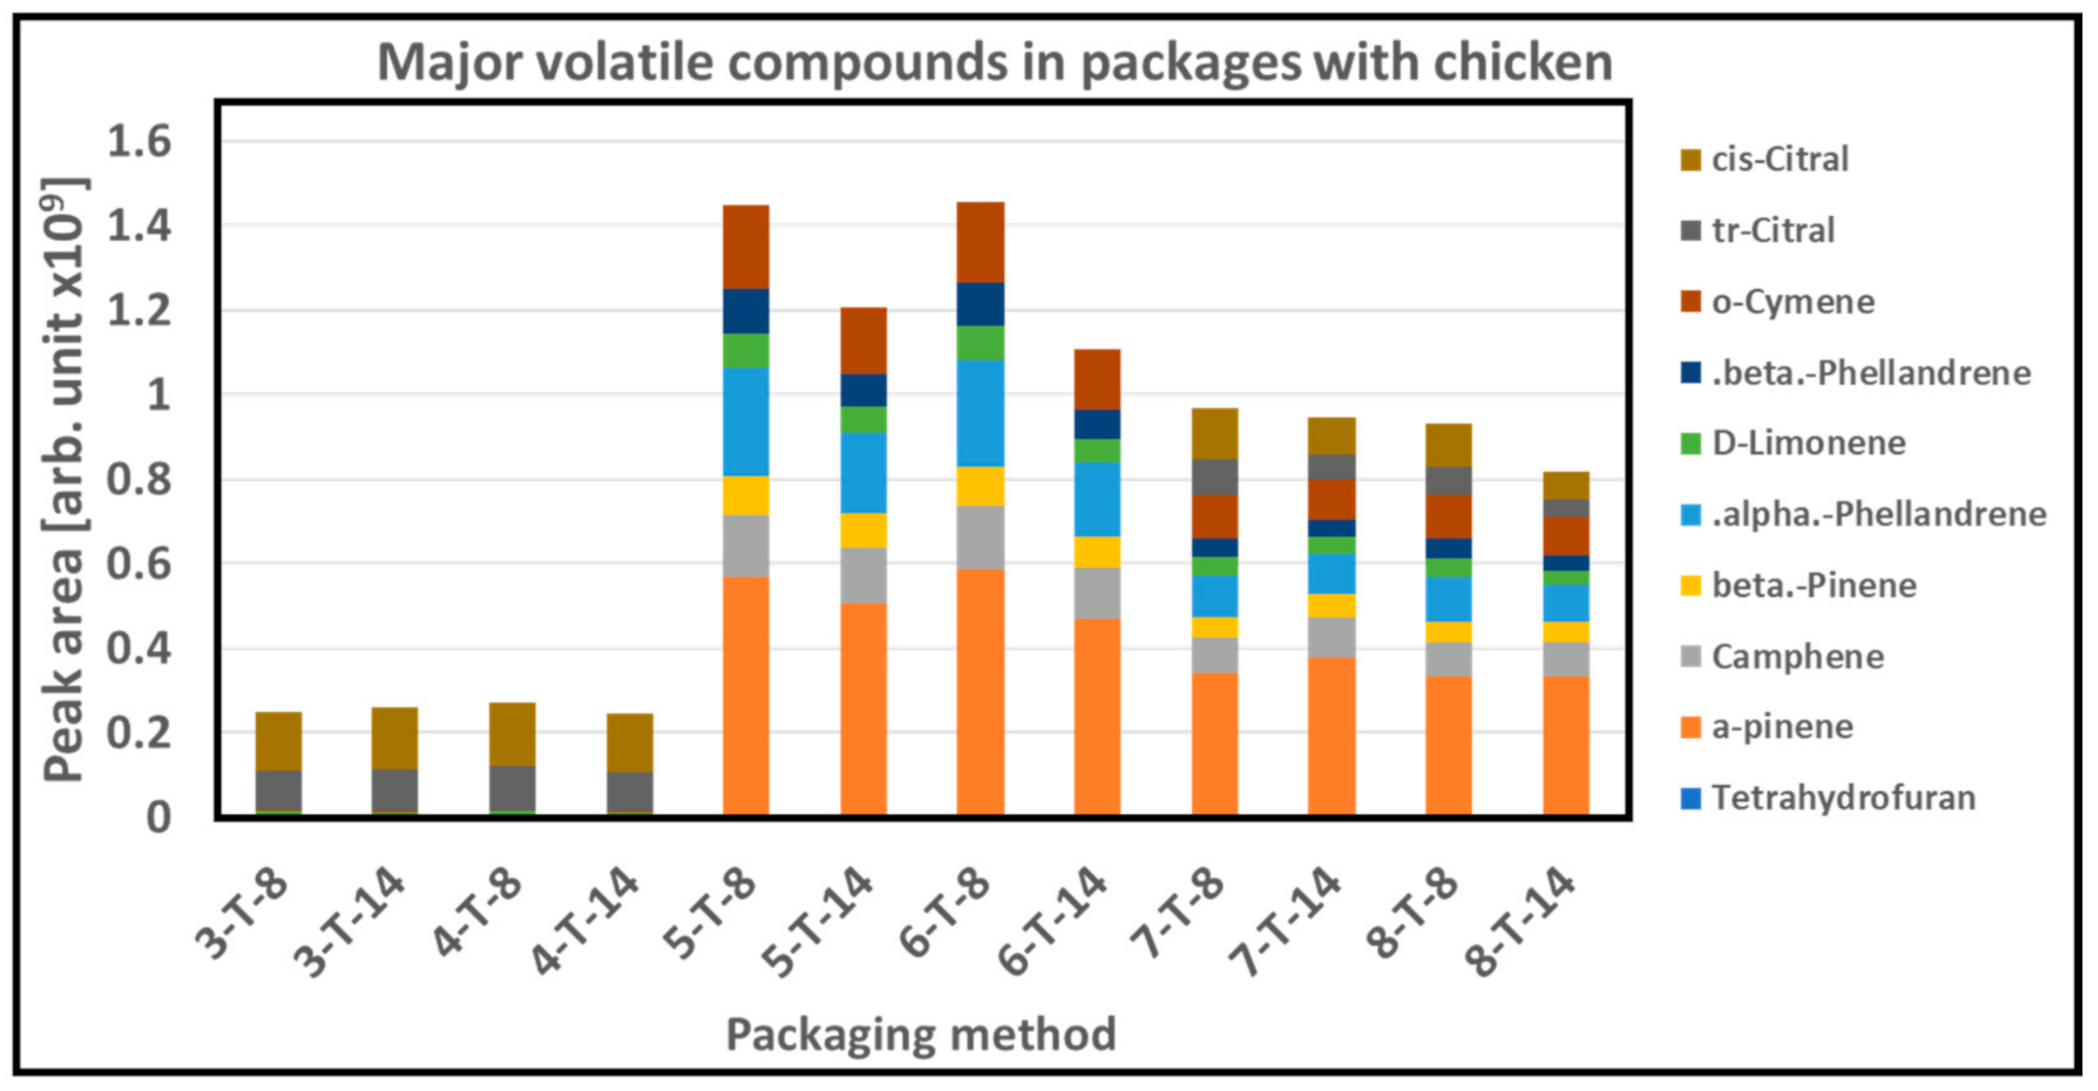
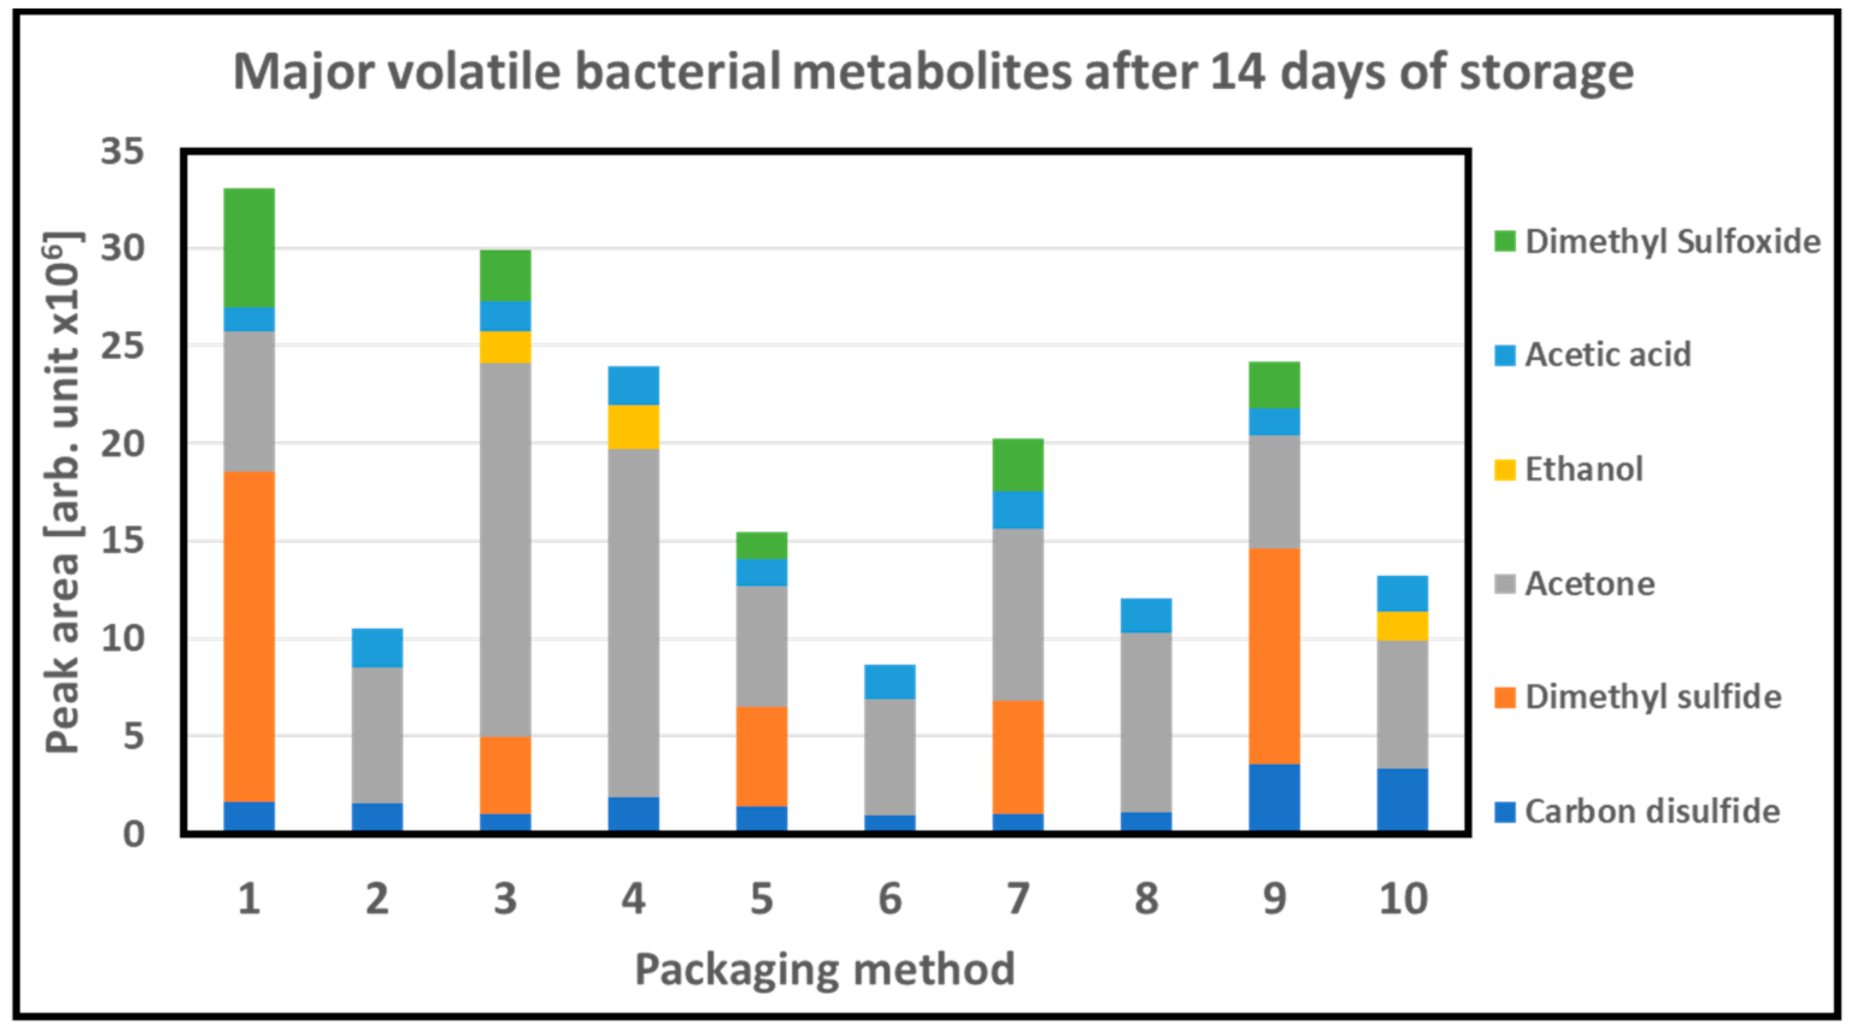
3.5. GC/MS
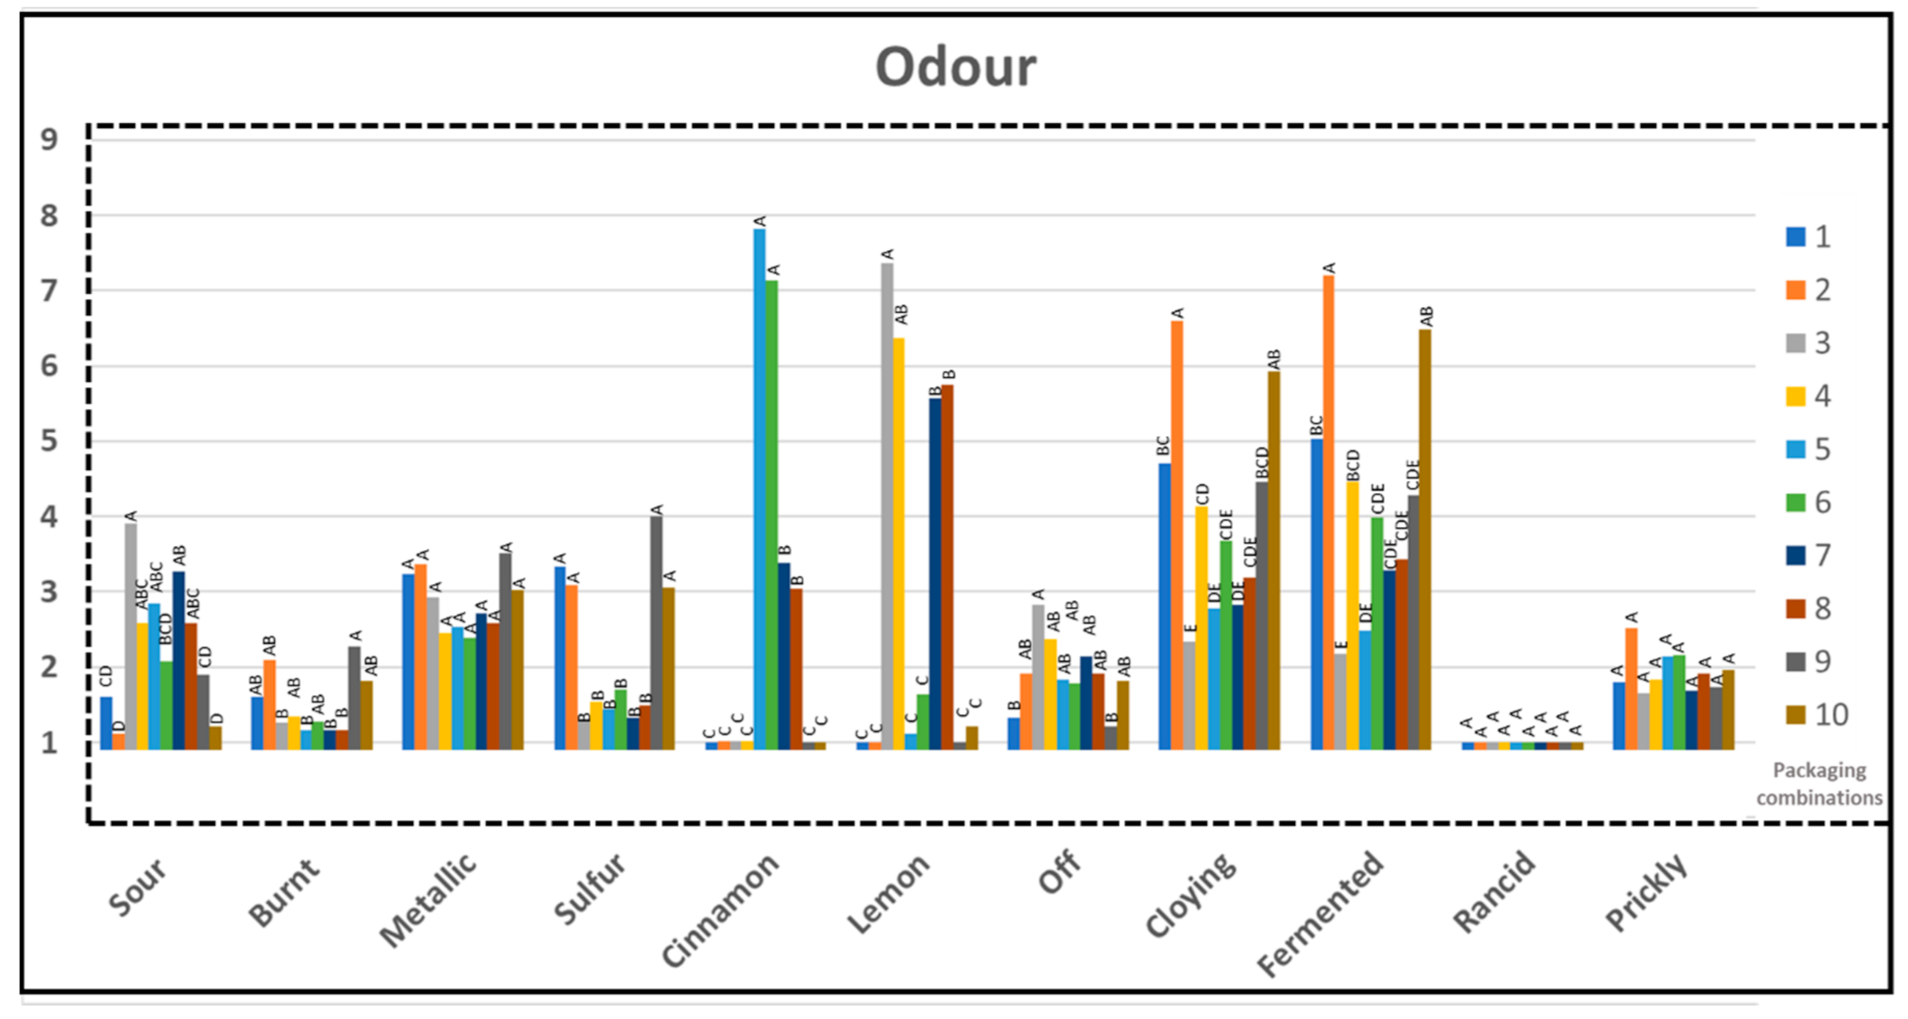
3.6. Sensory Profile
3.7. Volatiles/Sensory
4. Conclusions
Supplementary Materials
Author Contributions
Funding
Acknowledgments
Conflicts of Interest
References
- European Commission. Commission Regulation (EC) No. 450/2009 of 29 May 2009 on active and intelligent materials and articles intended to come into contact with food. Off. J. Eur. Union. 2009, 135, 3–11. [Google Scholar]
- Alparslan, Y.; Baygar, T. Effect of chitosan film coating combined with orange peel essential oil on the shelf life of deepwater pink shrimp. Food Bioprocess Technol. 2017, 10, 842–853. [Google Scholar] [CrossRef]
- Ahmed, I.; Lin, H.; Zou, L.; Brody, A.L.; Li, Z.; Qazi, I.M.; Pavase, T.R.; Lv, L. A comprehensive review on the application of active packaging technologies to muscle foods. Food Control 2017, 82, 163–178. [Google Scholar] [CrossRef]
- Yildirim, S.; Röcker, B.; Pettersen, M.K.; Nilsen-Nygaard, J.; Ayhan, Z.; Rutkaite, R.; Radusin, T.; Suminska, P.; Marcos, B.; Coma, V. Active packaging applications for food. Compr. Rev. Food Sci. Food Saf. 2018, 17, 165–199. [Google Scholar] [CrossRef] [PubMed] [Green Version]
- Mith, H.; Dure, R.; Delcenserie, V.; Zhiri, A.; Daube, G.; Clinquart, A. Antimicrobial activities of commercial essential oils and their components against food-borne pathogens and food spoilage bacteria. Food Sci. Nutr. 2014, 2, 403–416. [Google Scholar] [CrossRef] [Green Version]
- Burt, S. Essential oils: Their antibacterial properties and potential applications in foods—A review. Int. J. Food Microbiol. 2004, 94, 223–253. [Google Scholar] [CrossRef]
- Nazzaro, F.; Fratianni, F.; De Martino, L.; Coppola, R.; De Feo, V. Effect of essential oils on pathogenic bacteria. Pharmaceuticals 2013, 6, 1451–1474. [Google Scholar] [CrossRef] [PubMed]
- Lopez-Romero, J.C.; González-Ríos, H.; Borges, A.; Simões, M. Antibacterial effects and mode of action of selected essential oils components against Escherichia coli and Staphylococcus aureus. Evid.-Based Complement. Altern. Med. 2015, 2015, 795435. [Google Scholar] [CrossRef] [Green Version]
- Bashir, A.; Jabeen, S.; Gull, N.; Islam, A.; Sultan, M.; Ghaffar, A.; Khan, S.M.; Iqbal, S.S.; Jamil, T. Co-concentration effect of silane with natural extract on biodegradable polymeric films for food packaging. Int. J. Biol. Macromol. 2018, 106, 351–359. [Google Scholar] [CrossRef]
- Zhu, J.-Y.; Tang, C.-H.; Yin, S.-W.; Yang, X.-Q. Development and characterization of novel antimicrobial bilayer films based on Polylactic acid (PLA)/Pickering emulsions. Carbohydr. Polym. 2018, 181, 727–735. [Google Scholar] [CrossRef]
- Benbettaïeb, N.; Tanner, C.; Cayot, P.; Karbowiak, T.; Debeaufort, F. Impact of functional properties and release kinetics on antioxidant activity of biopolymer active films and coatings. Food Chem. 2018, 242, 369–377. [Google Scholar] [CrossRef]
- Alarcón-Moyano, J.K.; Bustos, R.O.; Herrera, M.L.; Matiacevich, S.B. Alginate edible films containing microencapsulated lemongrass oil or citral: Effect of encapsulating agent and storage time on physical and antimicrobial properties. J. Food Sci. Technol. 2017, 54, 2878–2889. [Google Scholar] [CrossRef]
- Castro Mayorga, J.L.; Fabra Rovira, M.J.; Cabedo Mas, L.; Sánchez Moragas, G.; Lagaron Cabello, J.M. Antimicrobial nanocomposites and electrospun coatings based on poly(3-hydroxybutyrate-co-3-hydroxyvalerate) and copper oxide nanoparticles for active packaging and coating applications. J. Appl. Polym. Sci. 2018, 135, 45673. [Google Scholar] [CrossRef] [Green Version]
- Higueras, L.; López-Carballo, G.; Hernández-Muñoz, P.; Gavara, R.; Rollini, M. Development of a novel antimicrobial film based on chitosan with LAE (ethyl-Nα-dodecanoyl-L-arginate) and its application to fresh chicken. Int. J. Food Microbiol. 2013, 165, 339–345. [Google Scholar] [CrossRef]
- Wen, P.; Zhu, D.-H.; Feng, K.; Liu, F.-J.; Lou, W.-Y.; Li, N.; Zong, M.-H.; Wu, H. Fabrication of electrospun polylactic acid nanofilm incorporating cinnamon essential oil/β-cyclodextrin inclusion complex for antimicrobial packaging. Food Chem. 2016, 196, 996–1004. [Google Scholar] [CrossRef]
- Rezaei, F.; Shahbazi, Y. Shelf-life extension and quality attributes of sauced silver carp fillet: A comparison among direct addition, edible coating and biodegradable film. LWT 2018, 87, 122–133. [Google Scholar] [CrossRef]
- Sangeetha, V.; Deka, H.; Varghese, T.; Nayak, S. State of the art and future prospectives of poly (lactic acid) based blends and composites. Polym. Compos. 2018, 39, 81–101. [Google Scholar] [CrossRef]
- Radusin, T.; Torres-Giner, S.; Stupar, A.; Ristic, I.; Miletic, A.; Novakovic, A.; Lagaron, J.M. Preparation, characterization and antimicrobial properties of electrospun polylactide films containing Allium ursinum L. extract. Food Packag. Shelf Life 2019, 21, 100357. [Google Scholar] [CrossRef]
- Tas, B.A.; Sehit, E.; Tas, C.E.; Unal, S.; Cebeci, F.C.; Menceloglu, Y.Z.; Unal, H. Carvacrol loaded halloysite coatings for antimicrobial food packaging applications. Food Packag. Shelf Life 2019, 20, 100300. [Google Scholar]
- Takma, D.K.; Korel, F. Active packaging films as a carrier of black cumin essential oil: Development and effect on quality and shelf-life of chicken breast meat. Food Packag. Shelf Life 2019, 19, 210–217. [Google Scholar] [CrossRef]
- Nilsen-Nygaard, J.; Fernández, E.N.; Radusin, T.; Rotabakk, B.T.; Sarfraz, J.; Sharmin, N.; Sivertsvik, M.; Sone, I.; Pettersen, M.K. Current status of biobased and biodegradable food packaging materials: Impact on food quality and effect of innovative processing technologies. Compr. Rev. Food Sci. Food Saf. 2021, 20, 1333–1380. [Google Scholar] [CrossRef]
- Ma, Y.; Li, L.; Wang, Y. Development of PLA-PHB-based biodegradable active packaging and its application to salmon. Packag. Technol. Sci. 2018, 31, 739–746. [Google Scholar] [CrossRef]
- Larsen, H.; Kohler, A.; Magnus, E.M. Ambient oxygen ingress rate method—an alternative method to Ox-Tran for measuring oxygen transmission rate of whole packages. Packag. Technol. Sci. Int. J. 2000, 13, 233–241. [Google Scholar] [CrossRef]
- Larsen, H.; Liland, K.H. Determination of O2 and CO2 transmission rate of whole packages and single perforations in micro-perforated packages for fruit and vegetables. J. Food Eng. 2013, 119, 271–276. [Google Scholar] [CrossRef] [Green Version]
- Pettersen, M.K.; Grøvlen, M.S.; Evje, N.; Radusin, T. Recyclable mono materials for packaging of fresh chicken fillets: New design for recycling in circular economy. Packag. Technol. Sci. 2020, 33, 485–498. [Google Scholar] [CrossRef]
- Zhu, G.; Feng, N.; Xiao, Z.; Zhou, R.; Niu, Y. Production and pyrolysis characteristics of citral–monochlorotriazinyl-β-cyclodextrin inclusion complex. J. Therm. Anal. Calorim. 2015, 120, 1811–1817. [Google Scholar] [CrossRef]
- Tian, H.; Lu, Z.; Li, D.; Hu, J. Preparation and characterization of citral-loaded solid lipid nanoparticles. Food Chem. 2018, 248, 78–85. [Google Scholar] [CrossRef] [PubMed]
- Silverstein, R.M. Spectrometric Identification of Organic Compounds; Silverstein, R.M., Bassler, G.C., Morrill, T.C., Eds.; Wiley & Sons: Hoboken, NJ, USA, 1974. [Google Scholar]
- Zeid, A.; Karabagias, I.K.; Nassif, M.; Kontominas, M.G. Preparation and evaluation of antioxidant packaging films made of polylactic acid containing thyme, rosemary, and oregano essential oils. J. Food Process. Preserv. 2019, 43, 14102. [Google Scholar] [CrossRef]
- Hamad, K.; Kaseem, M.; Yang, H.; Deri, F.; Ko, Y. Properties and medical applications of polylactic acid: A review. Express Polym. Lett. 2015, 9, 435–455. [Google Scholar] [CrossRef]
- Panseri, S.; Martino, P.; Cagnardi, P.; Celano, G.; Tedesco, D.; Castrica, M.; Balzaretti, C.; Chiesa, L. Feasibility of biodegradable based packaging used for red meat storage during shelf-life: A pilot study. Food Chem. 2018, 249, 22–29. [Google Scholar] [CrossRef]
- Pettersen, M.; Bardet, S.; Nilsen, J.; Fredriksen, S. Evaluation and suitability of biomaterials for modified atmosphere packaging of fresh salmon fillets. Packag. Technol. Sci. 2011, 24, 237–248. [Google Scholar] [CrossRef]
- Jiménez, S.; Salsi, M.; Tiburzi, M.; Rafaghelli, R.; Tessi, M.; Coutaz, V. Spoilage microflora in fresh chicken breast stored at 4 C: Influence of packaging methods. J. Appl. Microbiol. 1997, 83, 613–618. [Google Scholar] [CrossRef]
- Pettersen, M.K.; Hansen, A.Å.; Mielnik, M. Effect of different packaging methods on quality and shelf life of fresh reindeer meat. Packag. Technol. Sci. 2014, 27, 987–997. [Google Scholar] [CrossRef]
- Van Moeseke, W.; De Smet, S. Effect of time of deboning and sample size on drip loss of pork. Meat Sci. 1999, 52, 151–156. [Google Scholar] [CrossRef]
- Jakobsen, M.; Bertelsen, G. The use of CO2 in packaging of fresh red meats and its effect on chemical quality changes in the meat: A review. J. Muscle Foods 2002, 13, 143–168. [Google Scholar] [CrossRef]
- Patsias, A.; Badeka, A.; Savvaidis, I.; Kontominas, M. Combined effect of freeze chilling and MAP on quality parameters of raw chicken fillets. Food Microbiol. 2008, 25, 575–581. [Google Scholar] [CrossRef]
- Holck, A.L.; Pettersen, M.K.; Moen, M.H.; Sørheim, O. Prolonged shelf life and reduced drip loss of chicken filets by the use of carbon dioxide emitters and modified atmosphere packaging. J. Food Prot. 2014, 77, 1133–1141. [Google Scholar] [CrossRef] [PubMed]
- Rotabakk, B.T.; Birkeland, S.; Jeksrud, W.K.; Sivertsvik, M. Effect of modified atmosphere packaging and soluble gas stabilization on the shelf life of skinless chicken breast fillets. J. Food Sci. 2006, 71, S124–S131. [Google Scholar] [CrossRef]
- Chan, S.S.; Roth, B.; Skare, M.; Hernar, M.; Jessen, F.; Løvdal, T.; Jakobsen, A.N.; Lerfall, J. Effect of chilling technologies on water holding properties and other quality parameters throughout the whole value chain: From whole fish to cold-smoked fillets of Atlantic salmon (Salmo salar). Aquaculture 2020, 526, 735381. [Google Scholar] [CrossRef]
- Yin, H.; Gilbert, E.R.; Chen, S.; Wang, Y.; Zhang, Z.; Zhao, X.; Zhang, Y.; Zhu, Q. Effect of hybridization on carcass traits and meat quality of erlang mountainous chickens. Asian-Australas. J. Anim. Sci. 2013, 26, 1504. [Google Scholar] [CrossRef] [Green Version]
- Shaarani, S.M.; Nott, K.P.; Hall, L.D. Combination of NMR and MRI quantitation of moisture and structure changes for convection cooking of fresh chicken meat. Meat Sci. 2006, 72, 398–403. [Google Scholar] [CrossRef]
- Borch, E.; Kant-Muermans, M.-L.; Blixt, Y. Bacterial spoilage of meat and cured meat products. Int. J. Food Microbiol. 1996, 33, 103–120. [Google Scholar] [CrossRef]
- Granum, P. Bacillus species. In The Microbiological Safety and Quality of Food; Lund, B.M., Baird-Parker, T.C., Gould, G.W., Eds.; Aspen Publishers: New York, NY, USA, 2000; Volume 1, pp. 214–234. [Google Scholar]
- García-Soto, B.; Miranda, J.M.; Rodríguez-Bernaldo de Quirós, A.; Sendón, R.; Rodríguez-Martínez, A.V.; Barros-Velázquez, J.; Aubourg, S.P. Effect of biodegradable film (lyophilised alga Fucus spiralis and sorbic acid) on quality properties of refrigerated megrim (Lepidorhombus whiffiagonis). Int. J. Food Sci. Technol. 2015, 50, 1891–1900. [Google Scholar] [CrossRef]
- Pettersen, M.; Nissen, H.; Eie, T.; Nilsson, A. Effect of packaging materials and storage conditions on bacterial growth, off-odour, pH and colour in chicken breast fillets. Packag. Technol. Sci. Int. J. 2004, 17, 165–174. [Google Scholar] [CrossRef]
- Vihavainen, E.; Lundström, H.-S.; Susiluoto, T.; Koort, J.; Paulin, L.; Auvinen, P.; Björkroth, K.J. Role of broiler carcasses and processing plant air in contamination of modified-atmosphere-packaged broiler products with psychrotrophic lactic acid bacteria. Appl. Environ. Microbiol. 2007, 73, 1136–1145. [Google Scholar] [CrossRef] [Green Version]
- Senanayake, U.M.; Lee, T.H.; Wills, R.B. Volatile constituents of cinnamon (Cinnamomum zeylanicum) oils. J. Agric. Food Chem. 1978, 26, 822–824. [Google Scholar] [CrossRef]
- Eilamo, M.; Kinnunen, A.; Latva-Kala, K.; Ahvenainen, R. Effects of packaging and storage conditions on volatile compounds in gas-packed poultry meat. Food Addit. Contam. 1998, 15, 217–228. [Google Scholar] [CrossRef]
- Nychas, G.-J.E.; Skandamis, P.N.; Tassou, C.C.; Koutsoumanis, K.P. Meat spoilage during distribution. Meat Sci. 2008, 78, 77–89. [Google Scholar] [CrossRef]
- Gram, L.; Ravn, L.; Rasch, M.; Bruhn, J.B.; Christensen, A.B.; Givskov, M. Food spoilage—Interactions between food spoilage bacteria. Int. J. Food Microbiol. 2002, 78, 79–97. [Google Scholar] [CrossRef]
- Mikš-Krajnik, M.; Yoon, Y.-J.; Yuk, H.-G. Detection of volatile organic compounds as markers of chicken breast spoilage using HS-SPME-GC/MS-FASST. Food Sci. Biotechnol. 2015, 24, 361–372. [Google Scholar] [CrossRef]
- Lambert, A.D.; Smith, J.P.; Dodds, K.L. Shelf life extension and microbiological safety of fresh meat—A review. Food Microbiol. 1991, 8, 267–297. [Google Scholar] [CrossRef]
- Tománková, J.; Bořilová, J.; Steinhauserová, I.; Gallas, L. Volatile organic compounds as biomarkers of the freshness of poultry meat packaged in a modified atmosphere. Czech J. Food Sci. 2012, 30, 395–403. [Google Scholar] [CrossRef] [Green Version]
- McLeod, A.; Hovde Liland, K.; Haugen, J.E.; Sørheim, O.; Myhrer, K.S.; Holck, A.L. Chicken fillets subjected to UV-C and pulsed UV light: Reduction of pathogenic and spoilage bacteria, and changes in sensory quality. J. Food Saf. 2018, 38, e12421. [Google Scholar] [CrossRef] [PubMed] [Green Version]
- Leonardos, G.; Kendall, D.; Barnard, N. Odor threshold determination of 53 odorant chemicals. J. Environ. Conserv. Eng. 1974, 3, 579–585. [Google Scholar] [CrossRef] [Green Version]
- Cometto-Muñiz, J.E.; Cain, W.S.; Abraham, M.H.; Kumarsingh, R. Sensory Properties of Selected Terpenes: Thresholds for Odor, Nasal Pungency, Nasal Localization, and Eye Irritationa. Ann. N. Y. Acad. Sci. 1998, 855, 648–651. [Google Scholar] [CrossRef] [Green Version]


| Packaging Combinations (PC) | Material | Packing Method (MAP)-Gas Composition |
|---|---|---|
| 1 | PLAb | 60% CO2/40% N2 |
| 2 | PLAb | 75% O2/25% CO2 |
| 3 | PLAb + 4%citral | 60% CO2/40% N2 |
| 4 | PLAb + 4%citral | 75% O2/25% CO2 |
| 5 | PLAb + 4%cinnamon oil | 60% CO2/40% N2 |
| 6 | PLAb + 4%cinnamon oil | 75% O2/25% CO2 |
| 7 | PLAb + 2%citral + 2%cinnamon oil | 60% CO2/40% N2 |
| 8 | PLAb + 2%citral + 2%cinnamon oil | 75% O2/25% CO2 |
| 9 | Reference: APET/PE | 60% CO2/40% N2 |
| 10 | Reference: APET/PE | 75% O2/25% CO2 |
| Odor Attribute | Description |
|---|---|
| Sour odor | Related to a fresh, balanced odor due to the presence of organic acids |
| Burnt odor | Associated with a burnt/burning odor |
| Metallic odor | Odor of metal (ferrous sulfate) |
| Sulfur odor | Odor of sulfur |
| Cinnamon odor | Associated to odor of spices (cinnamon, cloves, nutmeg) |
| Lemon odor | Associated to odor of lemon/ lemon aroma |
| Off odor | Related to odor which does not naturally exist in chicken |
| Cloying odor | Associated with an unfresh, sickening odor |
| Fermented odor | Associated to fermented acids, tainted |
| Rancid odor | The intensity of all rancid odors (grass, hay, candle, paint) |
| Prickly odor | Associated with a sharp, pungent odor |
Publisher’s Note: MDPI stays neutral with regard to jurisdictional claims in published maps and institutional affiliations. |
© 2021 by the authors. Licensee MDPI, Basel, Switzerland. This article is an open access article distributed under the terms and conditions of the Creative Commons Attribution (CC BY) license (https://creativecommons.org/licenses/by/4.0/).
Share and Cite
Sarfraz, J.; Hansen, A.Å.; Haugen, J.-E.; Le, T.-A.; Nilsen, J.; Skaret, J.; Huynh, T.P.; Pettersen, M.K. Biodegradable Active Packaging as an Alternative to Conventional Packaging: A Case Study with Chicken Fillets. Foods 2021, 10, 1126. https://0-doi-org.brum.beds.ac.uk/10.3390/foods10051126
Sarfraz J, Hansen AÅ, Haugen J-E, Le T-A, Nilsen J, Skaret J, Huynh TP, Pettersen MK. Biodegradable Active Packaging as an Alternative to Conventional Packaging: A Case Study with Chicken Fillets. Foods. 2021; 10(5):1126. https://0-doi-org.brum.beds.ac.uk/10.3390/foods10051126
Chicago/Turabian StyleSarfraz, Jawad, Anlaug Ådland Hansen, John-Erik Haugen, Trung-Anh Le, Jorunn Nilsen, Josefine Skaret, Tan Phat Huynh, and Marit Kvalvåg Pettersen. 2021. "Biodegradable Active Packaging as an Alternative to Conventional Packaging: A Case Study with Chicken Fillets" Foods 10, no. 5: 1126. https://0-doi-org.brum.beds.ac.uk/10.3390/foods10051126