Article

Modelling the Effect of Salt Concentration on the Fate of Listeria monocytogenes Isolated from Costa Rican Fresh Cheeses

by
Guiomar D. Posada-Izquierdo
1,*,
Beatriz Mazón-Villegas
2,
Mauricio Redondo-Solano
3,
Alejandra Huete-Soto
3,
Diana Víquez-Barrantes
4,
Antonio Valero
1,
Paula Fallas-Jiménez
3 and
Rosa María García-Gimeno
1
1
Departamento de Bromatología y Tecnología de los Alimentos, Facultad de Veterinaria, Campus de Excelencia Internacional Agroalimentario (ceiA3), Universidad de Córdoba, Ctra. Madrid-Cádiz km 396A, 14014 Córdoba, Spain
2
Escuela de Ingeniería de Biosistemas, Cuidad Universitaria Rodrigo Facio, Universidad de Costa Rica, 11501-2060 San José, Costa Rica
3
Research Center for Tropical Diseases (CIET) and Food Microbiology Research and Training Laboratory (LIMA), Faculty of Microbiology, Ciudad Universitaria Rodrigo Facio, University of Costa Rica, 11501-2060 San José, Costa Rica
4
National Center for Food Science and Technology (CITA), Ciudad Universitaria Rodrigo Facio, University of Costa Rica, 11501-2060 San José, Costa Rica
*
Author to whom correspondence should be addressed.
Submission received: 6 May 2021 / Revised: 16 June 2021 / Accepted: 15 July 2021 / Published: 26 July 2021
(This article belongs to the Special Issue Listeria in Food: Prevalence and Control)

Abstract

:
“Turrialba cheese” is a Costa Rican fresh cheese highly appreciated due to its sensory characteristics and artisanal production. As a ready-to-eat dairy product, its formulation could support Listeria monocytogenes growth. L. monocytogenes was isolated from 14.06% of the samples and the pathogen was able to grow under all tested conditions. Due to the increasing demand for low-salt products, the objective of this study was to determine the effect of salt concentration on the growth of pathogen isolates obtained from local cheese. Products from retail outlets in Costa Rica were analyzed for L. monocytogenes. These isolates were used to determine growth at 4 °C for different salt concentration (0.5–5.2%). Kinetic curves were built and primary and secondary models developed. Finally, a validation study was performed using literature data. The R2 and Standard Error of fit of primary models were ranked from 0.964–0.993, and 0.197–0.443, respectively. An inverse relationship was observed between growth rate and salt concentration. A secondary model was obtained, with R2 = 0.962. The model was validated, and all values were Bf > 1, thus providing fail-safe estimations. These data were added to the free and easy-to-use predictive microbiology software “microHibro” which is used by food producers and regulators to assist in decision-making.

1. Introduction

L. monocytogenes is a ubiquitous microorganism that can be present in ready-to-eat foods (RTE) since there is no bactericidal treatment during the manufacturing process [1] before consumption. Fresh cheese, as a RTE product are usually stored at refrigeration temperatures and since L. monocytogenes is a psychrotrophic bacteria can grow in this food [2,3]. According to [4], half of L. monocytogenes outbreaks reported in Europe have been associated to the consumption of dairy products. Previous research performed in Costa Rica, has confirmed L. monocytogenes contamination in artisanal fresh cheeses, raw milk and food contact surfaces within the processing environment; some of the strains isolated were found to have pathogenic potential (not published).
Dairy products are well-known for their high nutritional value, convenience and high diversity. In Costa Rica, the average consumption of dairy products is around 216 kg per capita per year [5]. An estimated 42% of the milk produced in Costa Rica is used for artisanal fresh cheese production [6]. “Turrialba cheese” is one type of “latino-type fresh cheese” and is considered one of the most representative dairy products in Costa Rica, being consumed by a large portion of the population and produced following a traditional fresh cheese process, using cow milk, culture and rennet. This cheese is mainly manufactured by artisans, making it common to use unpasteurized milk. Following operations include addition of ingredients, curding, draining, pressing and packaging. Salt is added after draining and currently on market is obtained with salt concentration between 1.5–2.0%. Reduction of sodium levels in its formulation could have a significant effect on consumers’ diet. The physico-chemical properties of this cheese include humidity below 55%, fat content above 18.5%, protein content above 14.5%, pH 6.2–6.5 [7], can favor the survival and growth of pathogenic and spoilage microorganisms. In addition, a large proportion of this type of cheese is elaborated under artisanal or semi-artisanal conditions where the lack of standard procedures and good manufacturing practices could enhance the presence of foodborne pathogens such as Listeria monocytogenes [8]. Artisanal cheeses in Latin America are frequently made with raw milk which represents an increased risk for the growth of pathogenic microorganisms. The effect of variation in “Turrialba cheese” formulation on the microbial safety of the final product has not been properly studied. A study involving 15 small artisanal producers from Costa Rica determined that 80% of them do not analyze the microbiological or physico-chemical properties of the milk used to elaborate their cheeses, and 53% of them have not yet established cleaning and disinfection procedures [9].
The risk of listeriosis associated with the consumption of “Latin-type fresh cheese” is related to the capacity of virulent strains to survive and proliferate on the final product. Even though L. monocytogenes growth on fresh cheeses has been demonstrated previously [10,11] to our knowledge, the capacity of L. monocytogenes to proliferate in “Turrialba cheese” has not been properly addressed. Predictive microbiology becomes a useful tool to characterize the response of microorganisms to environmental conditions [12]. Regarding salt concentration, there is an increasing demand to reduce the amount of sodium added to RTE foods [13,14]. However, this would compromise product safety since salt helps to curb L. monocytogenes growth, thus extending the shelf-life. This study aimed to develop a mathematical model to describe the effect of different salt levels on the growth of L. monocytogenes isolates from fresh cheeses.

2. Materials and Methods

Samples of “Turrialba cheese” (Latin-type fresh cheese) were obtained from different locations in Costa Rica to determine the levels of contamination with L. monocytogenes. Afterwards, isolates from cheese samples were used to perform challenge studies to analyze the effect of salt concentration (%) on the growth of L. monocytogenes during storage at refrigeration. Microbial counts (log CFU/g) were used to develop primary and secondary models to describe the growth potential of L. monocytogenes in “Turrialba cheese”. Finally, a model validation was also performed from the collection of data from previous publications, databases and predictive microbiology software tools (ComBase, Food Spoilage and Safety Predictor (FSSP) and Pathogen Modeling Program (PMP)).

2.1. Isolation of L. Monocytogenes from Cheese

2.1.1. Collection of Samples

Sixty-four samples of fresh “Turrialba cheese” were collected from different retail stores located in the Central Valley of Costa Rica (more than 50% of the total Costa Rican population lives in this area) following a convenience non-probability sampling technique. Samples were collected preferentially from small shops in public markets in the cities of San José (n = 28), Heredia (n = 13), Cartago (n = 11) and Alajuela (n = 12). Samples were cut from a larger piece (unwrapped) at the moment of purchase. Each retailer was asked to provide fresher samples (less than six days old) as no specific label or information was available from any of the processors. Approximately, 200 g of each sample were collected inside a sterile sampling bag and transported at low temperature (<4 °C) to the laboratory for further processing. Samples were analyzed within 3 h of purchase.

2.1.2. Isolation of L. monocytogenes

Minor modifications were made to the procedure detailed in the Bacteriological Analytical Manual [15] to isolate L. monocytogenes from fresh “Turrialba cheese. Briefly, 10 g of each sample was mixed and stomached with 90 mL of Buffered Listeria Enrichment Broth (BLEB; Oxoid, Basingstoke UK). This sample homogenate was incubated at 35 °C for 48 h. A total volume of 0.1 mL of the enriched broth was used to streak Modified Oxford Medium Agar plates (MOX; Oxoid, Basingstoke UK) both after 24 and 48 h of incubation. In addition, Fraser broth (Oxoid, Basingstoke UK) tubes were inoculated with 0.1 mL of the enriched BLEB (after 48 h of incubation) and incubated at 35 °C for 48 h, for additional enrichment. Additional MOX plates were streaked from the Fraser tubes that showed a dark color after the enrichment. After incubation, one typical Listeria spp. colony (gray color, central depression, black halo) from each positive sample was isolated on Tryptic Soy Agar (Oxoid, Basingstoke UK) plates for further identification.

2.1.3. Identification of L. monocytogenes

Suspicious Listeria spp. colonies were typed initially using biochemical tests. Biochemical identification included the sugar fermentation test (xylose, rhamnose and mannose), the CAMP-test and the VITEK 2® system (bioMérieux, Marcy-L’Etoile, France). Species identification was performed by proteomic analysis using Laser Assisted Matrix and Flight Time Desorption/Ionization Mass Spectrometry (MALDI-TOF/MS), using the MicroFlex LT system with MBT library DB-5989 (Bruker Daltonics, Bremen, Germany).

2.2. Challenge Test Study

2.2.1. Manufacturing of Fresh “Turrialba Cheese”

One batch of Fresh “Turrialba cheese” formulated with different concentrations of salt (ranging from 0.5 to 5.2%) was manufactured at the pilot plant of Centro Nacional de Ciencia y Tecnología de Alimentos (CITA, University of Costa Rica). For this purpose, 60 L of fresh milk (pH values between 6.5–6.7) kept at a temperature of 5 °C was obtained from a local supplier. The milk was pasteurized at 63 °C for 30 min and cooled to 40 °C. This was followed by the addition of CaCl2 and the starter culture (strain STI-14; Christian Hansen, Denmark) to the milk once the temperature reached 37 °C; this mixture was left to rest for 25 min. The milk was then mixed with the rennet (CHYMAX-M; Christian Hansen, Denmark) and left to rest for an additional 25 min at 37 °C. The resulting curd was cut with a wireframe until proper granule measurement (1 × 1 cm) was obtained. The mixture was manually shaken for five minutes, and it was left to rest for ten minutes. The whey was separated from the curd manually and salt (%NaCl) was added at different levels according to the formulation (0.5; 0.8; 1.3; 2.0; 3.3; 5.2). The levels of salt were selected to simulate the average composition of “Turrialba cheese” and some extreme values (high and low). Finally, the cheese was placed inside cylindric molds and pressed using a pneumatic press (413,685 Pa) for 40 min. The final product was divided using sterile utensils into smaller 10 g portions that were air-packaged inside plastic bags and stored at 5 °C until analysis. The product obtained had the typical characteristics of fresh cheese: pH of 6.6, white color, moist appearance, soft milk odor, with small mechanical openings and low acidity perception on taste and odor. All the cheese batches were confirmed as negative for L. monocytogenes.

2.2.2. Enumeration of L. monocytogenes

Different samples (10 g) of each cheese formulation were inoculated with a small population (3.0 log CFU/g) of a cocktail of five L. monocytogenes strains (M15, M21, M30, M31, M52) previously isolated as described in (Section 2.1.2). Samples were air-sealed inside plastic bags and stored at 4 °C. At different time intervals (1, 4, 8, 11, 15 and 18 days). Samples two of each “Turrialba cheese” formulation were taken until at least two points of the stationary phase were reached. The shelf-life of Turrialba cheese is between 7–18 days depending on the quality of the milk. L. monocytogenes populations were enumerated on solid media by using Modified Oxford Agar plates (MOX). The plates were then incubated at 35 °C for 48 h, and typical Listeria colonies were counted. Experimental data (log CFU/g vs. time) were used to build growth curves for each of the salt concentrations (%) evaluated.

2.2.3. Physico-Chemical Characterization of Fresh “Turrialba Cheese”

Samples of the manufactured cheese were stored at 5 °C for seven days. At days 3, 5 and 7 three replicates samples of each salt concentration (%) were removed from storage and analyzed. Values of pH (method 981.12 AOAC [16] and water activity (aw Decagon Devices) were measured during the storage of the fresh cheeses.

2.3. Modelling

2.3.1. Primary Growth Model

Growth data of L. monocytogenes population (log CFU/g) were used to fit the Baranyi and Roberts primary model as this model is widely used to describe bacterial growth under static temperature conditions [17]. Equations (1) and (2) were used to estimate the four parameters model:
y ( t ) = y 0 + μ m a x A ( t ) ln ( 1 + e μ m a x A ( t ) 1 e ( y m a x y 0 ) )
A ( t ) = t + 1 μ m a x   ln ( e μ m a x   t + e μ m a x   λ e μ m a x   ( t + λ ) )
Being y ( t ) bacterial concentration (log CFU/g) at time t (days); y 0   and y m a x   represent the initial and final bacterial concentration, also referenced as log N0 and log Nf, respectively (log CFU/g); μ m a x is the maximum growth rate, defined as the increase of microbial population per time unit (log CFU/d) also named (MGR, rate, μmax); and λ is the lag time, defined as the adaptation period before growth (hours or days), is the time elapsed from the inoculation of the microorganisms in the medium until they begin to multiply. The maximum population density (MPD) is the maximum level that the microbial population can reach under the conditions to which it is subjected (log CFU/g).
The experimental data were fitted using the DMFit tool from the ComBase software [18]. Model adjustment was evaluated by the pseudo- R2 parameter [19] and RMSE (root mean squared error). The kinetic parameters provided by DMFit for the growth data were used for secondary modelling.

2.3.2. Secondary Growth Model

Maximum growth rates of L. monocytogenes ( μ m a x ) obtained from the primary model at different salt concentration (%) were fitted with different mathematical models using MATLAB R2021a; first and second order regression analysis was performed to test the relationship between the rate parameter and salt concentration (%). The commands used for performing this analysis were: R = corrcoef (A); p1 = polyfit (x, y, 2); f1 = polyval (p1, x); res1 = polyval (p1, x) − y); plot (x, y); plot (x, resl). Goodness of fit was assessed through the estimation of the coefficient of determination (R2) and root mean squared error (RMSE). The models developed were further implemented into the microHibro software tool (www.microhibro.com, accessed on 5 May 2021) in order to be accessible to users [20].

2.4. Determination of Growth Potential (δ) of L. monocytogenes

The growth potential (δ, log CFU/g) of L. monocytogenes at each level of salt concentration (%NaCl) was determined by the difference between the counts at the end of the experiments (day 11 at 0.5, 0.8 and 1.3 %NaCl); (day 15 at 2 % NaCl); and (day 18 at 3.3 and 5.2 %NaCl) and at the beginning (time 0) [21]. According to the Technical Guidance document for conducting shelf-life studies on L. monocytogenes in ready-to-eat foods (RTE) [21], when challenge testing is used to estimate δ, values higher than 0.5 log CFU/g are attributed to foods supporting the growth of L. monocytogenes. Therefore, this criterion has been applied to evaluate the different salt concentrations tested.

2.5. Model Validation

A comparison between data observed in this study and data collected from different databases was performed to validate the secondary model. Data were collected from ComBase [18], FSSP [22] and PMP [23]. In addition, data were also collected from previous publications. Data from previous studies were selected with consideration to food product characteristics, variables evaluated according to the behavior of the microorganism under study, and the target microorganism.
Afterwards accuracy and bias factors (Af and Bf) were calculated according to Equations (3) and (4), respectively [24].
A f = 10 | log ( μ m a x p r e d i c t e d / μ m a x o b s e r v e d ) | n
B f = 10 log ( μ m a x p r e d i c t e d / μ m a x o b s e r v e d ) n
where n is the number of values obtained experimentally; μ m a x observed are the values from reported studies on cheese and predictive modelling programs; μ m a x predicted are the values estimated by the model obtained in this study.
The Af indicates the spread of data observed in comparison with the predictions of the model, and Bf is a measure of how much the model under/or overestimates the kinetic parameter observed experimentally. Ideally, Af = Bf = 1, which would indicate perfect agreement between the parameter values observed and the ones predicted by the model obtained. Graphical validation was performed by plotting the data obtained from the literature versus the predicted values of the model developed in this study, to assess the overall reliability of the model.

2.6. Statistics

Data analysis was performed with Microsoft Excel (Microsoft Corporation®) as average values and standard deviation, and IBM SPSS v25 (USA) to estimate the significant differences between the tested variables: pH and water activity (aw) with respect to the salt concentration (%NaCl) and storage time (days). Significant differences were considered using a p-value < 0.05.

3. Results

3.1. Listeria Monocytogenes Isolation from Fresh “Turrialba Cheese”

Table 1 shows the results for L. monocytogenes isolation from fresh “Turrialba cheese”. All the samples were obtained from small retail establishments where the cheese was cut at the moment of purchase. Information about the specific brand, the formulation and the expiration date of the samples were not available. It is probable that most of the samples originated from Turrialba, Cartago province. A total of nine of the 64 samples (14.1%) tested positive. Most of the samples were obtained from San José province but the highest levels of prevalence were observed in the case of Cartago (4 out of 11 positive samples). All samples obtained from Alajuela (No. samples 12) were negative for L. monocytogenes. Other Listeria spp. isolates were observed but their biochemical profile did not correspond to L. monocytogenes.

3.2. Challenge Test

The growth curves for L. monocytogenes in fresh cheese formulated with different concentrations of salt (%NaCl) are shown in Figure 1. It was observed that the microorganism was able to grow under all test conditions. It was expected that a characteristic lag phase of the growth curve would be identified, although no visible lag phase was recorded in any of the samples, and in all cases complete growth curves were observed. A lack of lag phase was obtained because the strains were adapted to the environment, the food product components and the salt concentrations used to make fresh “Turrialba cheese”. L. monocytogenes needed shorter times to attain stationary phase in the case of formulations containing lower salt concentrations (0.5, 0.8 and 1.3 % NaCl). For the formulation containing the lowest salt concentration (0.5%), the stationary phase was observed by day 5, and it appears that the results of day 8 are pulling down this phase estimate compared with the other salt concentrations, although the differences are less than 1 log. In the case of cheese containing 0.8% of NaCl, stationary phase was noticeable after ~7 days. On the other hand, L. monocytogenes stationary phase was reached after ~12 days on cheese samples containing a higher percentage of NaCl concentrations (3.3 and 5.2%). Results revealed that at a higher salt concentration (%), it took longer to reach the stationary phase.
Interestingly, the highest final L. monocytogenes populations were reported for some of the samples containing higher NaCl concentrations. For example, final L. monocytogenes populations of 9.37 ± 0.08 log CFU/g were observed in cheese formulated with 3.3% of salt whereas the maximum population in cheese containing 0.5% of NaCl was 8.18 ± 0.07 log CFU/g. However, cheese containing 5.2% of NaCl reported the lowest maximum population of L. monocytogenes (7.79 ± 0.16 log CFU/g) by the end of the sampling period. The total time needed to build complete growth curves was within the normal shelf-life reported on fresh cheese (15–18 days at 4 °C) in all the formulations.

Characterization of Fresh “Turrialba Cheese”

Table 2 shows the pH and aw levels of fresh “Turrialba cheese” during storage at 4 °C. It was observed that levels of pH were not affected by the concentration of salt (p > 0.05) and the values decreased significantly (p < 0.0001) throughout storage. On the other hand, lower aw values were reported for cheese samples containing higher NaCl levels as expected, and the lowest value was recorded for one of the samples containing 5.2% of salt (0.937); its levels remained constant for each formulation during storage (p > 0.05).

3.3. Modelling

3.3.1. Primary Growth Model

The observed data of the growth of L. monocytogenes in cheeses were fitted to primary models using DMFIT from [18] as can be observed in Figure 1. The best fit was obtained with the Barany and Robers (Equations (1) and (2)) without lagtime. Table 3 shows the kinetic parameters obtained from primary models of L. monocytogenes growth in fresh “Turrialba cheese” with initial population level (y0 obs) of 1.93 log CFU/g. The R2 and Standard Error of fit (SE) of models ranged from 0.964–0.993, and 0.197 to 0.443, respectively.
An inverse relationship was observed between µmax parameter and salt concentration (%). (Table 3). Even though a lower value in those samples with highest salt concentration (5.2%) was observed, the maximum population density or final value does not seem to have a direct correlation with salt concentration.
The growth potential (δobs) values were in the range of 5.86 to 7.45 log CFU/g, close to model prediction values that were from 5.69 to 7.25 log CFU/g. It is also noteworthy that the model predictions are generally more conservative, i.e., predictions are usually lower than real data (Table 3).

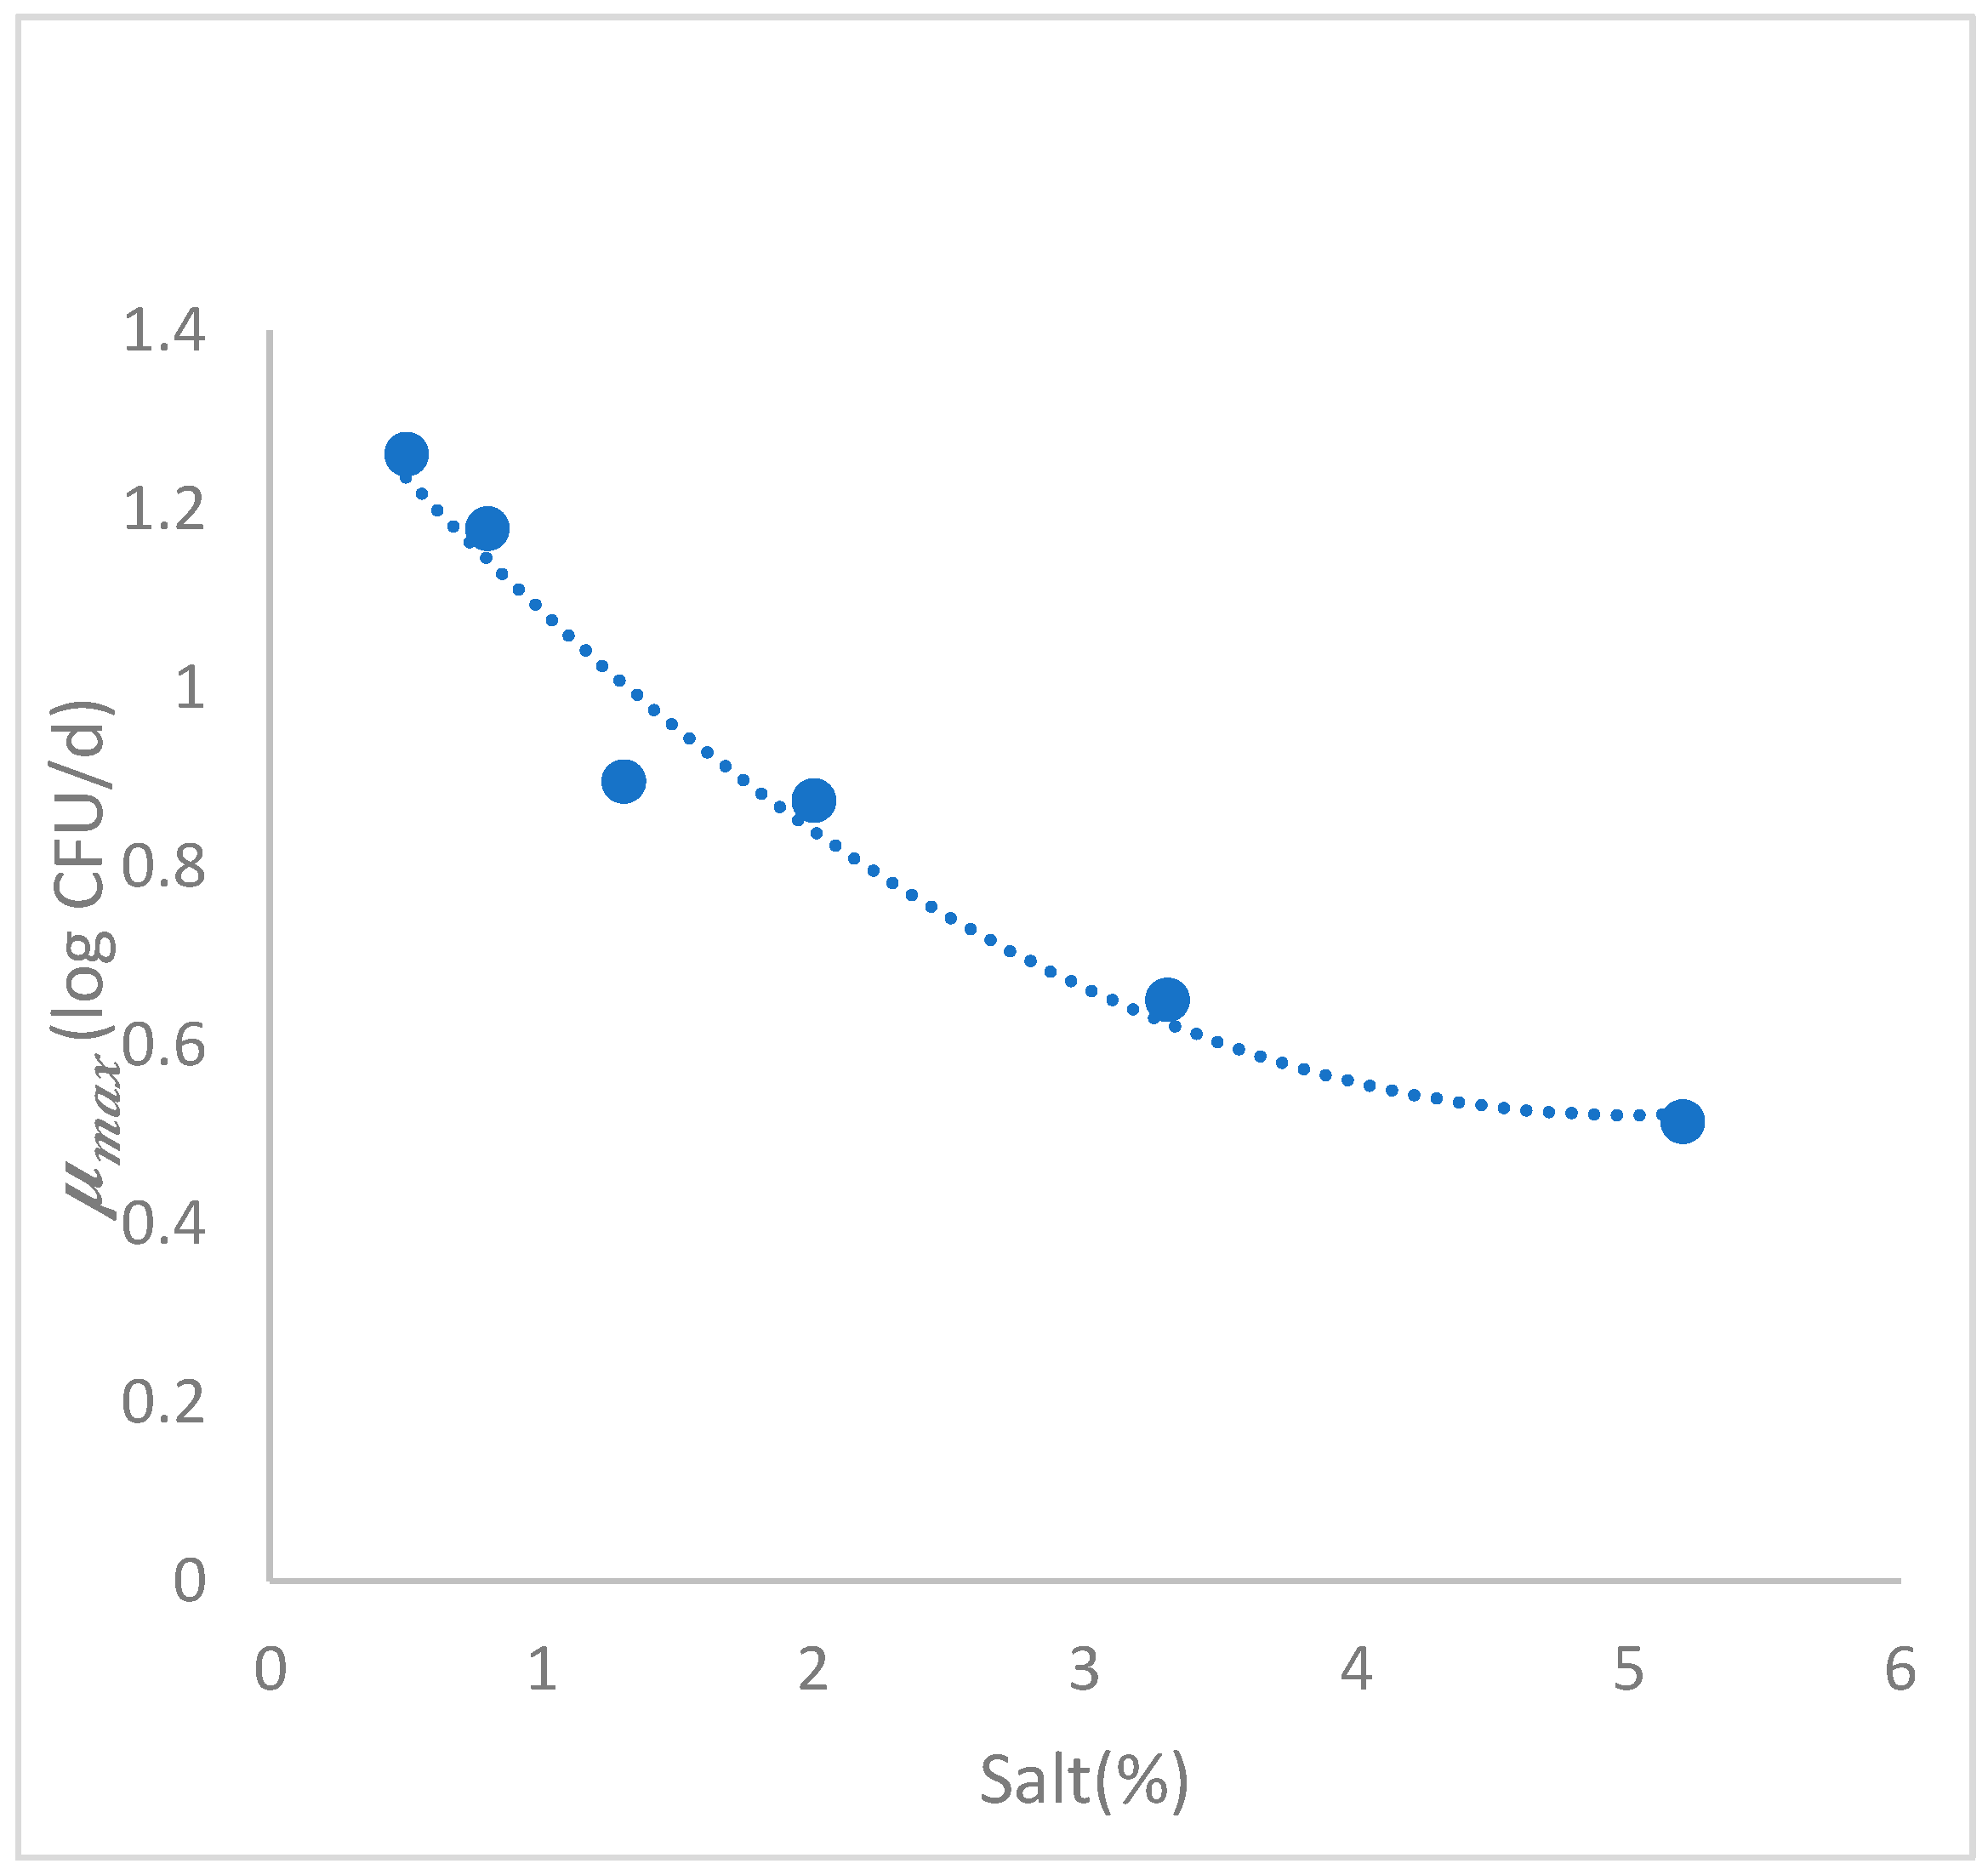
3.3.2. Secondary Growth Model

Kinetic parameter growth rates obtained from the primary model at different % NaCl conditions were fitted (Figure 2) using a polynomial regression model in MATLAB R2021a. A second order polynomial equation was obtained as best fit (Equation (5)). An inverse relationship (p < 0.05) between rate parameter and salt concentration (%) was also reported. Correlation coefficients (R2) of 0.9391 was obtained. The results confirmed that the physical variable of salt concentration (%) has an effect on L. monocytogenes growth versus time on fresh “Turrialba cheese”.
μ m a x = 1.403 0.351 ( N a C l ) + 0.035 ( N a C l ) 2

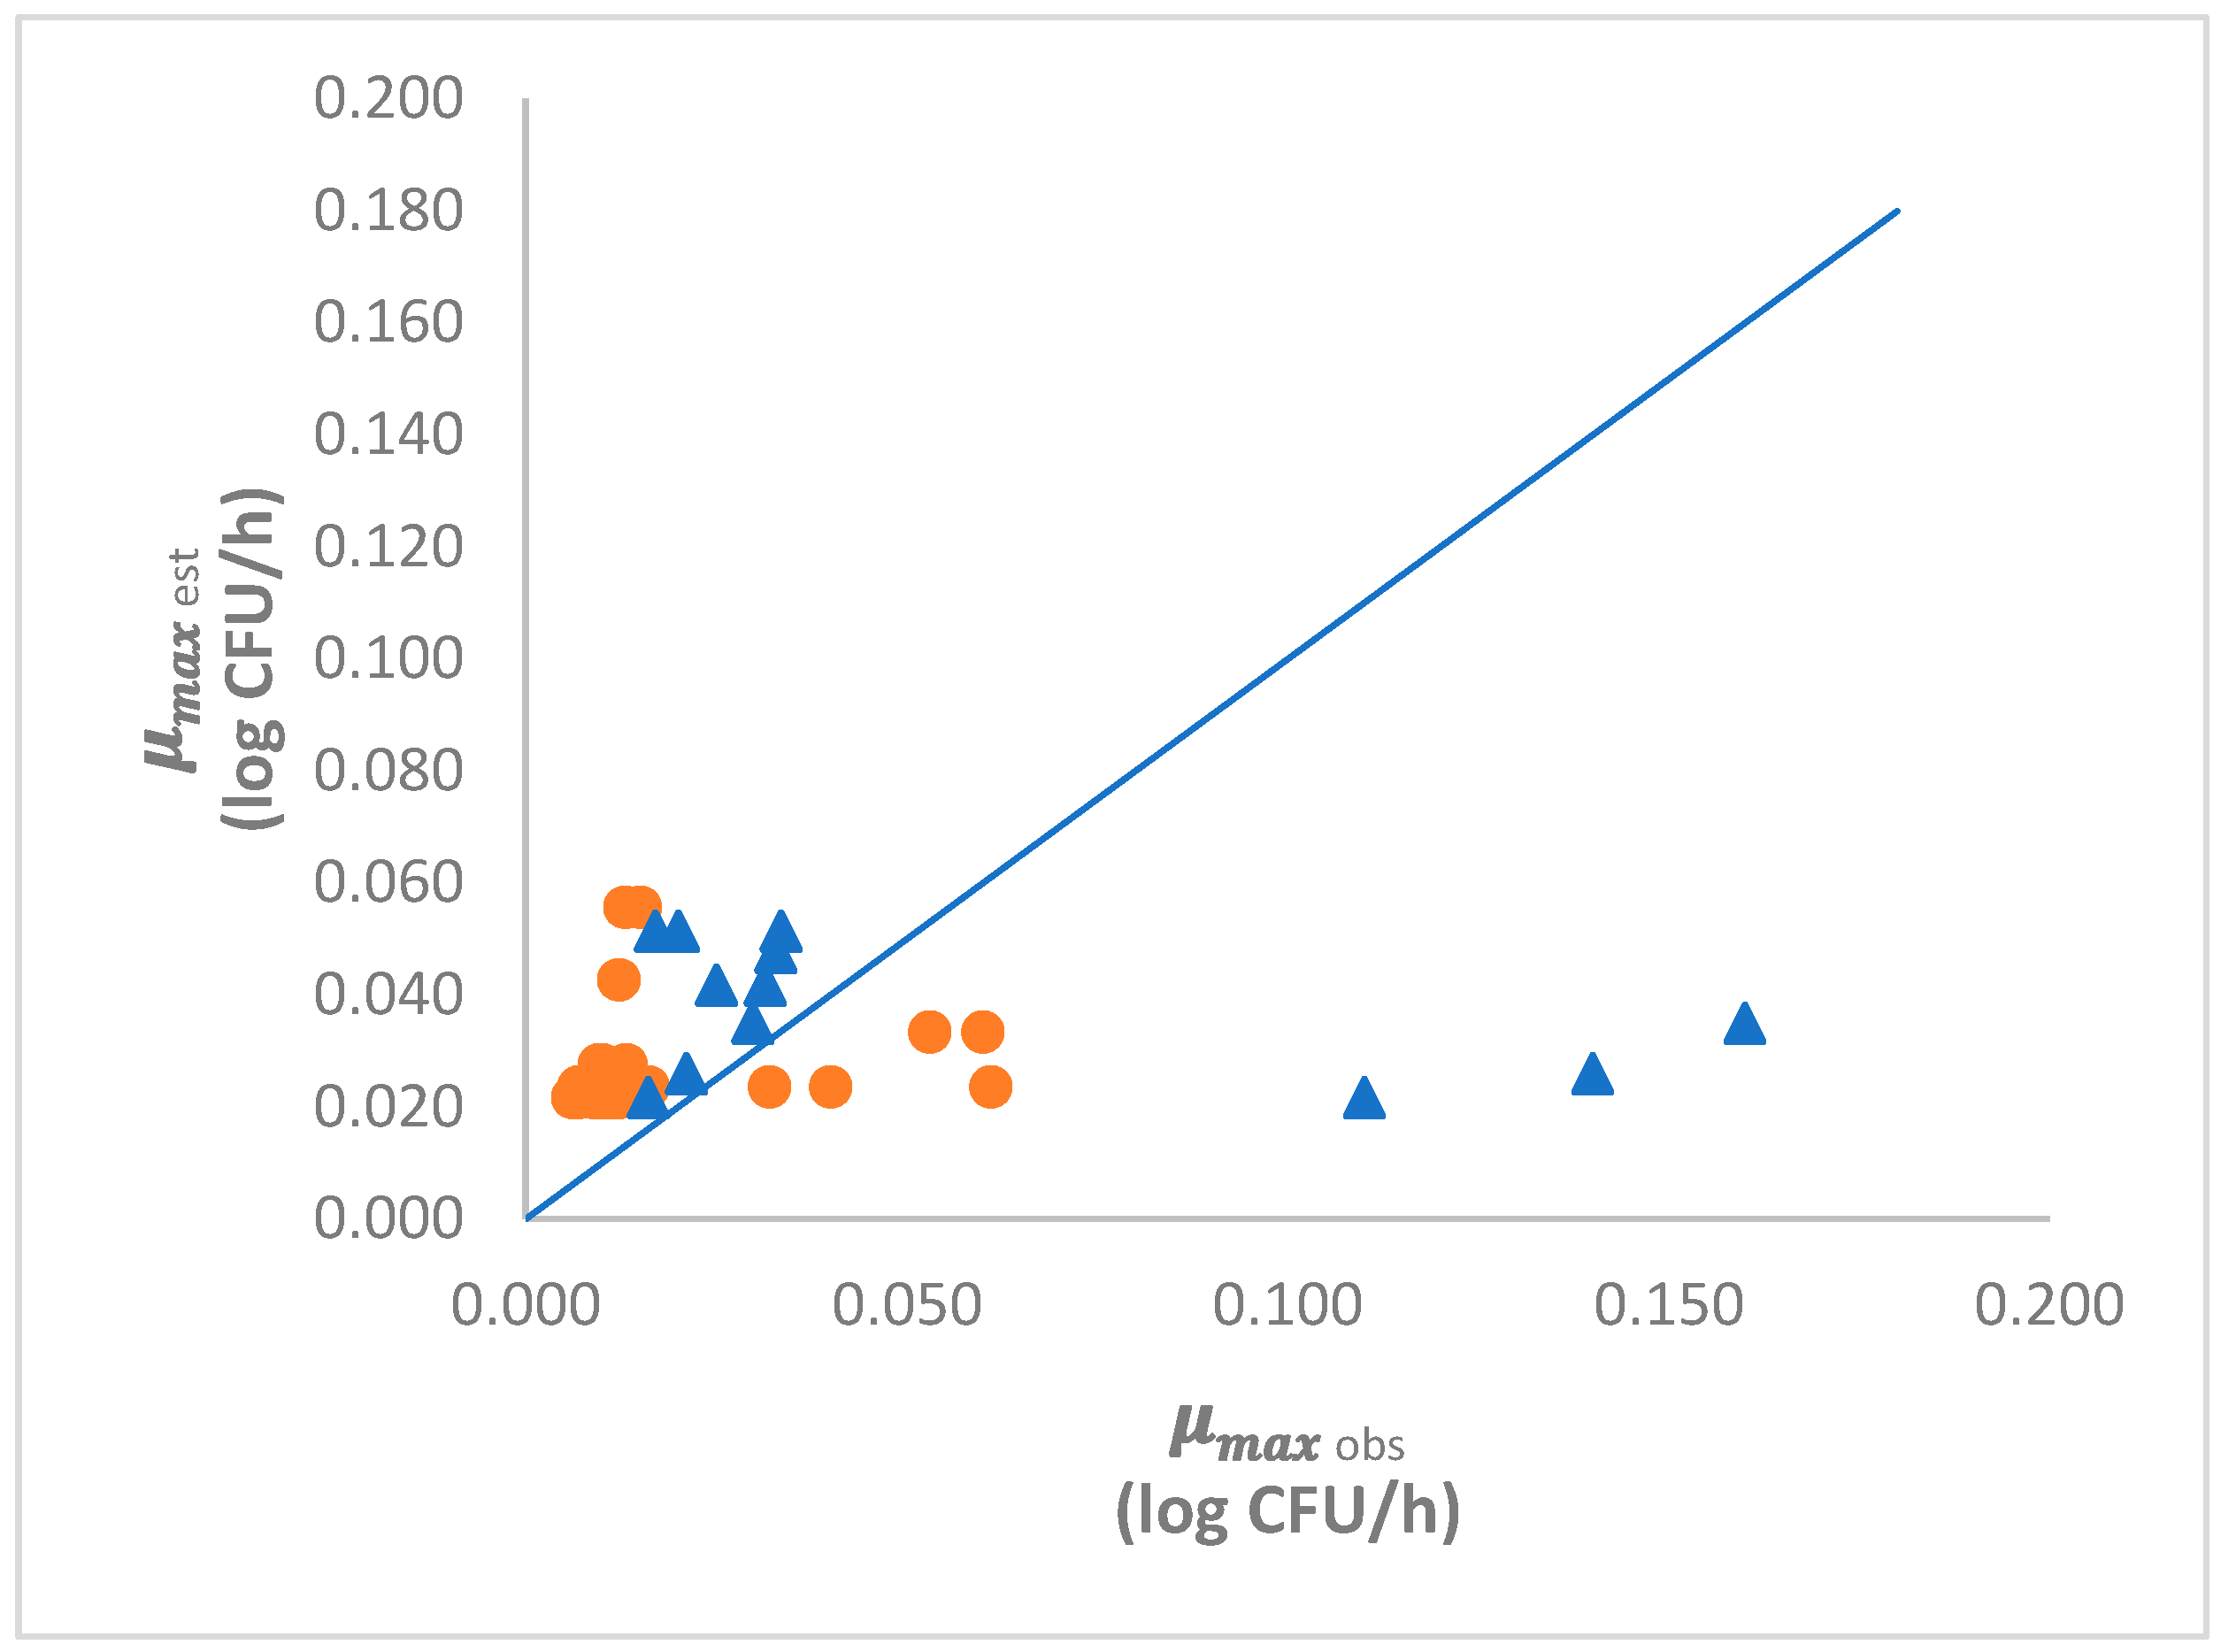
3.3.3. Model Validation

The variable evaluated for validation was µmax of L. monocytogenes in cheeses with similar characteristics of this study (4 °C, pH = 6.5–6.7); and they were obtained from scientific publications and predictive programs software. If growth rates were not reported in the publications, they were estimated. If the conversion of aw to salt % was considered necessary, it was calculated with the equation of [25].
The validation indices Af and Bf (Table 4) was close to value 1 which indicates unbiased and accurate predictions [24]. For a pathogen such as L. monocytogenes, a high performance model is when Bf is in a range of 0.95 to 1.11. An acceptable model performance is when Bf is in a range of 1.11 to 1.43 or of 0.87 to 0.95 [24,26]. Bf was slightly higher than value 1, meaning that estimations were fail-safe. According to the Bf obtained (Table 4), the model developed in the current study was considered acceptable.
Results from the model validation performed with data from previous studies on cheese were considered acceptable (Table 4). In addition, the model validation performed from data collected using different software tools (Combase, FSSP and PMP) was classified as high-performance model validation. In Figure 3, it can be seen that most of the data were above the equivalence line.
In our case, Af in cheeses and in the modelling program is 1.43 and 2.73, respectively (Table 4). [24] stated that Af could increase by 0.10–0.15 for each variable included in the model, so we should expect values for Af of between 1.10 and 1.15 in a model incorporating the effects of salt on growth response.
The model has been introduced into microHibro “www.microhibro.com” (accessed on 5 May 2021) [20], an easy-to-use online application so that all agents, manufacturers or health authorities, can have easy access to the predictive models.

4. Discussion

4.1. Isolation of Listeria Monocytogenes from Fresh Cheese

RTE dairy products are a common vehicle for L. monocytogenes infection in humans [34]. Contamination of dairy products such as cheese normally occurs after processing, when some procedures such as cutting, and packaging are applied [35]. In the case of fresh cheese, contamination with L. monocytogenes could come from raw materials or food contact surfaces both at the industry and retail levels [36]. Latin-style fresh cheeses in particular are classified as high-risk foods for L. monocytogenes [37]. In fact, a study performed for the period 1998–2011 found 90 outbreaks linked to cheese, of which six were related to pasteurized fresh cheese [38].
In this study, the contamination of fresh cheese of Costa Rican origin (“Turrialba” style) was determined and it was confirmed that some products from retail outlets could harbor L. monocytogenes. A previous study performed in Costa Rica, confirmed the contamination of Turrialba fresh cheese although at a higher rate (24.5%) than in this study (14.1%) [39]. The study by [39] used a larger number of samples from different locations. It also reported the presence of other Listeria species, confirming that this food matrix is highly susceptible to microbial contamination. Turrialba cheese shares some of the common characteristics of other “Latin-type” fresh chesses in terms of no ripening, high levels of nutrients, high humidity (55–58%), high pH levels (5.0–6.3) and low salt content (1–3%) [36]. These conditions promote the survival and growth of L. monocytogenes during normal storage of the product at 4 °C [40].
As all the samples from our study were obtained from public stores and it could be assumed that contamination of fresh cheese is related to sanitary and handling practices performed at retail level [41]. However, a significant proportion of these Turrialba cheeses are fabricated under artisanal or semi-artisanal conditions where contamination from the processing environment may occur [42]. Furthermore, there may be significant variations in formulations (particularly the salt concentration), quality of raw ingredients and protocols for storage and distribution that may influence the final microbial safety and quality of the product.

4.2. Challenge Test in Fresh “Turrialba Cheese”

Given that fresh “Turrialba cheese” contamination with L. monocytogenes could occur, the study of pathogen behavior during storage is relevant in terms of risk assessment. Replication of L. monocytogenes in “Turrialba cheese” is expected given the capacity of L. monocytogenes to replicate under a wide range of temperature (1–45 °C), pH (4.0–9.5), aw (>0.92) and salt (up to 10%) conditions [10]. According to [10], L. monocytogenes growth in Mexican-style cheese is possible at salt levels up to 9%, pH value above 6.0 and storage temperature of 10 °C. It is also noticeable that for all treatments, L. monocytogenes reached populations of >7.0 log CFU/g which is higher than the infectious dose reported for this pathogen [43]. In addition, active L. monocytogenes replication was observed in storage periods that are within the normal shelf-life span (15–18 days) reported for fresh cheese [44] that is kept at 4 °C. As “Turrialba cheese” is considered a RTE product it is possible that consumers will be exposed to infectious levels of L. monocytogenes as there may be no further cooking of the cheese.
Most of the available literature reports L. monocytogenes growth in cheese formulated with 2% salt and stored at 4 °C. For example, [45,46] report more that L. monocytogenes can reach populations of 7 log CFU/g in fresh cheeses stored for 11 days at 4 °C. Similar to this study [47] reported populations of more than 7 logs after 6 days of storage at 4 °C (Minas cheese with 2%) whereas [48] also obtained more than 6 logs after 7 days of storage at 7 °C (Queso fresco with 2% salt). The initial inoculation level (3.0 log CFU/g) used in the current study was high enough to cause an outbreak. As the strains were isolated from “Turrialba cheese” they were adapted to the food matrix. Additionally, the secondary model revealed that even if there was an inverse relationship between the maximum growth rate (log CFU/d) and the salt concentration (%), at the end of the evaluation period bacteria population presented high levels. Bacterial growth reported at the end of experimentation period was comparable to the levels reported in other studies [46,47].
Despite the fact that L. monocytogenes can grow easily in fresh cheese, few studies have attempted to understand the effect of salt concentration on the behavior of this pathogen. For this study, L. monocytogenes was able to grow under the highest level of salt (5.2%) but other studies demonstrated that salt levels as high as 9% can support L. monocytogenes growth depending on the pH level [49]. However, L. monocytogenes inhibition was observed in terms of growth rate values, meaning that the application of other conservation strategies [30], could have a significant synergistic inhibitory effect on L. monocytogenes growth on fresh cheese.
Values obtained for pH and aw during different storage times and salt concentration are expected for fresh cheese [36,50]. Even though pH and aw tend to decrease at higher salt concentration, fresh cheese is still considered a high-risk product due to the potential for microbial growth. Behavior of pH during storage time is also expected as biochemical changes are not common in this type of cheese due to its processing. However, pH decreases during storage could be linked to fermentation of residual lactose by heat-stable indigenous bacteria of milk, by the culture added or by post-processing contaminating bacteria [44]. Water activity, on the other hand, also showed an expected behavior.
In addition, differences were found among studies. In the study developed by [51] that included the evaluation of the effect of pH. L. monocytogenes growth versus pH was reported on cheese surfaces between 8 and 18 days. In addition, they affirmed that the lowest L. monocytogenes growth was found on the surface of cheeses with the lowest pH. If pH increased L. monocytogenes growth also increased on cheese rind. For these last results, values of pH reported were close to the pH range of “Turrialba cheese”. In contrast, [52] affirmed that no significant difference was found in L. monocytogenes survival between the low and standard salt concentrations at low and high pH; they also affirmed that L. monocytogenes growth decreased gradually as pH increased from 5.3 to 6.9 on low-salt concentrations at all study temperatures. Even though pH values were constant along the experimental work, these last results disagree with this study since growth rate decreases as salt concentration (%) increases.

4.3. Modelling

Maximum growth rate (µmax, log CFU/d) kinetic parameters of primary models obtained by this study agree with other studies as reported by [29]. Similar to our case, the Baranyi and Roberts model was fitted to the isothermal growth of inoculated pasteurized milk cheeses at a storage temperature of 4 °C. The water activity and pH were 0.96 and 6.40, respectively. Physicochemical characteristics of the food matrix make the studies comparable.
As expected, the increasing salt concentration (%), led to a reduction of µmax (log CFU/d) since salt concentration (%) affects L. monocytogenes growth. In the study conducted by [32], growth prediction of native strains of L. monocytogenes in fresh ricotta reported a maximum rate of 0.816 (log CFU/d) and ymax of 8.62 (log CFU/g) with the conditions shown in Table 4. These results agree with the observed maximum growth rate (µmax, log CFU/d) but not with ymax values (Table 3) on fresh “Turrialba” cheese with 1.3 and 2.0% salt. However, [30] reported values of ymax (9.62–9.43 log CFU/g) that were slightly higher than our fresh cheese (9.236 log CFU/g) at more than 3% of salt concentration. In contrast, with similar salt conditions [29] reported lower values of ymax (5.48 log CFU/g). Lower maximum growth rates (log CFU/d) of L. monocytogenes were described by [33], where only one of the strains used was isolated from Gorgonzola cheese. The growth rates ranged from 0.168 to 0.610 (log CFU/d). Furthermore, the origin and the different ability of the strains to adapt to environmental stresses and cheese structure characteristics are among the possible reasons for such differences.
In the study of [32] the growth of listeria was evaluated in mozzarella, and they affirmed that lag phase was not significant. Furthermore, the strains were isolated from human, a fresh dairy product and a dairy associated outbreak. These results are comparable with the current study, as lag phase was not observed and growth rates values were close. As L. monocytogenes strains in this study were isolated from fresh cheese samples, they probably adjusted and survived much better to the physical and chemical conditions of the fresh “Turrialba” cheese. This may explain why a lag phase was not observed. This contrasts with the studies of [35] that described lag time of 189.07 h with inoculated strains from clinical samples.
Growth potential (δ) for L. monocytogenes in fresh cheese was higher in comparison to other studies with similar product type (Table 3). Lower values of near to 6.50 log CFU/g were reported by [28,30] in fresh cheese and could be explained in terms of the absence of a lag phase given that only L. monocytogenes isolates from “Turrialba cheese” were used; these strains were probably better adapted to grow under the conditions given by the product.
On the other hand, lower growth potential has been reported (4.83–4.80) in the case of other dairy products which had lower pH values (5.42–5.57), such as pasteurized milk cheese paneer [27] and artisanal Belgian cheese [53] due to high acidity levels as shown by [32], in Mozzarella cheese after addition of citric acid.
The importance of the adaptation of L. monocytogenes native strains used in this study is also reflected by the fact that those studies using strains from other sources, such as [29] with 3.5% salt and [33] with 3.85% salt, show a lower growth potential (2.68, 1.80 log CFU/g, respectively) compared to ours (5.86 log CFU/g to 5.2% NaCl). Even though [54] inoculated native strains in their cheeses and reported a growth potential (4.87 log CFU/g) closer to our study, this corresponded to cheeses with more than 8% salt. These data confirm the importance of considering the origin of the isolates when evaluating the growth potential of this pathogen.
Finally, it is also important to note the capacity of L. monocytogenes to compete with other bacterial species. In general terms, L. monocytogenes is not a good competitor, and its growth potential (δ) is lower even when compared with other Listeria species such as L. innocua [55]. It is possible that the higher L. monocytogenes growth potential observed when salt levels increased is related with the inhibition of accompanying microbiota of fresh cheese. Some data collected in our laboratory (not yet published) suggest that the normal microbiota of fresh cheese is around 7.0 log CFU/g, meaning that microbial inhibition given by higher salt levels may offer a competitive advantage for L. monocytogenes. This is crucial, as factors promoting higher growth potential for L. monocytogenes may increase the risk for consumers specially in the case of RTE products, stored at 4 °C. Further research is necessary to evaluate how handling practices and the application of post-processing interventions may affect growth potential for L. monocytogenes in fresh cheese, and its relationship with accompanying microbiota.
In other foodstuffs, it is considered susceptible to pathogen growth, when the δ is higher than 0.5 log CFU/g [56], therefore, its classification falls into the potential risk categories when assessing a long shelf-life. Considering, that in our laboratory the lowest growth potential recorded was (δ = 5.86) for the different concentrations of salt, it can be stated that “Turrialba cheese” presents a high-risk potential to the consumer throughout the useful life.

4.4. Model Validation

According to [57] classification, the model developed by [33] had as a result a ‘very good’ model performance. The model performance of the other studies listed in Table 4 (experiments from [32]), are classified as ‘acceptable performance’ of the model as Bf < 0.87 or > 1.43. The lack of a ‘very good’ model performance adjustment may be due to differences between temperature storage conditions and pH values established in previous studies. These variables are different from the storage temperature (4 °C) and pH value (6.6) of fresh “Turrialba cheese”. In addition, the origin and adaptation of the strains affected the validation results (Bf).
In the case of different cheese product characteristics from fresh “Turrialba cheese” [28,29,30], the Bf is closer to the general mean of validation 1.35. All the estimates of the fresh “Turrialba cheese” model are conservative, because the strains were isolated from this type of cheese and a Bf > 1 always. As a result, this model estimates growth for the worst-case scenario, these results are related to the fact that the strains are already adapted to the conditions of the environment, this justifies the deviation of 1.43 obtained for Af. The same situation is observed in other studies such as [58] (Af 1.13 to 1.59) and [26] (1.78 to 1.33) where all Af are >1.
Previous studies researched the effect of temperature (°C), pH, water activity and time on L. monocytogenes growth on different cheese types, such as fresh ricotta [32], cottage [59], gorgonzola [33], fresh cheese [45] and others. However, there has not been much research on fresh chilled cheeses having different salt concentrations (%) and pH values close to neutral. As seen in Table 4, although the use of predictive models is increasing, further studies are needed on this since the availability of validated models that describe the behavior in foods is essential to prevent outbreaks. In addition, the model supports different steps of the food chain and other scientists who try to describe the behavior of L. monocytogenes. The current study contributes to knowledge on the effect of salt concentration (%) on L. monocytogenes growth on a fresh cheese type which is highly consumed in Central and South America.
Finally, the scientific contribution of this study also consists in the addition of this data into the free and easy-to-use predictive microbiology software “microHibro”.

5. Conclusions

This research allowed to quantify the contamination level and kinetic behavior of autochthonous isolated L. monocytogenes strains in “Turrialba fresh cheese”. Even though the application of predictive models, as microHibro app., helps food operators to set microbial limits and to determine food shelf-life, the effect of salt concentration in fresh cheeses has not been largely studied yet, especially in artisanal elaborated cheeses. Under the studied conditions, it was shown that the decrease of salt led to higher growth rate of L. monocytogenes reaching levels >7.0 log CFU/g at 4 °C regardless of the concentration of salt (%). Moreover, additional antimicrobial interventions may be considered for fresh “Turrialba cheese” to inhibit the growth of this pathogen. It is recommended that intervention strategies are combined with the development of standardized procedures and recipes to stablish low (healthy) salt concentrations (%) and simultaneously to ensure food safety for artisanal and semi-artisanal fresh cheese producers in Costa Rica.
Further studies are needed to integrate these data, since validated models are essential to describe pathogen behavior and to prevent outbreaks. The heterogeneous microbial milk quality and the different applied elaboration methods will need an additional characterization of microbial inter batch variability and processing conditions to properly determine safety shelf-life of “Turrialba fresh cheese”.

Author Contributions

Conceptualization, G.D.P.-I., B.M.-V., M.R.-S. and R.M.G.-G.; methodology, G.D.P.-I., B.M.-V., M.R.-S., D.V.-B., P.F.-J. and R.M.G.-G.; software, G.D.P.-I., B.M.-V. and R.M.G.-G.; validation, G.D.P.-I., B.M.-V., M.R.-S. and R.M.G.-G.; formal analysis, G.D.P.-I., B.M.-V., M.R.-S., D.V.-B., A.V. and R.M.G.-G.; investigation, G.D.P.-I., B.M.-V., M.R.-S., A.H.-S., D.V.-B., P.F.-J. and R.M.G.-G.; data curation, G.D.P.-I., B.M.-V., M.R.-S., A.H.-S., D.V.-B., P.F.-J. and R.M.G.-G.; writing—original draft preparation and editing, G.D.P.-I., B.M.-V., M.R.-S., A.H.-S., D.V.-B., A.V., P.F.-J. and R.M.G.-G.; supervision, B.M.-V., M.R.-S., A.V. and R.M.G.-G.; project administration, M.R.-S. and R.M.G.-G.; funding acquisition, M.R.-S. and R.M.G.-G. All authors have contributed substantially to the work reported. All authors have read and agreed to the published version of the manuscript.

Funding

The research leading to these results has received funding from projects B9606 “Caracterización del riesgo de listeriosis asociado con el consumo de alimentos contaminados en Costa Rica”. Proyecto B6262 “Determinación de opciones tecnológicas que permitan reducir el contenido de sodio manteniendo la calidad e inocuidad de queso fresco” of Vicerrectoría de Investigación, University of Costa Rica and Council of Economy, Knowledge, Business and University of Junta de Andalucía (Project AT 17-5686) and FEDER European funds. The authors are grateful to EU PRIMA program and the International Joint Programming (Project Reference PCI2019-103453) R&D Projects 2019 from the Spanish Ministry of Science and Innovation (Plan Estatal de Investigación Científica y Técnica y de Innovación 2017–2020: State R&D Program Oriented to the Challenges of the Society) for funding the ArtiSaneFood project (PRIMA/0001/2018).

Acknowledgments

This work has been performed by the Research Group AGR-170 (HIBRO) of the Research Andalusian Plan (PAIDI) and the authors acknowledge the Pilot Plant team and research assistant for their contribution on the processing of the cheese.

Conflicts of Interest

The authors declare no conflict of interest.

References

  1. Fonnesbech, B.; Huss, H.; Ojeniyi, B.; Ahrens, P.; Gram, L. Elucidation of Listeria monocytogenes Contamination Routes in Cold-Smoked Salmon Processing Plants Detected by DNA-Based Typing Methods. Appl. Environ. Microbiol. 2001, 67, 2586–2595. [Google Scholar] [CrossRef] [Green Version]
  2. Keto-Timonen, R.; Tolvanen, R.; Lundén, J.; Korkeala, H. An 8-Year Surveillance of the Diversity and Persistence of Listeria monocytogenes in a Chilled Food Processing Plant Analyzed by Amplified Fragment Length Polymorphism. J. Food Prot. 2007, 70, 1866–1873. [Google Scholar] [CrossRef] [Green Version]
  3. Ivanek, R.; Grohn, Y.; Tauer, L.; Wiedmann, M. The Cost and Benefit of Listeria monocytogenes Food Safety Measures. Crit. Rev. Food Sci. Nutr. 2010, 44, 513–523. [Google Scholar] [CrossRef] [PubMed]
  4. Goulet, V.; Jacquet, C.; Vaillant, V.; Rebière, I.; Mouret, E.; Lorente, C.; Maillot, E.; Staïner, F.; Rocourt, J. Listeriosis from consumption of raw-milk cheese. Lancet 1995, 345, 1581–1582. [Google Scholar] [CrossRef]
  5. Cámara Nacional de Productores de Leche. Available online: http://proleche.com/consumo-de-productos-lacteos/ (accessed on 5 May 2021).
  6. Ministerio de Agricultura y Ganadería de Costa Rica. Implementar el Proceso de Inocuidad y Buenas Prácticas de Manufactura en 44 Queserías Propiedad de Pequeños Productores de Queso Artesanal. Available online: http://www.mag.go.cr/bibliotecavirtual/Q02-10964.pdf (accessed on 5 May 2021).
  7. Pliego de Condiciones Denominación de Origen del “Queso Turrialba”. Available online: http://www.fao.org/fileadmin/templates/olq/documents/costarica/ppp/Miercoles/documentacion/PliegoCondicionesDOTurrialba.pdf (accessed on 5 May 2021).
  8. Pacheco-Zamora, M. Determinación de la Concentración Mínima de Cloruro de Sodio que se Puede Reducir en un Queso Fresco sin que Sea Perceptible Para los Consumidores Utilizando un Umbral de Diferencia y su Efecto Sobre el Desuerado y Perfil de Textura. Ph.D. Thesis, University of Costa Rica, San Pedro, Costa Rica, 2018. [Google Scholar]
  9. Víquez-Barrantes, D. Caracterización de la Producción Artesanal de Queso en las Empresas de la Cámara Nacional de Queseros Artesanos y Afines (CANAQUEAF), Capacitación de sus Miembros y Elaboración de una Propuesta de Plan de Acción que Permita Revalorizar los Quesos Artesanales. Ph.D. Thesis, University of Costa Rica, San Pedro, Costa Rica, 2012. [Google Scholar]
  10. Bolton, L.; Frank, J. Defining the Growth/No-Growth Interface for Listeria monocytogenes in Mexican-Style Cheese Based on Salt, pH, and Moisture Content. J. Food Prot. 1999, 62, 601–609. [Google Scholar] [CrossRef]
  11. Cadavez, V.A.P.; Campagnollo, F.B.; Rosicléia, A.S.; Duffner, C.M.; Schaffner, D.W.; Sant’Ana, A.S.; Gonzales-Barron, U. A comparison of dynamic tertiary and competition models for describing the fate of Listeria monocytogenes in Minas fresh cheese during refrigerated storage. Food Microbiol. 2019, 79, 48–60. [Google Scholar] [CrossRef] [Green Version]
  12. Pérez-Rodríguez, F.; Valero Díaz, A.; Carrasco Jiménez, E.; Posada-Izquierdo, G. Predictive Modelling in Food; Cambridge Scholars Publishing: Cambridge, UK, 2019; pp. 1–190. [Google Scholar]
  13. Ministerio de Salud de Costa Rica. Available online: https://www.ministeriodesalud.go.cr/ (accessed on 5 May 2021).
  14. Turck, D.; Castenmiller, J.; de Henauw, S.; Hirsch-Ernst, K.I.; Kearney, J.; Knutsen, H.K.; Maciuk, A.; Mangelsdorf, I.; McArdle, H.J.; Pelaez, C.; et al. Scientific Opinion on the dietary reference values for sodium. EFSA J. 2019, 17, 1–191. [Google Scholar] [CrossRef] [Green Version]
  15. Hitchins, A.D.; Jinnema, K.; Chen, Y. BAM Chapter 10: Detection of Listeria monocytogenes in Foods and Environmental Samples, and Enumeration of Listeria monocytogenes in Foods. Bacteriological Analytical Manual (BAM); 2017. Available online: https://www.fda.gov/food/laboratory-methods-food/bam-chapter-10-detection-listeria-monocytogenes-foods-and-environmental-samples-and-enumeration (accessed on 5 May 2021).
  16. AOAC. Official method 981.12. pH of acidified foods. In Official Methods of Analysis, 13th ed.; AOAC International: Washington, DC, USA, 1990. [Google Scholar]
  17. Baranyi, J.; Roberts, T.A. A dynamic approach to predicting bacterial growth in food. Int. J. Food Microbiol. 1994, 23, 277–294. [Google Scholar] [CrossRef]
  18. ComBase Predictive Models (Software Tools). Available online: Browser.combase.cc/DMFit.aspx (accessed on 5 May 2021).
  19. Schabenberger, O.; Gotway, C.A. Statistical Methods for Spatial Data Analysis, 1st ed.; Chapman and Hall/CRC: Boca Raton, FL, USA, 2005. [Google Scholar] [CrossRef]
  20. González, S.C.; Possas, A.; Carrasco, E.; Valero, A.; Bolívar, A.; Posada-Izquierdo, G.D.; García-Gimeno, R.M.; Zurera, G.; Pérez-Rodríguez, F. ‘MicroHibro’: A software tool for predictive microbiology and microbial risk assessment in foods. Int. J. Food Microbiol. 2019, 2, 226–236. [Google Scholar] [CrossRef]
  21. Beaufort, A. The determination of ready-to-eat foods into Listeria monocytogenes growth and no growth categories by challenge tests. Food Control 2011, 22, 1498–1502. [Google Scholar] [CrossRef]
  22. Food Spoilage and Safety Predictor (FSSP). Available online: http://fssp.food.dtu.dk/ (accessed on 5 May 2021).
  23. Pathogen Modeling Program (PMP). Available online: https://pmp.errc.ars.usda.gov/PMPOnline.aspx (accessed on 5 May 2021).
  24. Ross, T. Indices for performance evaluation of predictive models in food microbiology. J. Appl. Bacteriol. 1996, 81, 501–508. [Google Scholar] [PubMed]
  25. Resnik, S.L.; Chirife, J. Proposed Theoretical Water Activity Values at Various Temperatures for Selected Solutions to be Used as Reference Sources in the Range of Microbial Growth. J. Food Prot. 1988, 51, 419–423. [Google Scholar] [CrossRef]
  26. Mejlholm, O.; Dalgaard, P. Modelling and predicting the simultaneous growth of Listeria monocytogenes and psychrotolerant lactic acid bacteria in processed seafood and mayonnaise-based seafood salads. Food Microbiol. 2015, 46, 1–14. [Google Scholar] [CrossRef] [PubMed]
  27. Sarkar, D.; Ratkowsky, D.A.; Wang, B.; Bowman, J.P.; Tamplin, M.L. Modelling viability of Listeria monocytogenes in paneer. Food Microbiol. 2021, 97, 103738. [Google Scholar] [CrossRef]
  28. Uhlich, G.A.; Luchansky, J.B.; Tamplin, M.L.; Molina-Corral, F.J.; Anandan, S.; Porto-Fett, A.C.S. Effect of storage temperature on the growth of Listeria monocytogenes on Queso Blanco slices. J. Food Saf. 2006, 26, 202–214. [Google Scholar] [CrossRef]
  29. Thomas, M.; Tiwari, R.; Mishra, A. Predictive model of Listeria monocytogenes growth in queso fresco. J. Food Protect. 2019, 82, 2071–2079. [Google Scholar] [CrossRef]
  30. Leggett, L.; Tomasula, P.; Van Hekken, D.; Porto-fett, A.; Shoyer, B.; Renye, J.; Luchansky, J.; Farkye, N. Effect of storage at 4 and 10 °C on the growth of Listeria monocytogenes in and on Queso Fresco. J. Food Saf. 2012, 32, 236–245. [Google Scholar] [CrossRef]
  31. Østergaard, N.B.; Eklöw, A.; Dalgaard, P. Modelling the effect of lactic acid bacteria from starter- and aroma culture on growth of Listeria monocytogenes in cottage cheese. Int. J. Food Microbiol. 2014, 188, 15–25. [Google Scholar] [CrossRef] [PubMed]
  32. Tirloni, E.; Bernardi, C.; Rosshaug, P.S.; Stella, S. Potential growth of Listeria monocytogenes in Italian mozzarella cheese as affected by microbiological and chemical-physical environment. J. Dairy Sci. 2019, 102, 4913–4924. [Google Scholar] [CrossRef] [Green Version]
  33. Dalzini, E.; Cosciani-Cunico, E.; Monastero, P.; Bernini, V.; Neviani, E.; Bellio, A. Decastel y of the behaviour throughout the process and growth prediction during shelf life. Int. J. Food Microbiol. 2017, 262, 71–79. [Google Scholar] [CrossRef]
  34. Buchanan, R.L.; Gorris, L.G.M.; Hayman, M.M.; Jackson, T.C.; Whiting, R.C. A review of Listeria monocytogenes: An update on outbreaks, virulence, dose-response, ecology, and risk assessments. Food Control 2018, 75, 1–13. [Google Scholar] [CrossRef]
  35. Hoelzer, K.; Pouillot, R.; Gallagher, D.; Silverman, M.B.; Kause, J.; Dennis, S. Estimation of Listeria monocytogenes transfer coefficients and efficacy of bacterial removal through cleaning and sanitation. Int. J. Food Microbiol. 2012, 157, 267–277. [Google Scholar] [CrossRef] [PubMed]
  36. Ibarra-Sánchez, L.A.; Van Tassell, M.L.; Miller, M.J. Invited review: Hispanic-style cheeses and their association with Listeria monocytogenes. J. Dairy Sci. 2017, 100, 421–2432. [Google Scholar] [CrossRef] [PubMed]
  37. Mattos, R.; Staples, C.R.; Arteche, A.; Wiltbank, M.C.; Diaz, F.J.; Jenkins, T.C.; Thatcher, W. The effects of feeding fish oil on uterine secretion of PGF2alpha, milk composition, and metabolic status of periparturient Holstein cows. J. Dairy Sci. 2004, 87, 921–932. [Google Scholar] [CrossRef] [Green Version]
  38. Gould, L.H.; Mungai, E.; Behravesh, C.B. Outbreaks Attributed to Cheese: Differences between Outbreaks Caused by Unpasteurized and Pasteurized Dairy Products, United States, 1998–2011. Foodborne Pathog. Dis. 2014, 11, 545–551. [Google Scholar] [CrossRef] [PubMed]
  39. Cháves, C.; Arias, M.L. Caracterización de Cepas de Listeria monocytogenes Realizados a Partir de Queso Fresco Proveniente de Diferentes Zonas Productoras Costarricenses. Arch. Latinoam. Nutr. 2009, 59, 66–70. Available online: http://ve.scielo.org/scielo.php?script=sci_arttext&pid=S0004-06222009000100010&lng=es&tlng=es (accessed on 5 May 2021).
  40. Food and Drug Administration (FDA). Contains Nonbinding Recommendations Control of Listeria monocytogenes in Ready-To-Eat Foods: Guidance for Industry Draft Guidance. Available online: https://www.fda.gov/files/food/published/Draft-Guidance-for-Industry--Control-of-Listeria-monocytogenes-in-Ready-To-Eat-Foods-%28PDF%29.pdf (accessed on 5 May 2021).
  41. Calvo-Arrieta, K.; Matamoros-Montoya, K.; Arias-Echandi, M.; Huete-Soto, A.; Redondo-Solano, M. Presence of Listeria monocytogenes in Ready-to-Eat (RTE) meat products sold at retail stores in Costa Rica and analysis of contributing factors. J. Food Prot. 2021. [Google Scholar] [CrossRef]
  42. Campagnollo, F.B.; Gonzales-Barron, U.; Cadavez, V.A.; Sant’Ana, A.S. Quantitative risk assessment of Listeria monocytogenes in traditional minas cheeses: The cases of artisanal semi-hard and fresh soft cheeses. Food Control 2018, 92, 370–379. [Google Scholar] [CrossRef] [Green Version]
  43. Pouillot, R.; Klontz, K.C.; Chen, Y.; Burall, L.S.; Macarisin, D.; Doyle, M.; Bally, K.M.; Strain, E.; Datta, A.R.; Hammack, T.S.; et al. Infectious Dose of Listeria monocytogenes in Outbreak Linked to Ice Cream, United States, 2015. Emerg. Infect. Dis. 2016, 22, 2113–2119. [Google Scholar] [CrossRef] [Green Version]
  44. Fox, P.F.; Guinee, T.P.; Cogan, T.M.; McSweeney, P.L.H. Fresh Cheese Products: Principals of Manufacture and Overview of Different Varieties. In Fundamentals of Cheese Science; Springer: Boston, MA, USA, 2017. [Google Scholar]
  45. Lourenço, A.; Kamnetz, M.B.; Gadotti, C.; Diez-Gonzalez, F. Antimicrobial treatments to control Listeria monocytogenes in queso fresco. Food Microbiol. 2017, 64, 47–55. [Google Scholar] [CrossRef]
  46. Vera Pingitore, E.; Todorov, S.D.; Sesma, F.; Gombossy de Melo Franco, B.D. Application of bacteriocinogenic Enterococcus mundtii CRL35 and Enterococcus faecium ST88Ch in the control of Listeria monocytogenes in fresh Minas cheese. Food Microbiol. 2012, 32, 38–47. [Google Scholar] [CrossRef]
  47. Da Silva Malheiros, P.; Sant’Anna, V.; de Souza Barbosa, M.; Brandelli, A.; Gombossy de Melo Franco, B.D. Effect of liposome-encapsulated nisin and bacteriocin-like substance P34 on Listeria monocytogenes growth in Minas frescal cheese. Int. J. Food Microbiol. 2012, 156, 272–277. [Google Scholar] [CrossRef] [PubMed]
  48. Brown, S.R.B.; Forauer, E.C.; D’Amico, D.J. Effect of modified atmosphere packaging on the growth of spoilage microorganisms and Listeria monocytogenes on fresh cheese. J. Dairy Sci. 2018, 101, 7768–7779. [Google Scholar] [CrossRef] [PubMed]
  49. Abdalla, O.M.; Christen, G.L.; Davidson, P.M. Chemical Composition of and Listeria monocytogenes Survival in White Pickled Cheese. J. Food Prot. 1993, 56, 841–846. [Google Scholar] [CrossRef]
  50. Leong, W.M.; Geier, R.; Engstrom, S.; Ingham, S.; Ingham, B.; Smukowski, M. Growth of Listeria monocytogenes, Salmonella spp., Escherichia coli O157:H7, and Staphylococcus aureus on cheese during extended storage at 25 °C. J. Food Prot. 2014, 77, 1275–1288. [Google Scholar] [CrossRef] [PubMed]
  51. Millet, L.; Saubusse, M.; Didienne, R.; Tessier, L.; Montel, M.C. Control of Listeria monocytogenes in raw-milk cheeses. Int. J. Food Microbiol. 2006, 108, 105–114. [Google Scholar] [CrossRef] [PubMed]
  52. Shrestha, S.; Grieder, J.A.; McMahon, D.J.; Nummer, B.A. Survival of Listeria monocytogenes introduced as a post-aging contaminant during storage of low-salt Cheddar cheese at 4, 10, and 21 °C. J. Dairy Sci. 2011, 94, 4329–4335. [Google Scholar] [CrossRef] [PubMed]
  53. Gérard, A.; El-Hajjaji, S.; Van Coillie, E.; Bentaïb, A.; Daube, G.; Sindic, M. Determination of the growth potential of Listeria monocytogenes in various types of Belgian artisanal cheeses by challenge tests. Food Microbiol. 2020, 92, 103582. [Google Scholar] [CrossRef]
  54. Spanu, C.; Scarano, C.; Spanu, V.; Penna, C.; Virdis, S.; De Santis, E.P.L. Listeria monocytogenes growth potential in Ricotta salata cheese. Int. Dairy J. 2012, 24, 120–122. [Google Scholar] [CrossRef]
  55. Heir, E.; Møretrø, T.; Simensen, A.; Langsrud, S. Listeria monocytogenes strains show large variations in competitive growth in mixed culture biofilms and suspensions with bacteria from food processing environments. Int. J. Food Microbiol. 2018, 275, 46–55. [Google Scholar] [CrossRef]
  56. Sant’Ana, A.S.; Barbosa, M.S.; Destro, M.T.; Landgraf, M.; Franco, B.D.G.M. Growth potential of Salmonella spp. and Listeria monocytogenes in nine types of ready-to-eat vegetables stored at variable temperature conditions during shelf-life. Int. J. Food Microbiol. 2012, 157, 52–58. [Google Scholar] [CrossRef] [PubMed]
  57. Ross, T.; Dalgaard, P.; Tienungoon, S. Predictive modeling of the growth and survival of Listeria in fishery products. Int. J. Food Microbiol. 2000, 62, 231–245. [Google Scholar] [CrossRef]
  58. Tiwari, U.; Walsh, D.; Rivas, L.; Jordan, K.; Duffy, G. Modelling the interaction of storage temperature, pH, and water activity on the growth behaviour of Listeria monocytogenes in raw and pasteurised semi-soft rind washed milk cheese during storage following ripening. Food Control 2014, 42, 248–256. [Google Scholar] [CrossRef]
  59. Piccinin, D.M.; Shelef, L.A. Survival of Listeria monocytogenes in Cottage Cheese. J. Food Prot. 1995, 58, 128–131. [Google Scholar] [CrossRef] [PubMed]
Figure 1. Growth curves of L. monocytogenes inoculated in fresh cheese with different %NaCl (0.5, 0.8, 1.3, 2.0, 3.3, 5.2) and stored at 4°C. The markers correspond to the observed data and the lines to the prediction curves Foods 10 01722 i001.
Foods 10 01722 g001
Figure 2. Graphical representation of the secondary model of maximum growth rate (log CFU/d) in function of the salt concentration (%) of Listeria monocytogenes in cheese.
Foods 10 01722 g002
Figure 3. Graphical validation of the µmax observed (obs) vs estimated (est) by the secondary predictive model. (circle) Cheese studies; (triangle) Modelling Programs.
Foods 10 01722 g003
Table 1. L. monocytogenes isolates obtained from fresh “Turrialba cheese” samples.
ProvinceLocation *No. of SamplesNo. of Samples Positive for L. monocytogenes
San José152
270
390
420
550
Cartago620
794
Heredia850
983
Alajuela10120
Total-----649
*. Shops locations: 1. Central market, 2. San José, 3. Desamparados, 4. Goicoechea, 5. Montes de Oca, 6. Cartago, 7. Cartago market, 8. Heredia, 9. Heredia market, 10. Alajuela market.
Table 2. Characterization of fresh “Turrialba cheese” formulated with different NaCl levels during storage.
3 Days5 Days7 Days
%NaClpHSDawpHSDawpHSDaw
0.56.670.030.9936.490.020.9946.480.040.993
0.86.700.010.9936.500.020.9926.530.010.992
1.36.660.030.9866.460.010.9826.510.030.987
2.06.660.030.9696.520.010.9806.570.020.977
3.36.660.020.9556.480.020.9686.580.010.966
5.26.650.030.9376.570.060.9546.520.020.950
Table 3. Values of maximum growth rate (μmax, log CFU/d), maximum population density (ymax, log CFU/g), initial concentration (y0, log CFU/g), estimated growth potential (δest, log CFU/g), observed growth potential (δobs, log CFU/g), obtained from the primary models of L. monocytogenes growth in fresh “Turrialba cheese”.
%NaClμmaxymax obsδobsy0 estymaxestδestRMSE
0.51.2628.8516.931.938.216.280.9640.443
0.81.1789.0007.081.948.746.800.9920.254
1.30.8958.8056.882.048.786.740.9930.197
2.00.8749.2307.312.008.746.740.9780.368
3.30.6519.3707.451.999.247.250.9890.293
5.20.5147.7855.862.007.695.690.9860.257
Table 4. Bias (Bf); Accuracy (Af) factors and RMSE calculated for µmax values (log CFU/d) estimated by polynomial model of L. monocytogenes in fresh cheese.
ReferencesMatrix (Broth/Type Cheese)FactorsBfAfNo.
[27]PaneerT(°C) = 4; pH = 5.42–5.57; aw = 0.999; NaCl (%) = 0.191.821.822
[28]“Queso Blanco” slicesT(°C) = 5; pH = 6.8; aw = 0.971; NaCl (%) = 4.961.441.4415
[29]“Queso fresco”T(°C) = 4; pH = 6.40; aw = 0.96; NaCl (%) = 31.381.381
[30]“Queso fresco”T(°C) = 4; pH = 6.75; aw = 0.983; NaCl (%) = 1.671.571.572
[31]CottageT(°C) = 5; pH = 5.18; Salt% = 1.22; 718 ppm Lactic acid1.721.721
[32]Mozzarella with citric acid;T(°C) = 4; pH = 5.49–6.43; aw = 0.988; NaCl (%) = 2.180.801.252
[33]GorgonzolaT(°C) = 8; pH = 6.80; aw = 0.978; NaCl (%) = 3.851.071.386
Total RMSE = 0.0191Bf = 1.35Af = 1.43n = 29
Modelling ProgramMatrix (Broth/Type Cheese)FactorsBfAfNo.
[18]Broth mediaT(°C) = 4; pH = 6.5–6.7; aw = 0.969–0.997; NaCl (%) = 0.5–5.20.671.904
[22]Cottage cheeseT(°C) = 5; pH = 5.5; aw = 0.989; NaCl (%) = 21.151.154
[23]Broth mediaT(°C) = 4; pH = 6.6; aw = 0.997–0.969; NaCl (%) = 0.5–5.11.241.244
Total RMSE = 0.058Bf = 0.98Af = 2.73n = 12
Publisher’s Note: MDPI stays neutral with regard to jurisdictional claims in published maps and institutional affiliations.

