
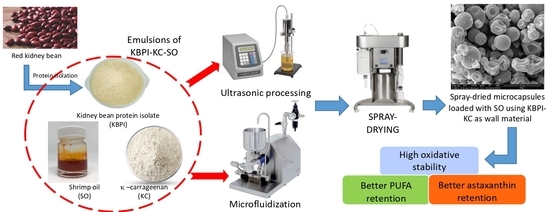
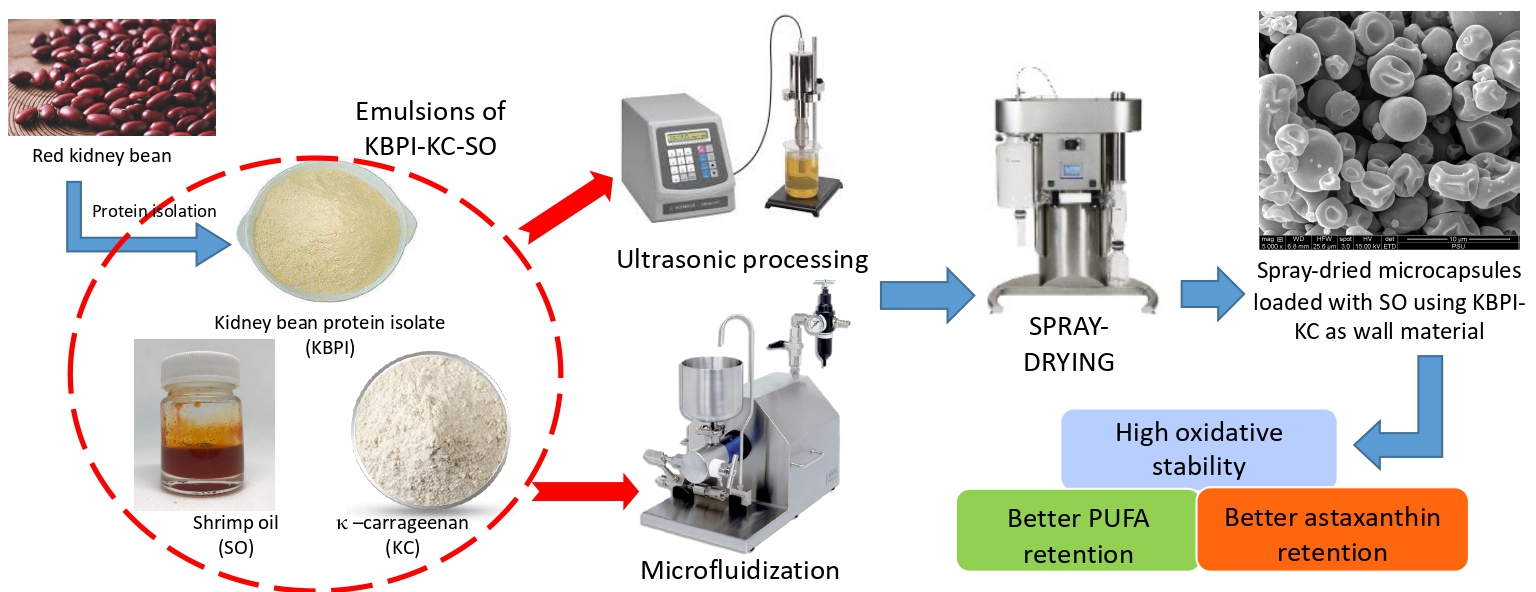
Microcapsules of Shrimp Oil Using Kidney Bean Protein Isolate and κ-Carrageenan as Wall Materials with the Aid of Ultrasonication or High-Pressure Microfluidization: Characteristics and Oxidative Stability

 ,
, 
Abstract
:
1. Introduction
2. Materials and Methods
2.1. Materials
2.2. Preparation of Kidney Bean Protein Isolate
2.3. Preparation of KBPI-KC-SO Emulsions
2.4. Ultrasonication and High-Pressure Microfluidization of Emulsions
2.5. Spray-Drying Microencapsulation of Ultrasonicated and Microfluidized KBPI-KC-SO Emulsions
2.6. Characterization of Microcapsules
2.6.1. Particle Size, Poly-Dispersity Index (PDI) and Zeta Potential
2.6.2. Encapsulation Efficiency (EE)
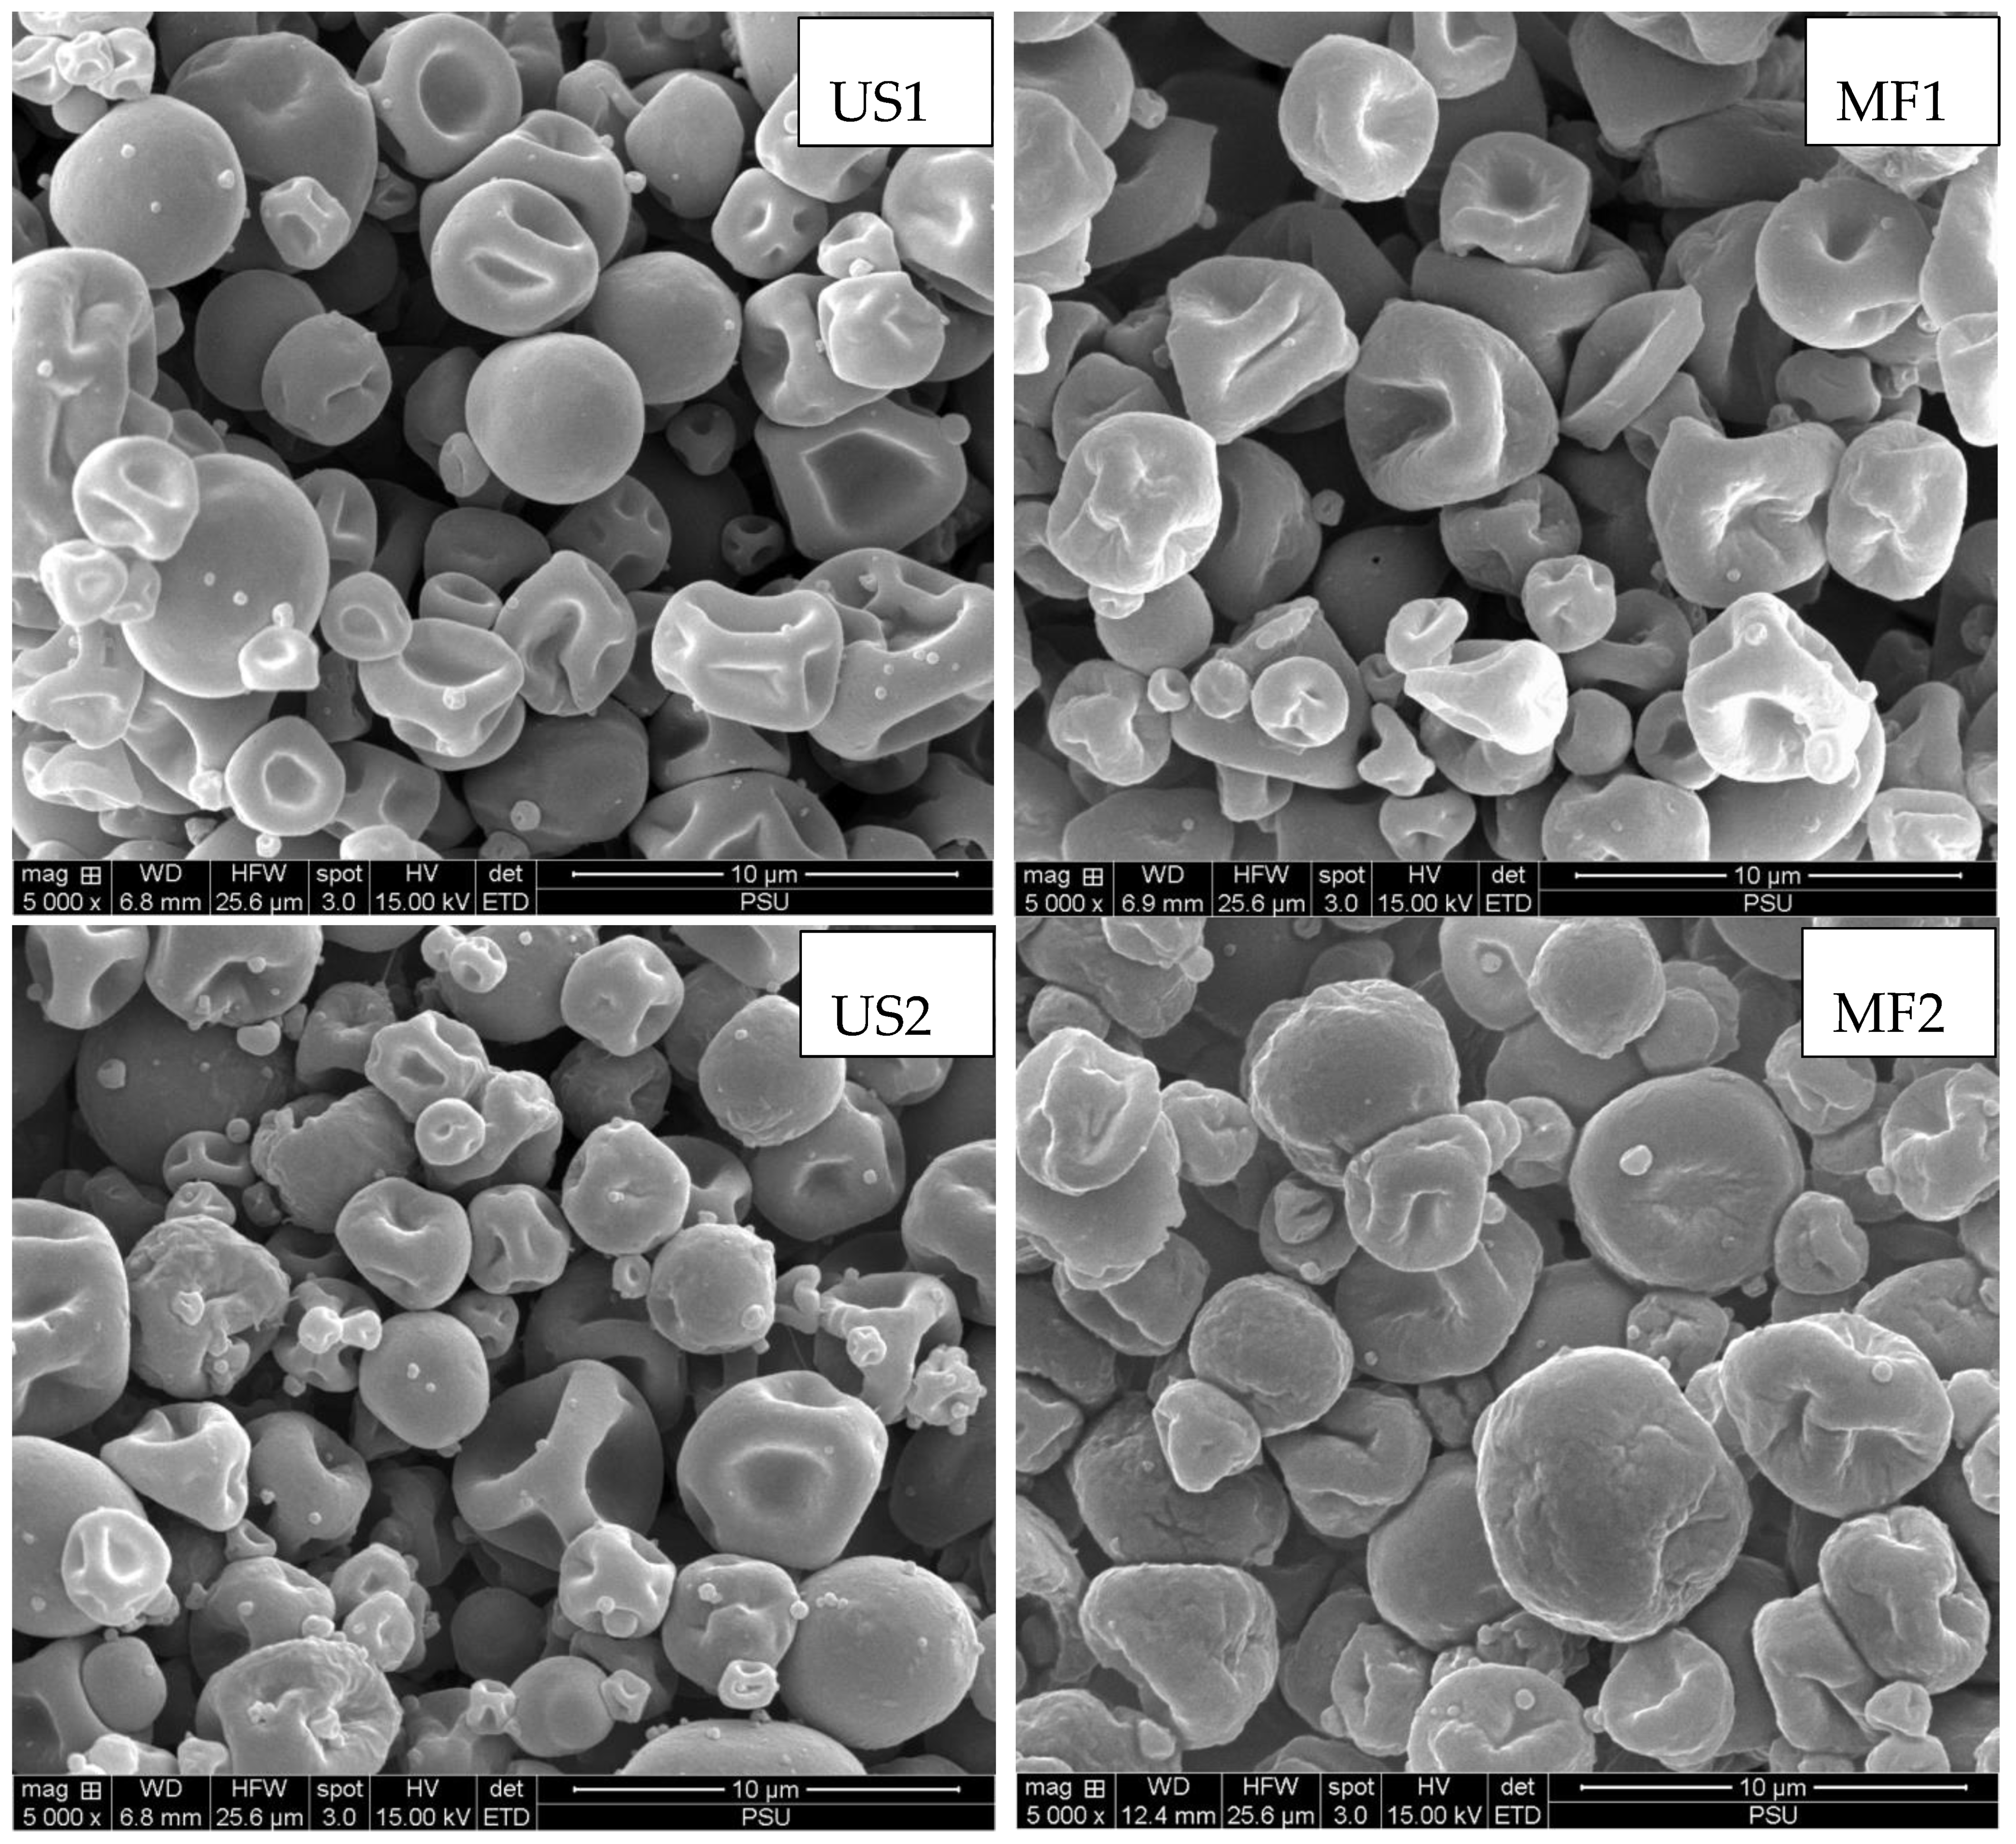
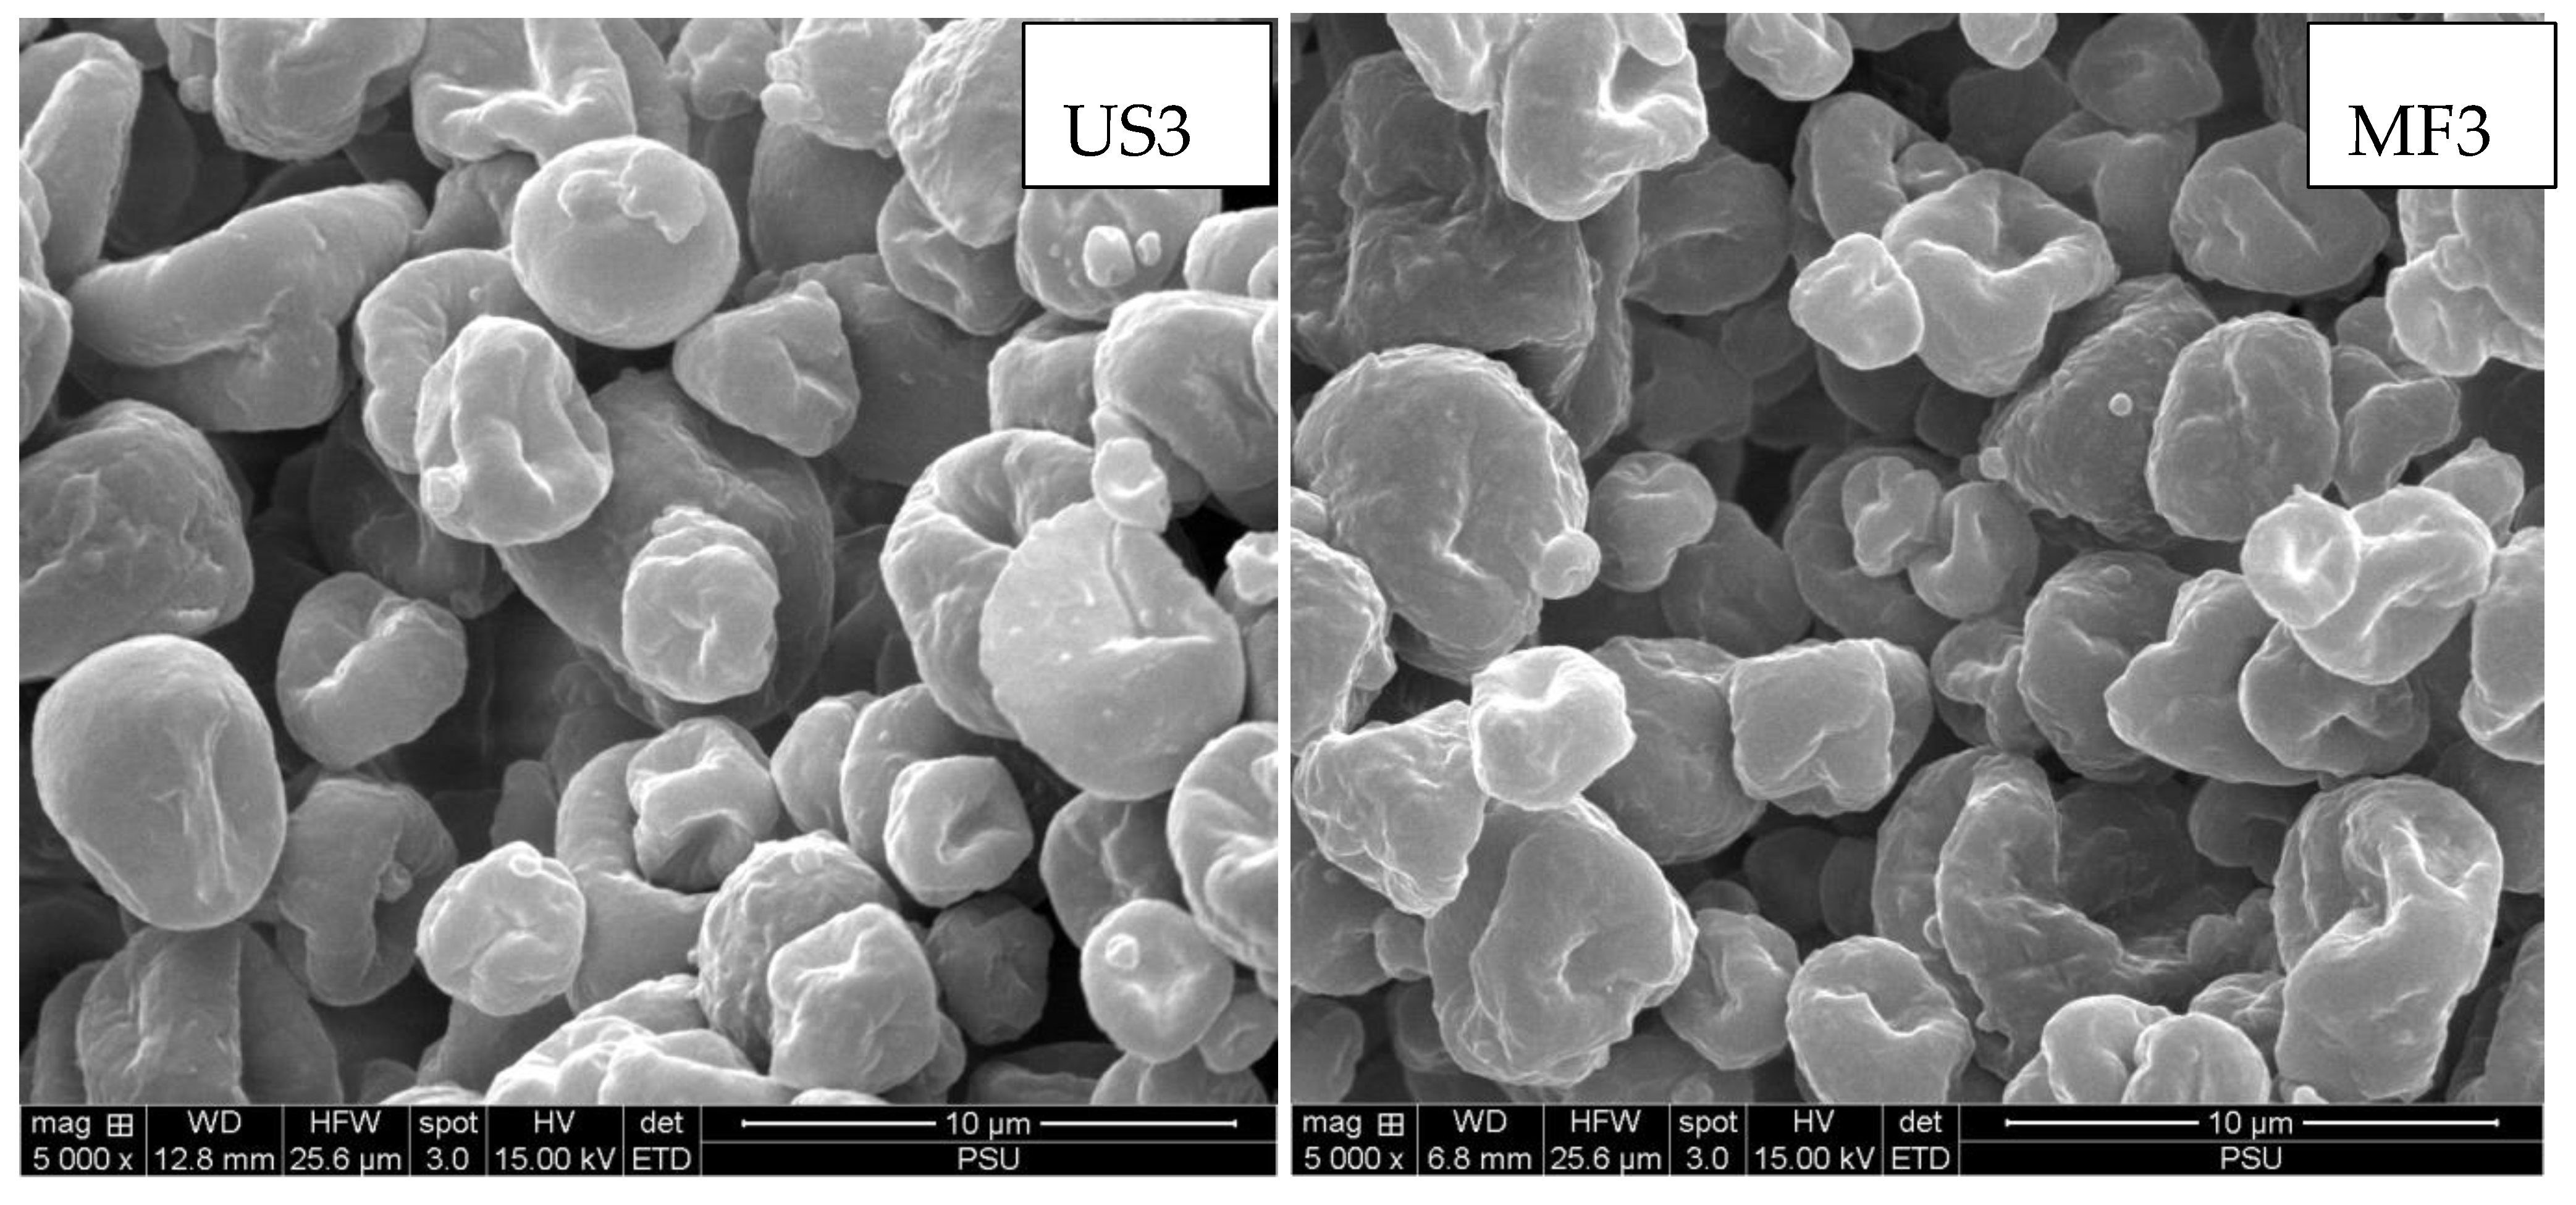
2.6.3. Scanning Electron Microscopic (SEM) Images
2.6.4. Flowability
2.6.5. Fourier Transform Infrared (FTIR) Spectra
2.7. Oxidative Stability of SO Encapsulated in KBPI-KC Microcapsules
2.7.1. Lipid Oxidation
2.7.2. Fatty Acid Profile
2.7.3. Astaxanthin
2.8. Statistical Analysis
3. Results and Discussion
3.1. Particle Size, Poly-Dispersity Index (PDI) and Zeta Potential
3.2. Encapsulation Efficiency (EE)
3.3. Flowability
3.4. Microstructure
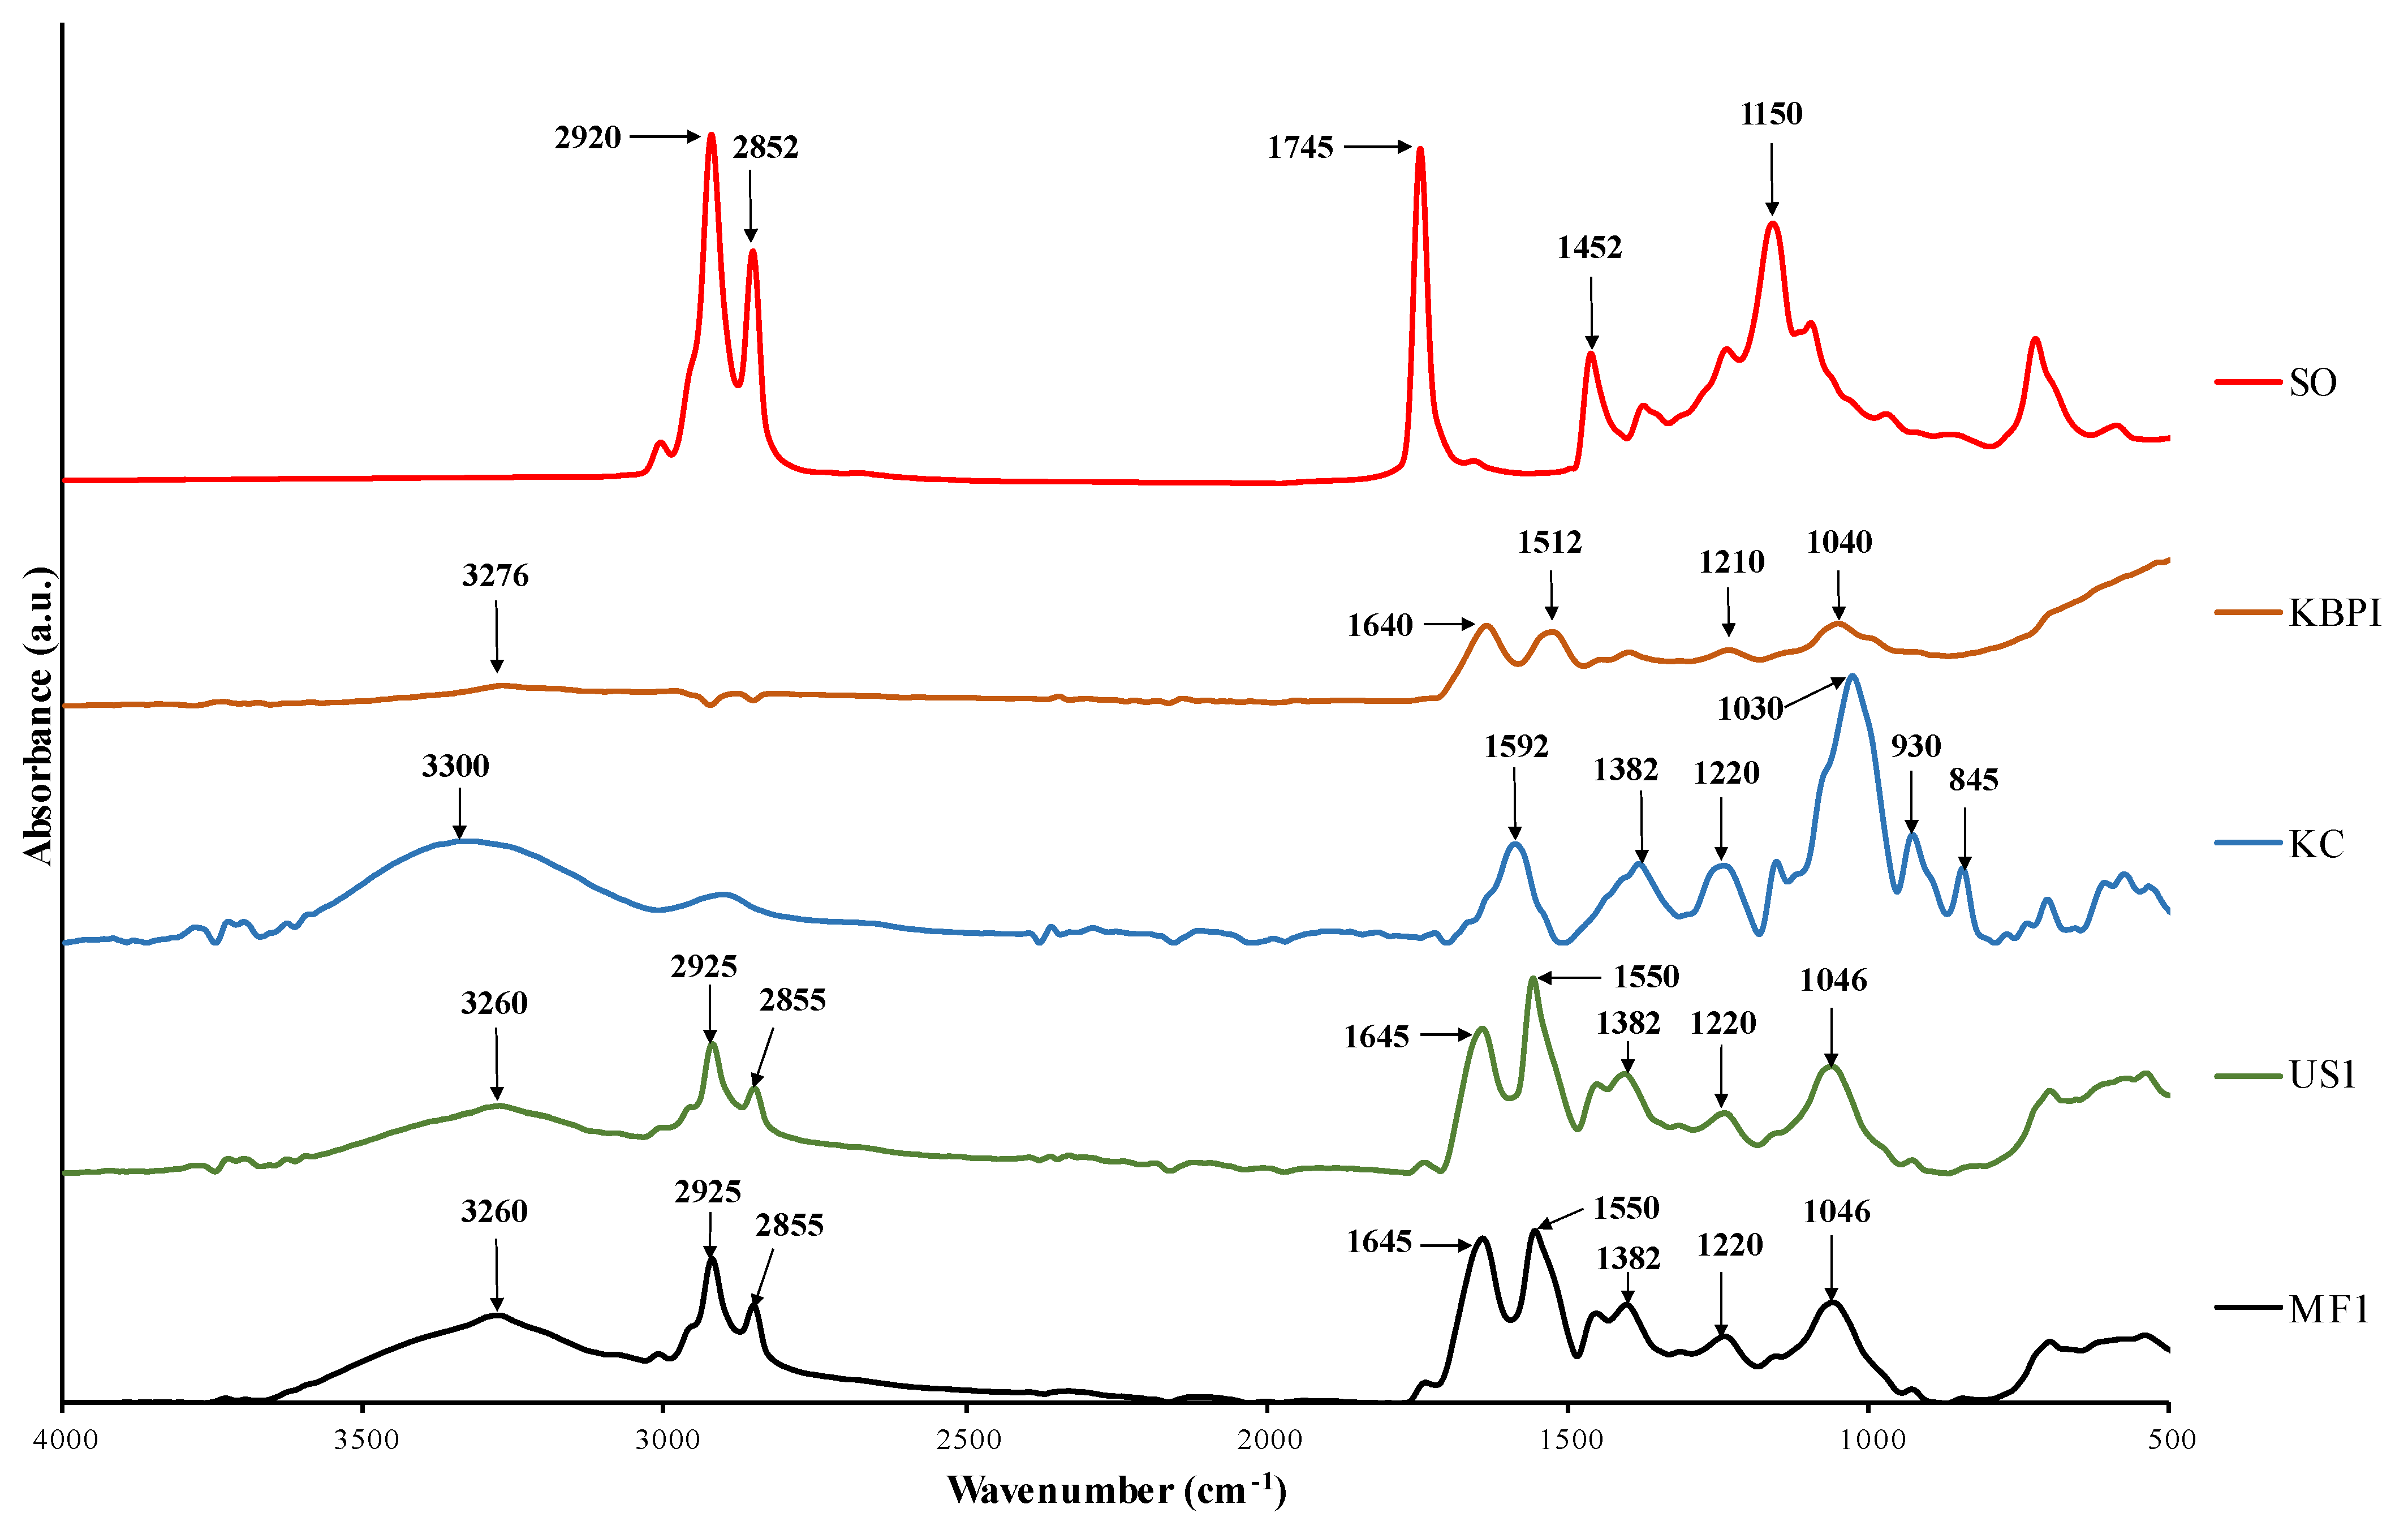
3.5. FTIR Spectra
3.6. Oxidative Stability of SO
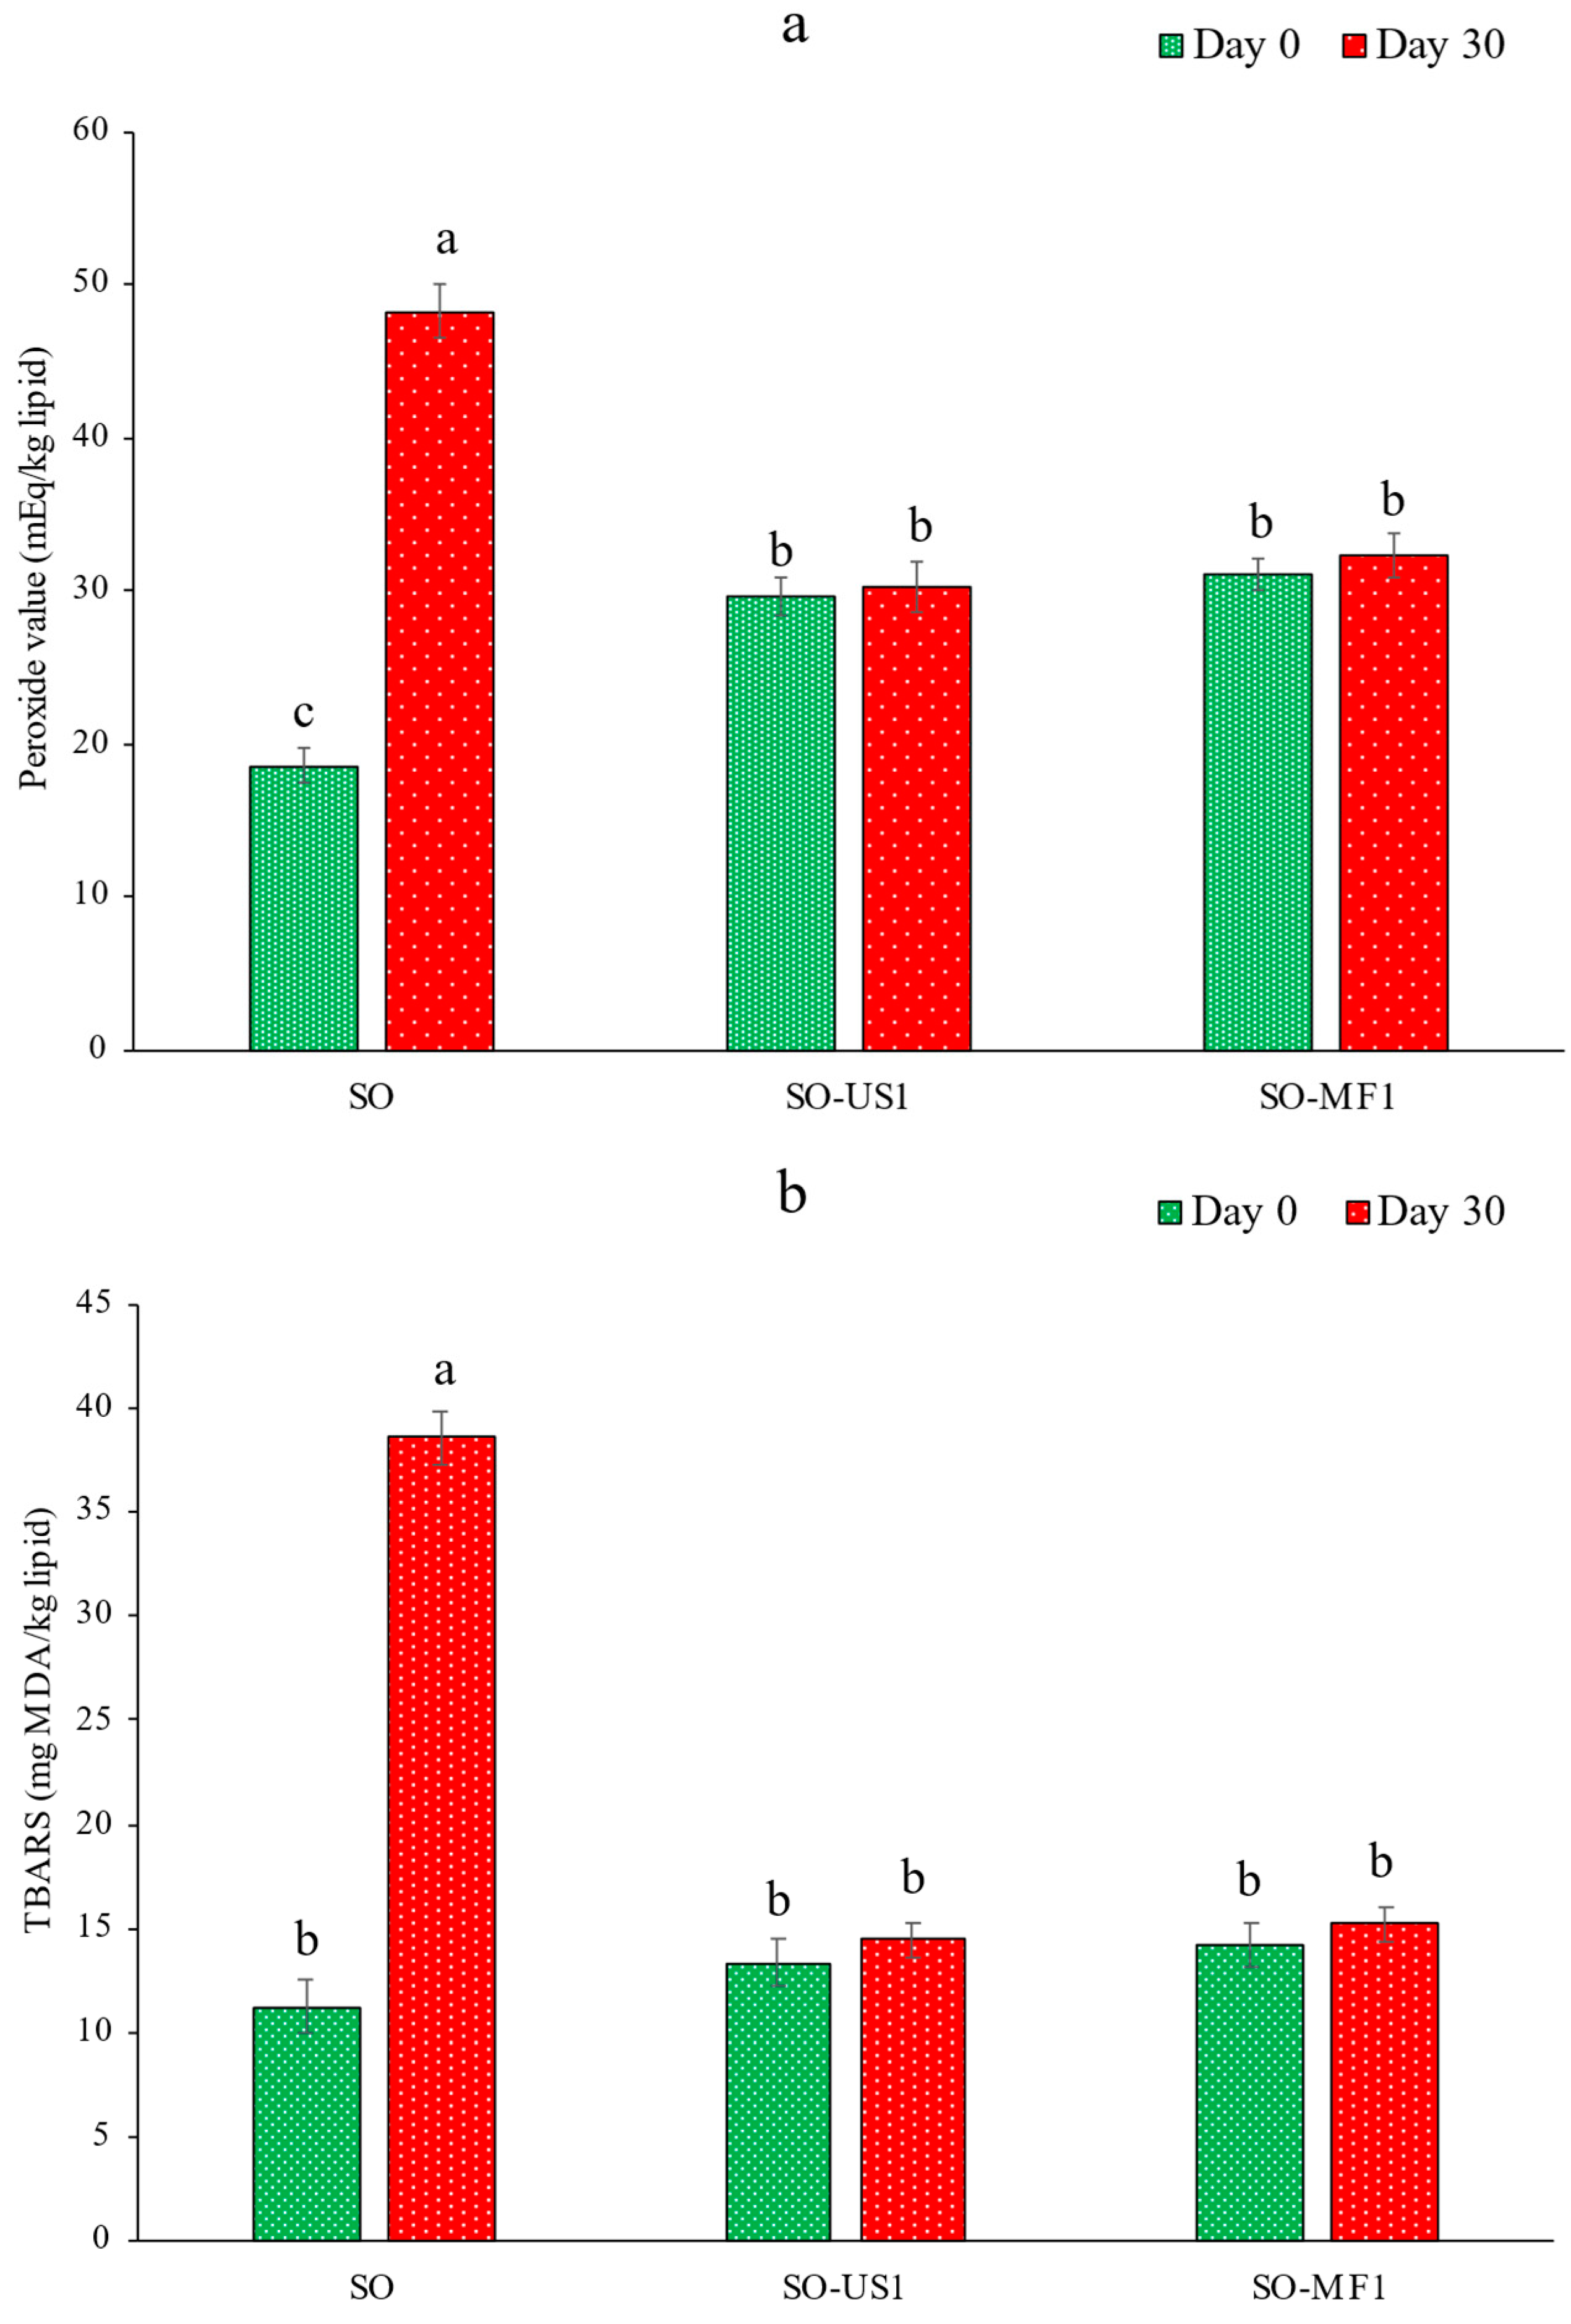
3.6.1. Lipid Oxidation
3.6.2. Fatty Acid Profile
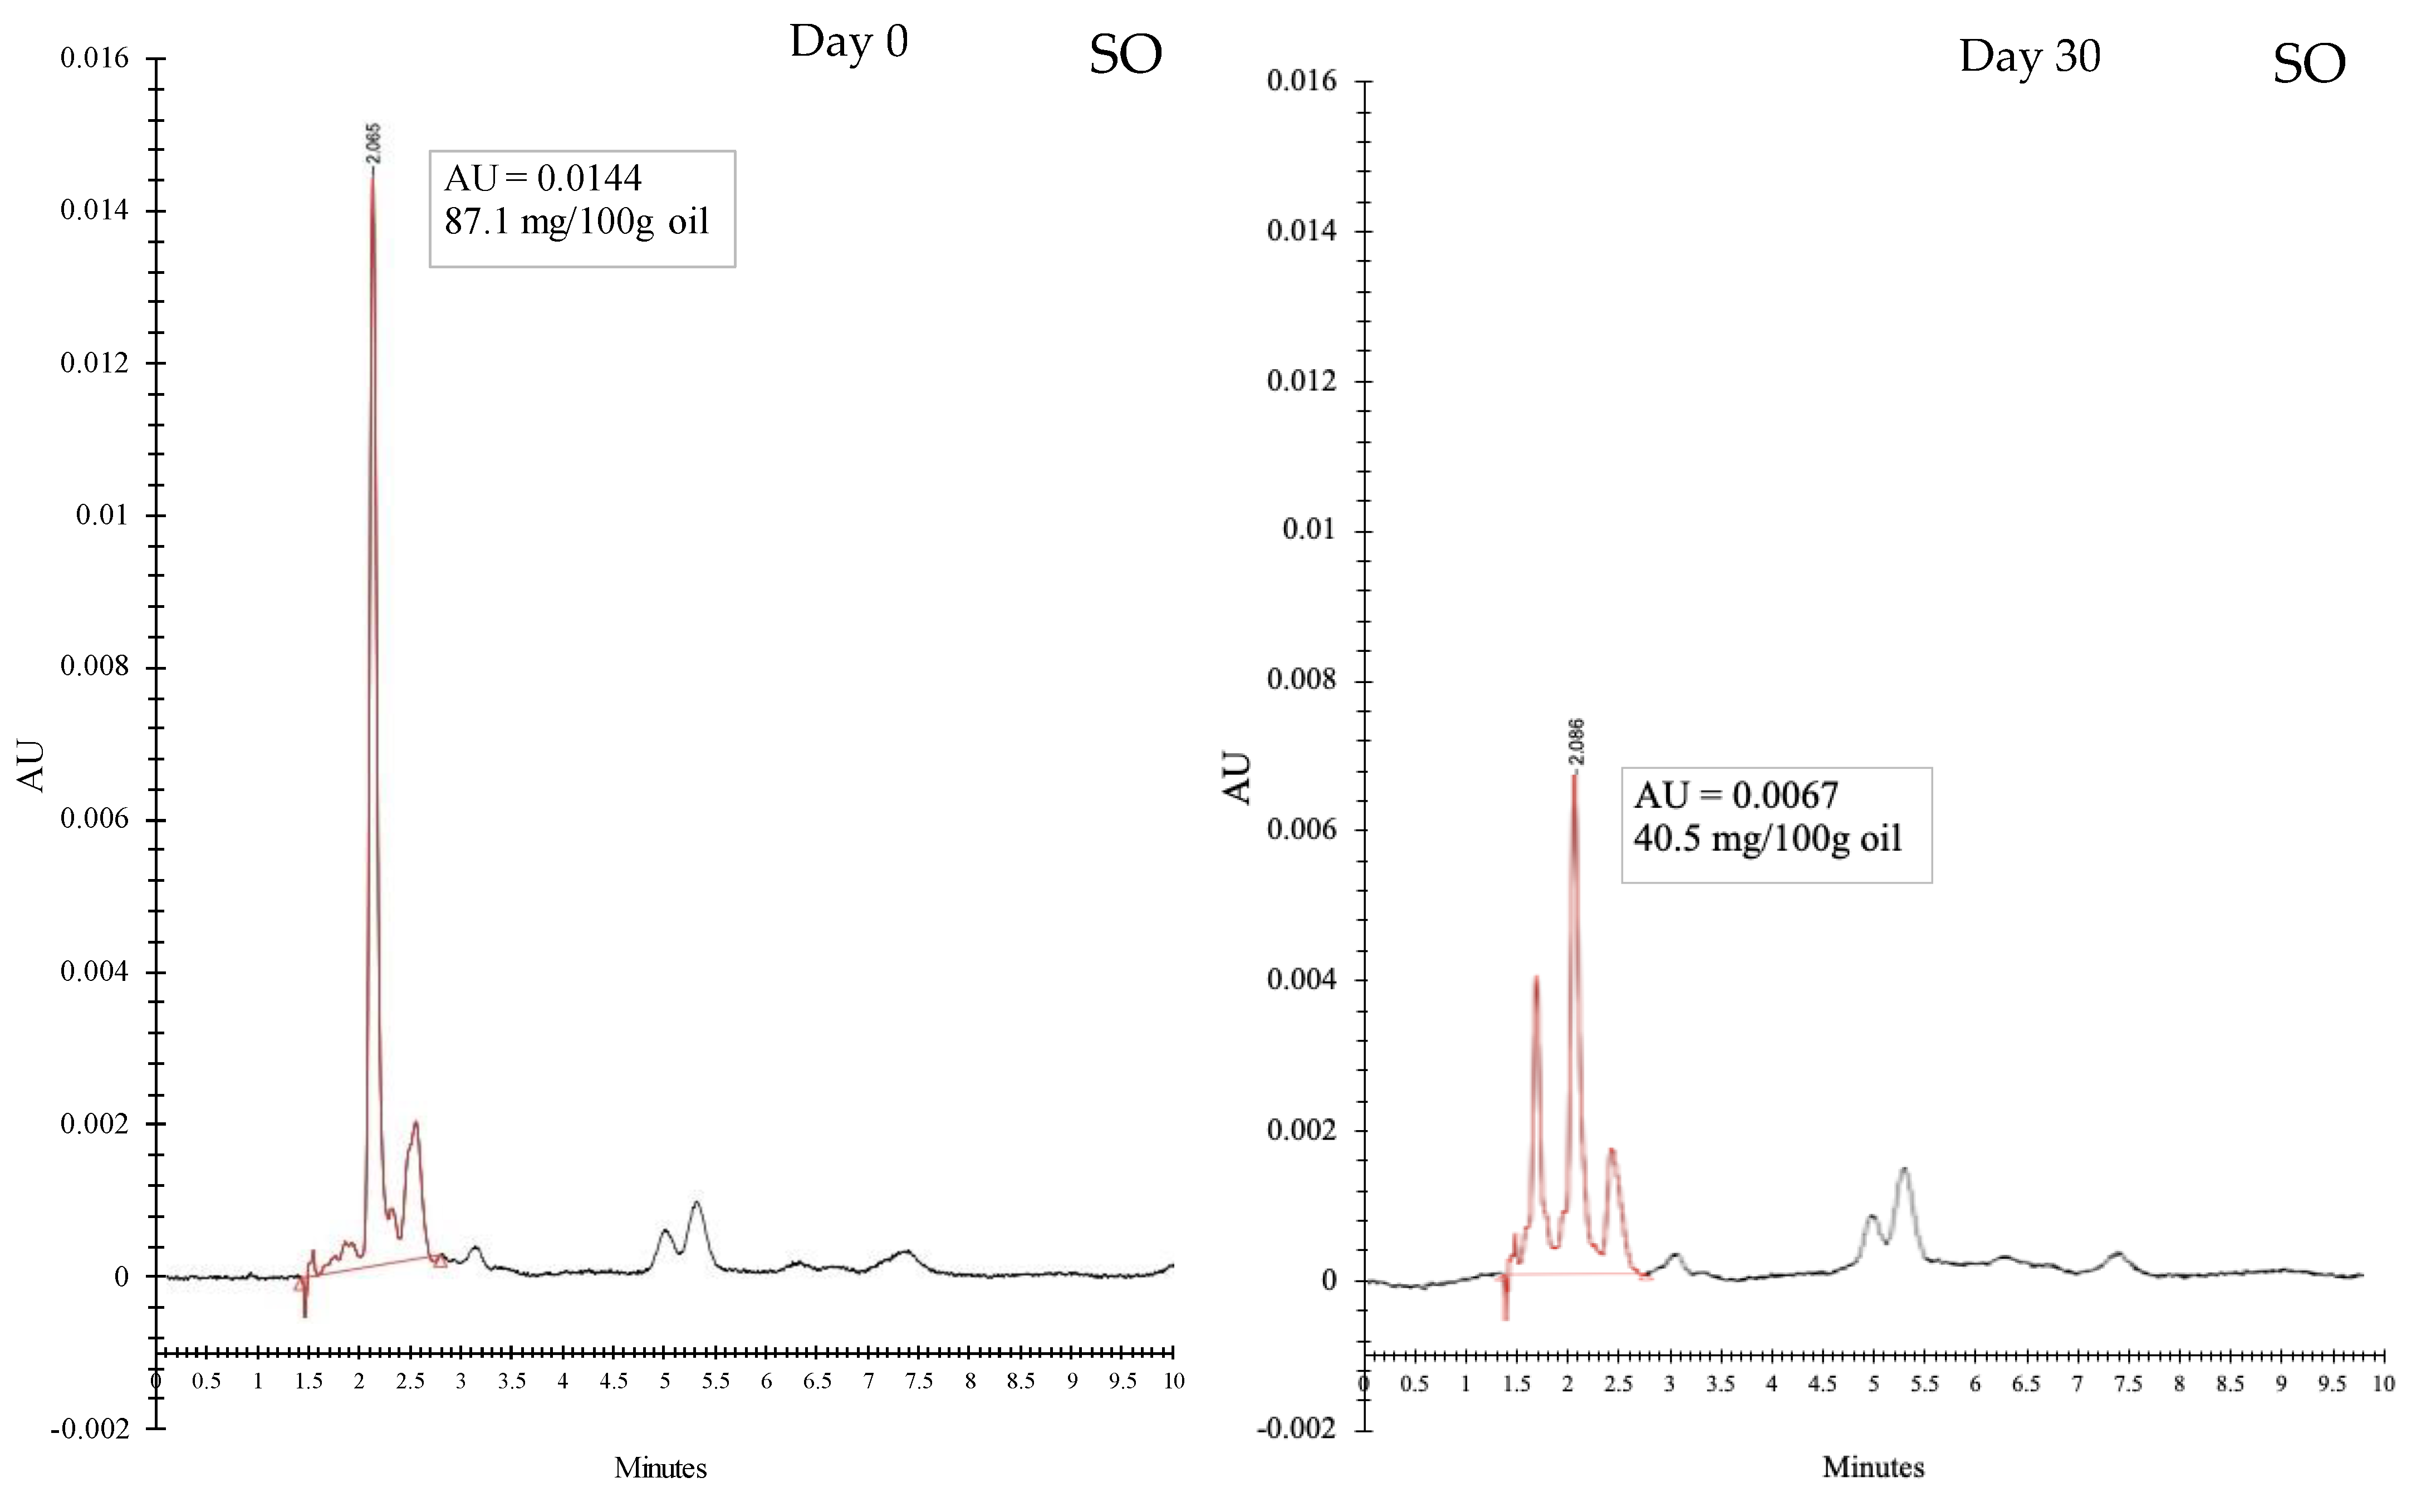
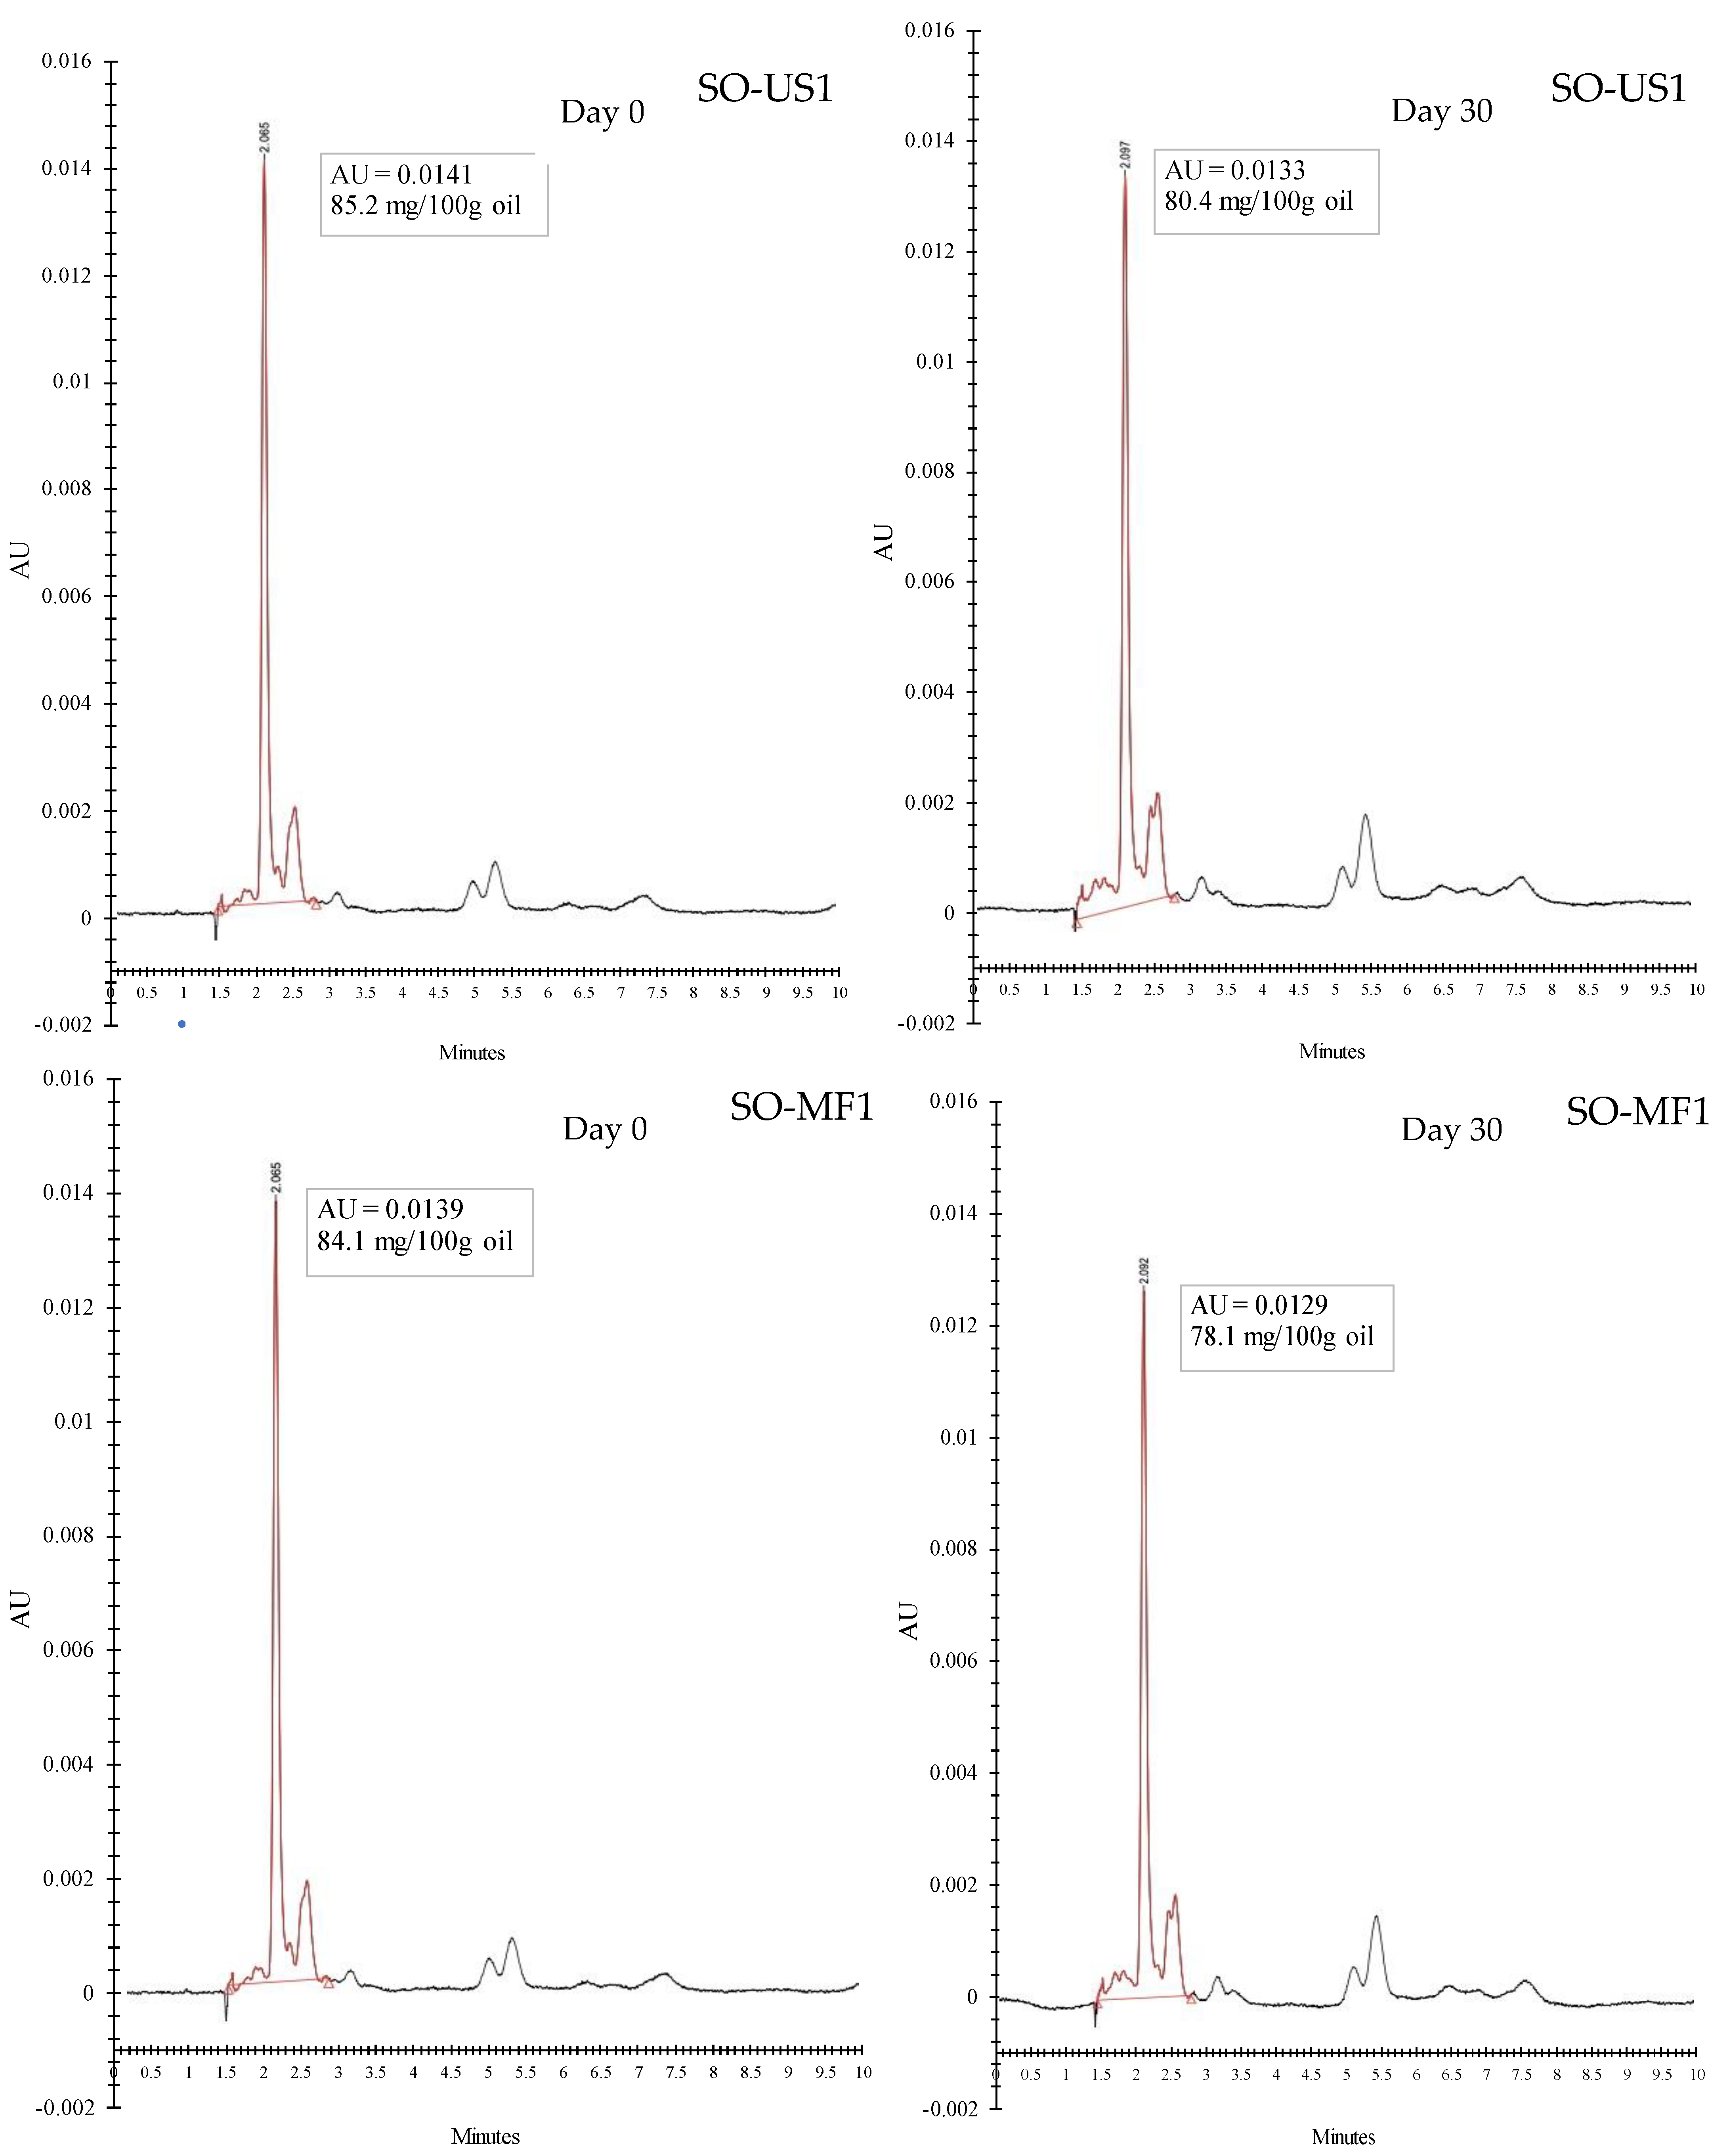
3.6.3. Astaxanthin
4. Conclusions
Author Contributions
Funding
Informed Consent Statement
Data Availability Statement
Conflicts of Interest
References
- Gulzar, S.; Raju, N.; Chandragiri Nagarajarao, R.; Benjakul, S. Oil and pigments from shrimp processing by-products: Extraction, composition, bioactivities and its application—A review. Trends Food Sci. Technol. 2020, 100, 307–319. [Google Scholar] [CrossRef]
- Shahidi, F.; Ambigaipalan, P. Omega-3 polyunsaturated fatty acids and their health benefits. Annu. Rev. Food Sci. Technol. 2018, 9, 345–381. [Google Scholar] [CrossRef] [PubMed]
- Miki, W. Biological functions and activities of animal carotenoids. Pure Appl. Chem. 1991, 63, 141–146. [Google Scholar] [CrossRef]
- Takeungwongtrakul, S.; Benjakul, S.; H-kittikun, A. Micro-encapsulation of Pacific white shrimp oil as affected by emulsification condition. Food Sci. Hum. Wellness 2014, 3, 175–182. [Google Scholar] [CrossRef] [Green Version]
- Kolanowski, W.; Ziolkowski, M.; Weißbrodt, J.; Kunz, B.; Laufenberg, G. Microencapsulation of fish oil by spray drying--impact on oxidative stability. Part 1. Eur. Food Res. Technol. 2006, 222, 336–342. [Google Scholar] [CrossRef]
- Gulzar, S.; Benjakul, S. Characteristics and storage stability of nanoliposomes loaded with shrimp oil as affected by ultrasonication and microfluidization. Food Chem. 2020, 310, 125916. [Google Scholar] [CrossRef]
- Habibi, A.; Keramat, J.; Hojjatoleslamy, M.; Tamjidi, F. Preparation of fish oil microcapsules by complex coacervation of gelatin–gum arabic and their utilization for fortification of pomegranate juice. J. Food Process Eng. 2017, 40, e12385. [Google Scholar] [CrossRef]
- Walker, R.M.; Decker, E.A.; McClements, D.J. Physical and oxidative stability of fish oil nanoemulsions produced by spontaneous emulsification: Effect of surfactant concentration and particle size. J. Food Eng. 2015, 164, 10–20. [Google Scholar] [CrossRef]
- Sosnik, A.; Seremeta, K.P. Advantages and challenges of the spray-drying technology for the production of pure drug particles and drug-loaded polymeric carriers. Adv. Colloid Interface Sci. 2015, 223, 40–54. [Google Scholar] [CrossRef]
- Soottitantawat, A.; Bigeard, F.; Yoshii, H.; Furuta, T.; Ohkawara, M.; Linko, P. Influence of emulsion and powder size on the stability of encapsulated D-limonene by spray drying. Innov. Food Sci. Emerg. Technol. 2005, 6, 107–114. [Google Scholar] [CrossRef]
- del Sanchez, M.R.H.; Cuvelier, M.-E.; Turchiuli, C. Effect of α-tocopherol on oxidative stability of oil during spray drying and storage of dried emulsions. Food Res. Int. 2016, 88, 32–41. [Google Scholar] [CrossRef] [PubMed]
- Silva, E.K.; Gomes, M.T.M.S.; Hubinger, M.D.; Cunha, R.L.; Meireles, M.A.A. Ultrasound-assisted formation of annatto seed oil emulsions stabilized by biopolymers. Food Hydrocoll. 2015, 47, 1–13. [Google Scholar] [CrossRef]
- Silva, E.K.; Azevedo, V.M.; Cunha, R.L.; Hubinger, M.D.; Meireles, M.A.A. Ultrasound-assisted encapsulation of annatto seed oil: Whey protein isolate versus modified starch. Food Hydrocoll. 2016, 56, 71–83. [Google Scholar] [CrossRef]
- Kaderides, K.; Goula, A.M.; Adamopoulos, K.G. A process for turning pomegranate peels into a valuable food ingredient using ultrasound-assisted extraction and encapsulation. Innov. Food Sci. Emerg. Technol. 2015, 31, 204–215. [Google Scholar] [CrossRef]
- Jafari, S.M.; Assadpoor, E.; He, Y.; Bhandari, B. Re-coalescence of emulsion droplets during high-energy emulsification. Food Hydrocoll. 2008, 22, 1191–1202. [Google Scholar] [CrossRef]
- Leong, T.S.H.; Zhou, M.; Kukan, N.; Ashokkumar, M.; Martin, G.J.O. Preparation of water-in-oil-in-water emulsions by low frequency ultrasound using skim milk and sunflower oil. Food Hydrocoll. 2017, 63, 685–695. [Google Scholar] [CrossRef]
- Tang, S.Y.; Shridharan, P.; Sivakumar, M. Impact of process parameters in the generation of novel aspirin nanoemulsions—Comparative studies between ultrasound cavitation and microfluidizer. Ultrason. Sonochem. 2013, 20, 485–497. [Google Scholar] [CrossRef]
- Pinnamaneni, S.; Das, N.G.; Das, S.K. Comparison of oil-in-water emulsions manufactured by microfluidization and homogenization. Die Pharm. Int. J. Pharm. Sci. 2003, 58, 554–558. [Google Scholar]
- Verma, K.; Tarafdar, A.; Mishra, V.; Dilbaghi, N.; Kondepudi, K.K.; Badgujar, P.C. Nanoencapsulated curcumin emulsion utilizing milk cream as a potential vehicle by microfluidization: Bioaccessibility, cytotoxicity and physico-functional properties. Food Res. Int. 2021, 148, 110611. [Google Scholar] [CrossRef]
- Mongenot, N.; Charrier, S.; Chalier, P. Effect of ultrasound emulsification on cheese aroma encapsulation by carbohydrates. J. Agric. Food Chem. 2000, 48, 861–867. [Google Scholar] [CrossRef]
- Jafari, S.M.; Assadpoor, E.; Bhandari, B.; He, Y. Nano-particle encapsulation of fish oil by spray drying. Food Res. Int. 2008, 41, 172–183. [Google Scholar] [CrossRef]
- Gharsallaoui, A.; Roudaut, G.; Chambin, O.; Voilley, A.; Saurel, R. Applications of spray-drying in microencapsulation of food ingredients: An overview. Food Res. Int. 2007, 40, 1107–1121. [Google Scholar] [CrossRef]
- Yemenicioğlu, A.; Farris, S.; Turkyilmaz, M.; Gulec, S. A review of current and future food applications of natural hydrocolloids. Int. J. Food Sci. Technol. 2020, 55, 1389–1406. [Google Scholar] [CrossRef]
- Tolstoguzov, V.B. Protein-polysaccharide interactions. In Food Proteins and Their Applications; CRC Press: Boca Raton, FL, USA, 2017; pp. 171–198. ISBN 0203755618. [Google Scholar]
- Jarpa-Parra, M. Lentil protein: A review of functional properties and food application. An overview of lentil protein functionality. Int. J. Food Sci. Technol. 2018, 53, 892–903. [Google Scholar] [CrossRef] [Green Version]
- Sharif, H.R.; Williams, P.A.; Sharif, M.K.; Abbas, S.; Majeed, H.; Masamba, K.G.; Safdar, W.; Zhong, F. Current progress in the utilization of native and modified legume proteins as emulsifiers and encapsulants–A review. Food Hydrocoll. 2018, 76, 2–16. [Google Scholar] [CrossRef]
- Kimura, A.; Fukuda, T.; Zhang, M.; Motoyama, S.; Maruyama, N.; Utsumi, S. Comparison of physicochemical properties of 7S and 11S globulins from pea, fava bean, cowpea, and french bean with those of soybean- french bean 7S globulin exhibits excellent properties. J. Agric. Food Chem. 2008, 56, 10273–10279. [Google Scholar] [CrossRef]
- Gulzar, S.; Benjakul, S. Impact of pretreatment and atmosphere on quality of lipids extracted from cephalothorax of Pacific white shrimp by ultrasonic assisted process. Food Chem. 2020, 309, 125732. [Google Scholar] [CrossRef]
- Fan, T.Y.; Sosulski, F.W. Dispersibility and isolation of proteins from legume flours. Can. Inst. Food Sci. Technol. J. 1974, 7, 256–259. [Google Scholar] [CrossRef]
- Gulzar, S.; Nilsuwan, K.; Raju, N.; Benjakul, S. Whole wheat crackers fortified with mixed shrimp oil and tea seed oil microcapsules prepared from mung bean protein isolate and sodium alginate. Foods 2022, 11, 202. [Google Scholar] [CrossRef]
- Pudtikajorn, K.; Benjakul, S. Simple wet rendering method for extraction of prime quality oil from skipjack tuna eyeballs. Eur. J. Lipid Sci. Technol. 2020, 122, 2000077. [Google Scholar] [CrossRef]
- Gulzar, S.; Benjakul, S. Ultrasound waves increase the yield and carotenoid content of lipid extracted from cephalothorax of pacific white shrimp (Litopenaeus vannamei). Eur. J. Lipid Sci. Technol. 2018, 120, 1700495. [Google Scholar] [CrossRef]
- Gulzar, S.; Benjakul, S. Impact of pulsed electric field pretreatment on yield and quality of lipid extracted from cephalothorax of Pacific white shrimp (Litopenaeus vannamei) by ultrasound-assisted process. Int. J. Food Sci. Technol. 2020, 55, 619–630. [Google Scholar] [CrossRef] [Green Version]
- Perrier-Cornet, J.M.; Marie, P.; Gervais, P. Comparison of emulsification efficiency of protein-stabilized oil-in-water emulsions using jet, high pressure and colloid mill homogenization. J. Food Eng. 2005, 66, 211–217. [Google Scholar] [CrossRef]
- Jafari, S.M.; He, Y.; Bhandari, B. Production of sub-micron emulsions by ultrasound and microfluidization techniques. J. Food Eng. 2007, 82, 478–488. [Google Scholar] [CrossRef]
- Chen, G.; Tao, D. An experimental study of stability of oil–water emulsion. Fuel Process. Technol. 2005, 86, 499–508. [Google Scholar] [CrossRef]
- Elversson, J.; Millqvist-Fureby, A. Particle size and density in spray drying—effects of carbohydrate properties. J. Pharm. Sci. 2005, 94, 2049–2060. [Google Scholar] [CrossRef]
- Mlalila, N.; Swai, H.; Kalombo, L.; Hilonga, A. Effects of spray-drying on w/o/w multiple emulsions prepared from a stearic acid matrix. Nanotechnol. Sci. Appl. 2014, 7, 105. [Google Scholar] [CrossRef] [Green Version]
- Toro-Sierra, J.; Schumann, J.; Kulozik, U. Impact of spray-drying conditions on the particle size of microparticulated whey protein fractions. Dairy Sci. Technol. 2013, 93, 487–503. [Google Scholar] [CrossRef] [Green Version]
- Agustinisari, I.; Mulia, K.; Nasikin, M. The effect of eugenol and chitosan concentration on the encapsulation of eugenol using whey protein–maltodextrin conjugates. Appl. Sci. 2020, 10, 3205. [Google Scholar] [CrossRef]
- Hadidi, M.; Pouramin, S.; Adinepour, F.; Haghani, S.; Jafari, S.M. Chitosan nanoparticles loaded with clove essential oil: Characterization, antioxidant and antibacterial activities. Carbohydr. Polym. 2020, 236, 116075. [Google Scholar] [CrossRef]
- Shirmohammadli, F.; Nikzad, M.; Ghoreyshi, A.A.; Mohammadi, M.; Poureini, F. Preparation and characterization of zein/sodium caseinate/xanthan gum complex for encapsulation of piperine and its in vitro release study. Food Biophys. 2021, 16, 254–269. [Google Scholar] [CrossRef]
- Damodaran, S. Protein stabilization of emulsions and foams. J. Food Sci. 2005, 70, R54–R66. [Google Scholar] [CrossRef]
- Wani, I.A.; Sogi, D.S.; Wani, A.A.; Gill, B.S. Physico-chemical and functional properties of flours from Indian kidney bean (Phaseolus vulgaris L.) cultivars. LWT Food Sci. Technol. 2013, 53, 278–284. [Google Scholar] [CrossRef]
- Anwar, S.H.; Kunz, B. The influence of drying methods on the stabilization of fish oil microcapsules: Comparison of spray granulation, spray drying, and freeze drying. J. Food Eng. 2011, 105, 367–378. [Google Scholar] [CrossRef]
- Gulzar, S.; Benjakul, S. Nanoliposome powder containing shrimp oil increases free flowing behavior and storage stability. Eur. J. Lipid Sci. Technol. 2020, 122, 2000049. [Google Scholar] [CrossRef]
- Saker, A.; Cares-Pacheco, M.-G.; Marchal, P.; Falk, V. Powders flowability assessment in granular compaction: What about the consistency of Hausner ratio? Powder Technol. 2019, 354, 52–63. [Google Scholar] [CrossRef]
- Angelopoulou, D.; Meunier, V.; Forny, L.; Niederreiter, G.; Palzer, S.; Salman, A.D. Particle surface design for enhanced reconstitution of fat-based food powders. Powder Technol. 2021, 393, 397–404. [Google Scholar] [CrossRef]
- Fitzpatrick, J.J.; Iqbal, T.; Delaney, C.; Twomey, T.; Keogh, M.K. Effect of powder properties and storage conditions on the flowability of milk powders with different fat contents. J. Food Eng. 2004, 64, 435–444. [Google Scholar] [CrossRef]
- Kagami, Y.; Sugimura, S.; Fujishima, N.; Matsuda, K.; Kometani, T.; Matsumura, Y. Oxidative stability, structure, and physical characteristics of microcapsules formed by spray drying of fish oil with protein and dextrin wall materials. J. Food Sci. 2003, 68, 2248–2255. [Google Scholar] [CrossRef]
- Klinkesorn, U.; Sophanodora, P.; Chinachoti, P.; Decker, E.A.; McClements, D.J. Characterization of spray-dried tuna oil emulsified in two-layered interfacial membranes prepared using electrostatic layer-by-layer deposition. Food Res. Int. 2006, 39, 449–457. [Google Scholar] [CrossRef]
- Nishad, J.; Selvan, C.J.; Mir, S.A.; Bosco, S.J.D. Effect of spray drying on physical properties of sugarcane juice powder (Saccharum officinarum L.). J. Food Sci. Technol. 2017, 54, 687–697. [Google Scholar] [CrossRef] [PubMed] [Green Version]
- Guillen, M.D.; Cabo, N. Infrared spectroscopy in the study of edible oils and fats. J. Sci. Food Agric. 1997, 75, 1–11. [Google Scholar] [CrossRef]
- Ahmed, J.; Al-Ruwaih, N.; Mulla, M.; Rahman, M.H. Effect of high pressure treatment on functional, rheological and structural properties of kidney bean protein isolate. LWT Food Sci. Technol. 2018, 91, 191–197. [Google Scholar] [CrossRef]
- Zeng, H.-Y.; Cai, L.-H.; Cai, X.-L.; Wang, Y.-J.; Li, Y.-Q. Structure characterization of protein fractions from lotus (Nelumbo nucifera) seed. J. Mol. Struct. 2011, 1001, 139–144. [Google Scholar] [CrossRef]
- Şen, M.; Erboz, E.N. Determination of critical gelation conditions of κ-carrageenan by viscosimetric and FT-IR analyses. Food Res. Int. 2010, 43, 1361–1364. [Google Scholar] [CrossRef]
- Rudhziah, S.; Rani, M.S.A.; Ahmad, A.; Mohamed, N.S.; Kaddami, H. Potential of blend of kappa-carrageenan and cellulose derivatives for green polymer electrolyte application. Ind. Crop. Prod. 2015, 72, 133–141. [Google Scholar] [CrossRef]
- da Daniel-Silva, A.L.; Lopes, A.B.; Gil, A.M.; Correia, R.N. Synthesis and characterization of porous κ-carrageenan/calcium phosphate nanocomposite scaffolds. J. Mater. Sci. 2007, 42, 8581–8591. [Google Scholar] [CrossRef]
- Kačuráková, M.; Wilson, R.H. Developments in mid-infrared FT-IR spectroscopy of selected carbohydrates. Carbohydr. Polym. 2001, 44, 291–303. [Google Scholar] [CrossRef]
- Maqsood, S.; Benjakul, S. Comparative studies of four different phenolic compounds on in vitro antioxidative activity and the preventive effect on lipid oxidation of fish oil emulsion and fish mince. Food Chem. 2010, 119, 123–132. [Google Scholar] [CrossRef]
- Chen, Q.; Zhong, F.; Wen, J.; McGillivray, D.; Quek, S.Y. Properties and stability of spray-dried and freeze-dried microcapsules co-encapsulated with fish oil, phytosterol esters, and limonene. Dry. Technol. 2013, 31, 707–716. [Google Scholar] [CrossRef]
- Quispe-Condori, S.; Saldaña, M.D.A.; Temelli, F. Microencapsulation of flax oil with zein using spray and freeze drying. LWT Food Sci. Technol. 2011, 44, 1880–1887. [Google Scholar] [CrossRef]
- Shahidi, F. Indicators for Evaluation of Lipid Oxidation and Off-Flavor Development in Food. In Food Flavors: Formation, Analysis and Packaging Influences; Contis, E.T., Ho, C.-T., Mussinan, C.J., Parliment, T.H., Shahidi, F., Spanier, A.M.B.T.-D., Eds.; Elsevier: Amsterdam, The Netherlands, 1998; Volume 40, pp. 55–68. ISBN 0167-4501. [Google Scholar]
- Gulzar, S.; Raju, N.; Prodpran, T.; Benjakul, S. Chitosan-tripolyphosphate nanoparticles improves oxidative stability of encapsulated shrimp oil throughout the extended storage. Eur. J. Lipid Sci. Technol. 2021, 124, 2100178. [Google Scholar] [CrossRef]
- Sowmya, R.; Sachindra, N.M. Evaluation of antioxidant activity of carotenoid extract from shrimp processing byproducts by in vitro assays and in membrane model system. Food Chem. 2012, 134, 308–314. [Google Scholar] [CrossRef]


| Microcapsule Samples | Wall Materials (w/w/w) | Size (µm) | PDI | Zeta Potential (mV) | EE (%) |
|---|---|---|---|---|---|
| US1 | KBPI:KC:SO (1:0.1:0.1) | 2.58 ± 0.26d | 0.320 ± 0.03b | −58.77 ± 1.86a | 89.25 ± 1.32a |
| US2 | KBPI:KC:SO (1:0.1:0.5) | 4.32 ± 0.44bc | 0.389 ± 0.04a | −48.25 ± 2.06b | 64.72 ± 1.38c |
| US3 | KBPI:KC:SO (1:0.1:1) | 4.24 ± 0.54b | 0.327 ± 0.03a | −43.72 ± 1.43c | 52.61 ± 2.01e |
| MF1 | KBPI:KC:SO (1:0.1:0.1) | 3.21 ± 0.25c | 0.335 ± 0.04a | −49.59 ± 0.83b | 86.42 ± 1.44b |
| MF2 | KBPI:KC:SO (1:0.1:0.5) | 4.91 ± 0.12b | 0.384 ± 0.07a | −46.66 ± 0.70c | 59.33 ± 1.27d |
| MF3 | KBPI:KC:SO (1:0.1:1) | 6.41 ± 0.81a | 0.400 ± 0.05a | −35.95 ± 0.93d | 43.99 ± 1.05f |
| Microcapsule Samples | Hausner Ratio | Flow Behavior |
|---|---|---|
| US1 | 1.14 ± 0.03c | Good flow |
| US2 | 1.18 ± 0.02b | Fair flow |
| US3 | 1.28 ± 0.03a | Passable flow |
| MF1 | 1.13 ± 0.03c | Good flow |
| MF2 | 1.22 ± 0.02b | Fair flow |
| MF3 | 1.29 ± 0.03a | Passable flow |
| Fatty Acids (%) | Day | Day 30 | ||||
|---|---|---|---|---|---|---|
| SO | SO-US1 | SO-MF1 | SO | SO-US1 | SO-MF1 | |
| C14:0 (Myristic) | 1.11 ± 0.06b * | 1.09 ± 0.03b | 1.10 ± 0.02b | 1.32 ± 0.06a | 1.13 ± 0.03b | 1.14 ± 0.07b |
| C15:0 (Pentadecanoic) | 0.23 ± 0.01c | 0.30 ± 0.04b | 0.29 ± 0.02b | 0.49 ± 0.05a | 0.32 ± 0.04b | 0.31 ± 0.04b |
| C16:0 (Palmitic) | 10.98 ± 0.15b | 11.06 ± 0.19b | 11.11 ± 0.13b | 14.36 ± 0.09a | 11.21 ± 0.11b | 11.19 ± 0.15b |
| C16:1 (Palmitoleic) | 0.83 ± 0.02a | 0.91 ± 0.07a | 0.93 ± 0.09a | 0.73 ± 0.05b | 0.82 ± 0.11a | 0.81 ± 0.09a |
| C17:0 (Heptadecanoic) | 0.81 ± 0.03c | 0.84 ± 0.03bc | 0.85 ± 0.04bc | 1.36 ± 0.10a | 0.96 ± 0.04b | 0.98 ± 0.03b |
| C17:1 cis 10 (cis-10-Heptadecanoic) | 0.22 ± 0.02a | 0.23 ± 0.02a | 0.22 ± 0.01a | 0.18 ± 0.01b | 0.21 ± 0.01ab | 0.20 ± 0.02ab |
| C18:0 (Stearic) | 3.02 ± 0.07b | 3.09 ± 0.10b | 3.15 ± 0.13b | 3.63 ± 0.17a | 3.25 ± 0.12b | 3.21 ± 0.09b |
| C18:1 (Oleic) | 4.28 ± 0.13b | 4.26 ± 0.10b | 4.19 ± 0.11b | 3.73 ± 0.16a | 4.23 ± 0.08b | 4.18 ± 0.15b |
| C18:2 (Linoleic) | 5.76 ± 0.21a | 5.69 ± 0.18a | 5.77 ± 0.12a | 4.13 ± 0.11b | 5.56 ± 0.13a | 5.59 ± 0.09a |
| C18:3 (alpha-Linoleic) | 0.67 ± 0.03a | 0.69 ± 0.02a | 0.68 ± 0.03a | 0.39 ± 0.01b | 0.66 ± 0.04a | 0.67 ± 0.04a |
| C20:0 (Arachidic) | 1.09 ± 0.04a | 1.13 ± 0.02a | 1.08 ± 0.03a | 1.03 ± 0.01b | 1.04 ± 0.03ab | 1.05 ± 0.04ab |
| C20:1 (Eicosenoic) | 0.72 ± 0.02a | 0.69 ± 0.01a | 0.70 ± 0.02a | 0.59 ± 0.03b | 0.66 ± 0.01a | 0.67 ± 0.03a |
| C20:2 (Eicosadienoic) | 1.04 ± 0.07a | 1.01 ± 0.04a | 0.99 ± 0.02a | 0.39 ± 0.05b | 0.97 ± 0.05a | 0.95 ± 0.07a |
| C20:5 (EPA) | 5.08 ± 0.15a | 4.89 ± 0.10a | 4.81 ± 0.14a | 1.36 ± 0.11c | 4.61 ± 0.08b | 4.55 ± 0.14b |
| C22:6 n-3 (DHA) | 6.58 ± 0.18a | 6.49 ± 0.11a | 6.43 ± 0.11a | 3.19 ± 0.20c | 6.14 ± 0.09b | 5.99 ± 0.16b |
| C23:0 (Tricosanoic) | 1.98 ± 0.13a | 1.91 ± 0.07a | 1.93 ± 0.06a | 1.87 ± 0.14a | 1.84 ± 0.06a | 1.89 ± 0.06a |
| C24:1 (Nervonic) | 0.56 ± 0.02a | 0.55 ± 0.01a | 0.53 ± 0.02a | 0.29 ± 0.01c | 0.44 ± 0.03b | 0.46 ± 0.02b |
| Saturated fatty acid (SFA) | 19.31 ± 0.17c | 19.45 ± 0.19c | 19.49 ± 0.13c | 24.08 ± 0.19a | 19.76 ± 0.17b | 19.78 ± 0.19b |
| Monounsaturated fatty acid (MUFA) | 6.67 ± 0.23a | 6.64 ± 0.13a | 6.58 ± 0.12a | 5.55± 0.16c | 6.31 ± 0.14b | 6.33 ± 0.11b |
| Polyunsaturated fatty acid (PUFA) | 19.29 ± 0.22a | 18.78 ± 0.16b | 18.70 ± 0.19b | 9.45 ± 0.21d | 17.91 ± 0.15c | 17.79 ± 0.13c |
Publisher’s Note: MDPI stays neutral with regard to jurisdictional claims in published maps and institutional affiliations. |
© 2022 by the authors. Licensee MDPI, Basel, Switzerland. This article is an open access article distributed under the terms and conditions of the Creative Commons Attribution (CC BY) license (https://creativecommons.org/licenses/by/4.0/).
Share and Cite
Gulzar, S.; Balange, A.K.; Nagarajarao, R.C.; Zhao, Q.; Benjakul, S. Microcapsules of Shrimp Oil Using Kidney Bean Protein Isolate and κ-Carrageenan as Wall Materials with the Aid of Ultrasonication or High-Pressure Microfluidization: Characteristics and Oxidative Stability. Foods 2022, 11, 1431. https://0-doi-org.brum.beds.ac.uk/10.3390/foods11101431
Gulzar S, Balange AK, Nagarajarao RC, Zhao Q, Benjakul S. Microcapsules of Shrimp Oil Using Kidney Bean Protein Isolate and κ-Carrageenan as Wall Materials with the Aid of Ultrasonication or High-Pressure Microfluidization: Characteristics and Oxidative Stability. Foods. 2022; 11(10):1431. https://0-doi-org.brum.beds.ac.uk/10.3390/foods11101431
Chicago/Turabian StyleGulzar, Saqib, Amjad K. Balange, Ravishankar Chandragiri Nagarajarao, Qiancheng Zhao, and Soottawat Benjakul. 2022. "Microcapsules of Shrimp Oil Using Kidney Bean Protein Isolate and κ-Carrageenan as Wall Materials with the Aid of Ultrasonication or High-Pressure Microfluidization: Characteristics and Oxidative Stability" Foods 11, no. 10: 1431. https://0-doi-org.brum.beds.ac.uk/10.3390/foods11101431