
Discrimination of Stressed and Non-Stressed Food-Related Bacteria Using Raman-Microspectroscopy

1
Institute of Safety and Security Research, Bonn-Rhein-Sieg University of Applied Sciences, Von-Liebig-Straße 20, 53359 Rheinbach, Germany
2
Department of Chemistry and Biology, University of Siegen, Adolf-Reichwein-Str. 2, 57076 Siegen, Germany
3
Center of Micro- and Nanochemistry and Engineering, University of Siegen, Adolf-Reichwein-Str. 2, 57076 Siegen, Germany
*
Author to whom correspondence should be addressed.
Foods 2022, 11(10), 1506; https://0-doi-org.brum.beds.ac.uk/10.3390/foods11101506
Submission received: 1 April 2022
/
Revised: 16 May 2022
/
Accepted: 19 May 2022
/
Published: 22 May 2022
Abstract
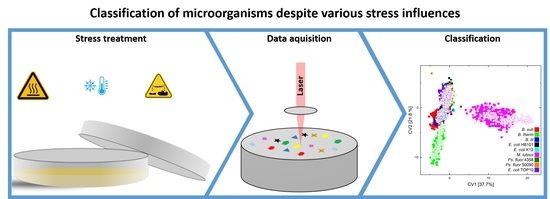
:As the identification of microorganisms becomes more significant in industry, so does the utilization of microspectroscopy and the development of effective chemometric models for data analysis and classification. Since only microorganisms cultivated under laboratory conditions can be identified, but they are exposed to a variety of stress factors, such as temperature differences, there is a demand for a method that can take these stress factors and the associated reactions of the bacteria into account. Therefore, bacterial stress reactions to lifetime conditions (regular treatment, 25 °C, HCl, 2-propanol, NaOH) and sampling conditions (cold sampling, desiccation, heat drying) were induced to explore the effects on Raman spectra in order to improve the chemometric models. As a result, in this study nine food-relevant bacteria were exposed to seven stress conditions in addition to routine cultivation as a control. Spectral alterations in lipids, polysaccharides, nucleic acids, and proteins were observed when compared to normal growth circumstances without stresses. Regardless of the involvement of several stress factors and storage times, a model for differentiating the analyzed microorganisms from genus down to strain level was developed. Classification of the independent training dataset at genus and species level for Escherichia coli and at strain level for the other food relevant microorganisms showed a classification rate of 97.6%.
1. Introduction
The increasing demand for food, as well as the ever-increasing population of the planet makes the food sector an essential industry [1,2,3,4]. Due to the massive amount of 931 million tons of food waste, as well as the 600 million cases of food-borne illnesses occurring annually and the associated consumer fear, the research area of food safety is of particular interest [5,6,7]. In particular, bacterial detection is a critical concern in the food sector; for example, for determining shelf life dates [8,9]. Therefore, methods that identify the contamination of products at an early stage are of major importance [8,9].
However, the typical methods for detecting and determining bacteria, such as classical microbiological determination and immunological or genetic approaches are exceedingly expensive, difficult, and time-consuming due to the need of cultivation times, DNA extractions and well trained employees [9,10,11,12,13,14,15]. Another problem with these approaches is that they are standardized to laboratory conditions, resulting in the loss of real-world samples and the possibility of missing relevant information [10,16]. Because bacteria are typically exposed to a variety of external influences, both in the environment and directly on the samples to be examined, detection and determination methods must incorporate these external influences in order to account for rapid reactions of the microorganisms caused by external stress in their calculations [16,17,18,19]. This is especially essential because bacteria can not only adjust their metabolic activity in response to changing environments, but they can also change to a viable but non-culturable state, leaving them inaccessible to traditional determination methods [10,17,20,21]. Therefore, it is necessary to study the stress response of microorganisms and to consider it in the databases and classification models for quality control or shelf-life data determination [15,22].
These reactions can be studied by rapid and non-destructive vibrational spectroscopy on a microscopic level by coupling Raman or IR spectrometers with a microscopic system, as these couplings are able to study samples in the range of a few micrometers [1,23,24,25].
While Raman spectroscopy is based on the scattering of monochromatic light and the shift in polarizability, infrared (IR) spectroscopy is based on the absorption of polychromatic infrared light and the resulting change in dipole moment [23,25,26,27,28,29]. Certainly, IR-active vibrational modes often exhibit weak Raman signals and vice versa and so both methods provide complementary information about the molecular composition of microorganisms that thus contribute to classification [8,21,30,31].
IR spectroscopy is more susceptible to interference due to the materials used, the disturbance by water and the strong influence of sample thickness, as well as external influences, but it is still easier to handle [21,28,32]. Raman spectroscopy offers high flexibility of excitation wavelengths and sample properties and a higher spatial resolution, often at a higher cost [21,26,27,33]. A more detailed explanation of Raman and IR spectroscopy and their ability to differentiate microorganisms can be found in the literature [21,23,25,28,34,35,36].
The suitability of Raman spectroscopy for the identification of bacteria at the genus, species, and strain level has already been demonstrated [37,38,39,40]. Since many factors and parameters have an influence on the sample and the resulting spectrum, the exact consideration of the influencing factors is an important approach [41]. The use of Raman spectroscopy to study the effect of stress factors on bacteria has typically been limited to specific factors or individual microorganisms. Most Raman spectroscopic studies on how bacteria respond to stress stimuli have used Escherichia coli (E. coli) as an example. Studies on E. coli include the effect of different antibiotics [42,43,44,45], as well as the effect of storage time and sample preparation such as centrifugation [46], the influence of CO2 [47], the effect of alcohols [45,48,49], and the effect of temperature and different growth media [50]. In addition, investigations on the different stages of the lifecycle of E. coli, Vibrio vulnificus, Pseudomonas aeruginosa, and Staphylococcus aureus [14]; the metabolic monitoring of Metschnikowia sp. under different temperatures and C:N ratios [51]; and the effect of UV radiation on E. coli, Serratia marcescens, and Micrococcus luteus (M. luteus) [52] have been conducted. Furthermore, the influence of transportation and storage on E. coli, Klebsiella terrigena, Listeria innocua, Pseudomonas stutzeri, Staphylococcus cohnii and Staphylococcus warneri [22]; the spore composition of Lysinibacillus boronitolerans in different broth media [53]; and the impact of NaCl, MgSO4, and acetate on Synechocystis PCC6803 [54] have been investigated. However, to the best knowledge of the authors the investigation of different stress factors and storage times on diverse food relevant microorganisms has not been reported so far in the peer-reviewed literature.
As a result, this study’s goal was to extend the standard models for various defined stress factors on microorganisms that are significant in the food sector (Bacillus subtilis; three E. coli strains; M. luteus; Brochothrix thermosphacta; two Pseudomonas fluorescens strains; and Bacillus thuringiensis israelensis) in order to validate the impact of the stress variables on the quality and reliability of the classification model. In the same context, the spectral variations of different microorganisms caused by stress influence can be noticed, as can attempts to standardize Raman research on biological material in terms of sample preparation and pre-processing.
2. Materials and Methods
2.1. Bacterial Cultures and Sample Preparation
For this study, the food spoilage-relevant bacteria were cultivated on a nutrient agar with the composition of 18 g/L agar-agar, 10 g/L meat extract, 10 g/L meat peptone and 5 g/L sodium chloride (Merck KGaA, Darmstadt, Germany). The bacteria were as follows:
Escherichia coli K12 DSM 498, TOP10, and HB101; Micrococcus luteus DSM 20030; Brochothrix thermosphacta DSM 20171 (B. therm); Pseudomonas fluorescens (Ps. fluor) DSM 4358 and DSM 50090; Bacillus subtilis DSM 10 (B. sub); and Bacillus thuringiensis israelensis DSM 5724 (B. tii).
The microbial samples to be examined were taken directly from the medium by means of a swab through a stainless steel cylinder without further sample preparation [40,55]. Raman spectra of samples that were cultivated under lifetime stress conditions were recorded immediately after sampling. Otherwise, the samples were subjected to sampling stress and examined spectroscopically without further incubation time after the stress impact.
2.2. Sample Treatment
In addition to the regular reference treatment, the microorganisms were exposed to acidic and alkaline incubation, incubation at lower temperature and incubation under 2-propanol influence, which are summarized as lifetime stress conditions. Furthermore, they were subjected to different sampling conditions (heat sampling, cold sampling, and desiccation).
All microorganisms were incubated in a Binder BD 240 (BINDER GmbH, Tuttlingen, Germany) incubator.
2.2.1. Lifetime Stress Conditions
All samples were cultivated according to DSMZ (Leibniz Institut DSMZ, German Collection of Microorganisms and Cell Cultures, Germany) guidelines, except for those that were stressed by incubation at 25 °C. No further sample preparation, like the drying steps of the sample were performed after sampling.
In addition to the reference samples and the samples that were cultivated at 25 °C, the microorganisms were exposed to pH stress. For this, a hydrochloric acid (HCl) solution with pH 1 (36%, Alfa Aesar, USA; confirmed using pH indicator paper, Th. Geyer GmbH & Co. KG, Renningen, Germany) was prepared, as well as a sodium hydroxide solution (sodium hydroxide pellets, Merck, Darmstadt, Germany) with pH 13. The agar plates were thoroughly covered with a 2 mL solution of hydrochloric acid or sodium hydroxide and the inoculation was performed on the covered agar plates.
Analogously to the acidic and alkaline stress incubation, the bacteria were stressed with 2-propanol (99.9%, Höfer Chemie GmbH, Kleinblittersdorf, Germany).
2.2.2. Sampling Stress Conditions
Microorganisms that were exposed to sampling stress conditions were sampled from regular treated samples. For cold sampling they were covered with liquid nitrogen for 60 s and instantly measured. The heat-dried samples were dried for 60 min at 50 °C and instantaneously measured, whereas the desiccated samples were dried for 60 min over silica gel and instantly measured.
2.3. Instrumentation
A SENTERRA Raman Microscope (Bruker Optics GmbH, Ettlingen, Germany) with a 785 nm diode laser and a charge-coupled device (CCD) detector was employed in this investigation. The microbiological samples were placed on a motorized XYZ sample stage (Märzhäuser Wetzlar GmbH & Co. KG, Wetzlar, Germany) and focused with a 50× LMPlanFL N objective lens (Olympus K.K, Shinjuku, Tokyo, Japan). The OPUS 7.5 Raman environment software was used for data acquisition and control.
All measurements were performed with a 100 mW initial laser power, an integration time of eight seconds, and ten co-additions. A spectral range of 410–1790 cm−1 with a spectral resolution of 3–5 cm−1 was chosen to shorten the measuring time.
2.4. Data Handling and Statistical Analysis
Raman spectra were truncated to the range of 600–1200 cm−1 to cover the most relevant bacterial Raman characteristics and sum normalized (OriginPro 2019b, OriginLab Corporation, Northampton, MA, USA).
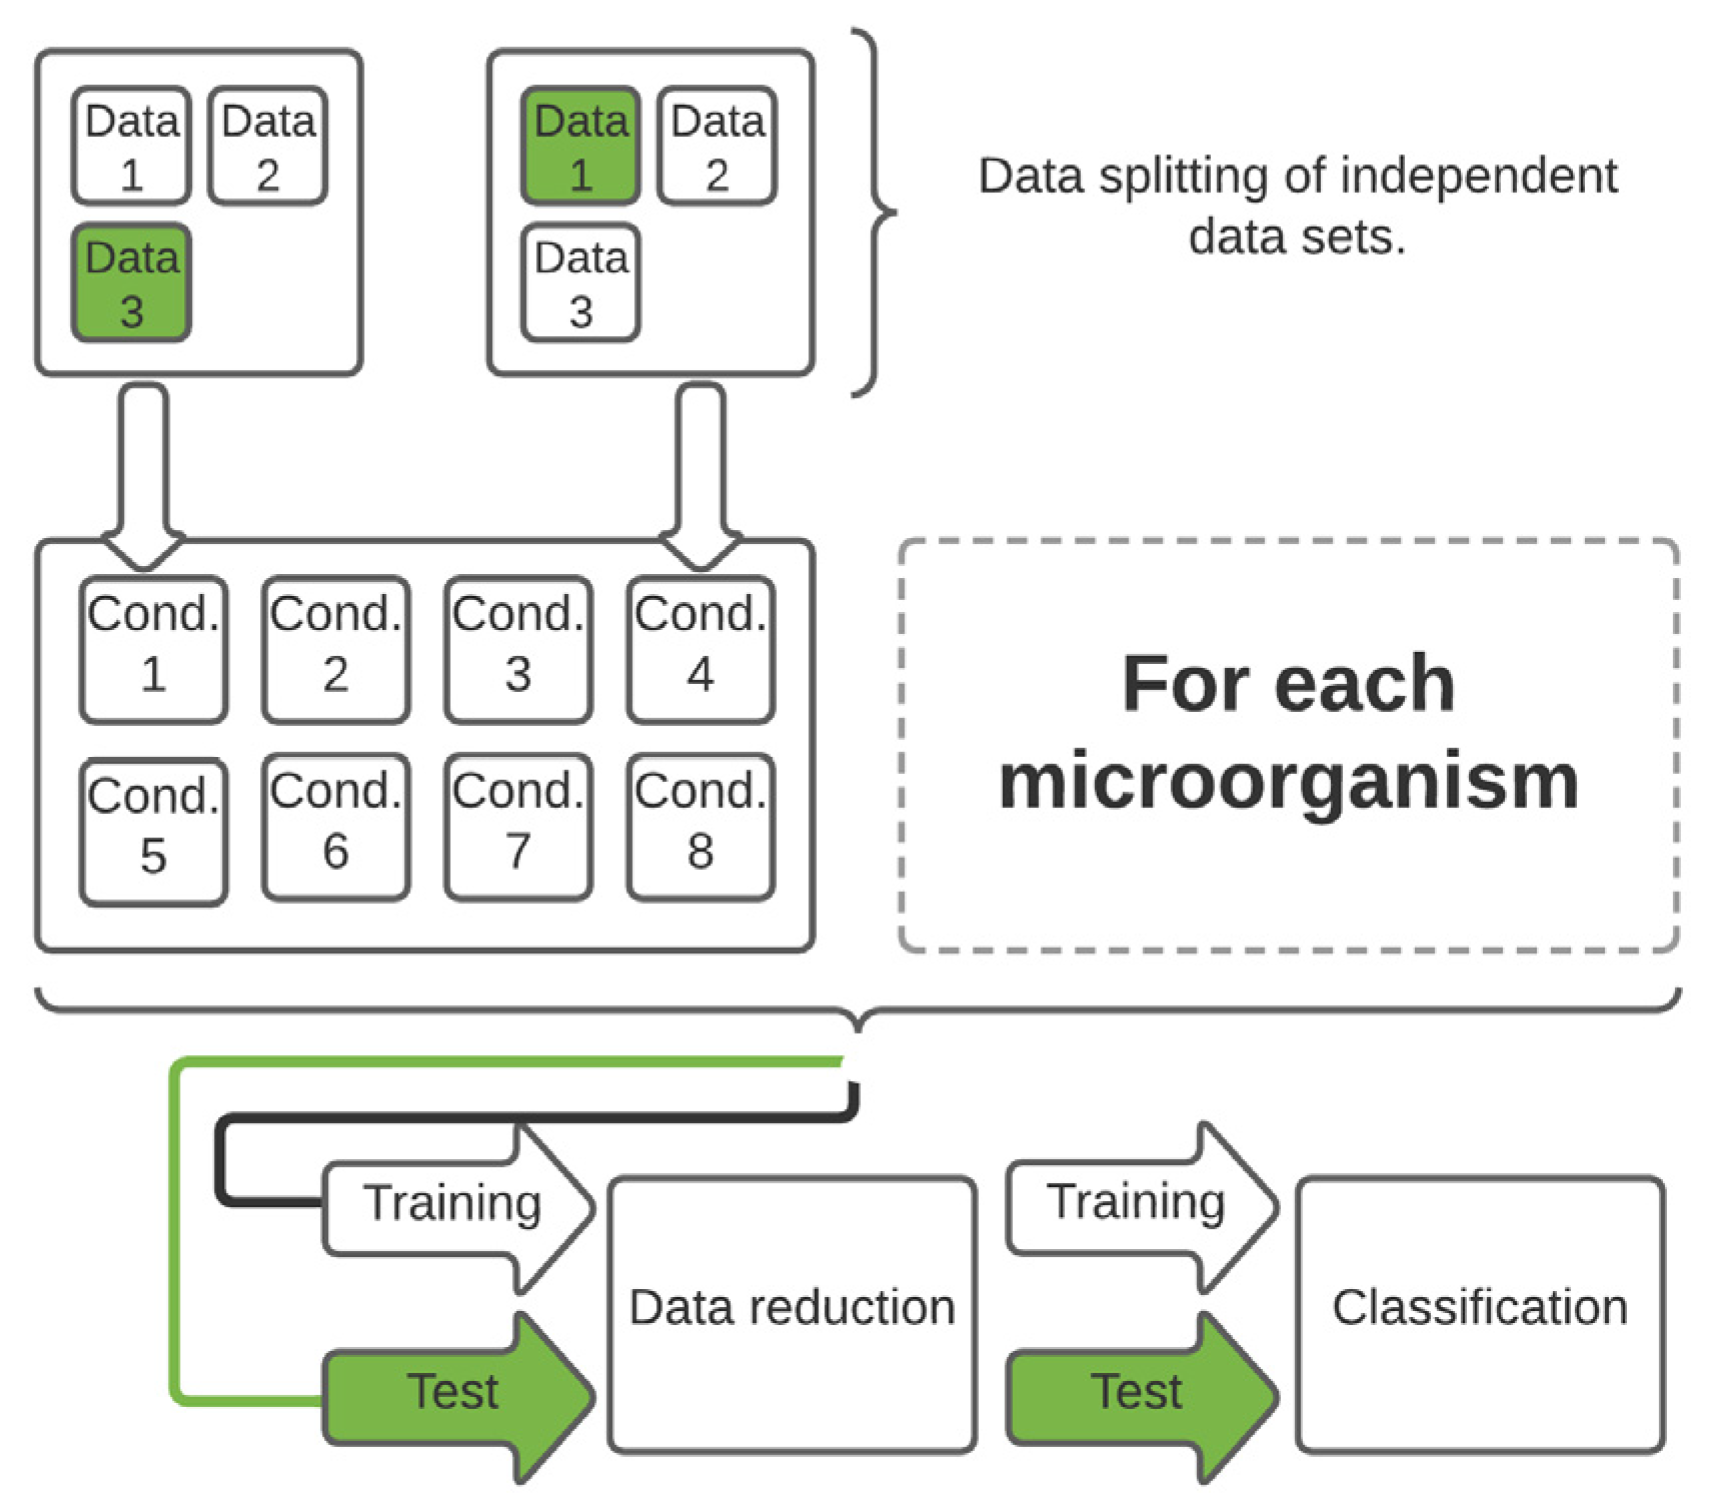
Independent training and test data sets were built so that one of three independent data sets of each stress condition could be used as a test data set (Figure 1). Table S1 in the supplementary material contains detailed information on the exact splitting pattern and the time duration during which bacteria were exposed to lifetime stress conditions.
Using LabVIEW 2016 and OriginPro 2019b, a principal component analysis (PCA), an unsupervised chemometric technique was executed to the training data set to reduce the data set’s dimensionality [56]. The test data sets were converted to the dimensional space of the training data set by applying the training data set’s descriptive statistics and the loadings of the performed PCA to the test data set.
3. Results and Discussion
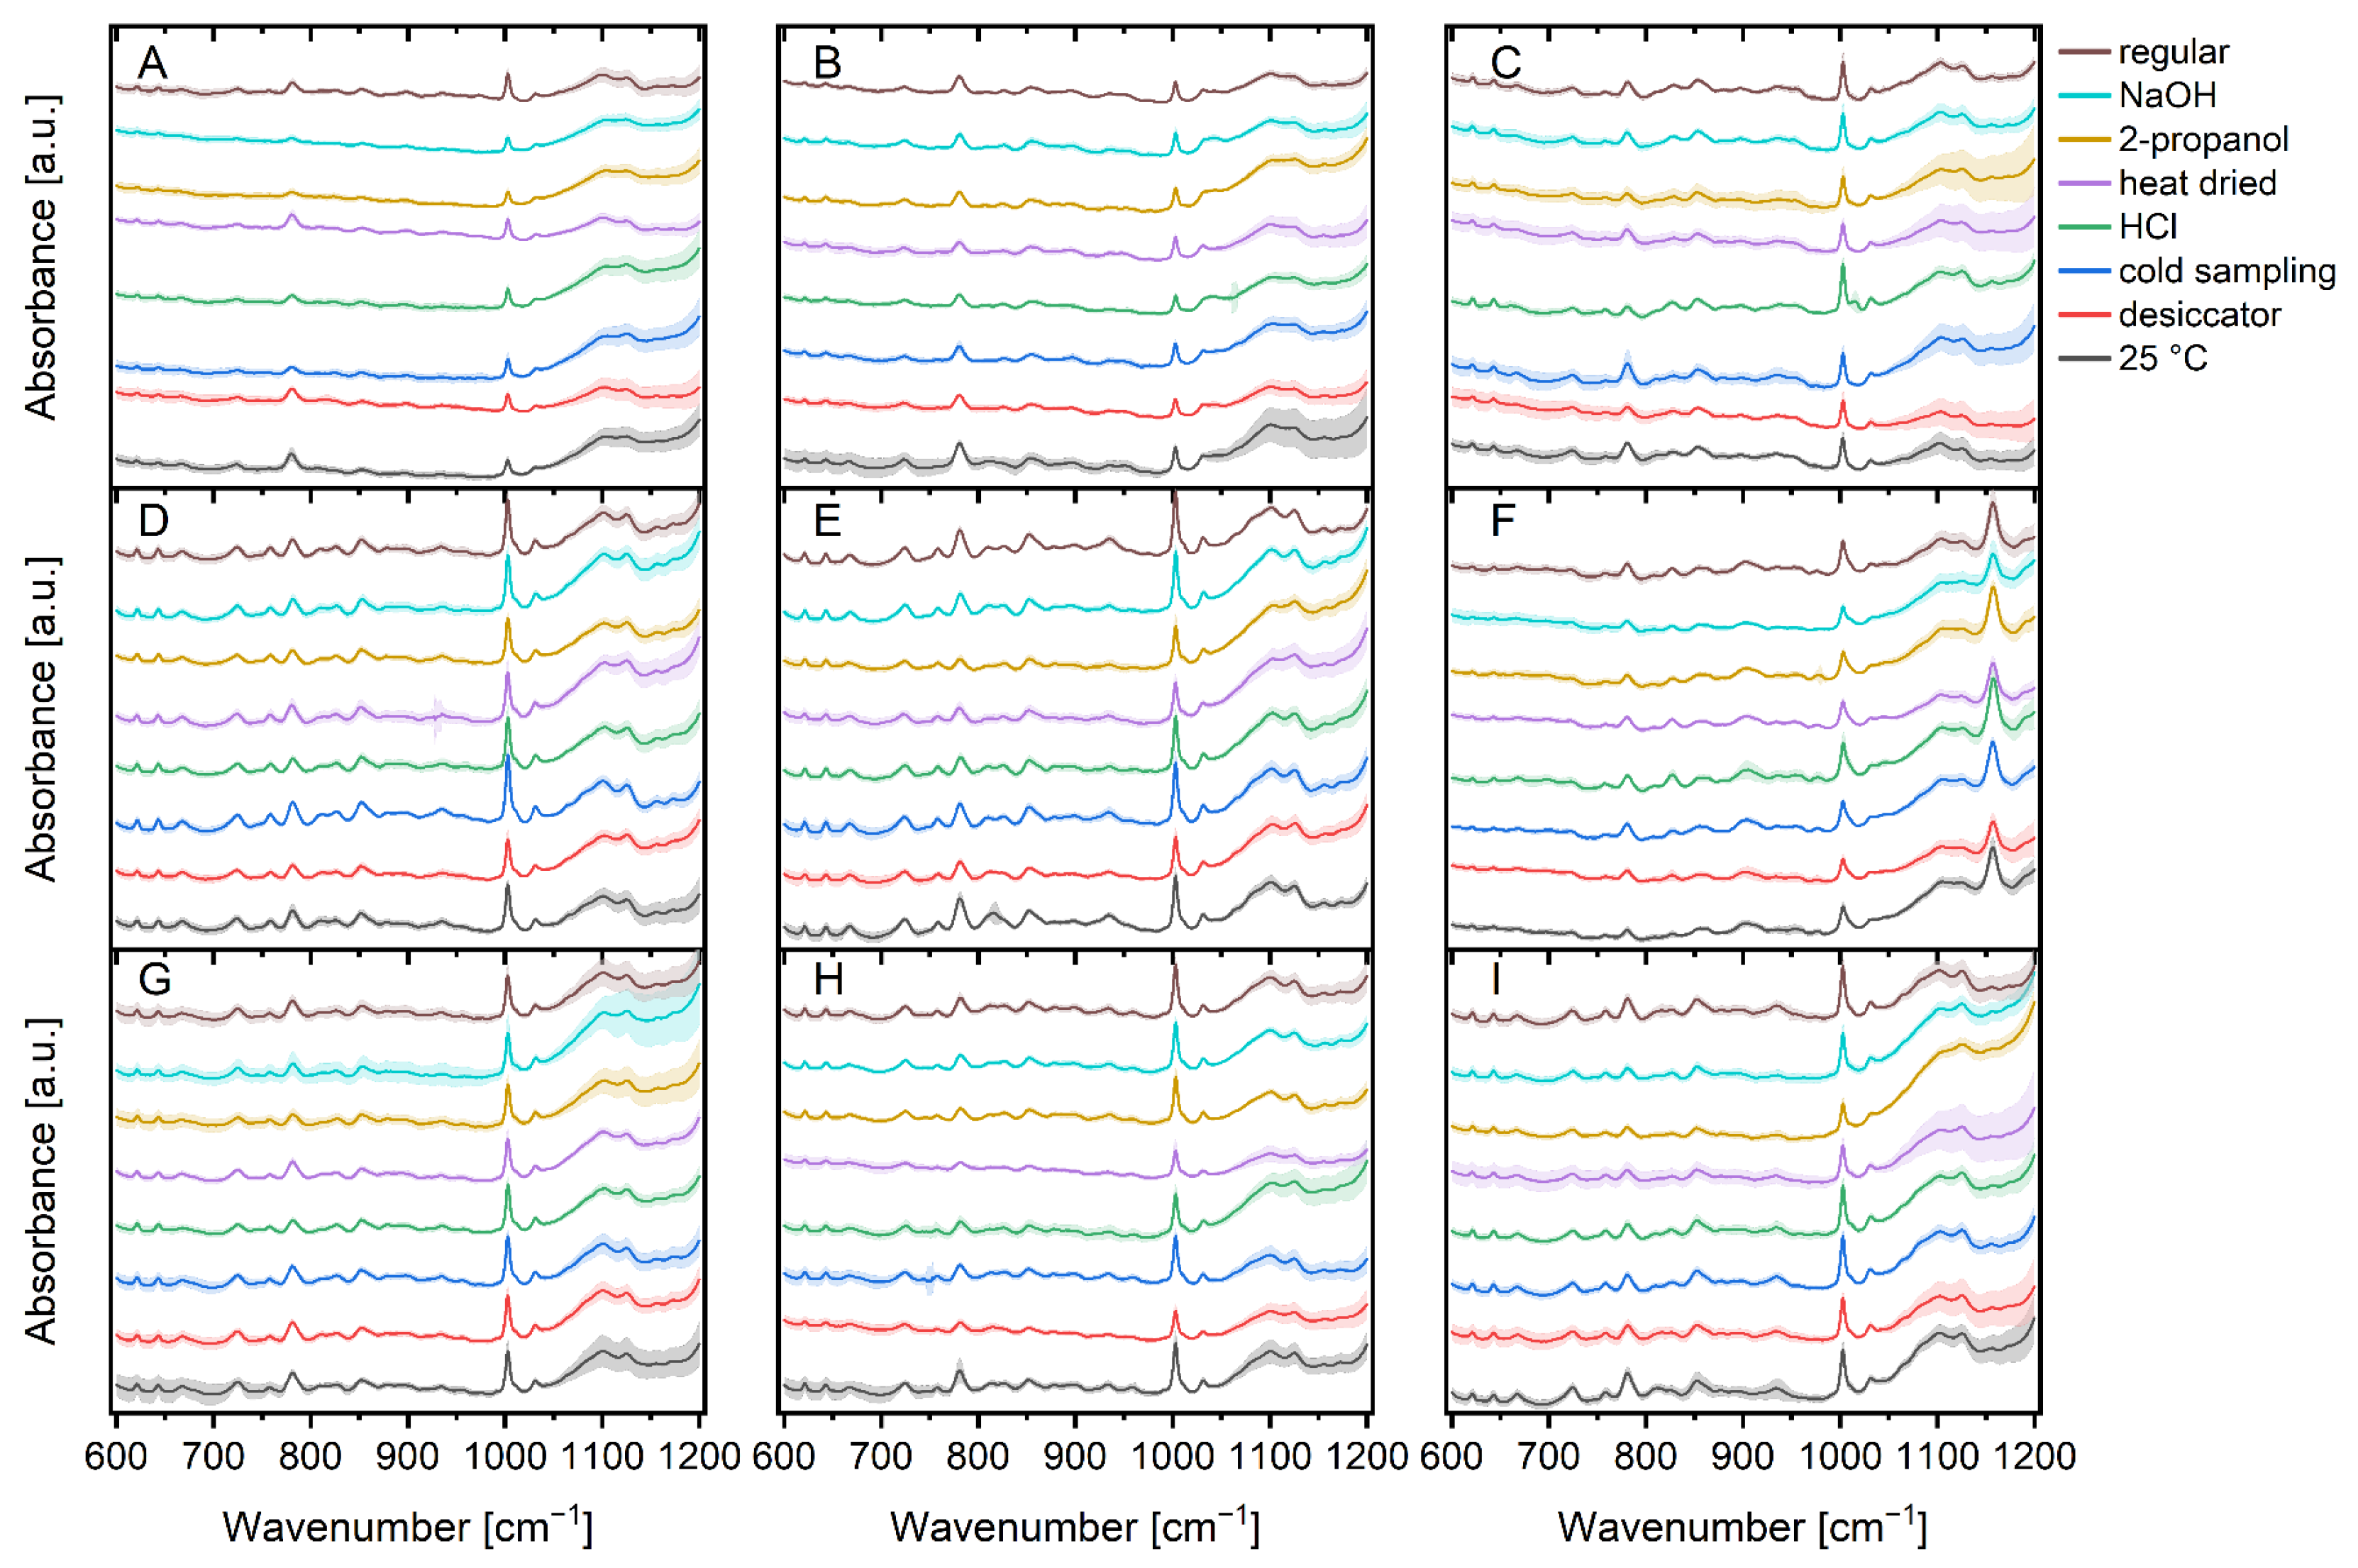
Figure 2 illustrates the mean Raman spectra of bacteria under regular cultivation conditions versus bacteria under different stress conditions, along with their standard deviations.
A closer look at the spectra reveals a few variations between the microorganisms. For example, the region between 650 cm−1 and 900 cm−1 (proteins, polysaccharides, nucleic acids) [11,25,50,59] which is distinctive for specific bacteria, shows not only differences between Bacilli and E. coli, but also variances between Bacilli. For example, the vibration in the cytochrome and DNA [43,50] region around 750 cm−1 varies slightly between Bacilli, while the vibration in the region around 890 cm−1 (protein, polysaccharide) [11,43] is more pronounced in Bacilli and the vibration in the guanine/DNA region around 665 cm−1 [43,60] is less pronounced in the other microorganisms measured. Aside from the obvious difference due to the sarcinaxanthine carotenoid peak at 1157 cm−1 [61,62], M. luteus, M. luteus and B. therm also have a band at 1047 cm−1 which can be assigned to carbohydrates [43,63] that the other species do not have.
Apart from the differences between the individual microorganisms, there are a few differences between the various stressors of the individual microbial species. The detection of a peak at 1016 cm−1 for HCl stressed B. tii is by far the most noticeable change. This peak is not found in any other stress factor and can be linked to the symmetric ring breathing vibration of calcium dipicolinic acid during bacterial spore germination [64,65,66,67]. M. luteus bacteria cultured at 25 °C possess less exposed tyrosine (828 cm−1) [11] than those incubated at other temperatures. Incubation with 2-propanol and sodium hydroxide reveals additional impact on DNA/RNA occurrence in B. sub as the peaks for the nucleic acids (810 cm−1) [63,68] and bases (665 cm−1, 722 cm−1, 783 cm−1, 828 cm−1) [11] are substantially less pronounced. Nucleic acids and tyrosine (810 cm−1; 828 cm−1) [11,63,68] are also impacted in 25 °C incubated E. coli K12 as instead of two peaks, there is only one peak with considerably higher intensity. E. coli TOP10 exhibits spectral changes in DNA/RNA and carbohydrates (1100–1130 cm−1) [69,70] after incubation with 2-propanol, as well as changed peak ratios for nucleic acids and tyrosine (810 cm−1/828 cm−1) [11,63,68] ranges after incubation at 25 °C. Such alterations are also found for HCl stressed Ps. fluor 50090 and NaOH stressed Ps. fluor 4358 in the range of 1100–1130 cm−1 (DNA/RNA and carbohydrates) [69,70]. In addition to the increased intensity, there is a shift in favor of carbohydrates [70]. This change can also be seen in HCl and 2-propanol stressed B. therm. Furthermore, B. therm incubated at 25 °C exhibits more pronounced peaks at 667 cm−1 and 810 cm−1 (guanine und nucleic acids) [11,63,68] compared to the other parameters.
As spectral variations between specific bacteria and stress conditions are founded on the differences in cell proteins, nucleic acids, lipopolysaccharides, and lipids, visual discrimination of the complete 5450 spectra (Figure 2) is nearly unachievable [10] and chemometric techniques can help with classification.
To achieve optimal model development and avoid overfitting (performance plot: Figure S1), 30 PCs were selected for discriminant analysis model building.
Because there was no substantial equality in the covariance matrices of the training data classes, a quadratic discriminant function was chosen rather than a linear discriminant function [45,46,47].
The classification and cross-validation errors for the training data were 0.78% and 1.5%, respectively. To assess the robustness, accuracy, and reproducibility of the constructed classification model, independent test data sets were added to the model.
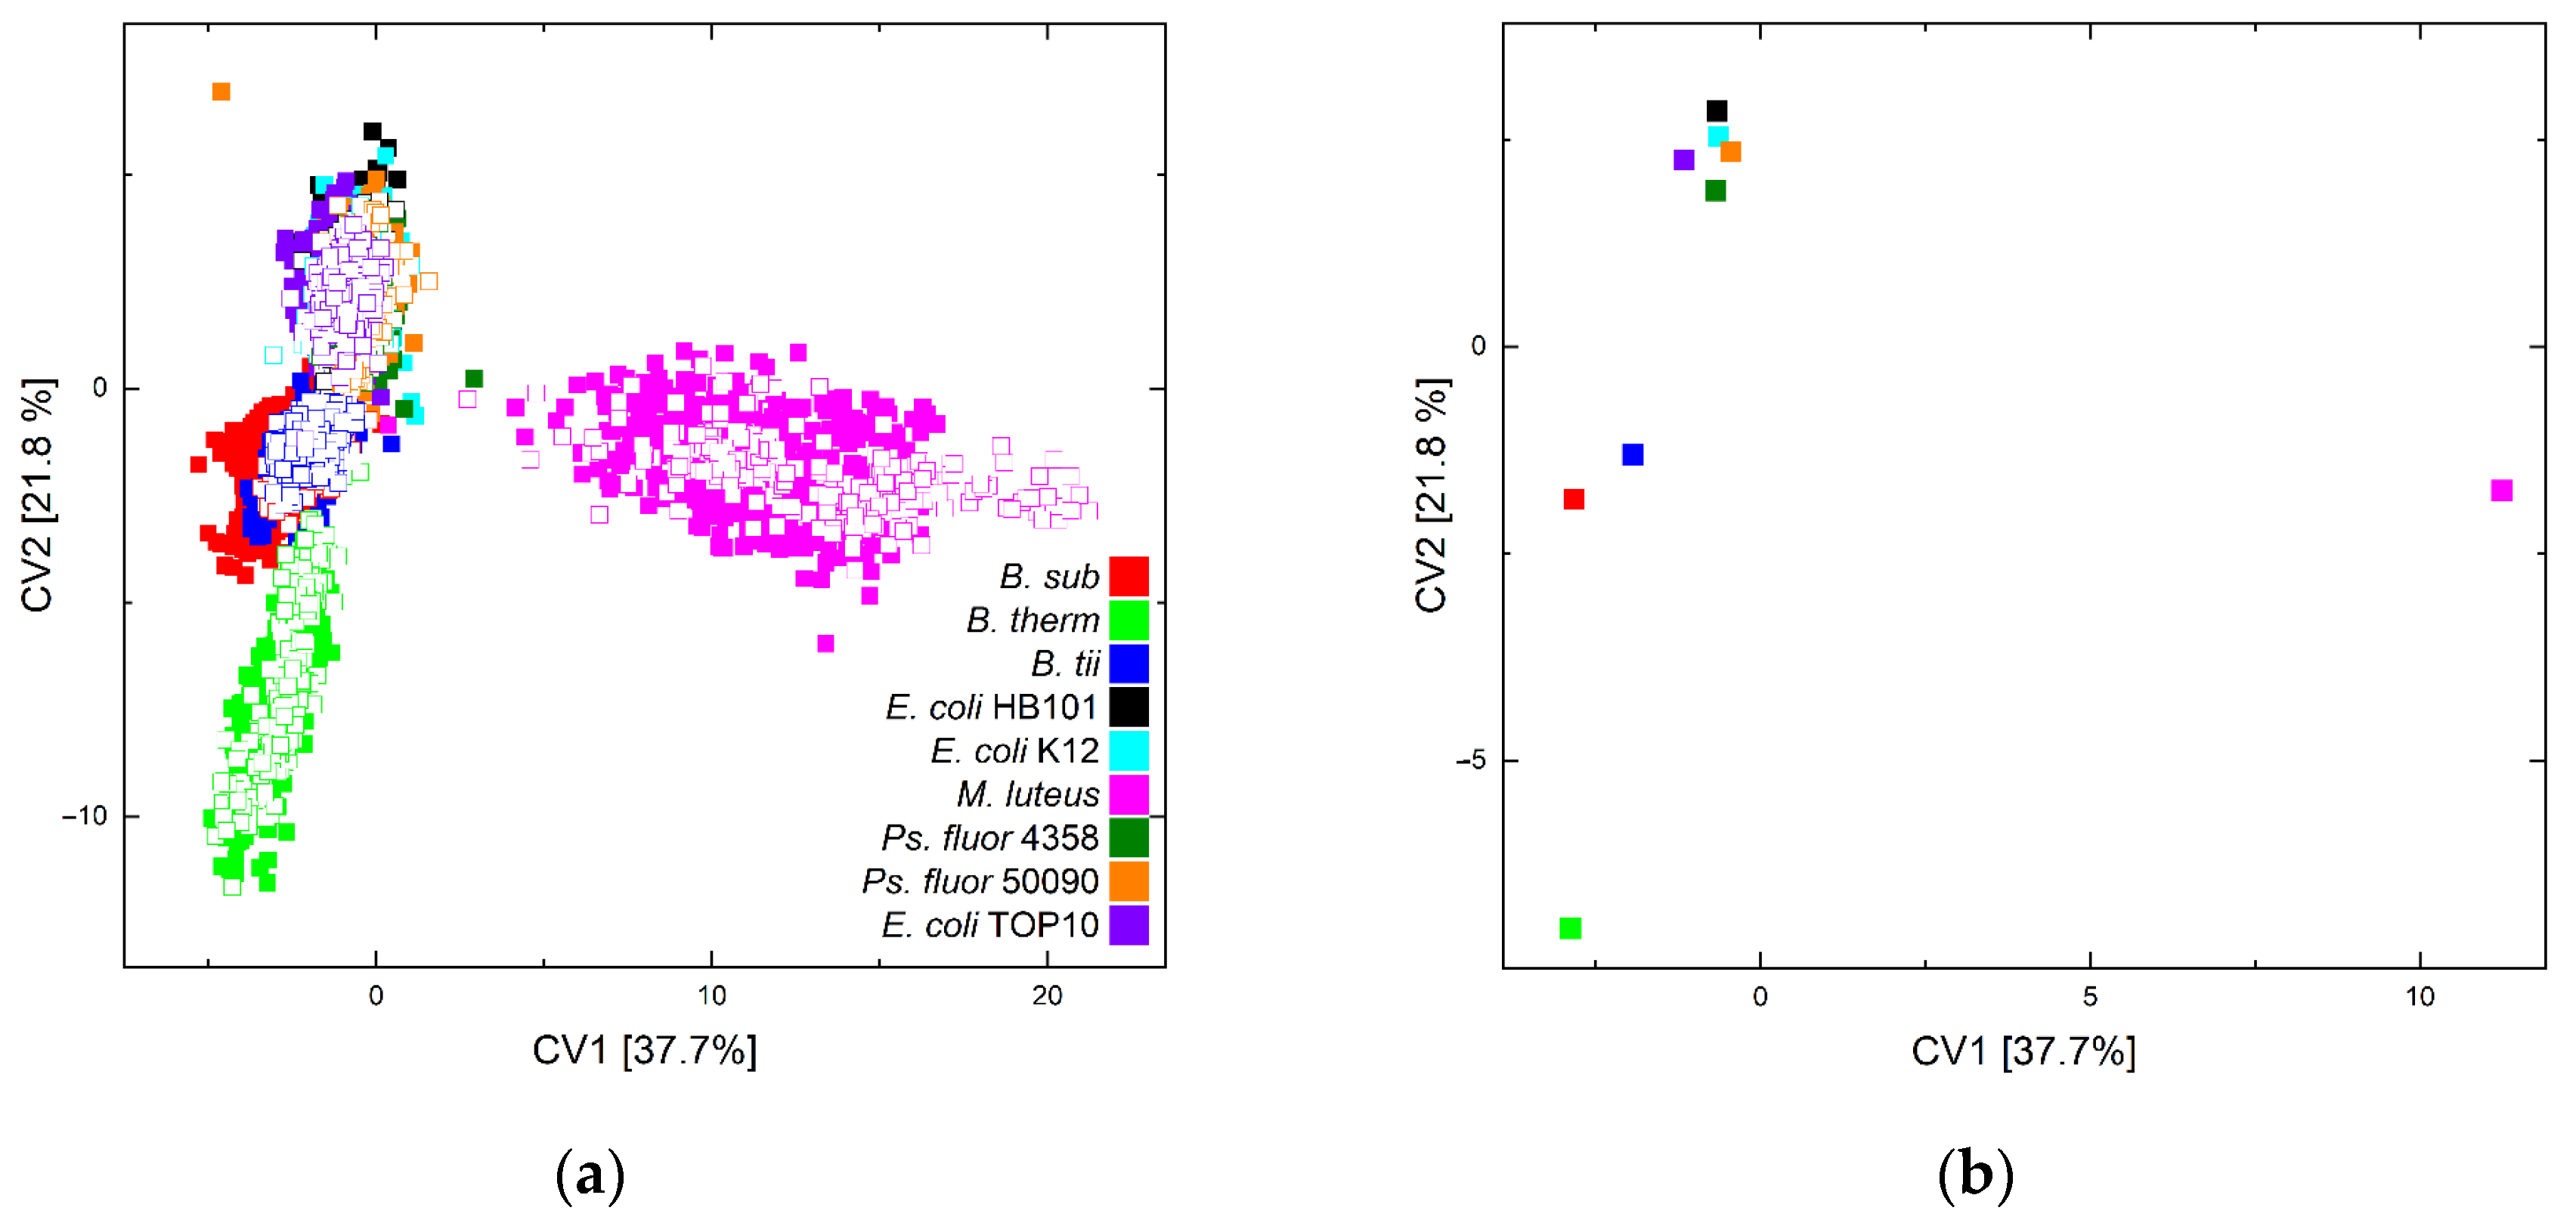
Figure 3 depicts canonical variables (CV) 1 and 2 of the quadratic discriminant analysis (QDA) of training (solid squares) and test data (unfilled squares) (a) and the group centroids of the training data for CV1 vs. CV2 (b).
The above-mentioned spectral differences are also reflected in the graphical depiction of the discriminant analysis. The reported differences clearly differentiate the point clouds of M. luteus and B. therm from the other point clouds. However, due to the magnitude of the point clouds, further visual distinction is difficult in the plot. The plot of the group centroids, on the other hand, indicates that M. luteus is well separated from the other groups by its obvious extra features and B. therm is separated from the other bacteria, although the Bacilli cluster together overall. The separation of E. coli and Ps. fluorescens between or among themselves does not appear to be achievable.
However, in general, the independent test data are found in the space of the training data, and so the assignment of these data is achievable.
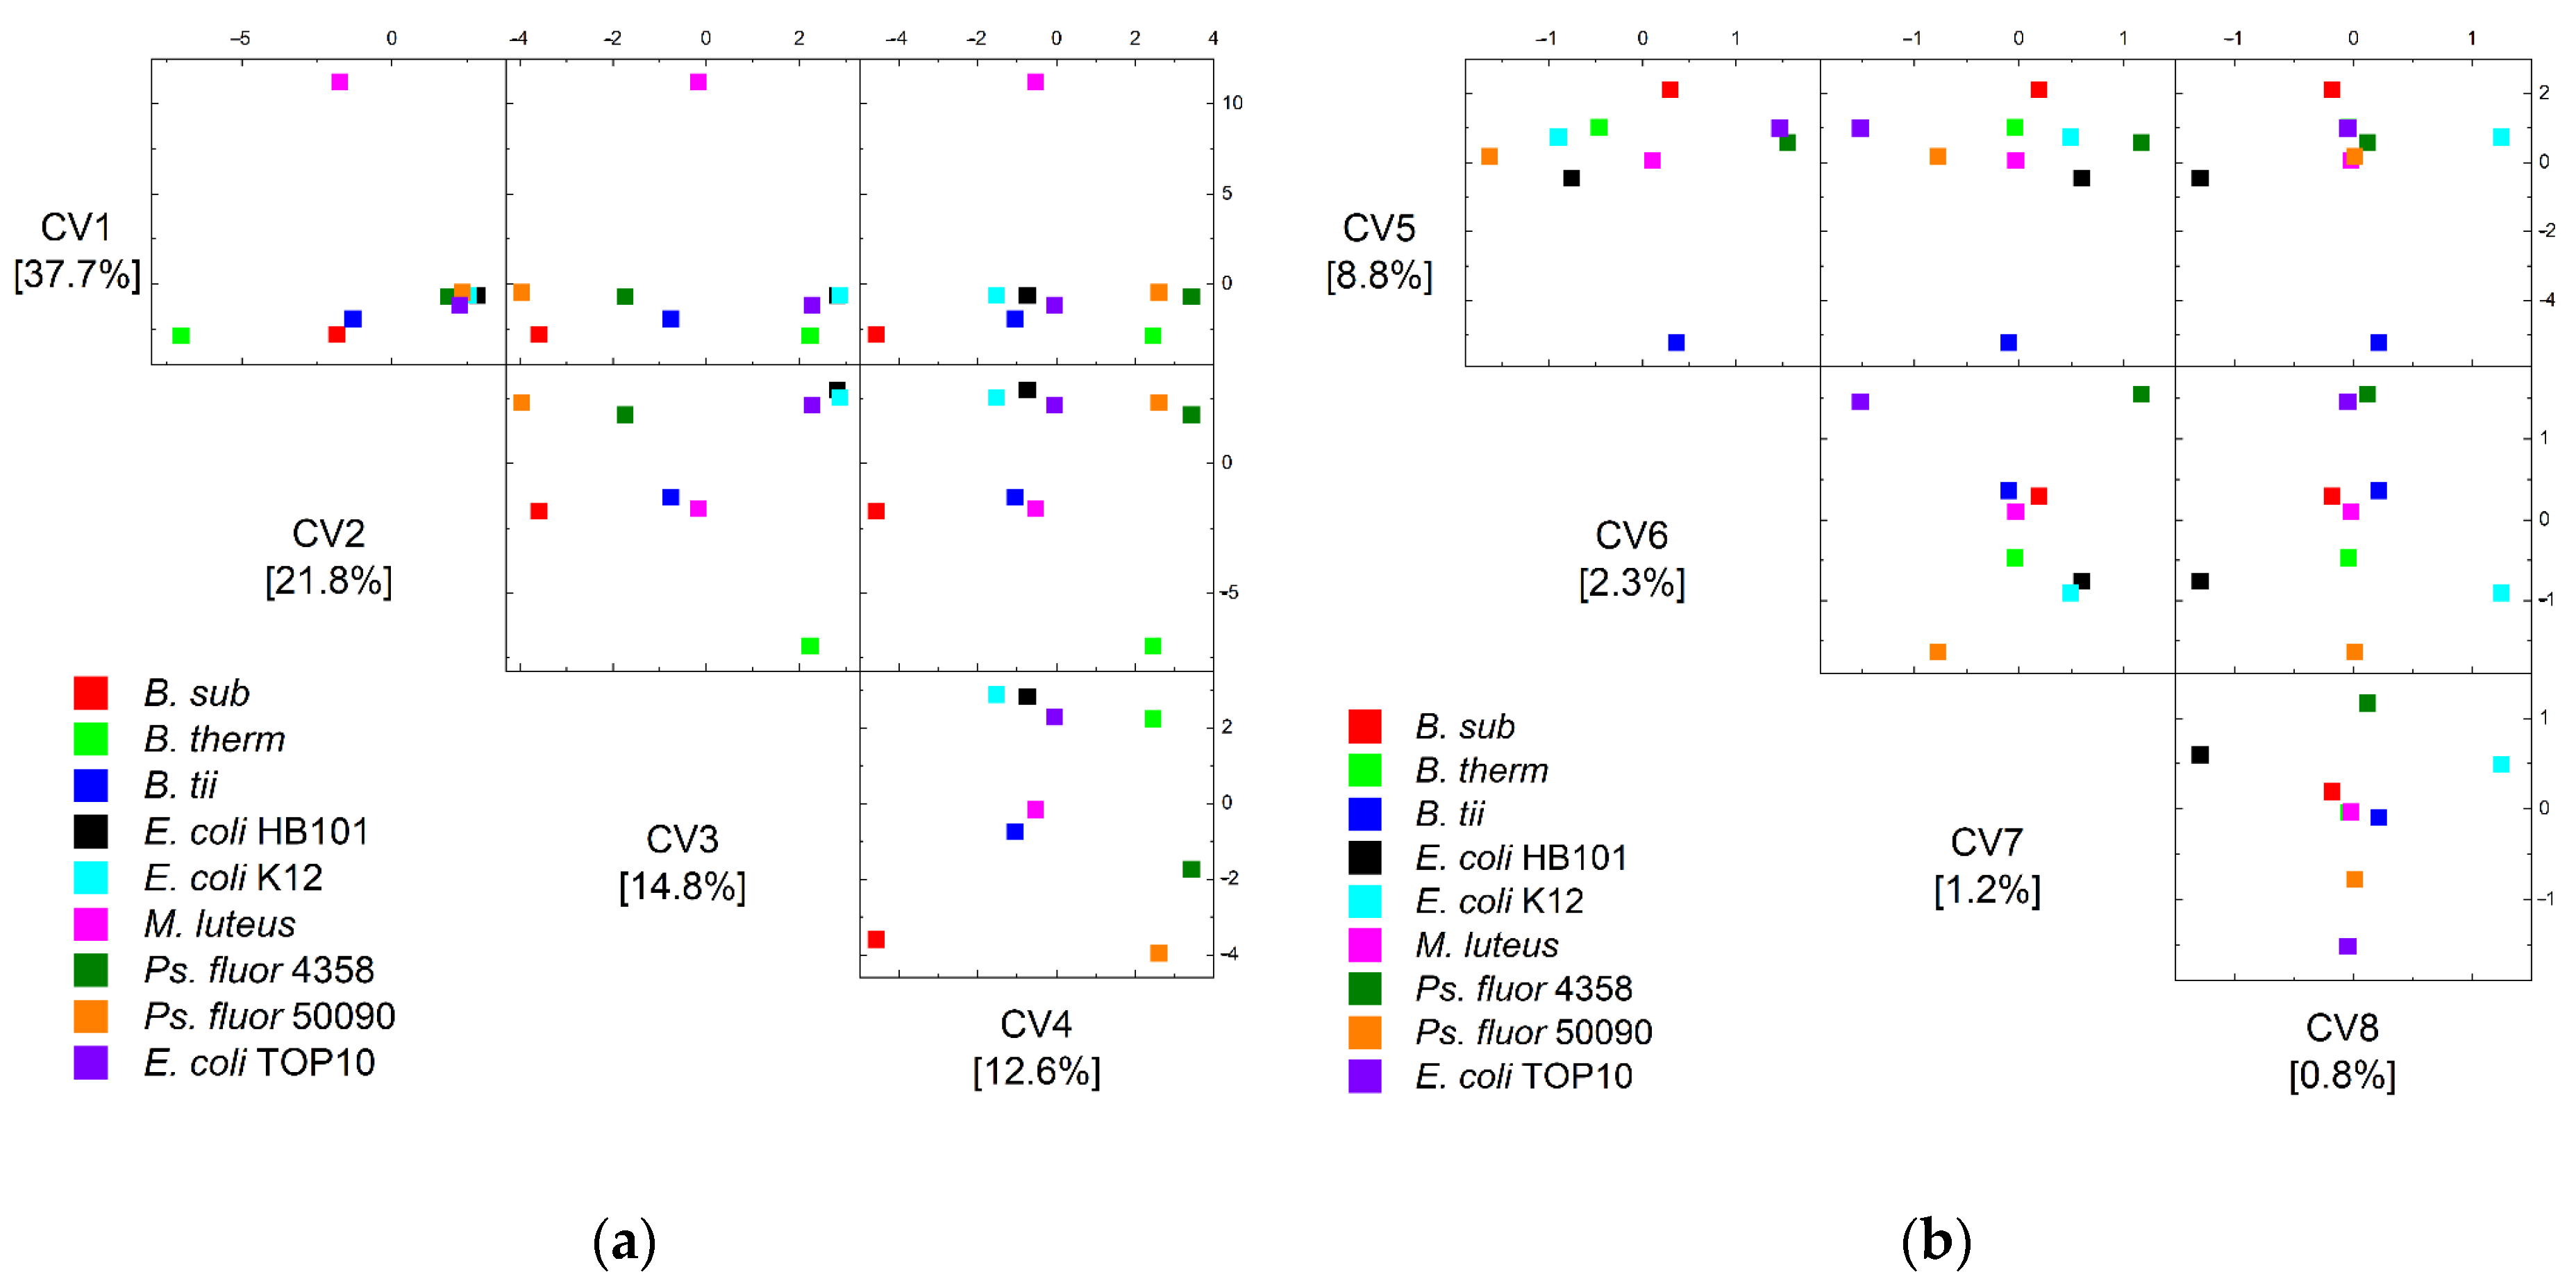
Figure 4 depicts the group centroids in the eight dimensions of the discriminant analysis in order to analyze the separation of the two remaining bacilli, particularly the separation of E. coli and Ps. fluorescens.
This demonstrates that all Bacilli are separated in the first three dimensions, but Pseudomonads and E. coli require more dimensions in order to be completely separated. The clear distinction of E. coli germs in particular is only achievable in the eighth dimension.
The classification results of the independent test data are provided in a confusion matrix (Table 1) which gives the number of spectra categorized to the correct (diagonal) or incorrect predicted class.
The test data categorization and, as a result, the creation of a robust and applicable model was successful. The independent test data classification error rate was 12.5% and was distributed throughout all classes except M. luteus.
Table 2 offers a detailed assessment of the classification errors on the sub-class level because the overall dataset is made up of a significant number of sub-datasets per microorganism.
The improper assignment of E. coli K12 to TOP10 and HB101 and vice versa, as well as the incorrect classification of Ps. fluorescens 50090 to Ps. fluorescens 4358 and vice versa, accounted for most of the errors.
The graphical representation of the classification results already indicated the problem of separation for Ps. fluorescens, but especially for E. coli separation. The accumulation of 187 misclassifications in the area of E. coli out of a total of 232 misclassifications shows that the developed model has good separating power but has weaknesses for separating E. coli strains. The modification of the model in such a way that the model for the differentiation of genera, species, and strain level is retained and the differentiation of E. coli remains at the species level leads to a false classification rate of only 2.4%.
In comparison to other studies concerning the determination of microorganisms, as well as the influence of stress factors on microorganisms by Raman spectroscopy which partly point to a stricter standardization of the methods [46,71,72] and mainly employ complex and time-consuming sample preparation [44,50,52,73], the presented results show that a reconsideration of the common practice would be helpful, particularly with regard to real-world samples. Because the relevant literature focuses on the analysis of stress factors on specific microorganisms [42,43,44,45,46,48,49,50] or individual stress factors on a few microorganisms [14,52], it was possible to confirm the results observed in this study, namely that the areas influenced by stress factors in microorganisms are primarily found in proteins, lipids, nucleic acids, and polysaccharides [44,45,49,50,52,73]. The combination of numerous stress factors with the traditional reference samples in a model also demonstrated that the classification of unknown samples is not inferior to the classification rates of earlier studies [39,49,74].
In summary, despite the various spectral changes in the range of proteins, lipids, nucleic acids and polysaccharides due to the eight different stress factors applied (lifetime and sampling conditions) to nine different microorganisms, a robust and reliable classification model for food-relevant microorganisms down to strain level could be developed.
4. Conclusions
Stress causes alterations in the Raman spectral characteristics of food-relevant microorganisms. Regardless of cultivation conditions, sampling and storage time, a method using simple sample preparation, rapid measurement by Raman microspectroscopy, and chemometrics was developed for the rapid and non-destructive analysis of food-relevant bacteria. A robust and reliable model was created using a canonical discriminant analysis to discriminate nine different microorganisms at genus down to strain level, despite their storage time and sampling of lifetime condition, with about 12% misclassification for independent test data accuracy. The modification of the model for the differentiation on genera, species and strains was retained and the differentiation of E. coli remained at the species level, leading to an overall accuracy of 97.6%.
Compared to reference microorganisms that were cultivated under specified standards, stressed microorganisms showed alterations in the spectral range of lipids, nucleic acids, polysaccharides, and proteins.
The results approve the potential of Raman microspectroscopy for the discrimination of bacteria and interpretation of microbial stress responses. Additionally, they indicate that sample preparation and standardization should be reconsidered, and existing standardized databases should also contain stress conditions.
Supplementary Materials
The following are available online at https://0-www-mdpi-com.brum.beds.ac.uk/article/10.3390/foods11101506/s1, Table S1: detailed information of data splitting; Figure S1: check for overfitting.
Author Contributions
Conceptualization, D.K.; methodology, D.K.; software, D.K. and R.B.; validation, D.K. and R.B.; formal analysis, D.K.; investigation, D.K. and J.R.; resources, P.K. and C.E.; data curation, D.K.; writing—original draft preparation, D.K.; writing—review and editing, D.K., R.B., J.R., C.E. and P.K.; visualization, D.K.; supervision, C.E. and P.K.; project administration, P.K.; funding acquisition, P.K. All authors have read and agreed to the published version of the manuscript.
Funding
This research was funded by the German Research Foundation (DFG) as part of the research training group GRK 1564 ‘Imaging New Modalities’. This work was also supported and financed by the Safety and Security Research Institute as well as the Graduate Institute of the Bonn-Rhein-Sieg University of Applied Sciences.
Institutional Review Board Statement
Not applicable.
Informed Consent Statement
Not applicable.
Data Availability Statement
The data presented in this study are available on request from the corresponding author.
Conflicts of Interest
The authors declare no conflict of interest. The funders had no role in the design of the study; in the collection, analyses, or interpretation of data; in the writing of the manuscript; or in the decision to publish the results.
References
- Candoğan, K.; Altuntas, E.G.; İğci, N. Authentication and quality assessment of meat products by Fourier-Transform infrared (FTIR) spectroscopy. Food Eng. Rev. 2020, 13, 66–91. [Google Scholar] [CrossRef]
- Stenmarck, Å.; Jensen, C.; Quested, T.; Moates, G.; Cseh, B.; Juul, S.; Parry, A.; Politano, A.; Redlingshofer, B.; Scherhaufer, S.; et al. Estimates of European Food Waste Levels; IVL Swedish Environmental Research Institute: Stockholm, Sweden, 2016; ISBN 9789188319012. [Google Scholar]
- Buettner, T. World population prospects—A long view. Econ. Stat./Econ. Stat. 2020, 520–521, 9–27. [Google Scholar] [CrossRef]
- European Commission Internal Market, Industry, Entrepreneurship and SMEs—Food and Drink Industry. Available online: https://ec.europa.eu/growth/smes/business-friendly-environment/sme-definition_en (accessed on 11 May 2022).
- European Commission, Directorate-General for Health and Food Safety. Food Waste and Date Marking: Summary, Publications Office. 2015. Available online: https://data.europa.eu/doi/10.2875/25093 (accessed on 28 September 2020).
- World Health Organisation Food Safety. Fact Sheet Number 399. Available online: http://www.who.int/mediacentre/factsheets/fs399/en/ (accessed on 28 September 2020).
- Forbes, H.; Quested, T.; O’Connor, C. Food Waste Index Report 2021; United Nations Environment Programme (2021): Nairobi, Kenya, 2021. [Google Scholar]
- Alvarez-Ordóñez, A.; Mouwen, D.J.M.J.M.; López, M.; Prieto, M. Fourier transform infrared spectroscopy as a tool to characterize molecular composition and stress response in foodborne pathogenic bacteria. J. Microbiol. Methods 2011, 84, 369–378. [Google Scholar] [CrossRef]
- Troy, D.J.; Ojha, K.S.; Kerry, J.P.; Tiwari, B.K. Sustainable and consumer-friendly emerging technologies for application within the meat industry: An overview. Meat Sci. 2016, 120, 2–9. [Google Scholar] [CrossRef] [PubMed]
- Pahlow, S.; Meisel, S.; Cialla-May, D.; Weber, K.; Rösch, P.; Popp, J. Isolation and identification of bacteria by means of Raman spectroscopy. Adv. Drug Deliv. Rev. 2015, 89, 105–120. [Google Scholar] [CrossRef] [PubMed]
- Maquelin, K.; Kirschner, C.; Choo-Smith, L.-P.; van den Braak, N.; Endtz, H.P.; Naumann, D.; Puppels, G. Identification of medically relevant microorganisms by vibrational spectroscopy. J. Microbiol. Methods 2002, 51, 255–271. [Google Scholar] [CrossRef]
- Hameed, S.; Xie, L.; Ying, Y. Conventional and emerging detection techniques for pathogenic bacteria in food science: A review. Trends Food Sci. Technol. 2018, 81, 61–73. [Google Scholar] [CrossRef]
- Ajaykumar, V.J.; Mandal, P.K. Modern concept and detection of spoilage in meat and meat products. In Meat Quality Analysis; Elsevier: Amsterdam, The Netherlands, 2020; pp. 335–349. ISBN 9780128192337. [Google Scholar]
- Hlaing, M.M.; Dunn, M.; Stoddart, P.R.; McArthur, S.L. Raman spectroscopic identification of single bacterial cells at different stages of their lifecycle. Vib. Spectrosc. 2016, 86, 81–89. [Google Scholar] [CrossRef]
- Yamamoto, T.; Taylor, J.N.; Koseki, S.; Koyama, K. Classification of food spoilage bacterial species and their sodium chloride, sodium acetate and glycine tolerance using chemometrics analysis and Raman spectroscopy. J. Microbiol. Methods 2021, 190, 106326. [Google Scholar] [CrossRef]
- Hong, J.-K.; Kim, S.B.; Lyou, E.S.; Lee, T.K. Microbial phenomics linking the phenotype to function: The potential of Raman spectroscopy. J. Microbiol. 2021, 59, 249–258. [Google Scholar] [CrossRef]
- Price, P.B.; Sowers, T. Temperature dependence of metabolic rates for microbial growth, maintenance, and survival. Proc. Natl. Acad. Sci. USA 2004, 101, 4631–4636. [Google Scholar] [CrossRef] [PubMed] [Green Version]
- Boor, K.J. Bacterial stress responses: What doesn’t kill them can make them stronger. PLoS Biol. 2006, 4, e23. [Google Scholar] [CrossRef] [PubMed]
- Kim, H.; Wu, K.; Lee, C. Stress-responsive periplasmic chaperones in bacteria. Front. Mol. Biosci. 2021, 8, 1–14. [Google Scholar] [CrossRef]
- Oliver, J.D. The viable but nonculturable state in bacteria. J. Microbiol. 2005, 43, 93–100. [Google Scholar] [PubMed]
- Lu, X.; Al-Qadiri, H.M.; Lin, M.; Rasco, B.A. Application of mid-infrared and Raman spectroscopy to the study of bacteria. Food Bioprocess Technol. 2011, 4, 919–935. [Google Scholar] [CrossRef]
- Wichmann, C.; Chhallani, M.; Bocklitz, T.; Rösch, P.; Popp, J. Simulation of transportation and storage and their influence on Raman spectra of bacteria. Anal. Chem. 2019, 91, 13688–13694. [Google Scholar] [CrossRef] [PubMed]
- Naumann, D. Infrared Spectroscopy in Microbiology. In Encyclopedia of Analytical Chemistry; John Wiley & Sons, Ltd.: Chichester, UK, 2006; pp. 1–29. ISBN 9780470027318. [Google Scholar]
- Argyri, A.A.; Jarvis, R.M.; Wedge, D.; Xu, Y.; Panagou, E.Z.; Goodacre, R.; Nychas, G.J.E.J.E. A comparison of Raman and FT-IR spectroscopy for the prediction of meat spoilage. Food Control 2013, 29, 461–470. [Google Scholar] [CrossRef]
- Münchberg, U.; Kloß, S.; Kusić, D.; Meisel, S.; Heinke, R.; Stöckel, S.; Rösch, P.; Popp, J. IR and Raman spectroscopy for pathogen detection. In Modern Techniques for Pathogen Detection; Wiley-VCH Verlag GmbH & Co. KGaA: Weinheim, Germany, 2015; pp. 253–294. ISBN 9783527687978. [Google Scholar]
- Wang, K.; Sun, D.-W. Imaging Spectroscopic Technique: Raman Chemical Imaging, 2nd ed.; Elsevier Inc.: Amsterdam, The Netherlands, 2018. [Google Scholar]
- Schulz, H. Spectroscopic Technique: Raman Spectroscopy, 2nd ed.; Elsevier Inc.: Amsterdam, The Netherlands, 2018; pp. 139–191. [Google Scholar]
- Davis, R.; Mauer, L. Fourier transform infrared (FT-IR) spectroscopy: A rapid tool for detection and analysis of foodborne pathogenic bacteria. Curr. Res. Technol. Educ. Top. Appl. Microbiol. Microb. Biotechnol. A. Méndez-Vilas 2010, 2, 1582–1594. [Google Scholar]
- Harrison, J.P.; Berry, D. Vibrational spectroscopy for imaging single microbial cells in complex biological samples. Front. Microbiol. 2017, 8, 675. [Google Scholar] [CrossRef] [Green Version]
- Larkin, P. Infrared and Raman Spectroscopy; Elsevier Inc.: Amsterdam, The Nederlands, 2011; ISBN 9780123869845. [Google Scholar]
- Helm, D.; Labischinski, H.; Naumann, D. Elaboration of a procedure for identification of bacteria using Fourier-Transform IR spectral libraries: A stepwise correlation approach. J. Microbiol. Methods 1991, 14, 127–142. [Google Scholar] [CrossRef]
- Florence, J.M.; Allshouse, C.C.; Glaze, F.W.; Hahner, C.H. Absorption of near-infrared energy by certain glasses. J. Res. Natl. Bur. Stand. 1950, 45, 121. [Google Scholar] [CrossRef]
- Jarvis, R.M.; Goodacre, R. Discrimination of Bacteria Using Surface-Enhanced Raman Spectroscopy. Anal. Chem. 2004, 76, 40–47. [Google Scholar] [CrossRef]
- Skoog, D.A.; Holler, F.J.; Crouch, S.R. Principles of Instrumental Analysis, 6th ed.; Thomson Higher Education: Belmont, CA, USA, 2007; ISBN 9788578110796. [Google Scholar]
- Naumann, D.; Keller, S.; Helm, D.; Schultz, C.; Schrader, B. FT-IR spectroscopy and FT-Raman spectroscopy are powerful analytical tools for the non-invasive characterization of intact microbial cells. J. Mol. Struct. 1995, 347, 399–405. [Google Scholar] [CrossRef]
- Harz, M.; Rösch, P.; Peschke, K.-D.; Ronneberger, O.; Burkhardt, H.; Popp, J. Micro-Raman spectroscopic identification of bacterial cells of the genus Staphylococcus and dependence on their cultivation conditions. Analyst 2005, 130, 1543. [Google Scholar] [CrossRef] [PubMed]
- Sil, S.; Mukherjee, R.; Kumar, N.S.; Aravind, S.; Kingston, J.; Singh, U.K. Detection and classification of bacteria using Raman spectroscopy combined with multivariate analysis. Def. Life Sci. J. 2017, 2, 435. [Google Scholar] [CrossRef] [Green Version]
- Breuch, R.; Klein, D.; Siefke, E.; Hebel, M.; Herbert, U.; Wickleder, C.; Kaul, P. Differentiation of meat-related microorganisms using paper-based surface-enhanced Raman spectroscopy combined with multivariate statistical analysis. Talanta 2020, 219, 1–7. [Google Scholar] [CrossRef]
- Meisel, S.; Stöckel, S.; Rösch, P.; Popp, J. Identification of meat-associated pathogens via Raman microspectroscopy. Food Microbiol. 2014, 38, 36–43. [Google Scholar] [CrossRef]
- Klein, D.; Breuch, R.; von der Mark, S.; Wickleder, C.; Kaul, P. Detection of spoilage associated bacteria using Raman-microspectroscopy combined with multivariate statistical analysis. Talanta 2019, 196, 325–328. [Google Scholar] [CrossRef]
- Lorenz, B.; Wichmann, C.; Stöckel, S.; Rösch, P.; Popp, J. Cultivation-free Raman spectroscopic investigations of bacteria. Trends Microbiol. 2017, 25, 413–424. [Google Scholar] [CrossRef]
- Athamneh, A.I.M.; Alajlouni, R.A.; Wallace, R.S.; Seleem, M.N.; Senger, R.S. Phenotypic profiling of antibiotic response signatures in Escherichia coli using Raman spectroscopy. Antimicrob. Agents Chemother. 2014, 58, 1302–1314. [Google Scholar] [CrossRef] [Green Version]
- Walter, A.; Reinicke, M.; Bocklitz, T.; Schumacher, W.; Rösch, P.; Kothe, E.; Popp, J. Raman spectroscopic detection of physiology changes in plasmid-bearing Escherichia coli with and without antibiotic treatment. Anal. Bioanal. Chem. 2011, 400, 2763–2773. [Google Scholar] [CrossRef] [PubMed]
- Verma, T.; Annappa, H.; Singh, S.; Umapathy, S.; Nandi, D. Profiling antibiotic resistance in Escherichia coli strains displaying differential antibiotic susceptibilities using Raman spectroscopy. J. Biophotonics 2021, 14, 1–17. [Google Scholar] [CrossRef] [PubMed]
- Teng, L.; Wang, X.; Wang, X.; Gou, H.; Ren, L.; Wang, T.; Wang, Y.; Ji, Y.; Huang, W.E.; Xu, J. Label-free, rapid and quantitative phenotyping of stress response in E. coli via ramanome. Sci. Rep. 2016, 6, 34359. [Google Scholar] [CrossRef] [PubMed] [Green Version]
- García-Timermans, C.; Rubbens, P.; Kerckhof, F.-M.; Buysschaert, B.; Khalenkow, D.; Waegeman, W.; Skirtach, A.G.; Boon, N. Label-free Raman characterization of bacteria calls for standardized procedures. J. Microbiol. Methods 2018, 151, 69–75. [Google Scholar] [CrossRef] [PubMed]
- Wichmann, C.; Bocklitz, T.; Rösch, P.; Popp, J. Bacterial phenotype dependency from CO2 measured by Raman spectroscopy. Spectrochim. Acta Part A Mol. Biomol. Spectrosc. 2021, 248, 119170. [Google Scholar] [CrossRef] [PubMed]
- Zu, T.N.K.; Athamneh, A.I.M.; Wallace, R.S.; Collakova, E.; Senger, R.S. Near-real-time analysis of the phenotypic responses of Escherichia coli to 1-butanol exposure using Raman spectroscopy. J. Bacteriol. 2014, 196, 3983–3991. [Google Scholar] [CrossRef] [Green Version]
- Zu, T.N.K.; Athamneh, A.I.M.; Senger, R.S. Characterizing the phenotypic responses of Escherichia coli to multiple 4-carbon alcohols with raman spectroscopy. Fermentation 2016, 2, 3. [Google Scholar] [CrossRef]
- Mukherjee, R.; Verma, T.; Nandi, D.; Umapathy, S. Understanding the effects of culture conditions in bacterial growth: A biochemical perspective using Raman microscopy. J. Biophotonics 2020, 13, 1–11. [Google Scholar] [CrossRef]
- Němcová, A.; Gonová, D.; Samek, O.; Sipiczki, M.; Breierová, E.; Márová, I. The use of Raman spectroscopy to monitor metabolic changes in stressed Metschnikowia sp. yeasts. Microorganisms 2021, 9, 277. [Google Scholar] [CrossRef]
- Li, R.; Dhankhar, D.; Chen, J.; Krishnamoorthi, A.; Cesario, T.C.; Rentzepis, P.M. Identification of live and dead bacteria: A Raman spectroscopic study. IEEE Access 2019, 7, 23549–23559. [Google Scholar] [CrossRef]
- Ryu, Y.; Hong, M.; Kim, S.B.; Lee, T.K.; Park, W. Raman spectroscopy reveals alteration of spore compositions under different nutritional conditions in Lysinibacillus boronitolerans YS11. J. Microbiol. 2021, 59, 491–499. [Google Scholar] [CrossRef] [PubMed]
- Tanniche, I.; Collakova, E.; Denbow, C.; Senger, R.S. Characterizing metabolic stress-induced phenotypes of Synechocystis PCC6803 with Raman spectroscopy. Peer J. 2020, 8, e8535. [Google Scholar] [CrossRef] [PubMed] [Green Version]
- Klein, D.; Breuch, R.; Reinmüller, J.; Engelhard, C.; Kaul, P. Rapid detection and discrimination of food-related bacteria using IR-microspectroscopy in combination with multivariate statistical analysis. Talanta 2021, 232, 122424. [Google Scholar] [CrossRef] [PubMed]
- Yang, F.; Doksum, K.; Tsui, K.W. Principal Component Analysis (PCA) for high dimensional data. PCA is dead. Long live PCA. Perspect. Big Data Anal. Methodol. Appl. 2014, 622, 1–10. [Google Scholar]
- Fisher, R.A. The use of multiple measurements in taxonomic problems. Ann. Eugen. 1936, 7, 179–188. [Google Scholar] [CrossRef]
- Backhaus, K.; Erichson, B.; Plinke, W.; Weiber, R. Multivariate Analysemethoden. In Multivariate Analysemethoden; Springer: Berlin/Heidelberg, Germany, 2011; pp. 188–247. ISBN 978-3-642-16490-3. [Google Scholar]
- Escoriza, M.F.; Van Briesen, J.M.; Stewart, S.; Maier, J. Raman spectroscopic discrimination of cell response to chemical and physical inactivation. Appl. Spectrosc. 2007, 61, 812–823. [Google Scholar] [CrossRef]
- Mosier-Boss, P. Review on SERS of bacteria. Biosensors 2017, 7, 51. [Google Scholar] [CrossRef] [Green Version]
- Withnall, R.; Chowdhry, B.Z.; Silver, J.; Edwards, H.G.M.; De Oliveira, L.F.C. Raman spectra of carotenoids in natural products. Spectrochim. Acta-Part A Mol. Biomol. Spectrosc. 2003, 59, 2207–2212. [Google Scholar] [CrossRef]
- Netzer, R.; Stafsnes, M.H.; Andreassen, T.; Goksøyr, A.; Bruheim, P.; Brautaset, T. Biosynthetic pathway for γ-cyclic sarcinaxanthin in Micrococcus luteus: Heterologous expression and evidence for diverse and multiple catalytic functions of C 50 carotenoid cyclases. J. Bacteriol. 2010, 192, 5688–5699. [Google Scholar] [CrossRef] [Green Version]
- Schuster, K.C.; Reese, I.; Urlaub, E.; Gapes, J.R.; Lendl, B. Multidimensional information on the chemical composition of single bacterial cells by confocal Raman microspectroscopy. Anal. Chem. 2000, 72, 5529–5534. [Google Scholar] [CrossRef]
- Malyshev, D.; Öberg, R.; Dahlberg, T.; Wiklund, K.; Landström, L.; Andersson, P.O.; Andersson, M. Laser induced degradation of bacterial spores during micro-Raman spectroscopy. Spectrochim. Acta-Part A Mol. Biomol. Spectrosc. 2022, 265, 120381. [Google Scholar] [CrossRef] [PubMed]
- Kong, L.; Zhang, P.; Wang, G.; Yu, J.; Setlow, P.; Li, Y.Q. Characterization of bacterial spore germination using phase-contrast and fluorescence microscopy, Raman spectroscopy and optical tweezers. Nat. Protoc. 2011, 6, 625–639. [Google Scholar] [CrossRef] [PubMed]
- Zhang, P.; Setlow, P.; Li, Y. Characterization of single heat-activated Bacillus spores using laser tweezers Raman spectroscopy. Opt. Express 2009, 17, 16480. [Google Scholar] [CrossRef] [PubMed]
- Kong, L.; Setlow, P.; Li, Y. Analysis of the Raman spectra of Ca2+-dipicolinic acid alone and in the bacterial spore core in both aqueous and dehydrated environments. Analyst 2012, 137, 3683. [Google Scholar] [CrossRef]
- Maquelin, K.; Choo-Smith, L.-P.; van Vreeswijk, T.; Endtz, H.P.; Smith, B.; Bennett, R.; Bruining, H.A.; Puppels, G.J. Raman spectroscopic method for identification of clinically relevant microorganisms growing on solid culture medium. Anal. Chem. 2000, 72, 12–19. [Google Scholar] [CrossRef]
- De Gelder, J.; De Gussem, K.; Vandenabeele, P.; Moens, L. Reference database of Raman spectra of biological molecules. J. Raman Spectrosc. 2007, 38, 1133–1147. [Google Scholar] [CrossRef]
- Fan, C.; Hu, Z.; Mustapha, A.; Lin, M. Rapid detection of food- and waterborne bacteria using surface-enhanced Raman spectroscopy coupled with silver nanosubstrates. Appl. Microbiol. Biotechnol. 2011, 92, 1053–1061. [Google Scholar] [CrossRef]
- Ryabchykov, O.; Guo, S.; Bocklitz, T. Analyzing Raman spectroscopic data. Phys. Sci. Rev. 2019, 4, 1–10. [Google Scholar] [CrossRef]
- Butler, H.J.; Ashton, L.; Bird, B.; Cinque, G.; Curtis, K.; Dorney, J.; Esmonde-White, K.; Fullwood, N.J.; Gardner, B.; Martin-Hirsch, P.L.; et al. Using Raman spectroscopy to characterize biological materials. Nat. Protoc. 2016, 11, 664–687. [Google Scholar] [CrossRef] [Green Version]
- Hlaing, M.M.; Wood, B.R.; McNaughton, D.; Rood, J.I.; Fox, E.M.; Augustin, M.A. Vibrational spectroscopy combined with transcriptomic analysis for investigation of bacterial responses towards acid stress. Appl. Microbiol. Biotechnol. 2018, 102, 333–343. [Google Scholar] [CrossRef]
- Strola, S.A.; Baritaux, J.-C.; Schultz, E.; Simon, A.C.; Allier, C.; Espagnon, I.; Jary, D.; Dinten, J.-M. Single bacteria identification by Raman spectroscopy. J. Biomed. Opt. 2014, 19, 111610. [Google Scholar] [CrossRef] [PubMed]
Figure 1.
The data splitting, reduction and classification are depicted in this diagram. The corresponding information about the measured microorganisms, stress conditions, and storage times can be found in the training and test data set.
Figure 1.
The data splitting, reduction and classification are depicted in this diagram. The corresponding information about the measured microorganisms, stress conditions, and storage times can be found in the training and test data set.

Figure 2.
Stacked mean Raman spectra of the normalized data of a total of 5,450 spectra subdivided into seven stress conditions and regular treatment of B. sub (A), B. therm (B), B. tii (C), E. coli K12 (D), E. coli HB101 (E), M. luteus (F), Ps. fluor 4358 (G), Ps. fluor 50090 (H) and E. coli TOP10 (I). Pale colored bands around the mean value represent the standard deviations.

Figure 3.
Scatter plots of canonical variable 1 vs. 2 of the QDA of all training data (solid squares) and the independent test data (unfilled squares) of all microorganisms and sampling or lifetime conditions (a) and of the group centroids of the training data (b).
Figure 3.
Scatter plots of canonical variable 1 vs. 2 of the QDA of all training data (solid squares) and the independent test data (unfilled squares) of all microorganisms and sampling or lifetime conditions (a) and of the group centroids of the training data (b).

Figure 4.
Scatter matrix plots of canonical variable 1–4 (a) and canonical variable 5–8 (b) of the QDA of the group centroids of the training data of all nine microorganisms and their eight sampling and lifetime conditions.
Figure 4.
Scatter matrix plots of canonical variable 1–4 (a) and canonical variable 5–8 (b) of the QDA of the group centroids of the training data of all nine microorganisms and their eight sampling and lifetime conditions.


Table 1.
Confusion matrix for the independent test data set: Rows represent the observed groups and columns represent the expected groups. The values in the table’s diagonal correspond to the correct grouping of observations.
Table 1.
Confusion matrix for the independent test data set: Rows represent the observed groups and columns represent the expected groups. The values in the table’s diagonal correspond to the correct grouping of observations.
| Predicted Class | |||||||||
|---|---|---|---|---|---|---|---|---|---|
| Class | B. sub | B. therm | B. tii | E. coli. HB101 | E. coli K12 | M. luteus | Ps. fluor 4358 | Ps. fluor 50090 | E. coli TOP10 |
| B. sub | 199 | 0 | 1 | 0 | 0 | 0 | 0 | 0 | 0 |
| B. therm | 0 | 204 | 1 | 0 | 0 | 0 | 0 | 0 | 0 |
| B. tii | 0 | 0 | 199 | 0 | 0 | 0 | 0 | 0 | 1 |
| E. coli HB101 | 0 | 0 | 0 | 138 | 62 | 0 | 0 | 0 | 5 |
| E. coli K12 | 0 | 0 | 0 | 24 | 139 | 0 | 0 | 0 | 42 |
| M. luteus | 0 | 0 | 0 | 0 | 0 | 210 | 0 | 0 | 0 |
| Ps. fluor 4358 | 0 | 0 | 0 | 7 | 0 | 0 | 197 | 6 | 0 |
| Ps. fluor 50090 | 0 | 0 | 0 | 0 | 0 | 0 | 29 | 181 | 0 |
| E. coli TOP10 | 0 | 0 | 0 | 3 | 51 | 0 | 0 | 0 | 151 |
Table 2.
Examination of the classification mistakes in the independent test data set at the sub-dataset level. The figures represent the overall number of misclassified spectra in the relevant sub-dataset.
Table 2.
Examination of the classification mistakes in the independent test data set at the sub-dataset level. The figures represent the overall number of misclassified spectra in the relevant sub-dataset.
| Error Distribution | B. tii | E. coli HB101 | E. coli K12 | Ps. fluor 4358 | Ps. fluor 50090 | E. coli TOP10 |
|---|---|---|---|---|---|---|
| B. sub—cold sampling | 1 | |||||
| B. therm—25 °C | 1 | |||||
| B. tii—heat dried | 1 | |||||
| E. coli HB101—desiccator | 4 | |||||
| E. coli HB101—cold sampling | 1 | 3 | ||||
| E. coli HB101—HCl | 22 | 1 | ||||
| E. coli HB101—heat dried | 1 | |||||
| E. coli HB101—2-propanol | 10 | 1 | ||||
| E. coli HB101—NaOH | 18 | |||||
| E. coli HB101—regular | 6 | |||||
| E. coli K12—desiccator | 5 | |||||
| E. coli K12—HCl | 3 | 9 | ||||
| E. coli K12—heat dried | 1 | 20 | ||||
| E. coli K12—2-propanol | 4 | 1 | ||||
| E. coli K12—NaOH | 16 | 7 | ||||
| Ps. fluor 4358—desiccator | 7 | 6 | ||||
| Ps. fluor 50090—25 °C | 3 | |||||
| Ps. fluor 50090—HCl | 22 | |||||
| Ps. fluor 50090—heat dried | 4 | |||||
| E. coli TOP10—25 °C | 2 | 15 | ||||
| E. coli TOP10—desiccator | 12 | |||||
| E. coli TOP10—heat dried | 1 | |||||
| E. coli TOP10—2-propanol | 1 | |||||
| E. coli TOP10—regular | 1 | 22 |
Publisher’s Note: MDPI stays neutral with regard to jurisdictional claims in published maps and institutional affiliations. |
© 2022 by the authors. Licensee MDPI, Basel, Switzerland. This article is an open access article distributed under the terms and conditions of the Creative Commons Attribution (CC BY) license (https://creativecommons.org/licenses/by/4.0/).
Share and Cite
MDPI and ACS Style
Klein, D.; Breuch, R.; Reinmüller, J.; Engelhard, C.; Kaul, P. Discrimination of Stressed and Non-Stressed Food-Related Bacteria Using Raman-Microspectroscopy. Foods 2022, 11, 1506. https://0-doi-org.brum.beds.ac.uk/10.3390/foods11101506
AMA Style
Klein D, Breuch R, Reinmüller J, Engelhard C, Kaul P. Discrimination of Stressed and Non-Stressed Food-Related Bacteria Using Raman-Microspectroscopy. Foods. 2022; 11(10):1506. https://0-doi-org.brum.beds.ac.uk/10.3390/foods11101506
Chicago/Turabian StyleKlein, Daniel, René Breuch, Jessica Reinmüller, Carsten Engelhard, and Peter Kaul. 2022. "Discrimination of Stressed and Non-Stressed Food-Related Bacteria Using Raman-Microspectroscopy" Foods 11, no. 10: 1506. https://0-doi-org.brum.beds.ac.uk/10.3390/foods11101506
Note that from the first issue of 2016, this journal uses article numbers instead of page numbers. See further details here.