Polyphenolic Characterization, Antioxidant, and Cytotoxic Activities of Mangifera indica Cultivars from Costa Rica

 , ,
, ,  , and
, and
Abstract
:1. Introduction
2. Materials and Methods
2.1. Materials, Reagents and Solvents
2.2. Phenolic Extracts from Mangifera. Indica Fruits
2.3. Total Phenolic Content
2.4. UPLC-DAD-ESI-TQ-MS Analysis
2.5. DPPH Radical-Scavenging Activity
2.6. ORAC Antioxidant Activity
2.7. Evaluation of Cytotoxicity of Extracts
2.7.1. Cell Culture
2.7.2. Assessment of Cytotoxicity by MTT Assay
2.8. Statistical Analysis
3. Results and Discussion
3.1. Phenolic Yield and Total Phenolic Contents
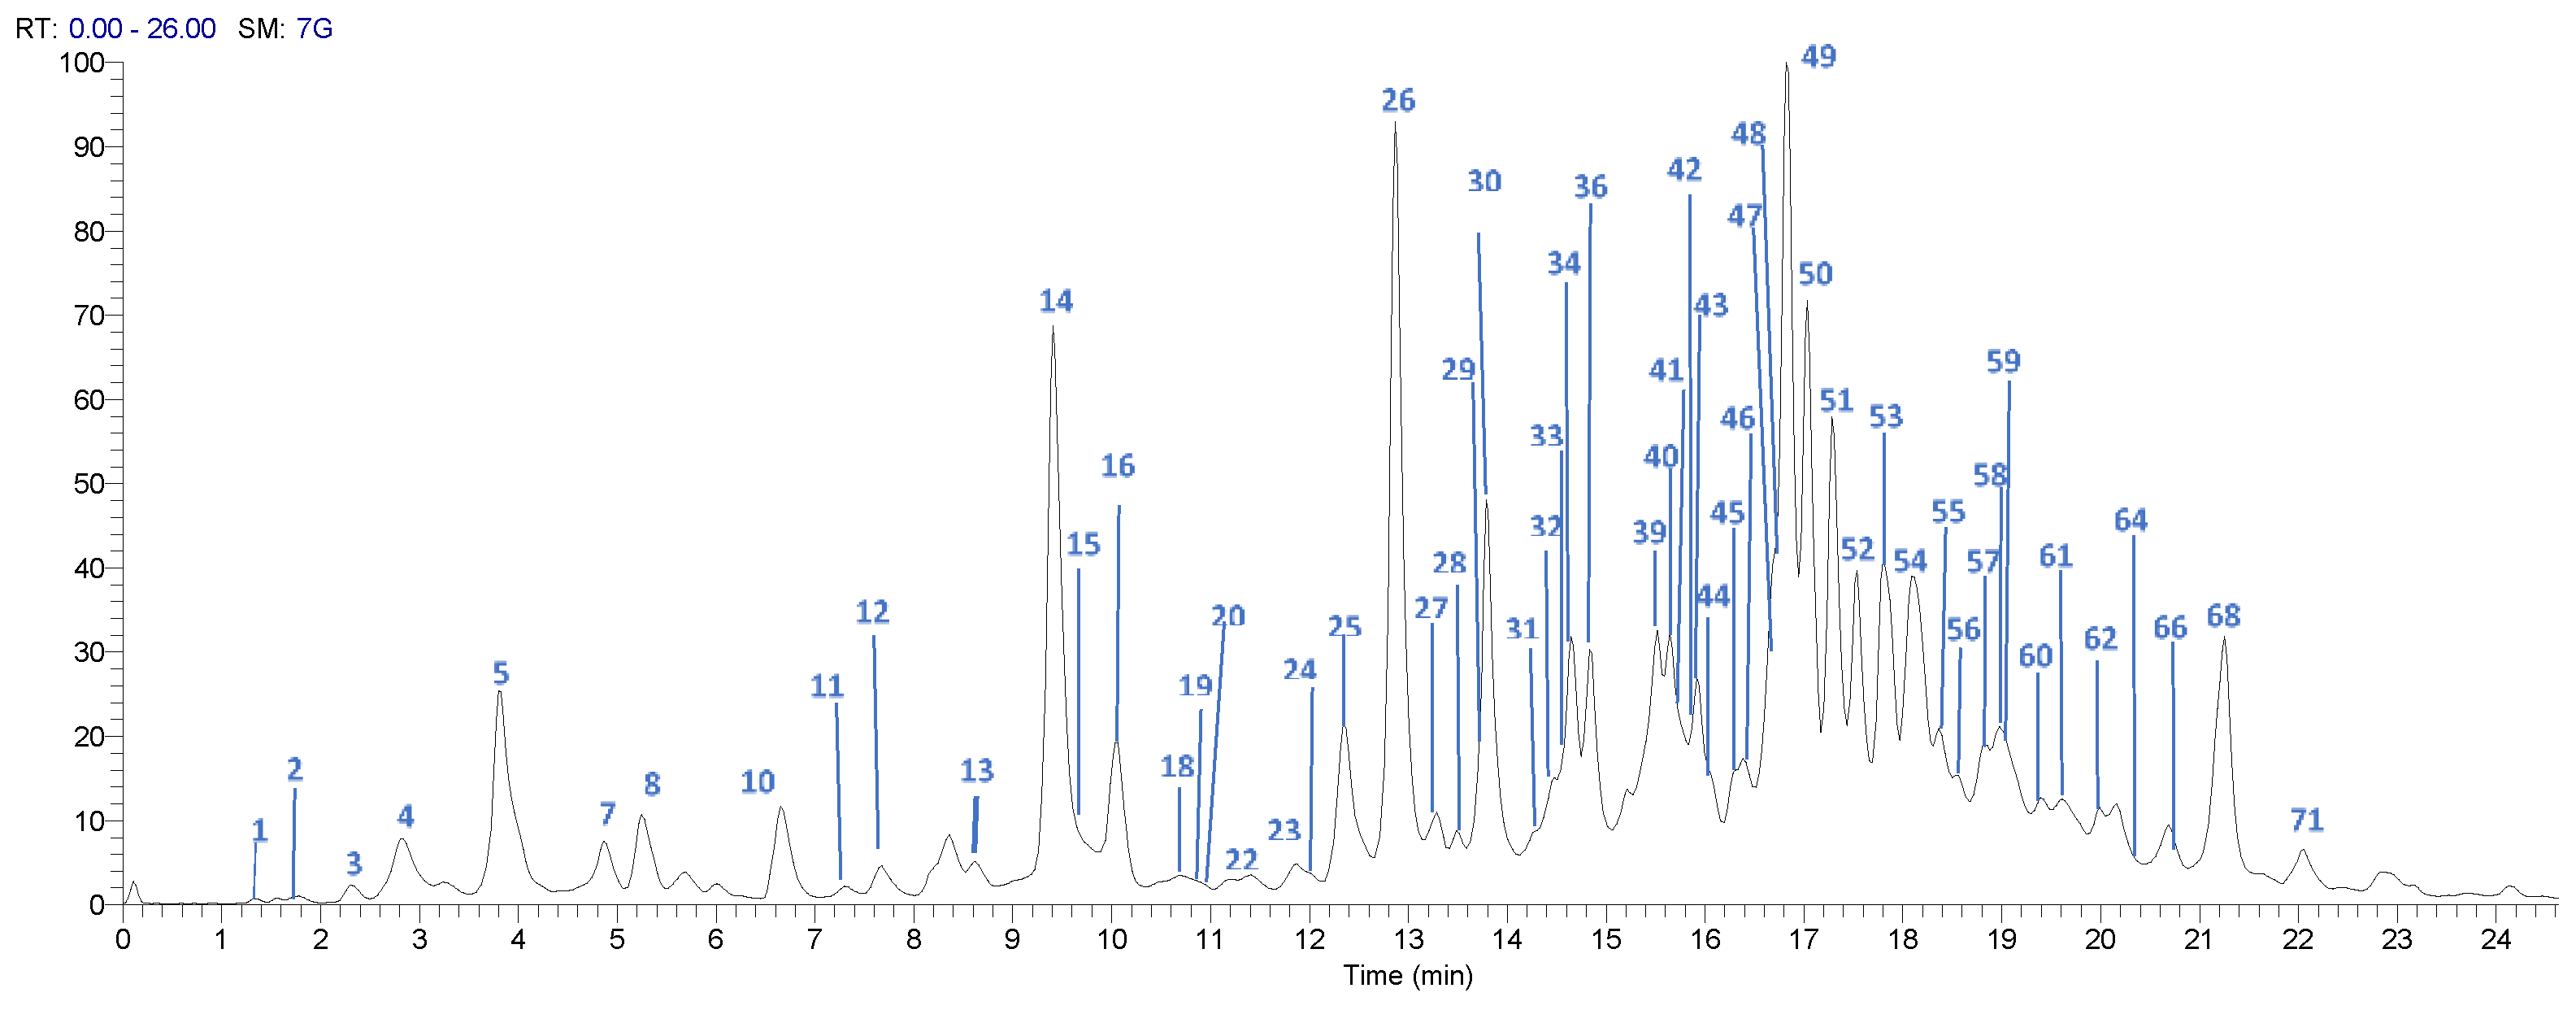
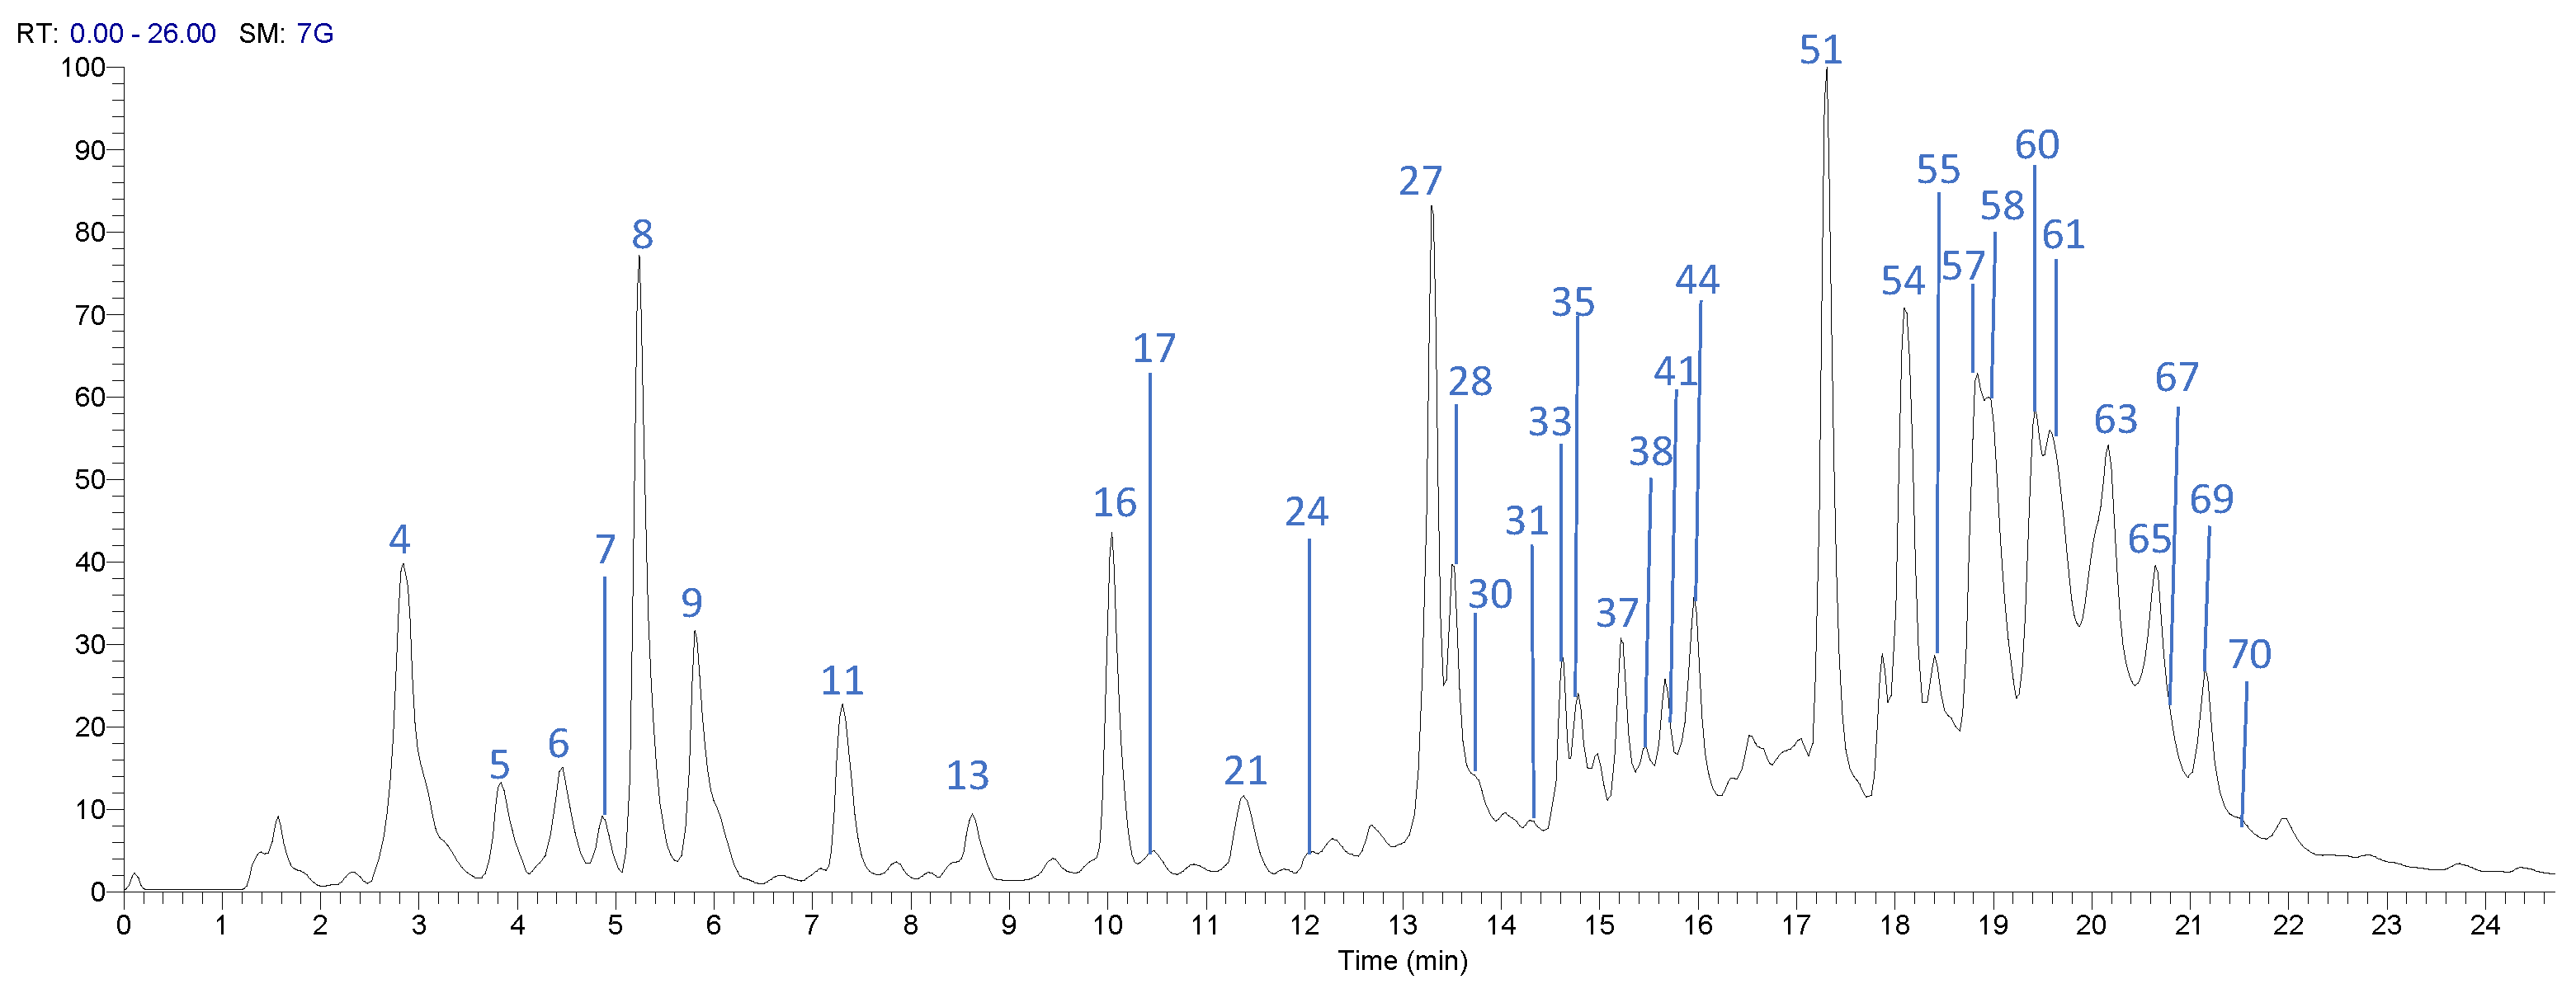
3.2. Profile by UPLC-DAD-ESI-TQ-MS Analysis
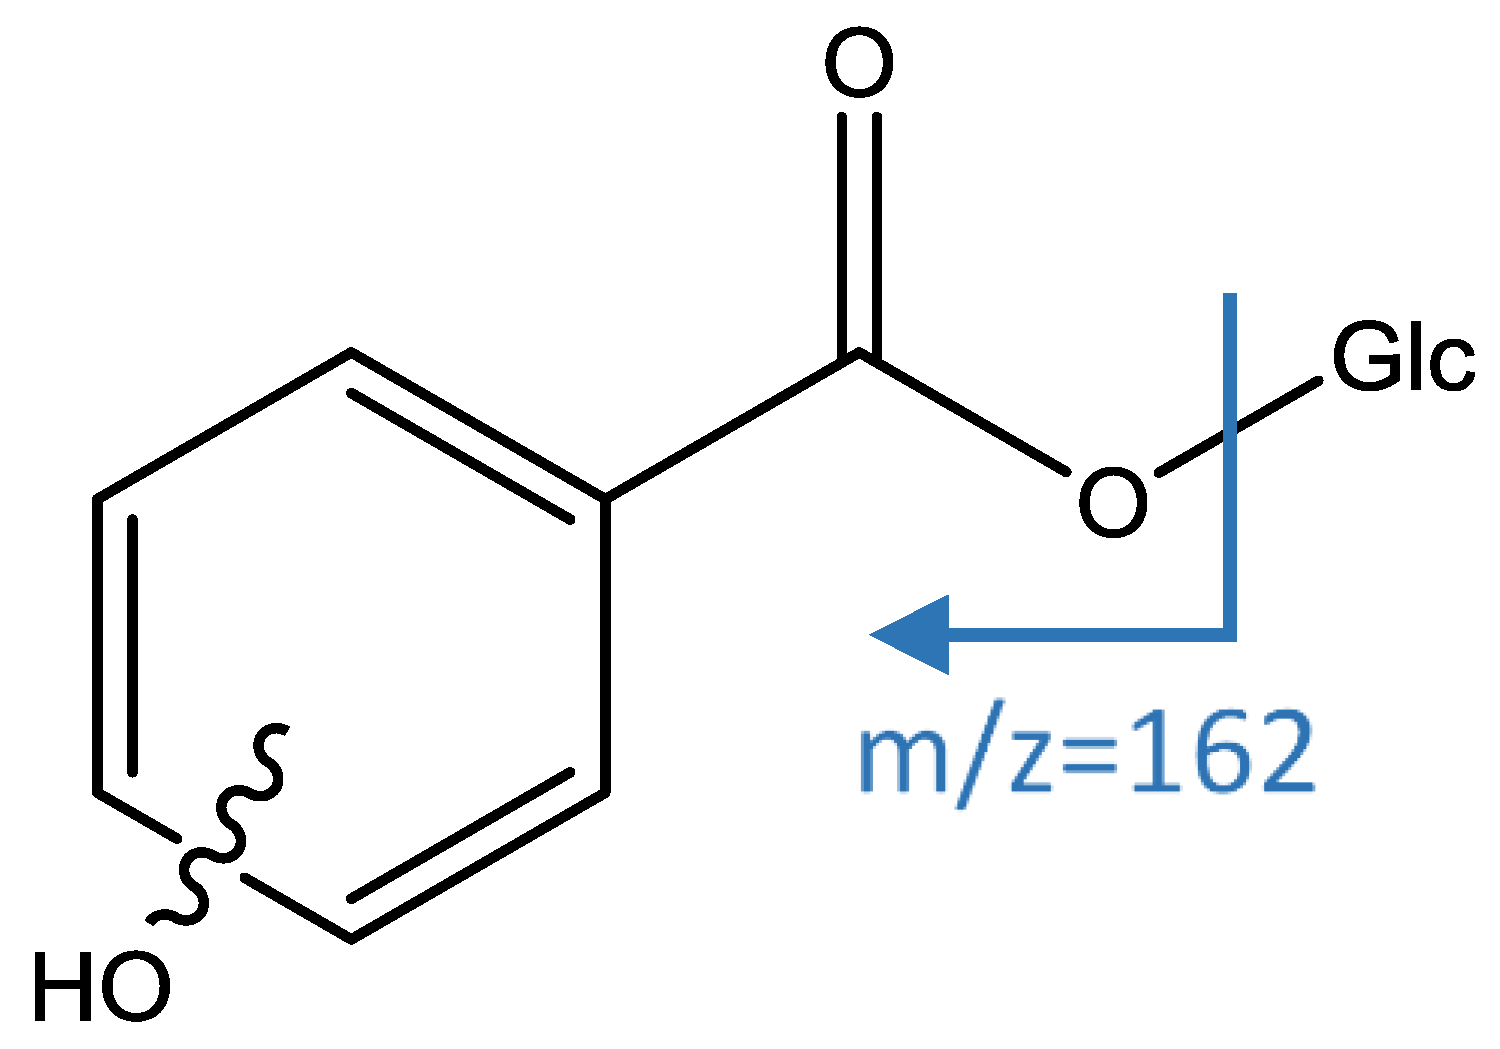
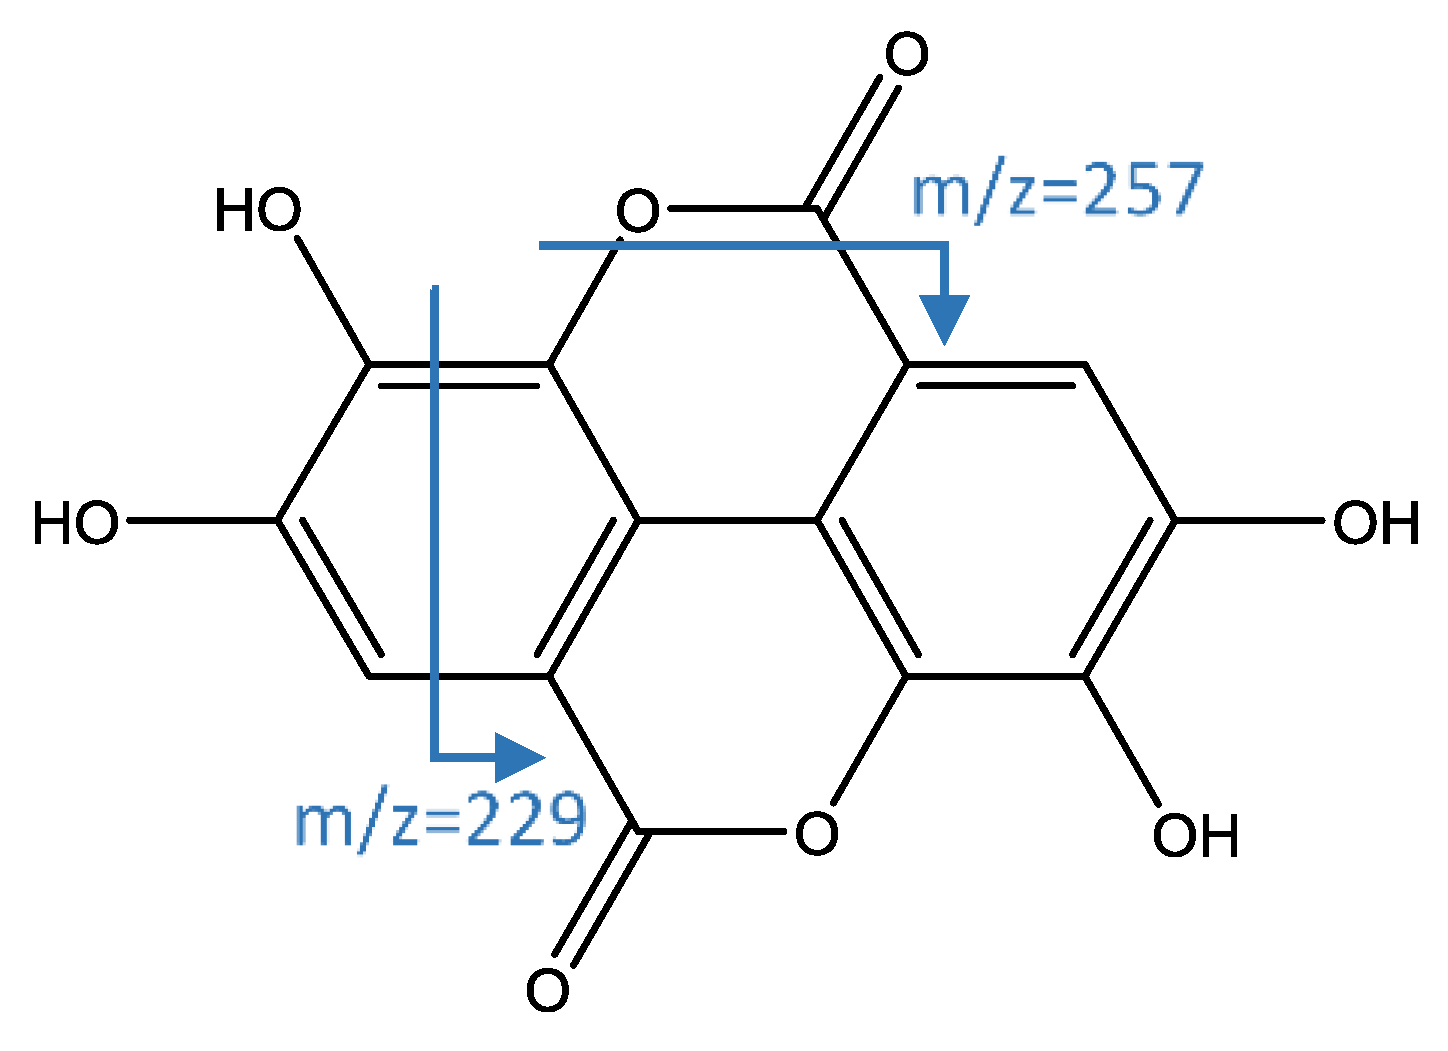
3.2.1. Benzoic and Hydroxycinnamic Acids
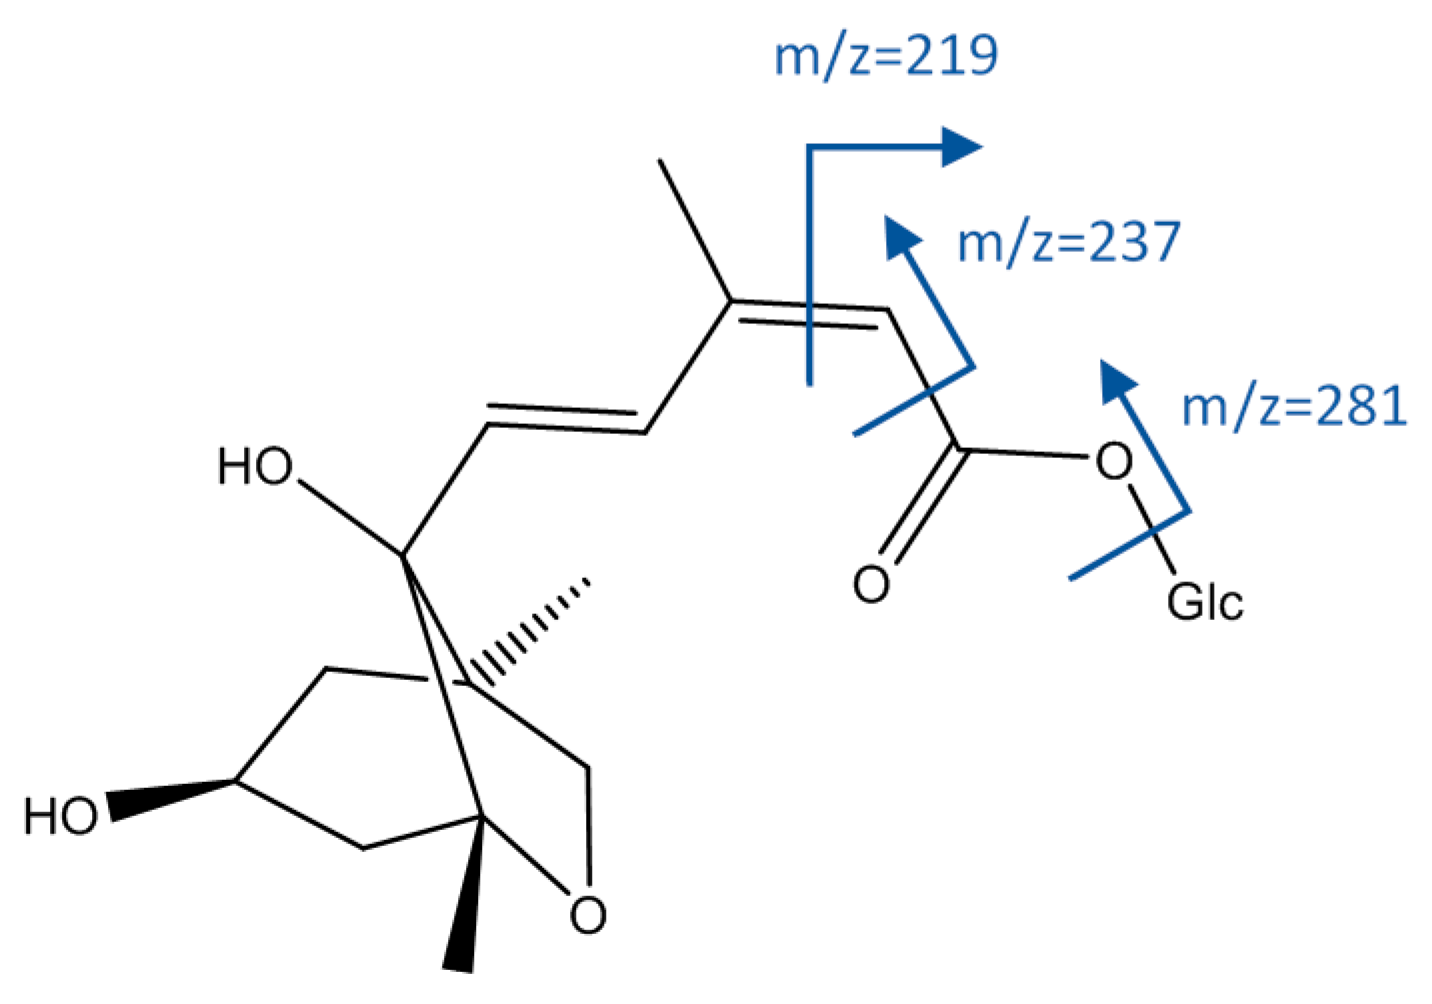
3.2.2. Other acids
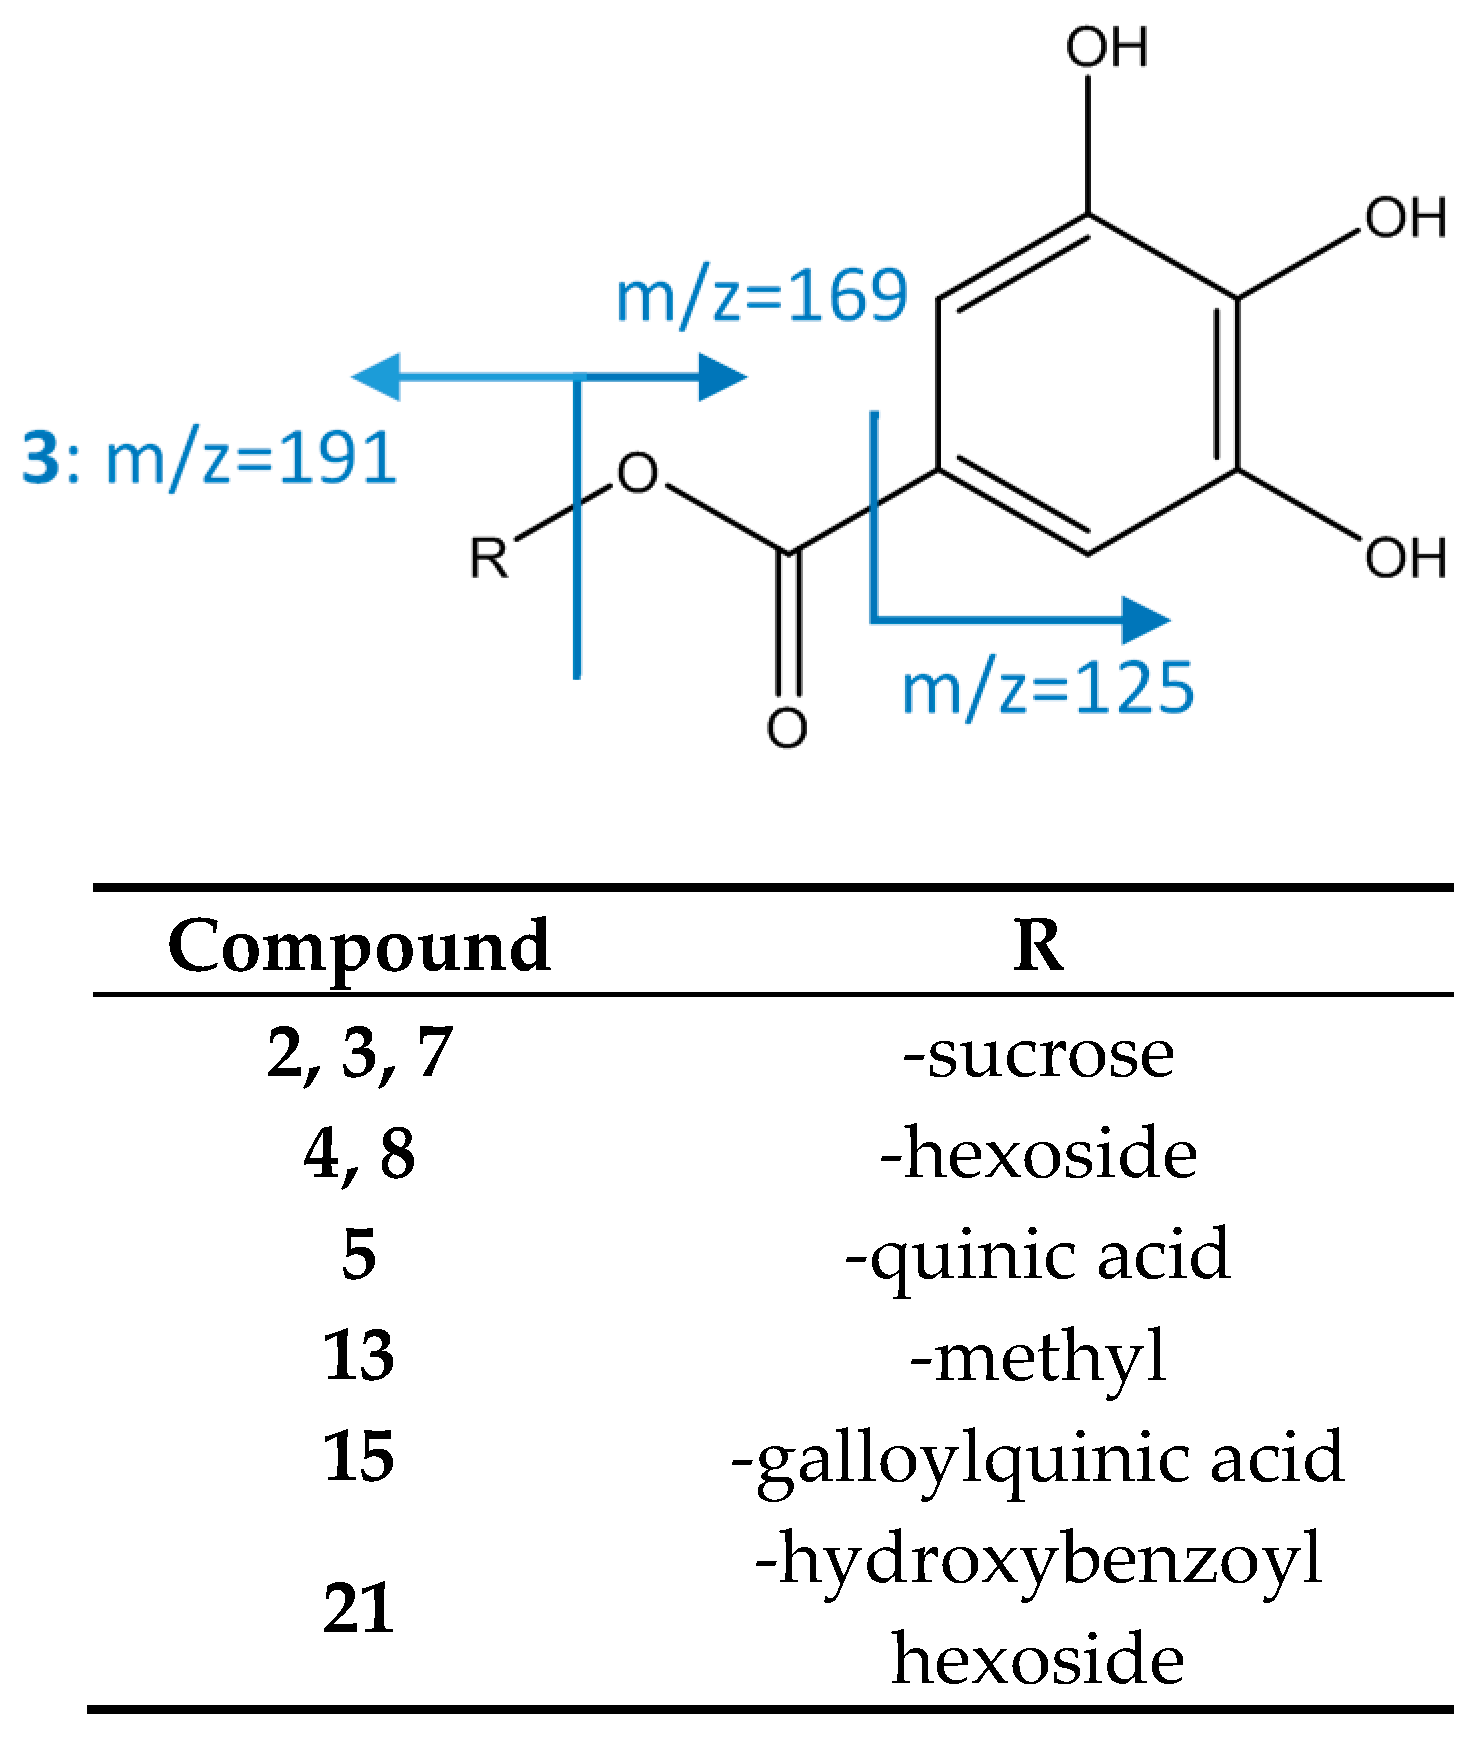
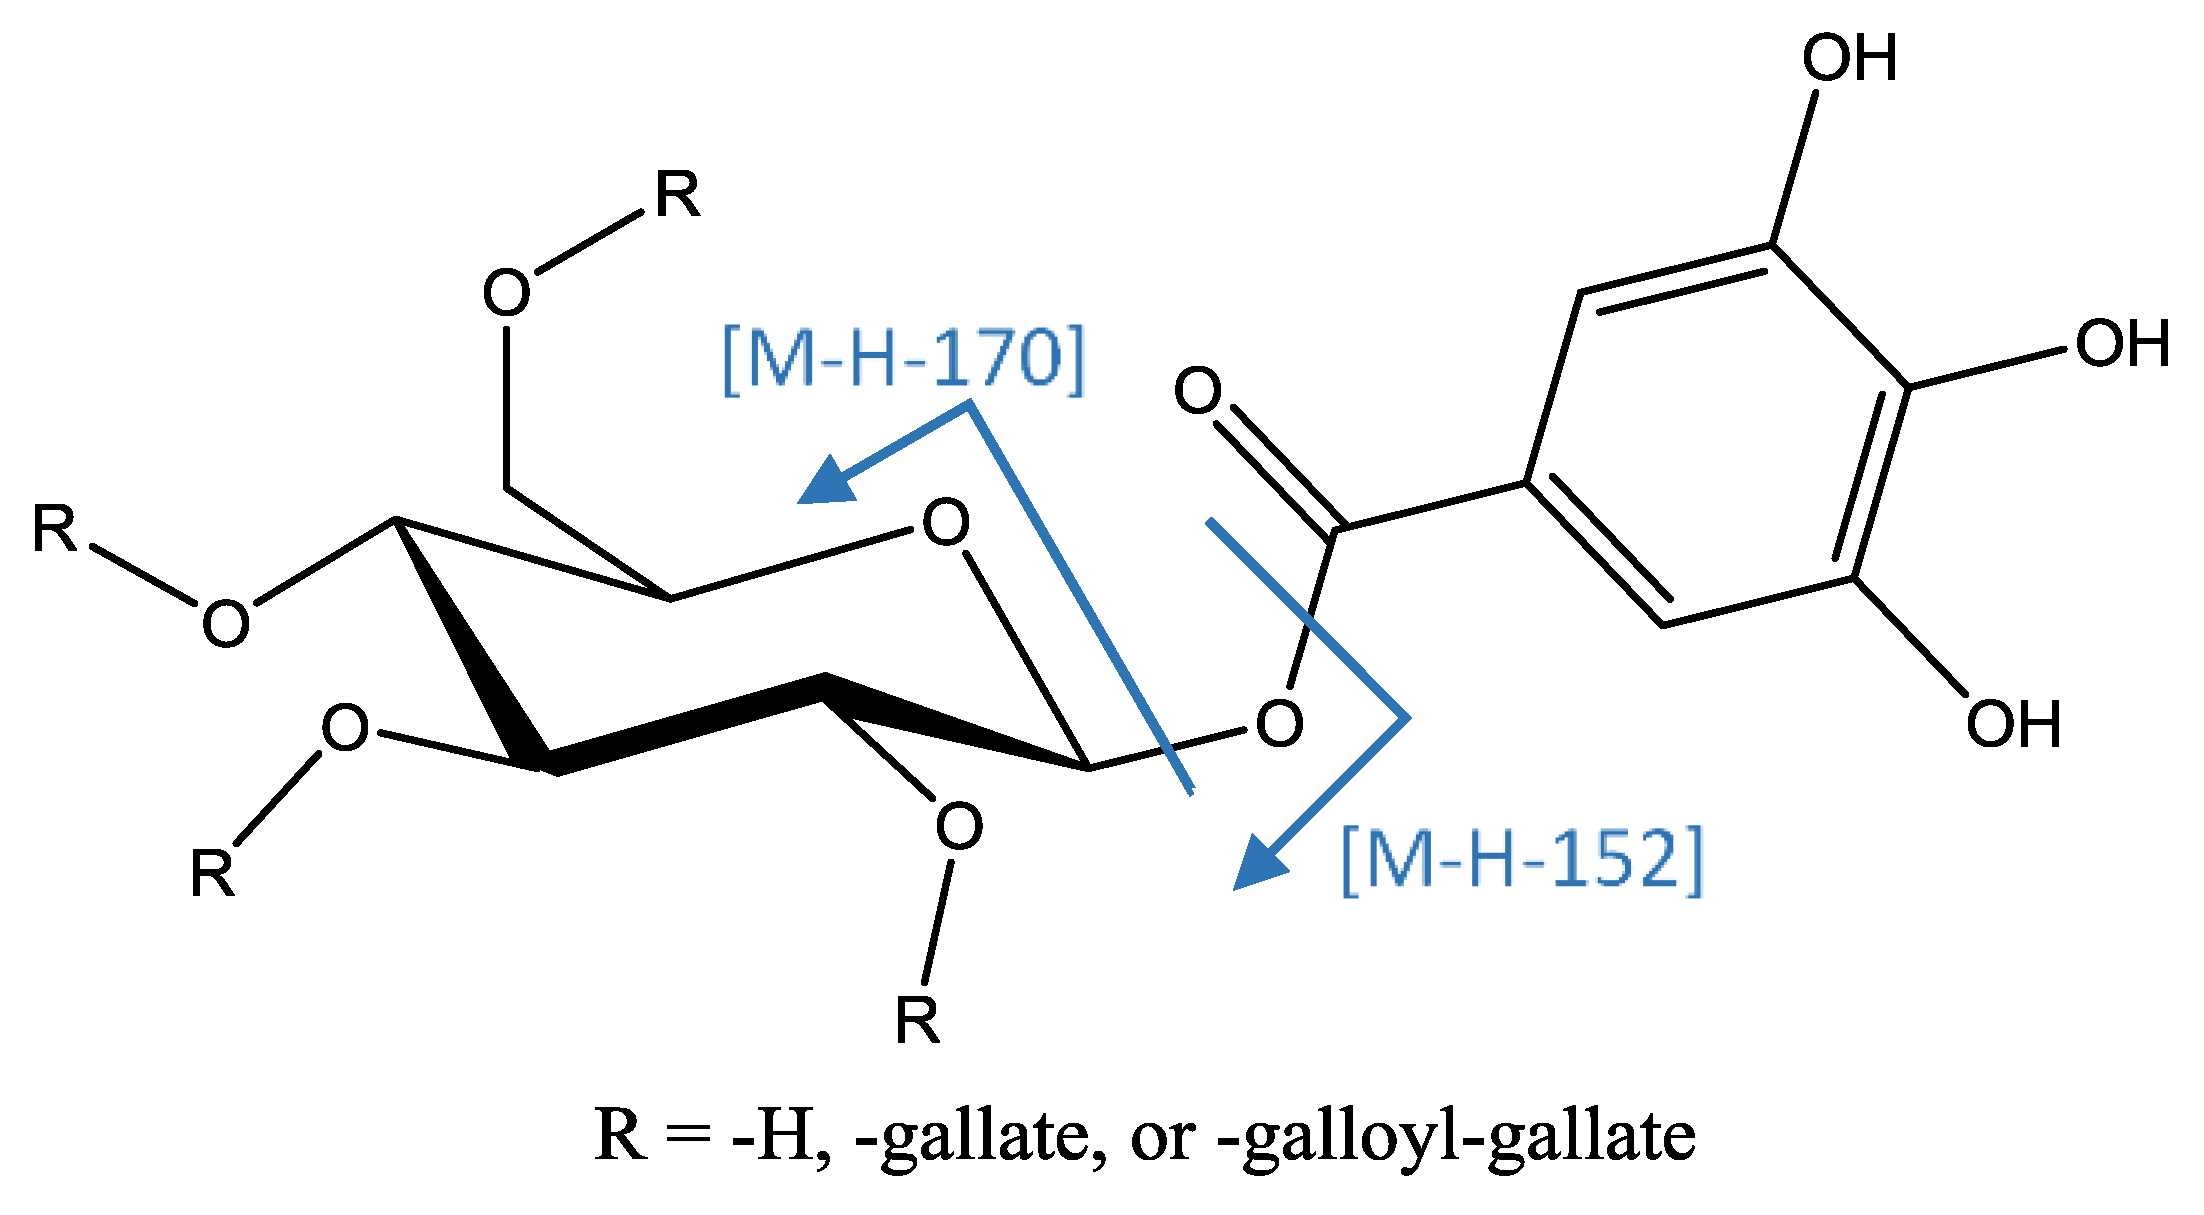
3.2.3. Gallotanins
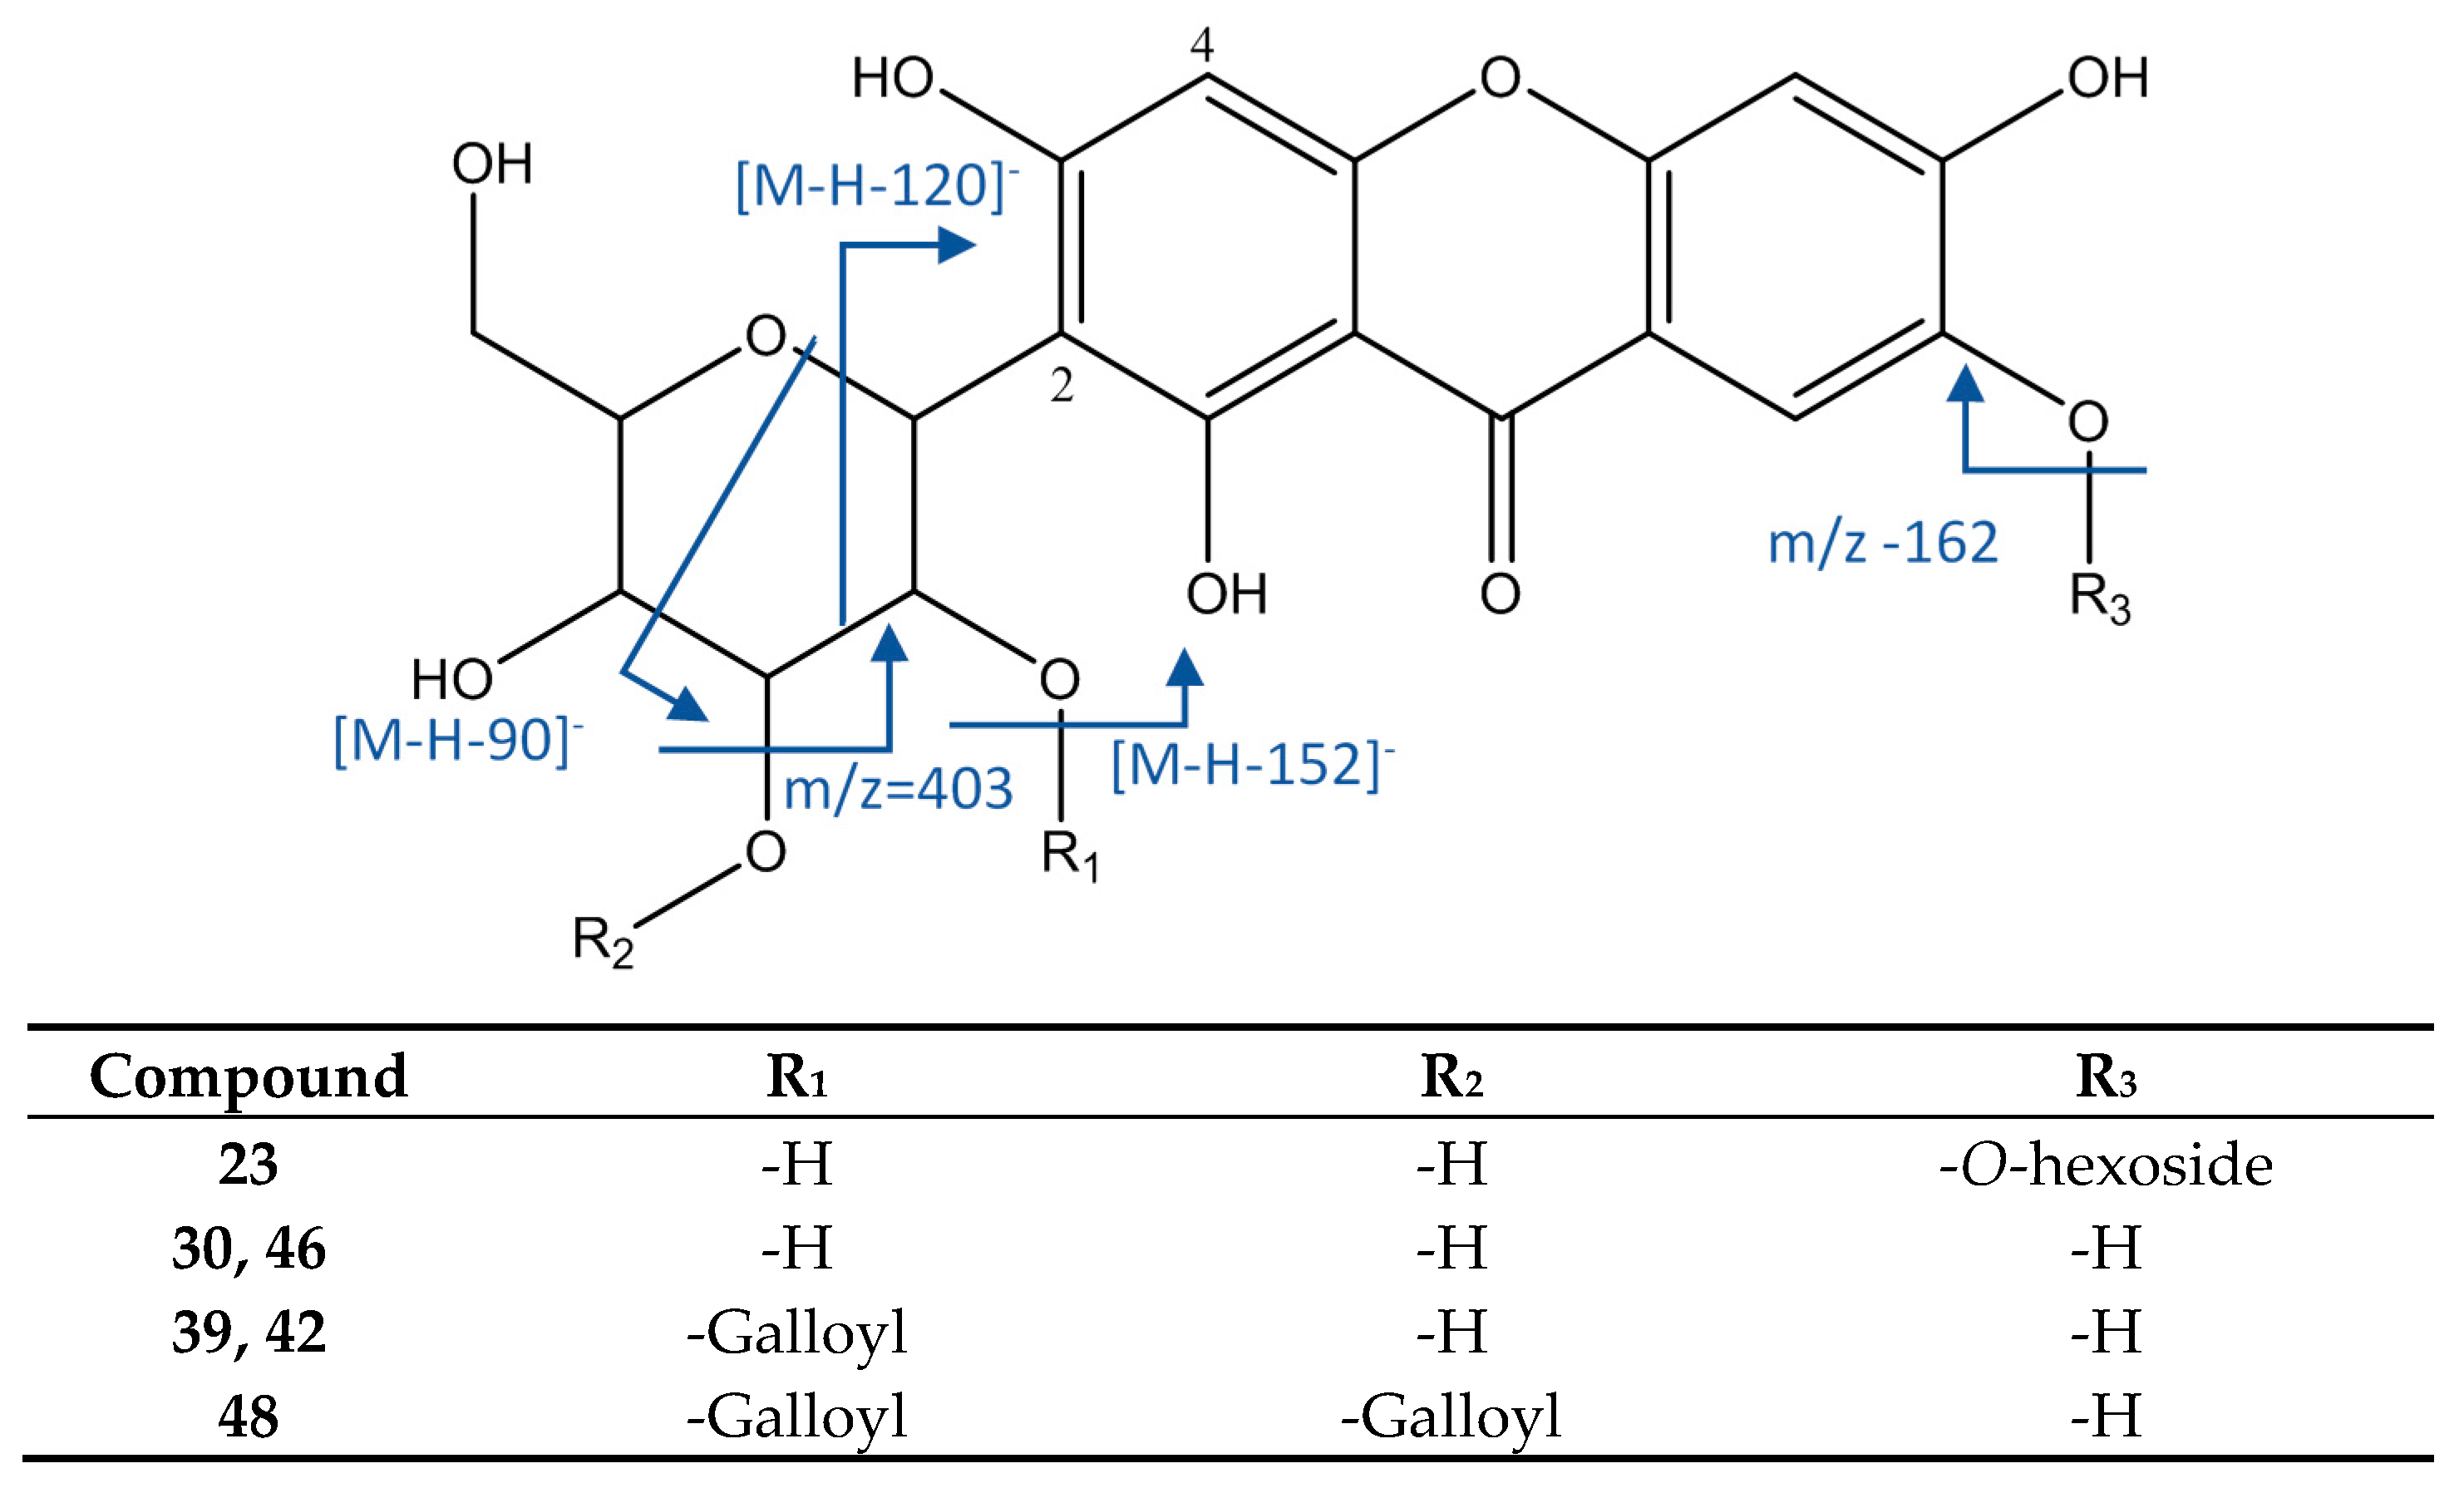
3.2.4. Hydroxybenzophenones
3.2.5. Xanthonoids
3.2.6. Flavonoids
3.3. Antioxidant Activity
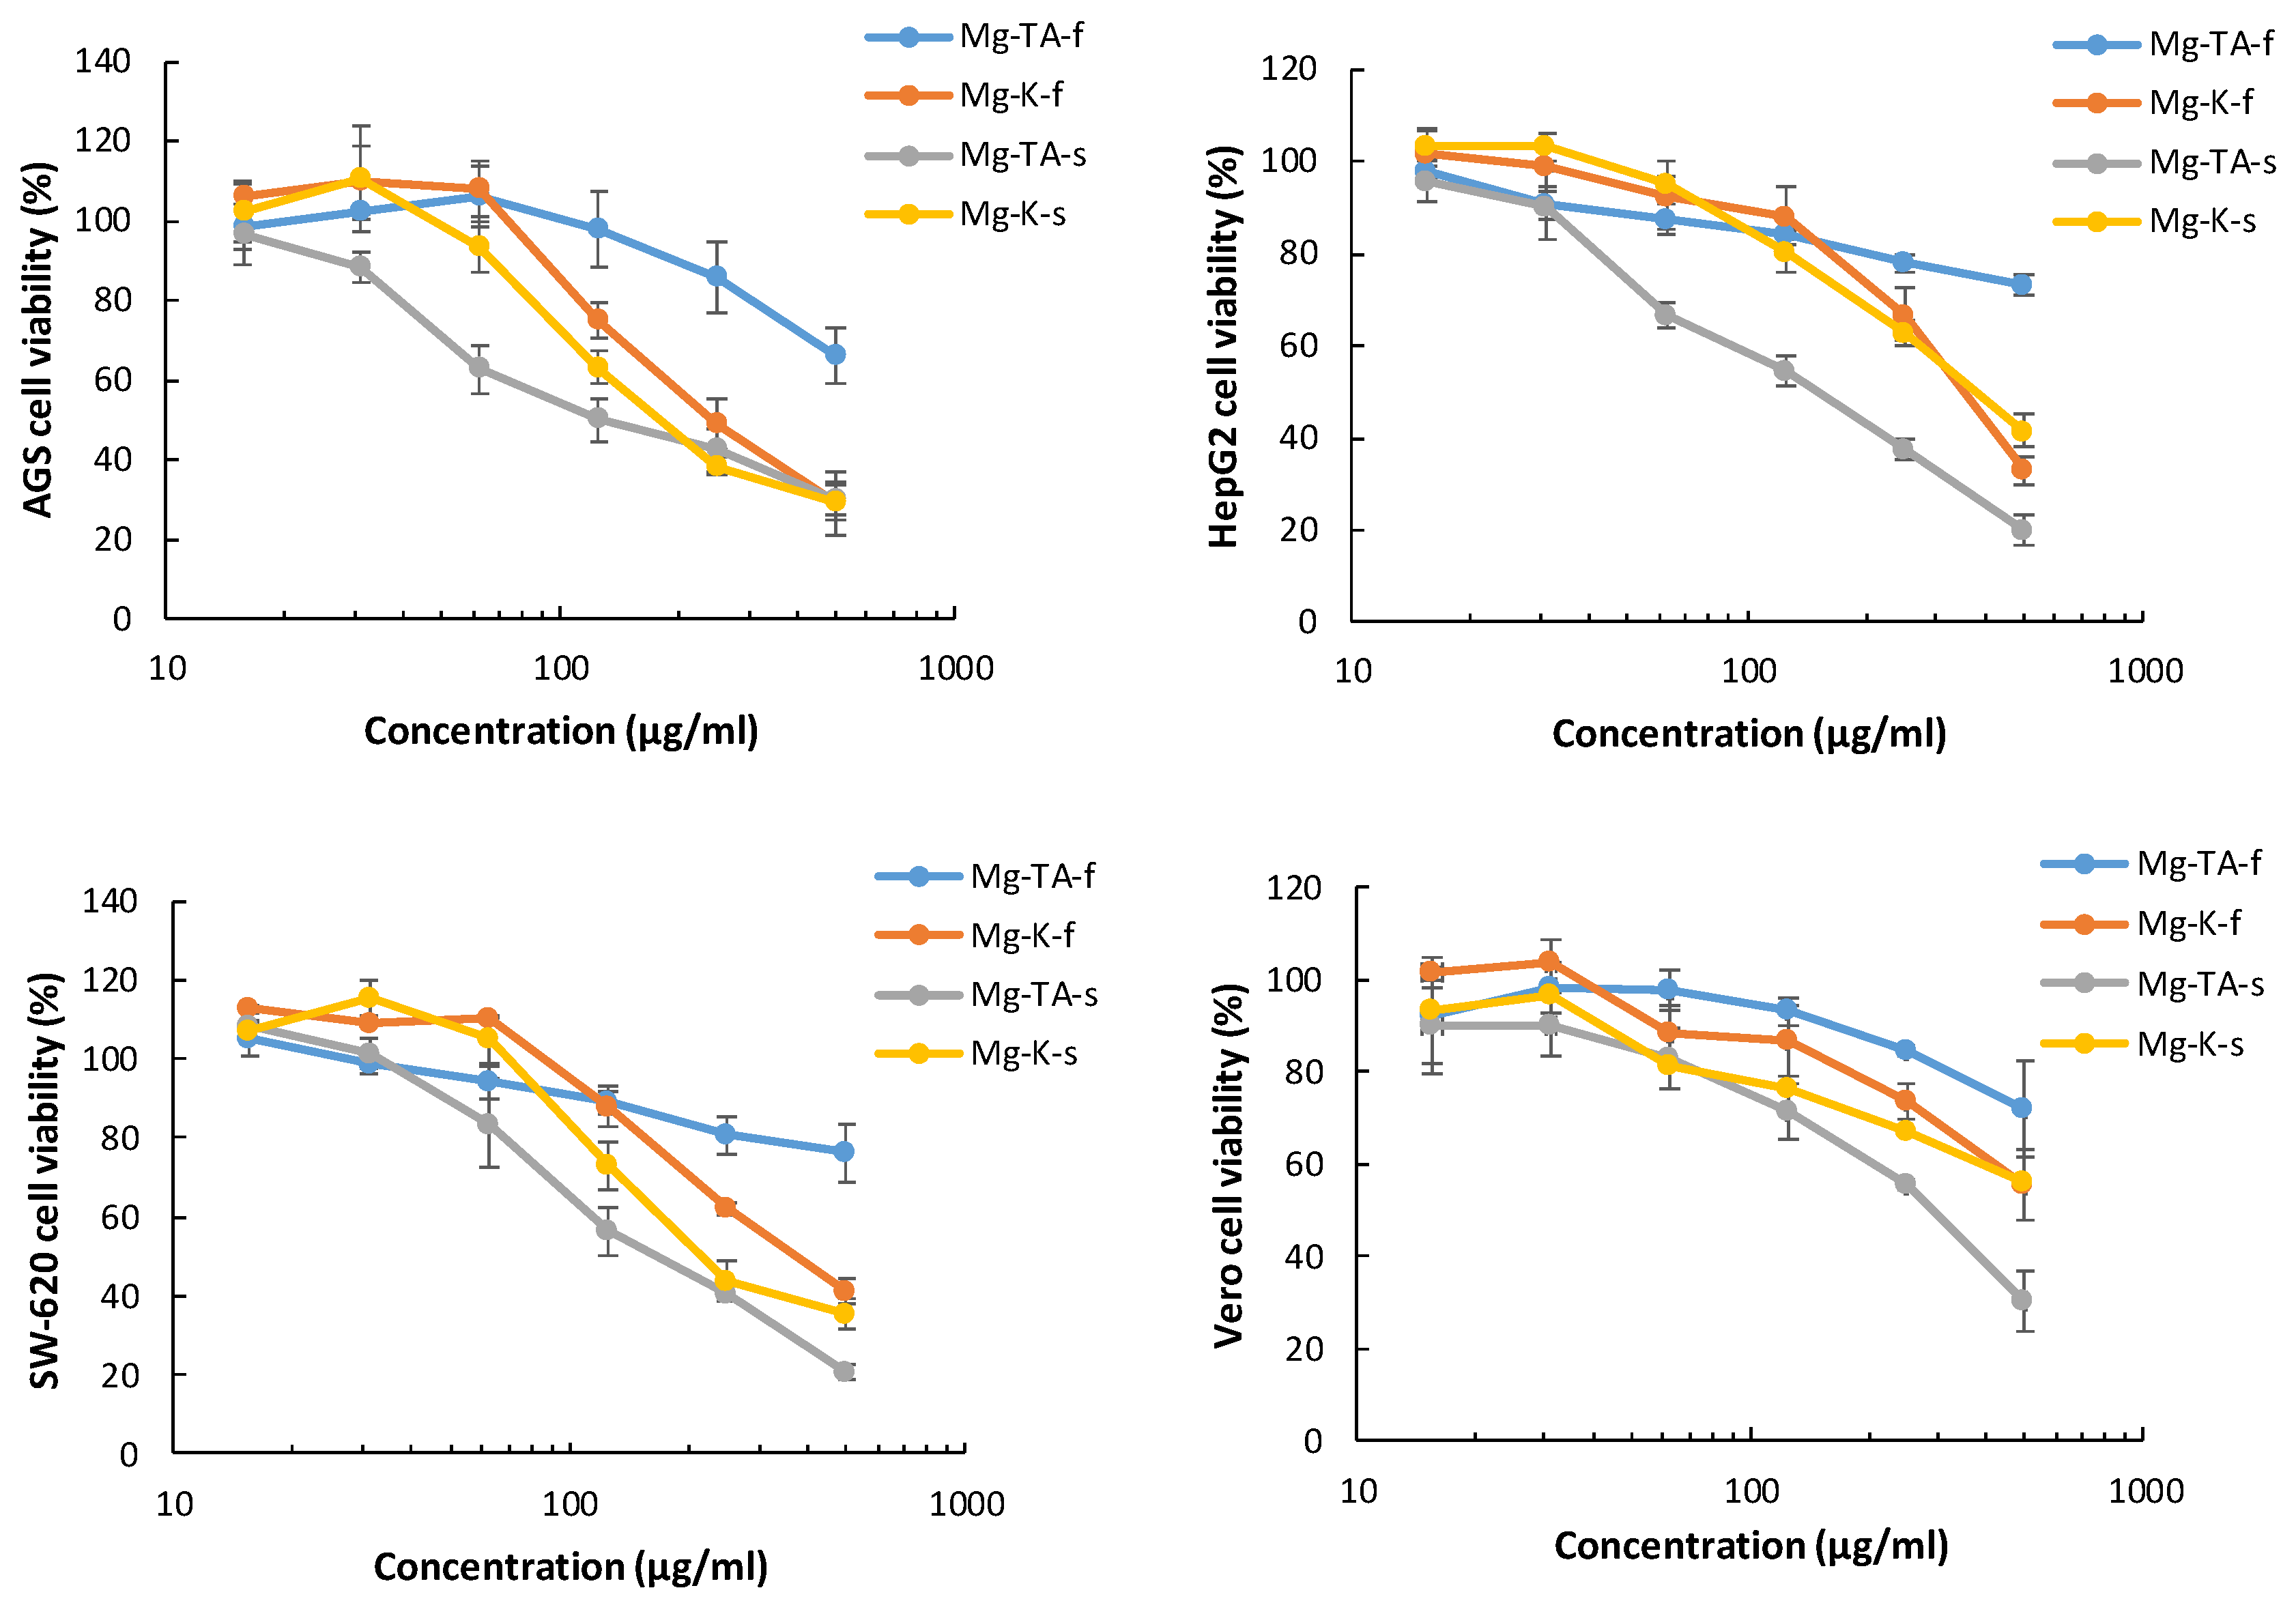
3.4. Cytotoxicity
4. Conclusions
Author Contributions
Funding
Acknowledgments
Conflicts of Interest
References
- Vithana, M.D.; Singh, Z.; Johnson, S.K. Regulation of the levels of health promoting compounds: Lupeol, mangiferin and phenolic acids in the pulp and peel of mango fruit: A review. J. Sci. Food Agric. 2019, 99, 3740–3751. [Google Scholar] [CrossRef] [PubMed]
- Vega-Vega, V.; Silva-Espinoza, B.A.; Thalía Bernal-Mercado, A.; Vega-Vega, V.; Silva-Espinoza, B.A.; Cruz-Valenzuela, M.R.; Ayala-Zavala, J.F. Antimicrobial and antioxidant properties of byproduct extracts of mango fruit. J. Appl. Bot. Food Qual. 2013, 86, 205–211. [Google Scholar]
- Carvalho, A.; Guedes, M.; De Souza, A.; Trevisan, M.; Lima, A.; Santos, F.; Rao, V. Gastroprotective Effect of Mangiferin, a Xanthonoid from Mangifera indica, against Gastric Injury Induced by Ethanol and Indomethacin in Rodents. Planta Med. 2007, 73, 1372–1376. [Google Scholar] [CrossRef] [PubMed]
- Pourahmad, J.; Eskandari, M.R.; Shakibaei, R.; Kamalinejad, M. A Search for Hepatoprotective Activity of Fruit Extract of Mangifera indica L. against Oxidative Stress Cytotoxicity. Plant Foods Hum. Nutr. 2010, 65, 83–89. [Google Scholar] [CrossRef] [PubMed]
- Stohs, S.J.; Swaroop, A.; Moriyama, H.; Bagchi, M.; Ahmad, T.; Bagchi, D. A Review on Antioxidant, Anti-Inflammatory and Gastroprotective Abilities of Mango (Magnifera indica) Leaf Extract and Mangiferin. J. Nutr. Health Sci. 2018, 5, 303. [Google Scholar] [CrossRef]
- Luo, F.; Fu, Y.; Xiang, Y.; Yan, S.; Hu, G.; Huang, X.; Huang, G.; Sun, C.; Li, X.; Chen, K. Identification and quantification of gallotannins in mango (Mangifera indica L.) kernel and peel and their antiproliferative activities. J. Funct. Foods 2014, 8, 282–291. [Google Scholar] [CrossRef]
- Abdullah, A.S.H.; Mohammed, A.S.; Rasedee, A.; Mirghani, M.E.S. Oxidative Stress-Mediated Apoptosis Induced by Ethanolic Mango Seed Extract in Cultured Estrogen Receptor Positive Breast Cancer MCF-7 Cells. Int. J. Mol. Sci. 2015, 16, 3528–3536. [Google Scholar] [CrossRef] [PubMed] [Green Version]
- Noratto, G.D.; Bertoldi, M.C.; Krenek, K.; Talcott, S.T.; Stringheta, P.C.; Mertens-Talcott, S.U. Anticarcinogenic Effects of Polyphenolics from Mango (Mangifera indica) Varieties. J. Agric. Food Chem. 2010, 58, 4104–4112. [Google Scholar] [CrossRef] [PubMed]
- Dai, J.; Mumper, R.J. Plant Phenolics: Extraction, Analysis and Their Antioxidant and Anticancer Properties. Molecules 2010, 15, 7313–7352. [Google Scholar] [CrossRef] [PubMed]
- Quideau, S.; Deffieux, D.; Douat-Casassus, C.; Pouysegu, L.; Douat-Casassus, C. Plant Polyphenols: Chemical Properties, Biological Activities, and Synthesis. Angew. Chem. Int. Ed. 2011, 50, 586–621. [Google Scholar] [CrossRef] [PubMed]
- Gold-Smith, F.; Fernandez, A.; Bishop, K. Mangiferin and Cancer: Mechanisms of Action. Nutrients 2016, 8, 396. [Google Scholar] [CrossRef] [PubMed]
- Pan, L.L.; Wang, A.Y.; Huang, Y.Q.; Luo, Y.; Ling, M. Mangiferin induces apoptosis by regulating Bcl-2 and Bax expression in the CNE2 nasopharyngeal carcinoma cell line. Asian Pac. J. Cancer Prev. 2014, 15, 7065–7068. [Google Scholar] [CrossRef] [PubMed]
- Fang, C.; Kim, H.; Noratto, G.; Sun, Y.; Talcott, S.T.; Mertens-Talcott, S.U. Gallotannin derivatives from mango (Mangifera indica L.) suppress adipogenesis and increase thermogenesis in 3T3-L1 adipocytes in part through the AMPK pathway. J. Funct. Foods 2018, 46, 101–109. [Google Scholar] [CrossRef]
- García-Rivera, D.; Delgado, R.; Bougarne, N.; Haegeman, G.; Berghe, W.V. Gallic acid indanone and mangiferin xanthone are strong determinants of immunosuppressive anti-tumour effects of Mangifera indica L. bark in MDA-MB231 breast cancer cells. Cancer Lett. 2011, 305, 21–31. [Google Scholar] [CrossRef] [PubMed]
- Berardini, N.; Reinhold, C.; Schieber, A. Characterization of Gallotannins and Benzophenone Derivatives from Mango (Mangifera Indica L.) Cv? Tommy Atkins Peels, Pulp and Kernels by High-Performance Liquid Chromatography/Electrospray Ionization Mass Spectrometry. Rapid Commun. Mass Spectrom. 2004, 18, 2208–2216. [Google Scholar] [CrossRef] [PubMed]
- Schieber, A.; Berardini, N.; Carle, R. Identification of Flavonol and Xanthone Glycosides from Mango (Mangifera indica L. Cv. “Tommy Atkins”) Peels by High-Performance Liquid Chromatography-Electrospray Ionization Mass Spectrometry. J. Agric. Food Chem. 2003, 51, 5006–5011. [Google Scholar] [CrossRef] [PubMed]
- Berardini, N.; Fezer, R.; Conrad, J.; Beifuss, U.; Carle, R.; Schieber, A. Screening of Mango (Mangifera indica L.) Cultivars for Their Contents of Flavonol O–and Xanthone C-Glycosides, Anthocyanins, and Pectin. J. Agric. Food Chem. 2005, 53, 1563–1570. [Google Scholar] [CrossRef]
- Arbizu-Berrocal, S.H.; Kim, H.; Fang, C.; Krenek, K.A.; Talcott, S.T.; Mertens-Talcott, S.U. Polyphenols from mango (Mangifera indica L.) modulate PI3K/AKT/mTOR-associated micro-RNAs and reduce inflammation in non-cancer and induce cell death in breast cancer cells. J. Funct. Foods 2019, 55, 9–16. [Google Scholar] [CrossRef]
- Dorta, E.; González, M.; Lobo, M.G.; Sanchez-Moreno, C.; De Ancos, B. Screening of phenolic compounds in by-product extracts from mangoes (Mangifera indica L.) by HPLC-ESI-QTOF-MS and multivariate analysis for use as a food ingredient. Food Res. Int. 2014, 57, 51–60. [Google Scholar] [CrossRef]
- Gómez-Caravaca, A.M.; López-Cobo, A.; Verardo, V.; Segura-Carretero, A.; Fernández-Gutiérrez, A. HPLC-DAD-Q-TOF-MS as a powerful platform for the determination of phenolic and other polar compounds in the edible part of mango and its by-products (peel, seed and seed husk). Electrophoresi 2016, 37, 1072–1084. [Google Scholar] [CrossRef]
- Hu, K.; Dars, A.G.; Liu, Q.; Xie, B.; Sun, Z. Phytochemical profiling of the ripening of Chinese mango (Mangifera indica L.) cultivars by real-time monitoring using UPLC-ESI-QTOF-MS and its potential benefits as prebiotic ingredients. Food Chem. 2018, 256, 171–180. [Google Scholar] [CrossRef] [PubMed]
- González-Sarrías, A.; Yuan, T.; Seeram, N.P. Cytotoxicity and structure activity relationship studies of maplexins A–I, gallotannins from red maple (Acer rubrum). Food Chem. Toxicol. 2012, 50, 1369–1376. [Google Scholar] [CrossRef] [PubMed]
- Njoya, E.M.; Eloff, J.N.; McGaw, L.J. Croton gratissimus leaf extracts inhibit cancer cell growth by inducing caspase 3/7 activation with additional anti-inflammatory and antioxidant activities. BMC Complement. Altern. Med. 2018, 18, 305. [Google Scholar]
- Prasetyaningrum, P.W.; Bahtiar, A.; Hayun, H. Synthesis and Cytotoxicity Evaluation of Novel Asymmetrical Mono-Carbonyl Analogs of Curcumin (AMACs) against Vero, HeLa, and MCF7 Cell Lines. Sci. Pharm. 2018, 86, 25. [Google Scholar] [CrossRef] [PubMed]
- Prayong, P.; Barusrux, S.; Weerapreeyakul, N. Cytotoxic activity screening of some indigenous Thai plants. Fitoterapia 2008, 79, 598–601. [Google Scholar] [CrossRef] [PubMed]
- Chothiphirat, A.; Nittayaboon, K.; Kanokwiroon, K.; Srisawat, T.; Navakanitworakul, R. Anticancer Potential of Fruit Extracts from Vatica diospyroides Symington Type SS and Their Effect on Program Cell Death of Cervical Cancer Cell Lines. Sci. World J. 2019, 2019, 1–9. [Google Scholar] [CrossRef] [PubMed]
- Lavorgna, M.; Orlo, E.; Nugnes, R.; Piscitelli, C.; Russo, C.; Isidori, M. Capsaicin in Hot Chili Peppers: In Vitro Evaluation of Its Antiradical, Antiproliferative and Apoptotic Activities. Plant Foods Hum. Nutr. 2019, 74, 164–170. [Google Scholar] [CrossRef]
- Navarro, M.; Zamora, W.; Quesada, S.; Azofeifa, G.; Alvarado, D.; Monagas, M. Fractioning of proanthocyanidins of Uncaria tomentosa. Composition and structure-bioactivity relationship. Antioxidants 2017, 6, 60. [Google Scholar] [CrossRef]
- Singleton, V.; Rossi, J. Colorimetry of total phenolics with phosphomolybdic-phosphotungstic acid reagents. Am. J. Enol. Vitic. 1965, 16, 144–158. [Google Scholar]
- Navarro, M.; Moreira, I.; Arnaez, E.; Quesada, S.; Azofeifa, G.; Vargas, F.; Alvarado, D.; Chen, P. Polyphenolic Characterization and Antioxidant Activity of Malus domestica and Prunus domestica Cultivars from Costa Rica. Foods 2018, 7, 15. [Google Scholar] [CrossRef]
- Blois, M.S. Antioxidant Determinations by the Use of a Stable Free Radical. Nature 1958, 181, 1199–1200. [Google Scholar] [CrossRef]
- Dávalos, A.; Gómez-Cordovés, C.; Bartolomé, B. Extending Applicability of the Oxygen Radical Absorbance Capacity (ORAC−Fluorescein) Assay. J. Agric. Food Chem. 2004, 52, 48–54. [Google Scholar] [CrossRef] [PubMed]
- Gentile, C.; Di Gregorio, E.; Di Stefano, V.; Mannino, G.; Perrone, A.; Avellone, G.; Farina, V. Food quality and nutraceutical value of nine cultivars of mango (Mangifera indica L.) fruits grown in Mediterranean subtropical environment. Food Chem. 2019, 277, 471–479. [Google Scholar] [CrossRef] [PubMed]
- Ramirez, J.; Zambrano, R.; Sepúlveda, B.; Simirgiotis, M. Antioxidant Properties and Hyphenated HPLC-PDA-MS Profiling of Chilean Pica Mango Fruits (Mangifera indica L. Cv. piqueño). Molecules 2013, 19, 438–458. [Google Scholar] [CrossRef] [PubMed]
- Kim, H.; Moon, J.Y.; Kim, H.; Lee, D.S.; Cho, M.; Choi, H.K.; Kim, Y.S.; Mosaddik, A.; Cho, S.K. Antioxidant and antiproliferative activities of mango (Mangifera indica L.) flesh and peel. Food Chem. 2010, 121, 429–436. [Google Scholar] [CrossRef]
- Monagas, M.; Garrido, I.; Lebrón-Aguilar, R.; Gómez-Cordovés, M.C.; Rybarczyk, A.; Amarowicz, R.; Bartolomé, B. Comparative Flavan-3-ol Profile and Antioxidant Capacity of Roasted Peanut, Hazelnut, and Almond Skins. J. Agric. Food Chem. 2009, 57, 10590–10599. [Google Scholar] [CrossRef] [PubMed]
- Navarro, M.; Sanchez, F.; Murillo, R.; Martín, P.; Zamora, W.; Monagas, M.; Bartolomé, B. Phenolic assesment of Uncaria tomentosa L. (Cat’s Claw): Leaves, stem, bark and wood extracts. Molecules 2015, 20, 22703–22717. [Google Scholar] [CrossRef]
- Bartolomé, B.; Nuñez, V.; Monagas, M.; Gómez-Cordovés, C. In vitro antioxidant activity of red grape skins. Eur. Food Res. Technol. 2004, 218, 173. [Google Scholar] [CrossRef]
- Navarro-Hoyos, M.; Alvarado-Corella, D.; Moreira-González, I.; Arnáez-Serrano, E.; Monagas-Juan, M. Polyphenolic Composition and Antioxidant Activity of Aqueous and Ethanolic Extracts from Uncaria tomentosa Bark and Leaves. Antioxidants 2018, 7, 65. [Google Scholar] [CrossRef]
- Chen, J.F.; Song, Y.L.; Guo, X.Y.; Tu, P.F.; Jiang, Y. Characterization of the herb-derived components in rats following oral administration of Carthamus tinctokimrius extract by extracting diagnostic fragment ions (DFIs) in the MSn chromatograms. Analyst 2014, 139, 6474–6485. [Google Scholar] [CrossRef]
- Morreel, K.; Saeys, Y.; Dima, O.; Lu, F.; Van De Peer, Y.; Vanholme, R.; Ralph, J.; Vanholme, B.; Boerjan, W. Systematic Structural Characterization of Metabolites in Arabidopsis via Candidate Substrate-Product Pair Networks. Plant Cell 2014, 26, 929–945. [Google Scholar] [CrossRef] [PubMed]
- Callipo, L.; Cavaliere, C.; Fuscoletti, V.; Gubbiotti, R.; Samperi, R.; Laganà, A. Phenilpropanoate identification in young wheat plants by liquid chromatography/tandem mass spectrometry: Monomeric and dimeric compounds. J. Mass Spectrom. 2010, 45, 1026–1040. [Google Scholar] [CrossRef] [PubMed]
- Barros, L.; Dueñas, M.; Pinela, J. Characterization and Quantification of Phenolic Compounds in Four Tomato (Lycopersicon esculentum L.) Farmers’ Varieties in Northeastern Portugal Homegardens. Plant Foods Hum. Nutr. 2012, 67, 229. [Google Scholar] [CrossRef] [PubMed]
- Zhang, H.; Cha, S.; Yeung, E.S. Colloidal Graphite-Assisted Laser Desorption/Ionization MS and MSnof Small Molecules. 2. Direct Profiling and MS Imaging of Small Metabolites from Fruits. Anal. Chem. 2007, 79, 6575–6584. [Google Scholar] [CrossRef] [PubMed]
- Krenek, K.A.; Barnes, R.C.; Talcott, S.T. Phytochemical Composition and Effects of Commercial Enzymes on the Hydrolysis of Gallic Acid Glycosides in Mango (Mangifera indica L. cv. ‘Keitt’) Pulp. J. Agric. Food Chem. 2014, 62, 9515–9521. [Google Scholar] [CrossRef] [PubMed]
- Li, X.; Duan, S.; Liu, H.; Xu, J.; Kong, M.; Liu, H.; Li, S. Sulfur-containing derivatives as characteristic chemical markers in control of sulfur-fumigated Moutan Cortex. Yaoxue Xuebao 2016, 51, 972–978. [Google Scholar] [CrossRef]
- Clifford, M.N.; Stoupi, S.; Kuhnert, N. Profiling and Characterization by LC-MSnof the Galloylquinic Acids of Green Tea, Tara Tannin, and Tannic Acid. J. Agric. Food Chem. 2007, 55, 2797–2807. [Google Scholar] [CrossRef]
- De Ancos, B.; Sánchez-Moreno, C.; Zacarías, L.; Rodrigo, M.J.; Sáyago Ayerdí, S.; Blancas Benítez, F.J.; Domínguez Avila, J.A.; Gonzalez-Aguilar, G.A. Effects of two different drying methods (freeze-drying and hot airdrying) on the phenolic and carotenoid profile of ‘Ataulfo’ mango by-products. J. Food Meas. Charact. 2018, 12, 2145–2157. [Google Scholar] [CrossRef]
- Barreto, J.C.; Trevisan, M.T.S.; Hull, W.E.; Erben, G.; De Brito, E.S.; Pfundstein, B.; Würtele, G.; Spiegelhalder, B.; Owen, R.W. Characterization and Quantitation of Polyphenolic Compounds in Bark, Kernel, Leaves, and Peel of Mango (Mangifera indica L.). J. Agric. Food Chem. 2008, 56, 5599–5610. [Google Scholar] [CrossRef]
- Beelders, T.; de Beer, D.; Stander, M.A.; Joubert, E. Comprehensive Phenolic Profiling of Cyclopia genistoides (L.) Vent. by LC-DAD-MS and -MS/MS Reveals Novel Xanthone and Benzophenone Constituents. Molecules 2014, 19, 11760–11790. [Google Scholar] [CrossRef]
- Sobral, F.; Calhelha, R.C.; Barros, L.; Dueñas, M.; Tomás, A.; Santos-Buelga, C.; Vilas-Boas, M.; Ferreira, I.C.F.R. Flavonoid Composition and Antitumor Activity of Bee Bread Collected in Northeast Portugal. Molecules 2017, 22, 248. [Google Scholar] [CrossRef] [PubMed]
- Fathoni, A.; Saepudin, E.; Cahyana, A.H.; Rahayu, D.U.C.; Haib, J. Identification of Nonvolatile Compounds in clove (Syzygium aromaticum) from Manado. In Proceedings of the 2nd International Symposium on Current Progress in Mathematics and Sciences 2016, Depok, Jawa Barat, Indonesia, 1–2 November 2016. [Google Scholar]
- Justesen, U. Collision-induced fragmentation of deprotonated methoxylated flavonoids, obtained by electrospray ionization mass spectrometry. J. Mass Spectrom. 2001, 36, 169–178. [Google Scholar] [CrossRef] [PubMed]
- López-Cobo, A.; Verardo, V.; Diaz-De-Cerio, E.; Segura-Carretero, A.; Fernández-Gutiérrez, A.; Gómez-Caravaca, A.M. Use of HPLC- and GC-QTOF to determine hydrophilic and lipophilic phenols in mango fruit (Mangifera indica L.) and its by-products. Food Res. Int. 2017, 100, 423–434. [Google Scholar] [CrossRef] [PubMed]
- Ribeiro, S.; Barbosa, L.; Queiróz, J.; Knodler, M.; Schieber, A.; Barbosa, L.C.A. Phenolic compounds and antioxidant capacity of Brazilian mango (Mangifera indica L.) varieties. Food Chem. 2008, 110, 620–626. [Google Scholar] [CrossRef]
- Shimamura, T.; Sumikura, Y.; Yamazaki, T.; Tada, A.; Kashiwagi, T.; Ishikawa, H.; Matsui, T.; Sugimoto, N.; Akiyama, H.; Ukeda, H. Applicability of the DPPH Assay for Evaluating the Antioxidant Capacity of Food Additives—Inter-laboratory Evaluation Study—. Anal. Sci. 2014, 30, 717–721. [Google Scholar] [CrossRef] [PubMed]
- Turati, F.; Rossi, M.; Pelucchi, C.; Levi, F.; La Vecchia, C. Fruit and vegetables and cancer risk: A review of southern European studies. Br. J. Nutr. 2015, 113, S102–S110. [Google Scholar] [CrossRef]
- La Vecchia, C.; Altieri, A.; Tavani, A. Vegetables, fruit, antioxidants and cancer: A review of Italian studies. Eur. J. Nutr. 2001, 40, 261–267. [Google Scholar] [CrossRef]
- Abu Bakar, M.F.; Mohamed, M.; Rahmat, A.; Burr, S.A.; Fry, J.R. Cytotoxicity and polyphenol diversity in selected parts of Mangifera pajangand Artocarpus odoratissimusfruits. Nutr. Food Sci. 2010, 40, 29–38. [Google Scholar] [CrossRef]
- Abbasi, A.M.; Liu, F.; Guo, X.; Fu, X.; Li, T.; Liu, R.H. Phytochemical composition, cellular antioxidant capacity and antiproliferative activity in mango (Mangifera indica L.) pulp and peel. Int. J. Food Sci. Technol. 2017, 52, 817–826. [Google Scholar] [CrossRef]
- Abu Bakar, M.F.; Mohamad, M.; Rahmat, A.; Burr, S.A.; Fry, J.R. Cytotoxicity, cell cycle arrest, and apoptosis in breast cancer cell lines exposed to an extract of the seed kernel of Mangifera pajang (bambangan). Food Chem. Toxicol. 2010, 48, 1688–1697. [Google Scholar] [CrossRef] [Green Version]
- Abdullah, A.S.H.; Mohammed, A.S.; Abdullah, R.; Mirghani, M.E.S.; Al-Qubaisi, M. Cytotoxic effects of Mangifera indica L. kernel extract on human breast cancer (MCF-7 and MDA-MB-231 cell lines) and bioactive constituents in the crude extract. BMC Complement. Altern. Med. 2014, 14, 199. [Google Scholar] [CrossRef] [PubMed]
- Ganogpichayagrai, A.; Palanuvej, C.; Ruangrungsi, N. Antidiabetic and anticancer activities of Mangifera indica cv. Okrong leaves. J. Adv. Pharm. Technol. Res. 2017, 8, 19. [Google Scholar] [CrossRef] [PubMed]
- Corrales-Bernal, A.; Urango, L.A.; Rojano, B.; Maldonado, M.E. In vitro and in vivo effects of mango pulp (Mangifera indica cv. Azucar) in colon carcinogenesis [Efectos in vitro e in vivo de la pulpa de mango (Mangifera indica cv. Azúcar) en la carcinogénesis de colon]. Arch. Latinoam. Nutr. 2014, 64, 16–23. [Google Scholar] [PubMed]
- Adams, L.S.; Phung, S.; Yee, N.; Seeram, N.P.; Li, L.; Chen, S. Blueberry Phytochemicals Inhibit Growth and Metastatic Potential of MDA-MB-231 Breast Cancer Cells Through Modulation of the Phosphatidylinositol 3-Kinase Pathway. Cancer Res. 2010, 70, 3594–3605. [Google Scholar] [CrossRef] [PubMed]
- Mahavorasirikul, W.; Viyanant, V.; Chaijaroenkul, W.; Itharat, A.; Na-Bangchang, K. Cytotoxic activity of Thai medicinal plants against human cholangiocarcinoma, laryngeal and hepatocarcinoma cells in vitro. BMC Complement. Altern. Med. 2010, 10, 55. [Google Scholar] [CrossRef] [PubMed]
- Khurana, R.K.; Kaur, R.; Lohan, S.; Singh, K.K. Mangiferin: A promising anticancer bioactive. Pharm. Pat. Anal. 2016, 5, 169–181. [Google Scholar] [CrossRef]
- Rajendran, P.; Rengarajan, T.; Nandakumar, N.; Divya, H.; Nishigaki, I. Mangiferin in cancer chemoprevention and treatment: Pharmacokinetics and molecular targets. J. Recept. Signal Transduct. 2015, 35, 76–84. [Google Scholar] [CrossRef] [PubMed]
- Shoji, K.; Tsubaki, M.; Yamazoe, Y.; Satou, T.; Itoh, T.; Kidera, Y.; Tanimori, Y.; Yanae, M.; Matsuda, H.; Taga, A.; et al. Mangiferin induces apoptosis by suppressing Bcl-xL and XIAP expressions and nuclear entry of NF-κB in HL-60 cells. Arch. Pharmacal Res. 2011, 34, 469–475. [Google Scholar] [CrossRef]
- Du Plessis-Stoman, D.; du Preez, J.G.H.; van de Venter, M. Combination treatment with oxaliplatin and mangiferin causes increased apoptosis and downregulation of NFKB in cancer cell lines. Afr. J. Tradit. Complement. Altern. Med. 2011, 8, 177–184. [Google Scholar] [CrossRef]
- Li, H.; Huang, J.; Yang, B.; Xiang, T.; Yin, X.; Peng, W.; Cheng, W.; Wan, J.; Luo, F.; Li, H.; et al. Mangiferin exerts antitumor activity in breast cancer cells by regulating matrix metalloproteinases, epithelial to mesenchymal transition, and β-catenin signaling pathway. Toxicol. Appl. Pharmacol. 2013, 272, 180–190. [Google Scholar] [CrossRef]
- Zhang, J.; Li, L.; Kim, S.-H.; Hagerman, A.E.; Lü, J. Anti-cancer, anti-diabetic and other pharmacologic and biological activities of penta-galloyl-glucose. Pharm. Res. 2009, 26, 2066–2080. [Google Scholar] [CrossRef] [PubMed]
- Cai, Y.; Zhang, J.; Chen, N.G.; Shi, Z.; Qiu, J.; He, C.; Chen, M. Recent Advances in Anticancer Activities and Drug Delivery Systems of Tannins. Med. Res. Rev. 2017, 37, 665–701. [Google Scholar] [CrossRef] [PubMed]
- Kawk, S.H.; Kang, Y.R.; Kim, Y.H. 1,2,3,4,6-Penta-O-galloyl-β-d-glucose suppresses colon cancer through induction of tumor suppressor. Bioorg. Med. Chem. Lett. 2018, 28, 2117–2123. [Google Scholar] [CrossRef] [PubMed]
- Rothwell, J.A.; Knaze, V.; Zamora-Ros, R. Polyphenols: Dietary assessment and role in the prevention of cancers. Curr. Opin. Clin. Nutr. Metab. Care 2017, 20, 512–521. [Google Scholar] [CrossRef]
- Zhou, Y.; Zheng, J.; Li, Y.; Xu, D.P.; Li, S.; Chen, Y.M.; Li, H.B. Natural Polyphenols for Prevention and Treatment of Cancer. Nutrients 2016, 8, 515. [Google Scholar] [CrossRef] [PubMed]
- Lee, Y.J.; Jung, O.; Lee, J.; Son, J.; Cho, J.Y.; Ryou, C.; Lee, S.Y. Maclurin exerts anti-cancer effects on PC3 human prostate cancer cells via activation of p38 and inhibitions of JNK, FAK, AKT, and c-Myc signaling pathways. Nutr. Res. 2018, 58, 62–71. [Google Scholar] [CrossRef]


| Sample | Lyophilization Yield (g/100 g) 1 | Extraction Yield (g/100 g) 2 | Total Phenolic Content (TPC) (mg/g) 3,4,5 |
|---|---|---|---|
| Keitt | |||
| Skin | 20.8 | 2.77 | 698.65 ± 0.47 a |
| Flesh | 16.9 | 0.69 | 291.14 ± 1.19 b |
| T. Atkins | |||
| Skin | 21.5 | 2.75 | 644.17 ± 5.79 c |
| Flesh | 17.6 | 0.57 | 162.67 ± 1.46 d |
| Peak | Identification | Rt (min) | [M−H]− | Molecular Formula | Error (ppm) | MS2 Fragments | MS3 Fragments | Keith Skin | Keit Flesh | T. A. Skin | T. A. Flesh |
|---|---|---|---|---|---|---|---|---|---|---|---|
| Phenolic Acis | |||||||||||
| 6 | Hydroxybenzoic acid hexoside (isomer I of II) | 4.43 | 299.078 | C13H15O8 | 6.31 | [299]: 137(100) | [299→137]: 93(100) | x | |||
| 9 | Hydroxybenzoic acid hexoside (isomer II of II) | 5.80 | 299.0775 | C13H15O8 | 4.37 | [299]: 137(100). 179(75). 239(79) | [299→137]: 93(100) | x | x | ||
| 12 | 5-hydroxyferuloyl hexoside | 7.64 | 371.0993 | C16H19O10 | 5.38 | [371]: 209(90). 233(100) | [371→233]: 191(100), 205(89) | x | |||
| 17 | Ferulic acid | 10.47 | 193.0515 | C10H9O4 | 10.07 | [193]: 149(100). 178(73) | [193→149]: 134(100) | x | |||
| 24 | Sinapic acid | 12.03 | 223.0618 | C11H11O5 | 7.40 | [223]: 164(17). 179(32). 208(100) | [223→208]: 164(100) | x | x | ||
| 27 | Sinapic acid O-pentosyl-hexoside | 13.27 | 517.2304 | C24H37O12 | 4.75 | [517]: 205(93). 385(100) | [517→385]: 153(100), 205(87), 223(90) | x | x | x | x |
| 28 | Dihydrosinapic acid O-pentosyl-hexoside | 13.47 | 519.2462 | C24H39O12 | 5.04 | [519]: 387(100) | [519→387]: 161(100), 225(63) | x | x | x | x |
| 35 | Syringic acid hexoside derivative (isomer I of III) | 14.75 | 403.1621 | C18H27O10 | 5.55 | [403]: 241(100) | [403→241]: 197(100) | x | |||
| 37 | Syringic acid hexoside derivative (isomer II of III) | 15.18 | 403.1621 | C18H27O10 | 5.62 | [403]: 241(100) | [403→241]: 197(100) | x | x | ||
| 38 | Syringic acid hexoside derivative (isomer III of III) | 15.47 | 403.1618 | C18H27O10 | 4.70 | [403]: 241(100) | [403→241]: 197(100) | x | |||
| 47 | Ellagic acid | 16.55 | 300.9999 | C14H5O8 | 6.60 | [301]: 229(52). 257(100) | x | x | x | ||
| Other acids | |||||||||||
| 1 | Quinic acid | 1.58 | 191.0568 | C7H11O6 | 9.24 | [191]: 85(69). 93(57). 127(100). 173(83) | x | x | |||
| 16 | Dihydrophaseic acid hexoside (isomer I of II) | 9.99 | 443.1934 | C21H31O10 | 5.00 | [443]: 161(90). 189(48). 219(83). 237(100). 281(44). 425(35) | [443→237]: 219(100) | x | x | x | x |
| 33 | Dihydrophaseic acid hexoside (isomer II of II) | 14.59 | 443.1940 | C21H31O10 | 6.45 | [443]: 189(51). 219(52). 237(87). 263(100). 281(34). 399(33). 425(97) | x | x | x | x | |
| Gallates and Gallotannins | |||||||||||
| 2 | Galloyl dihexoside (isomer I of III) | 1.79 | 493.1210 | C19H25O15 | 4.47 | [493]: 313(100) | [493→313]: 169(100), 223(52) | x | |||
| 3 | Galloyl dihexoside (isomer II of III) | 2.35 | 493.1213 | C19H25O15 | 4.98 | [493]: 313(100) | [493→313]: 169(100), 223(52) | x | |||
| 4 | Galloyl O-hexose (isomer I of II) | 2.67 | 331.0671 | C13H15O10 | 3.34 | [331]: 169(100), 211(31), 271(79) | [331→169]: 125(100) | x | x | x | x |
| 5 | Galloylquinic acid | 3.81 | 343.0667 | C14H15O10 | 2.24 | [343]: 191(100) | [343→191]: 85(77), 93(61), 111(35), 126(100), 173(79) | x | x | x | |
| 7 | Galloyl O-dihexoside (isomer III of III) | 4.86 | 493.1214 | C19H25O15 | 3.09 | [493]: 313(100) | [493→313]: 169(100), 223(52) | x | x | x | |
| 8 | Galloyl O-hexose (isomer II of II) | 5.23 | 331.0674 | C13H15O10 | 4.43 | [331]: 169(100) | [331→169]: 125(100) | x | x | x | |
| 11 | Di-O-galloyl hexose (isomer I of II) | 7.28 | 483.0799 | C20H19O14 | 6.21 | [483]: 169(100) | [483→169]: 125(100) | x | x | x | |
| 13 | Methyl-gallate isomer | 8.63 | 357.0834 | C15H17O10 | 4.89 | [357]: 169(100) | x | x | |||
| 15 | Di-O-galloyl quinic acid | 9.74 | 495.0794 | C21H19O14 | 4.28 | [495]: 343(100) | [495→343]: 169(100) | x | x | ||
| 19 | Tri-O-galloyl hexose (isomer I of III) | 10.82 | 635.08978 | C27H23O18 | 2.98 | [635]: 465(100), 483(95) | [635→465]: 168(59), 295(31), 313(87), 421(100) | x | x | ||
| 20 | Di-O-galloyl hexose (isomer II of II) | 10.94 | 483.0792 | C20H19O14 | 2.26 | [483]: 331(100) | [483→331]: 169(100) | x | x | ||
| 21 | Hydroxybenzoyl galloyl hexoside | 11.35 | 451.0900 | C20H19O12 | 6.42 | [451]: 313(100) | [451→313]: 169(100) | x | |||
| 22 | Tri-O-galloyl hexose (isomer II of III) | 11.38 | 635.0888 | C27H23O18 | 1.35 | [635]: 465(100), 483(95) | [635→465]: 168(59), 295(31), 313(87), 421(100) | x | x | ||
| 29 | Tri-O-galloyl hexose (isomer III of III) | 13.68 | 635.08942 | C27H23O18 | 2.41 | [635]: 465(100), 483(95) | [635→465]: 168(59), 295(31), 313(87), 421(100) | x | x | ||
| 31 | Tetra-O-galloyl hexose (isomer I of VI) | 14.23 | 787.1008 | C34H27O22 | 1.98 | [787]: 635(100) | [787→635]: 423(77), 465(100), 483(99) | x | x | x | |
| 32 | Tetra-O-galloyl hexose (isomer II of VI) | 14.37 | 787.1013 | C34H27O22 | 3.06 | [787]: 635(100) | [787→635]: 423(77), 465(100), 483(99) | x | x | ||
| 40 | Tetra-O-galloyl hexose (isomer III of VI) | 15.61 | 787.1015 | C34H27O22 | 2.65 | [787]: 617(100), 635(53) | [787→617]: 447(32), 465(100) | x | x | ||
| 41 | Tetra-O-galloyl hexose (isomer IV of VI) | 15.73 | 787.1017 | C34H27O22 | 3.60 | [787]: 617(25), 635(100) | [787→635]: 423(74), 465(76), 483(100) | x | x | x | |
| 44 | Tetra-O-galloyl hexose (isomer V of VI) | 15.98 | 787.1016 | C34H27O22 | 3.52 | [787]: 617(100) | [787→635]: 403(62), 447(65), 465(100) | x | x | x | |
| 45 | Tetra-O-galloyl hexose (isomer VI of VI) | 16.32 | 787.1010 | C34H27O22 | 2.75 | [787]: 635(100) | [787→635]: 423(77), 465(100), 483(99) | x | x | ||
| 51 | Penta-O-galloyl hexose | 17.27 | 939.1132 | C41H31O26 | −2.68 | [939]: 769(100) | [939→769]: 599(31), 601(32), 617(100) | x | x | x | |
| 54 | Hexa-O-galloyl hexose (isomer I of III) | 18.07 | 1091.1238 | C48H35O30 | 0.6 | [1091]: 939(100) | [1091→939]: 769(100) | x | x | x | |
| 55 | Hexa-O-galloyl hexose (isomer II of III) | 18.37 | 1091.1227 | C48H35O30 | −0.41 | [1091]: 939(100) | [1091→939]: 769(100) | x | x | x | |
| 56 | Hexa-O-galloyl hexose (isomer III of III) | 18.52 | 1091.1235 | C48H35O30 | 0.38 | [1091]: 939(100) | [1091→939]: 769(100) | x | x | ||
| 57 | Hepta-O-galloyl hexose (isomer I of III) | 18.80 | 1243.1351 | C55H39O34 | −0.10 | [1243]: 939(48), 1091(100) | [1243→1091]: 939(100) | x | x | x | |
| 58 | Hepta-O-galloyl hexose (isomer II of III) | 18.94 | 1243.1349 | C55H39O34 | −2.18 | [1243]: 939(48), 1091(100) | [1243→1091]: 939(100) | x | x | x | |
| 59 | Hepta-O-galloyl hexose (isomer III of II) | 19.06 | 1243.1352 | C55H39O34 | 2.74 | [1243]: 939(56), 1091(100) | [1243→1091]: 939(100) | x | x | ||
| 60 | Octa-O-galloyl hexose (isomer I of II) | 19.39 | 1395.1466 | C62H43O38 | 2.81 | [1395]: 1243(100), 1244(58) | x | x | x | ||
| 61 | Octa-O-galloyl hexose (isomer II of II) | 19.60 | 1395.1464 | C62H43O38 | 2.64 | [1395]: 1243(100), 1244(41) | x | x | x | ||
| 63 | Nona-O-galloyl hexose | 20.11 | 1547.1576 | C69H47O42 | 2.55 | [1547]: 1395(100), 1396(62) | x | x | |||
| 64 | Nona-O-galloyl hexose | 20.44 | 1547.1603 | C69H47O42 | 4.29 | [1547]: 1395(100), 1396(62) | x | x | |||
| 65 | Deca-O-galloyl hexose | 20.60 | 1699.1690 | C76H51O46 | 2.56 | [1699]: 1547(100), 1548(53) | x | x | |||
| 66 | Deca-O-galloyl hexose | 20.80 | 1699.1724 | C76H51O46 | 4.57 | [1699]: 1547(100), 1548(53) | x | x | |||
| 67 | Undeca-O-galloyl hexose (isomer I of III) | 20.94 | 1851.1819 | C83H55O50 | 3.42 | [1851]: 1547(33), 1699(100), 1700(90) | x | x | |||
| 69 | Undeca-O-galloyl hexose (isomer II of III) | 21.28 | 1851.1805 | C83H55O50 | 2.69 | [1851]: 1395(43), 1547(47), 1699(100), 1700(81) | x | x | |||
| 70 | Undeca-O-galloyl hexose (isomer III of III) | 21.53 | 1851.1803 | C83H55O50 | 2.56 | [1851]: 1395(100), 1547(76), 1699(99), 1700(85) | x | x | |||
| Xanthonoids | |||||||||||
| 10 | Maclurin C-hexoside | 6.62 | 423.0943 | C19H19O11 | 5.94 | [423]: 303(100) | [423→303]: 193(100) | x | |||
| 14 | Maclurin 3-C-(2-O-galloyl)-hexoside | 9.35 | 575.1047 | C26H23O15 | 2.67 | [575]: 285(85), 303(100), 313(43), 423(70), 465(31) | [575→303]: 193(100) | x | x | ||
| 18 | Maclurin-3-C-(2-O-hexosyl-galloyl)-hexoside | 10.69 | 737.1588 | C32H33O20 | 2.78 | [737]: 575(100) | [737→575]: 285(89), 303(100), 313(44), 423(80) | x | |||
| 25 | Iriflophenone 3-C-(2-O-galloyl)-hexoside | 12.31 | 559.1101 | C26H23O14 | 3.36 | [559]: 287(31), 407(100) | [559→407]: 287(100) | x | x | ||
| 26 | Maclurin 3-C-(2.3-di-O-galloyl)- hexoside | 12.82 | 727.1166 | C33H27O19 | 3.49 | [727]: 575(100) | [727→ 575]: 315(39), 369(38), 405(100), 439(56), 465(37), 485(78) | x | x | ||
| 34 | Maclurin-3-C-(p-hydroxybenzoyl)- hexoside | 14.63 | 543.1149 | C26H23O13 | 5.91 | [543]: 285(100) | [543→285]: 175(100) | x | |||
| 36 | Iriflophenone 3-C-(di-O-galloyl)-hexoside | 14.83 | 711.1216 | C33H27O18 | 3.36 | [711]: 559(100) | [711→559]: 389(100) | x | |||
| Hydroxybenzophenones | |||||||||||
| 23 | Mangiferin O-hexoside | 11.84 | 583.1311 | C25H27O16 | 2.98 | [583]: 463(65), 493(100), 565(29) | [583→493]: 331(100) | x | |||
| 30 | Manguiferin/Isomangiferin | 13.85 | 421.0787 | C19H17O11 | 2.13 | [421]: 301(100), 331(94) | [421→301]: 258(100), 273(73) | x | x | x | x |
| 39 | Mangiferin/isomanguiferin O-gallate (isomer I of II) | 15.48 | 573.0891 | C26H21O15 | 2.82 | [573]: 421(100) | [573→421]: 301(100), 331(49) | x | x | ||
| 42 | Mangiferin/isomanguiferin O-gallate (isomer II of II) | 15.81 | 573.0894 | C26H21O15 | 3.36 | [573]: 283(44), 403(54), 421(100) | [573→421]: 301(100), 331(56) | x | |||
| 46 | Manguiferin/Isomangiferin | 16.43 | 421.0794 | C19H17O11 | 6.82 | [421]: 301(100), 331(89), 406(58) | [421→301]: 258(100), 273(80) | x | x | ||
| 48 | Mangiferin-di-O-gallate | 16.71 | 725.1004 | C33H25O19 | 2.68 | [725]: 573(100) | [757→573]: 403(98), 421(100) | x | |||
| Flavonoids | |||||||||||
| 43 | Quercetin-3-O-pentosyl-hexoside | 15.92 | 595.1303 | C26H27O16 | 1.49 | [595]: 300(100), 301(42) | [595→300]: 255(57), 271(100) | x | |||
| 49 | Quercetin O-hexoside (isomer I of II) | 16.82 | 463.0893 | C21H19O12 | 4.66 | [463]: 300(30), 301(100) | [463→301]: 151(67), 179(100) | x | x | x | |
| 50 | Quercetin O-hexoside (isomer II of II) | 17.04 | 463.0898 | C21H19O12 | 5.85 | [463]: 301(100) | [463→301]: 151(72), 179(100) | x | |||
| 52 | Quercetin 3-O-pentoside (isomer I of II) | 17.54 | 433.0786 | C20H17O11 | 4.72 | [433]: 301(100) | [433→301]: 179(100), 151(80) | x | |||
| 53 | Quercetin 3-O-pentoside (isomer II of II) | 17.85 | 433.0788 | C20H17O11 | 5.22 | [433]: 301(100) | [433→301]: 179(100), 151(69) | x | |||
| 62 | Rhamnetin 3-O-pentosyl-hexoside | 19.96 | 609.1467 | C27H29O16 | 1.72 | [609]: 299(24), 314(100), 315(49) | [609→314]: 299(100) | x | |||
| 68 | Rhamnetin 3-O-hexoside | 21.25 | 477.1054 | C22H21O12 | 5.51 | [477]: 315(100) | [477→315]: 165(100), 193(38), 299(60), 300(44) | x | |||
| 71 | Rhamnetin | 22.05 | 315.0513 | C16H11O7 | 4.26 | [315]: 271(100) | [315→271]: 256(100) | x | |||
| Sample | DPPH 1,2 | ORAC 1,2 | |
|---|---|---|---|
| IC50 (μg/mL) | (mmol TE/g Extract) | (mmol TE/g Extract) | |
| Keitt | |||
| Skin | 11.93 ± 0.69 a | 0.47 ± 0.03 a | 8.30 ± 0.01 a |
| Flesh | 17.78 ± 0.33 b | 0.32 ± 0.01 b | 5.20 ± 0.12 b |
| T. Atkins | |||
| Skin | 9.97 ± 0.36 c | 0.56 ± 0.02 c | 11.02 ± 0.11 c |
| Flesh | 22.51 ± 0.44 d | 0.25 ± 0.01 d | 3.56 ± 0.07 d |
| Sample | IC50 (µg/mL) | ||||
|---|---|---|---|---|---|
| AGS 1,2 | SW 620 1,2 | Hep-G2 1,2 | Vero 1,2 | ||
| Keitt | Skin | 197 ± 16 a,b,* | 223 ± 24 a,*,& | 309 ± 23 a,& | >500 a,# |
| Flesh | 256 ± 32 a,* | 374 ± 18 b,& | 369 ± 17 a,& | >500 a,# | |
| T. Atkins | Skin | 138 ± 8 b,^ | 175 ± 7 a,^ | 164 ± 13 b,^ | 278 ± 3 b,# |
| Flesh | >500 c,# | >500 c,# | >500 c,# | >500 a,# | |
© 2019 by the authors. Licensee MDPI, Basel, Switzerland. This article is an open access article distributed under the terms and conditions of the Creative Commons Attribution (CC BY) license (http://creativecommons.org/licenses/by/4.0/).
Share and Cite
Navarro, M.; Arnaez, E.; Moreira, I.; Quesada, S.; Azofeifa, G.; Wilhelm, K.; Vargas, F.; Chen, P. Polyphenolic Characterization, Antioxidant, and Cytotoxic Activities of Mangifera indica Cultivars from Costa Rica. Foods 2019, 8, 384. https://0-doi-org.brum.beds.ac.uk/10.3390/foods8090384
Navarro M, Arnaez E, Moreira I, Quesada S, Azofeifa G, Wilhelm K, Vargas F, Chen P. Polyphenolic Characterization, Antioxidant, and Cytotoxic Activities of Mangifera indica Cultivars from Costa Rica. Foods. 2019; 8(9):384. https://0-doi-org.brum.beds.ac.uk/10.3390/foods8090384
Chicago/Turabian StyleNavarro, Mirtha, Elizabeth Arnaez, Ileana Moreira, Silvia Quesada, Gabriela Azofeifa, Krissia Wilhelm, Felipe Vargas, and Pei Chen. 2019. "Polyphenolic Characterization, Antioxidant, and Cytotoxic Activities of Mangifera indica Cultivars from Costa Rica" Foods 8, no. 9: 384. https://0-doi-org.brum.beds.ac.uk/10.3390/foods8090384