1. Introduction
The high moisture content in fruit and vegetable juices makes them highly susceptible to being spoiled by microorganisms [
1] that can survive in acidic juices at normal temperature or refrigeration conditions, even when appropriately packaged. Moreover, physiochemical changes affect the safety and quality. All of these offensive changes may be prevented by supplementation of preservatives that maintain the nutrition value of juice, extend its lifetime, and keep it safe [
2]. Recently, the consumer demand for foods with a long lifetime, high quality, and a suitable price has increased. Therefore, food producers and manufacturers are in quest of additives to increase food storage life, while maintaining nutrition value, quality, and safety. Many chemicals, such as nitrates, organic acids, and their salts, butylated hydroxytoluene (BHT) formaldehyde, and butylated hydroxyanisole (BHA) are effectively used as food preservatives, to reduce the microbial load and prolong food lifetime and vitality. Despite their antioxidant and antimicrobial activity [
3,
4], preservatives’ various undesirable effects on human health, including allergy, headache, asthma, hyperactivity, hypersensitivity, cancer, neurological damage, and dermatitis, have been investigated, [
5,
6,
7]. Carocho et al. [
8] confirmed that the extreme consumption of chemical additives is expounded to gastrointestinal, respiratory, dermatological, and neural opposing responses. Hence, consumers are increasingly concerned about the harmful effects of chemical preservatives and the preference for natural additives. Researchers have focused on producing natural preservatives that exhibit antioxidant and microbial activity for use in food processing [
9,
10]. Dauda et al. [
11] evaluated the microbial load during watermelon juice storage over three months at cool conditions. They found that pure watermelon juice was highly vulnerable to microbial spoilage because of preservatives’ absence, and a large volume of microbial loads was recorded, but when they mixed the juice with serendipity berry extract as a preservative, the load was highly reduced and the storage life extended.
Cucumber (
Cucumis sativus L.) is a member of Cucurbitaceae seasonal vegetable crops, which are native to India and cultivated all over the world [
12]. During the harvest season, a large amount of cucumber spoils due to overproduction. This problem can be minimized by saving the cucumber as a drink or juice as functional beverages. In Central Asia, people drink cucumber juice on hot days, for recovery. Cucumber juice has health benefits for skin, nails, and hair; it maintained an ideal weight and cure some kidney disease and blood pressure issues. The cucumber is distinguished by its high content of water and satisfies all appetites [
13]. In some regions of the developing countries, refrigeration storage is difficult to use due to the high costs of operating and the deficiency of electricity supplies. Alemu and Girma [
14] developed a novel technique for food storage called “Hyperbaric storage”, which is usually not higher than 100 MPa at ambient or low temperature, for up to months.
Recent studies showed that the storage with low pressure at room temperature can be an effective technique to fruit and vegetable juices’ storage, as pressure inhibits the microbial content of fresh juice, besides enhancing sensory characteristics and the quality of the juice. Reports indicated that low-pressure storage prolonged vegetable and fruit juices’ shelf life; it also reduced energy costs more than refrigeration storage [
15,
16,
17,
18]. Lemos et al. [
19] preserved watermelon juice with low pressure (50–75 MPa), at room temperature, for two months. The usage of natural antimicrobial and antioxidants, such as herbal extracts and essential oils, improved capacity and safety in the food industry [
20,
21]. Moreover, peptides and antimicrobial proteins (AMPs) are responsible for the immunity of most organisms. Because of their activity and stability in foods and drinks, they represent natural preservatives [
22]. Various protein hydrolysates have been applied as antioxidants and microbes in meat products [
23,
24]. Saad et al. [
25] reported that kidney bean protein hydrolysate improved minced meat quality, shelf life, and safety. Wan and Xu [
26] confirmed that whey protein isolates improved sensory and physical–chemical properties of a complimentary beverage. Organic acids exhibit antioxidant properties [
3], especially dilute solutions, but they do not affect the sensory properties of food in, the sense that they do not affect the sensory properties of the carcasses [
27].
This current study aimed to (i) investigate the effect of natural additives (different egg-white protein isolates; chicken, duck, and quail egg protein isolates; and kidney bean protein hydrolysate) and chemical additives (citric, benzoic acids, and their sodium salts) on cucumber-juice flavoring and preservation at room temperature, with low pressure, for an interval of zero, two, four, and six months; (ii) estimate the antioxidant and antimicrobial activities of the protein isolates and hydrolysates; (iii) identify the phenolic compounds and flavonoids in protein isolates and hydrolysates; and (iv) evaluate the sensory properties of juice during the preservation period.
2. Materials and Methods
2.1. Materials
Cucumber (Cucumis sativus) and kidney bean (Phaseolus vulgaris) L. seeds were purchased from the local market. Chicken, duck, and quail eggs were obtained from a private farm (Zagazig City, Egypt). Proteins’ isolates were prepared at Biochemistry Department, Faculty of Agriculture, Zagazig University, Egypt. Pepsin enzyme, DPPH, Gallic acid, quercetin, benzoic acid, sodium benzoate, citric acid, sodium citrate, and nutrient agar media (lab-lemco powder) were purchased from Sigma (Ronkonkoma, NY, USA), MacConkey agar (Heywood, UK). The G+ bacteria (Listeria monocytogenes ATCC 15313, Bacillus cereus ATCC 11778, and G− bacteria (E. coli ATCC 25922, and Pseudomonas aeruginosa ATCC 27853) were purified active strains. Fungi strains, Aspergillus niger, Penicillium notatum, and Fusarium solani were obtained from the Cairo MIRCEN, Ain Shams University, Cairo, Egypt.
2.2. Methods
2.2.1. Preparation of Protein Isolates
Preparing of Pepsin Kidney Bean Protein Hydrolysate (KPH)
White kidney bean seeds were milled. The obtained flour was defatted with hexane (1:3
w/
v) and then dried, in the oven. Total protein was isolated from five grams of defatted white kidney bean flour [
28]. The lyophilized total protein isolate was dissolved in phosphate buffer pH two and hydrolyzed by pepsin enzyme (E:S ratio 1:200,
w/
w), at 37 °C, for three hours. The enzyme was deactivated in warm water at 90 °C for fifteen minutes. The supernatant was obtained by centrifugation of hydrolysate at 4000×
g for thirty minutes, lyophilized, and then kept.
Preparation of Chicken, Duck, and Quail Egg White Protein Isolate (CEPI, DEPI, and QEPI)
The chicken, quail, and duck egg whites were diluted [
29] with some modification, with water (1:3
w/
v), and were stirred for thirty minutes and centrifuged for 20 min undercooling (15,000×
g). The obtained supernatant was precipitated with 10% polyethylene glycol (PEG) 4000 and centrifuged under cooling at 15,000×
g for twenty minutes. The residues were dissolved in 50 mM Tris-HCl, 200 mM NaCl, and 5 mM CaCl
2, pH 7.8 (TBS-Ca). After leaving at 4 °C overnight, the mixture was centrifuged (4 °C, 15,000×
g, 20 min). The precipitates were washed with TBS-Ca, homogenized with TBS buffer with ten mM EDTA, pH 7.8, and kept for thirty minutes at 4 °C. Then they were centrifuged at (4 °C, 1400×
g, 20 min), and the supernatant was collected and adjusted to pH 5 with HCl. Following further centrifugation (4 °C, 1400×
g, 20 min), it was dialyzed against 20 mM Tris-HCl, 50 mM NaCl (pH 8.0). The dialysate fractions were eluted on the Q Sepharose column by the gradual concentration of NaCl solution (0.1 to 0.6 molar). The chicken, duck, and quail egg protein’s isolates were diluted with NaCl (0.35 to 0.45 M) and then freeze-dried.
2.2.2. Processing of Cucumber Juice Supplemented by Preservatives
The fresh cucumber was washed, cleaned, and processed in a Braun blender (Blender mixer Type 441), resulting in juice. The juice was heated at 83 °C for 2–3 min, with a few pressures 75 MPa “hyperbaric preservation” [
17,
19,
30,
31] in HIRAYAMA HG-SERIES autoclave (Concord, CA 94520, USA), and immediately cooled-down.
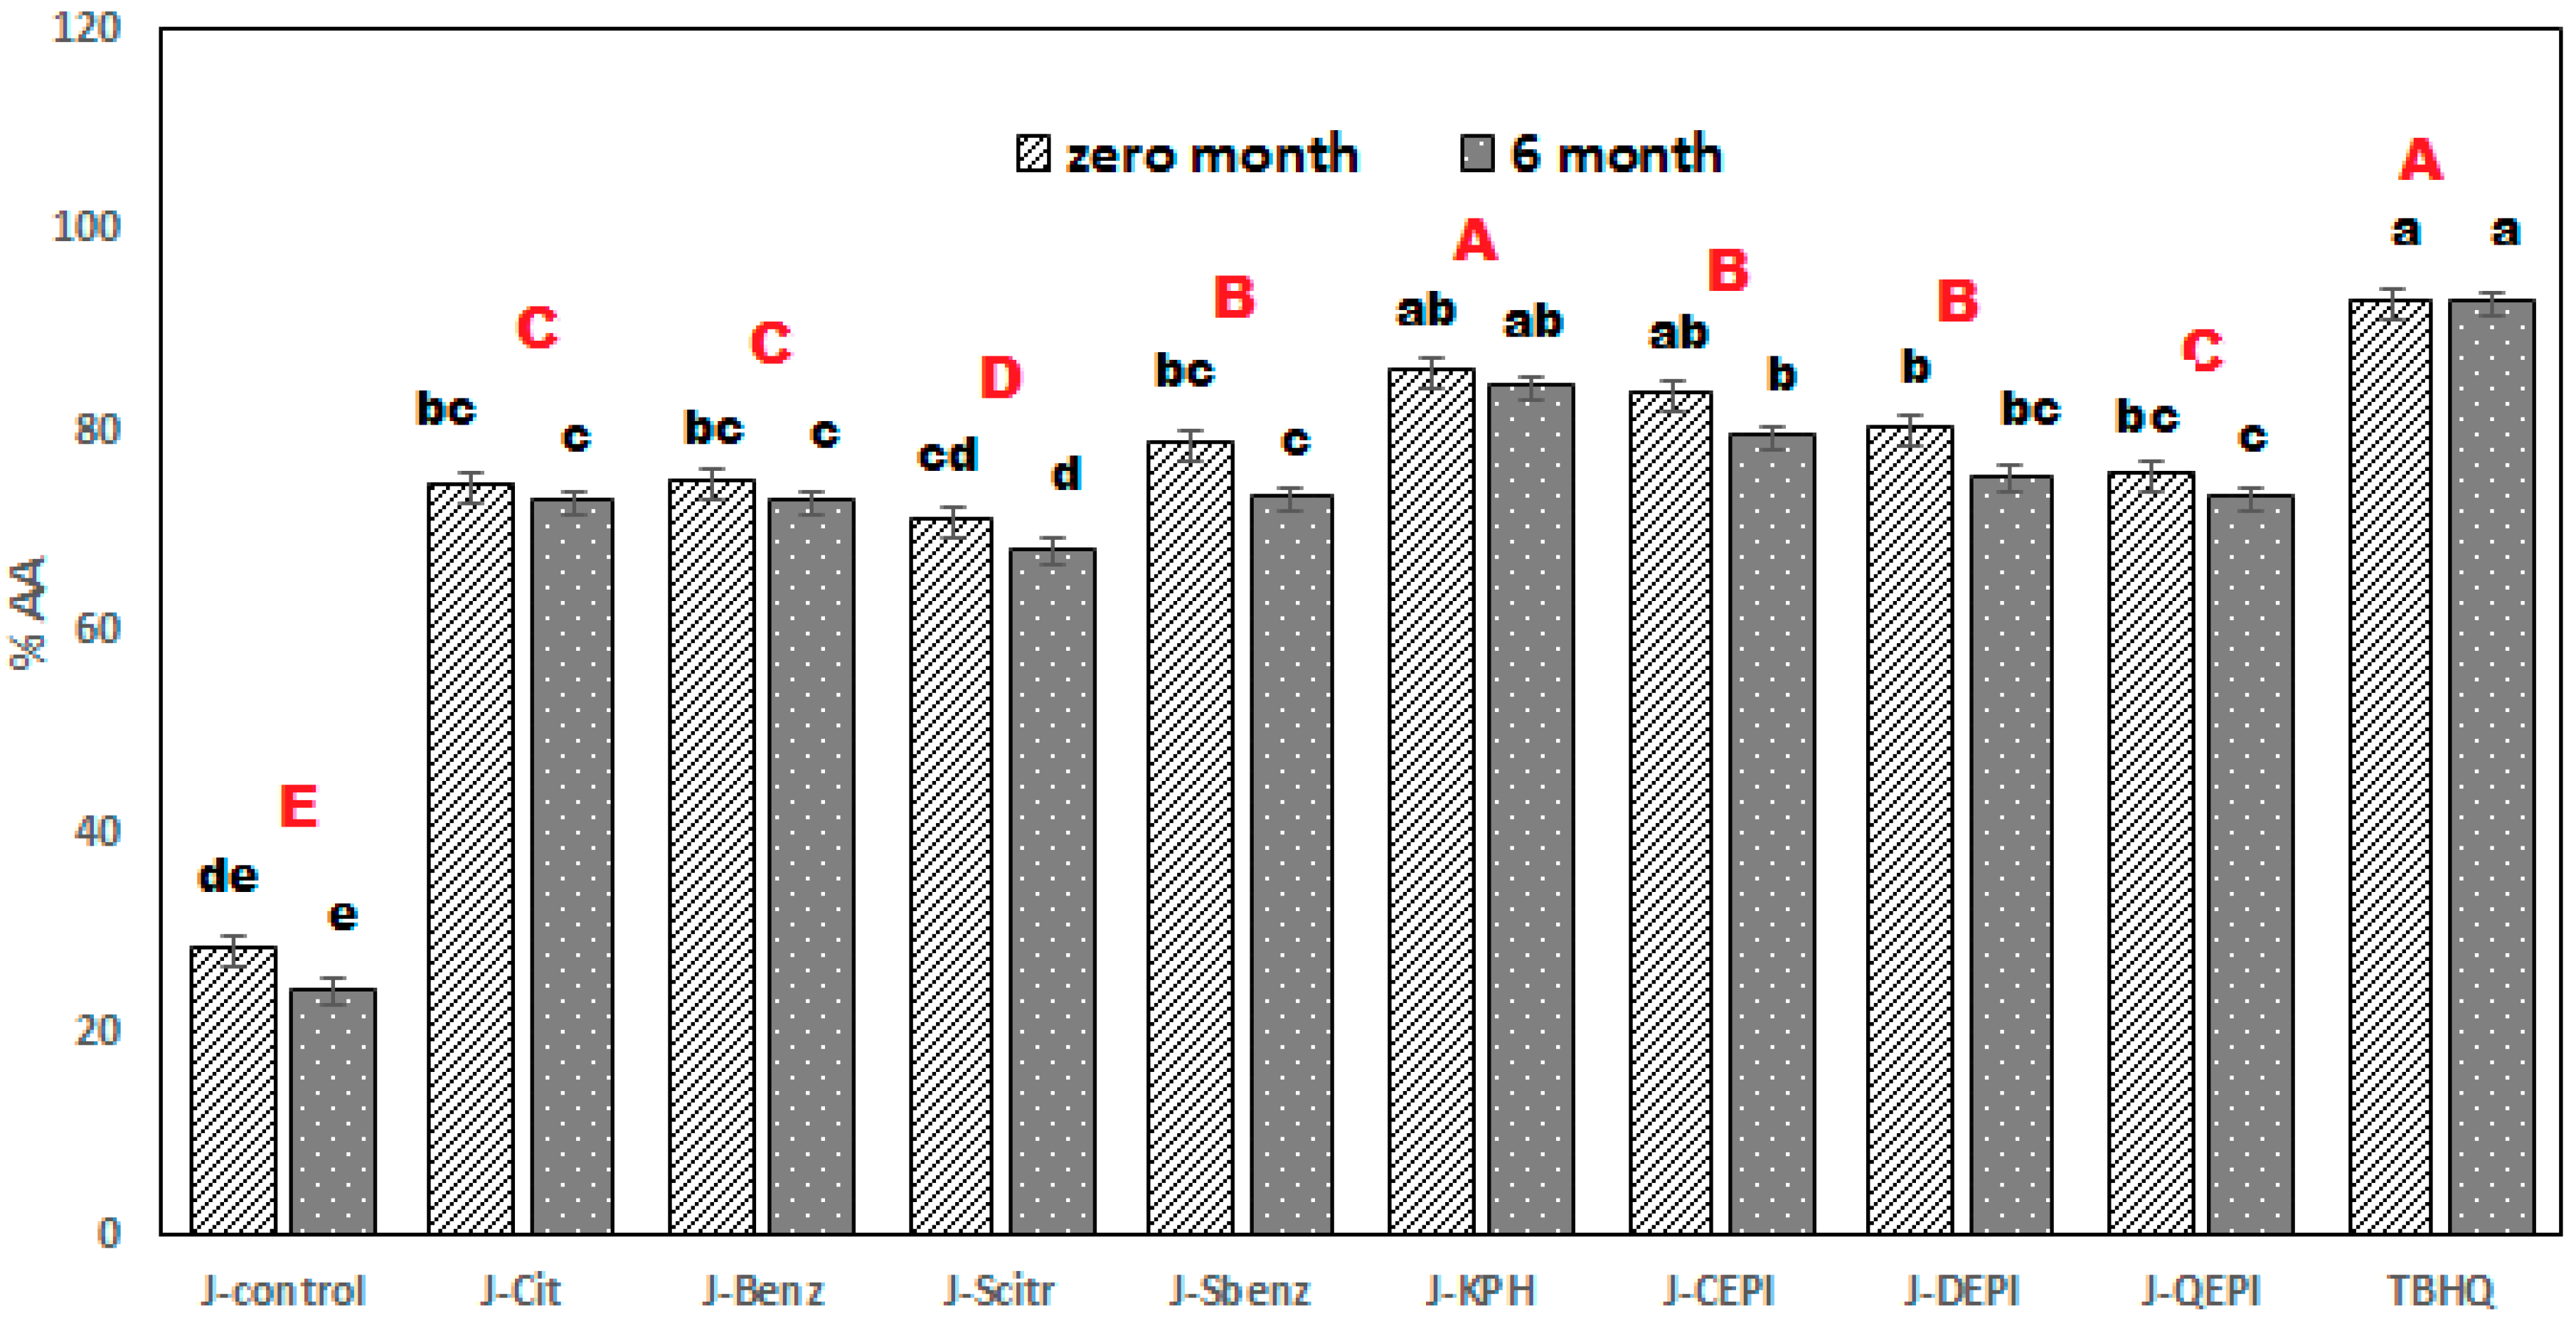
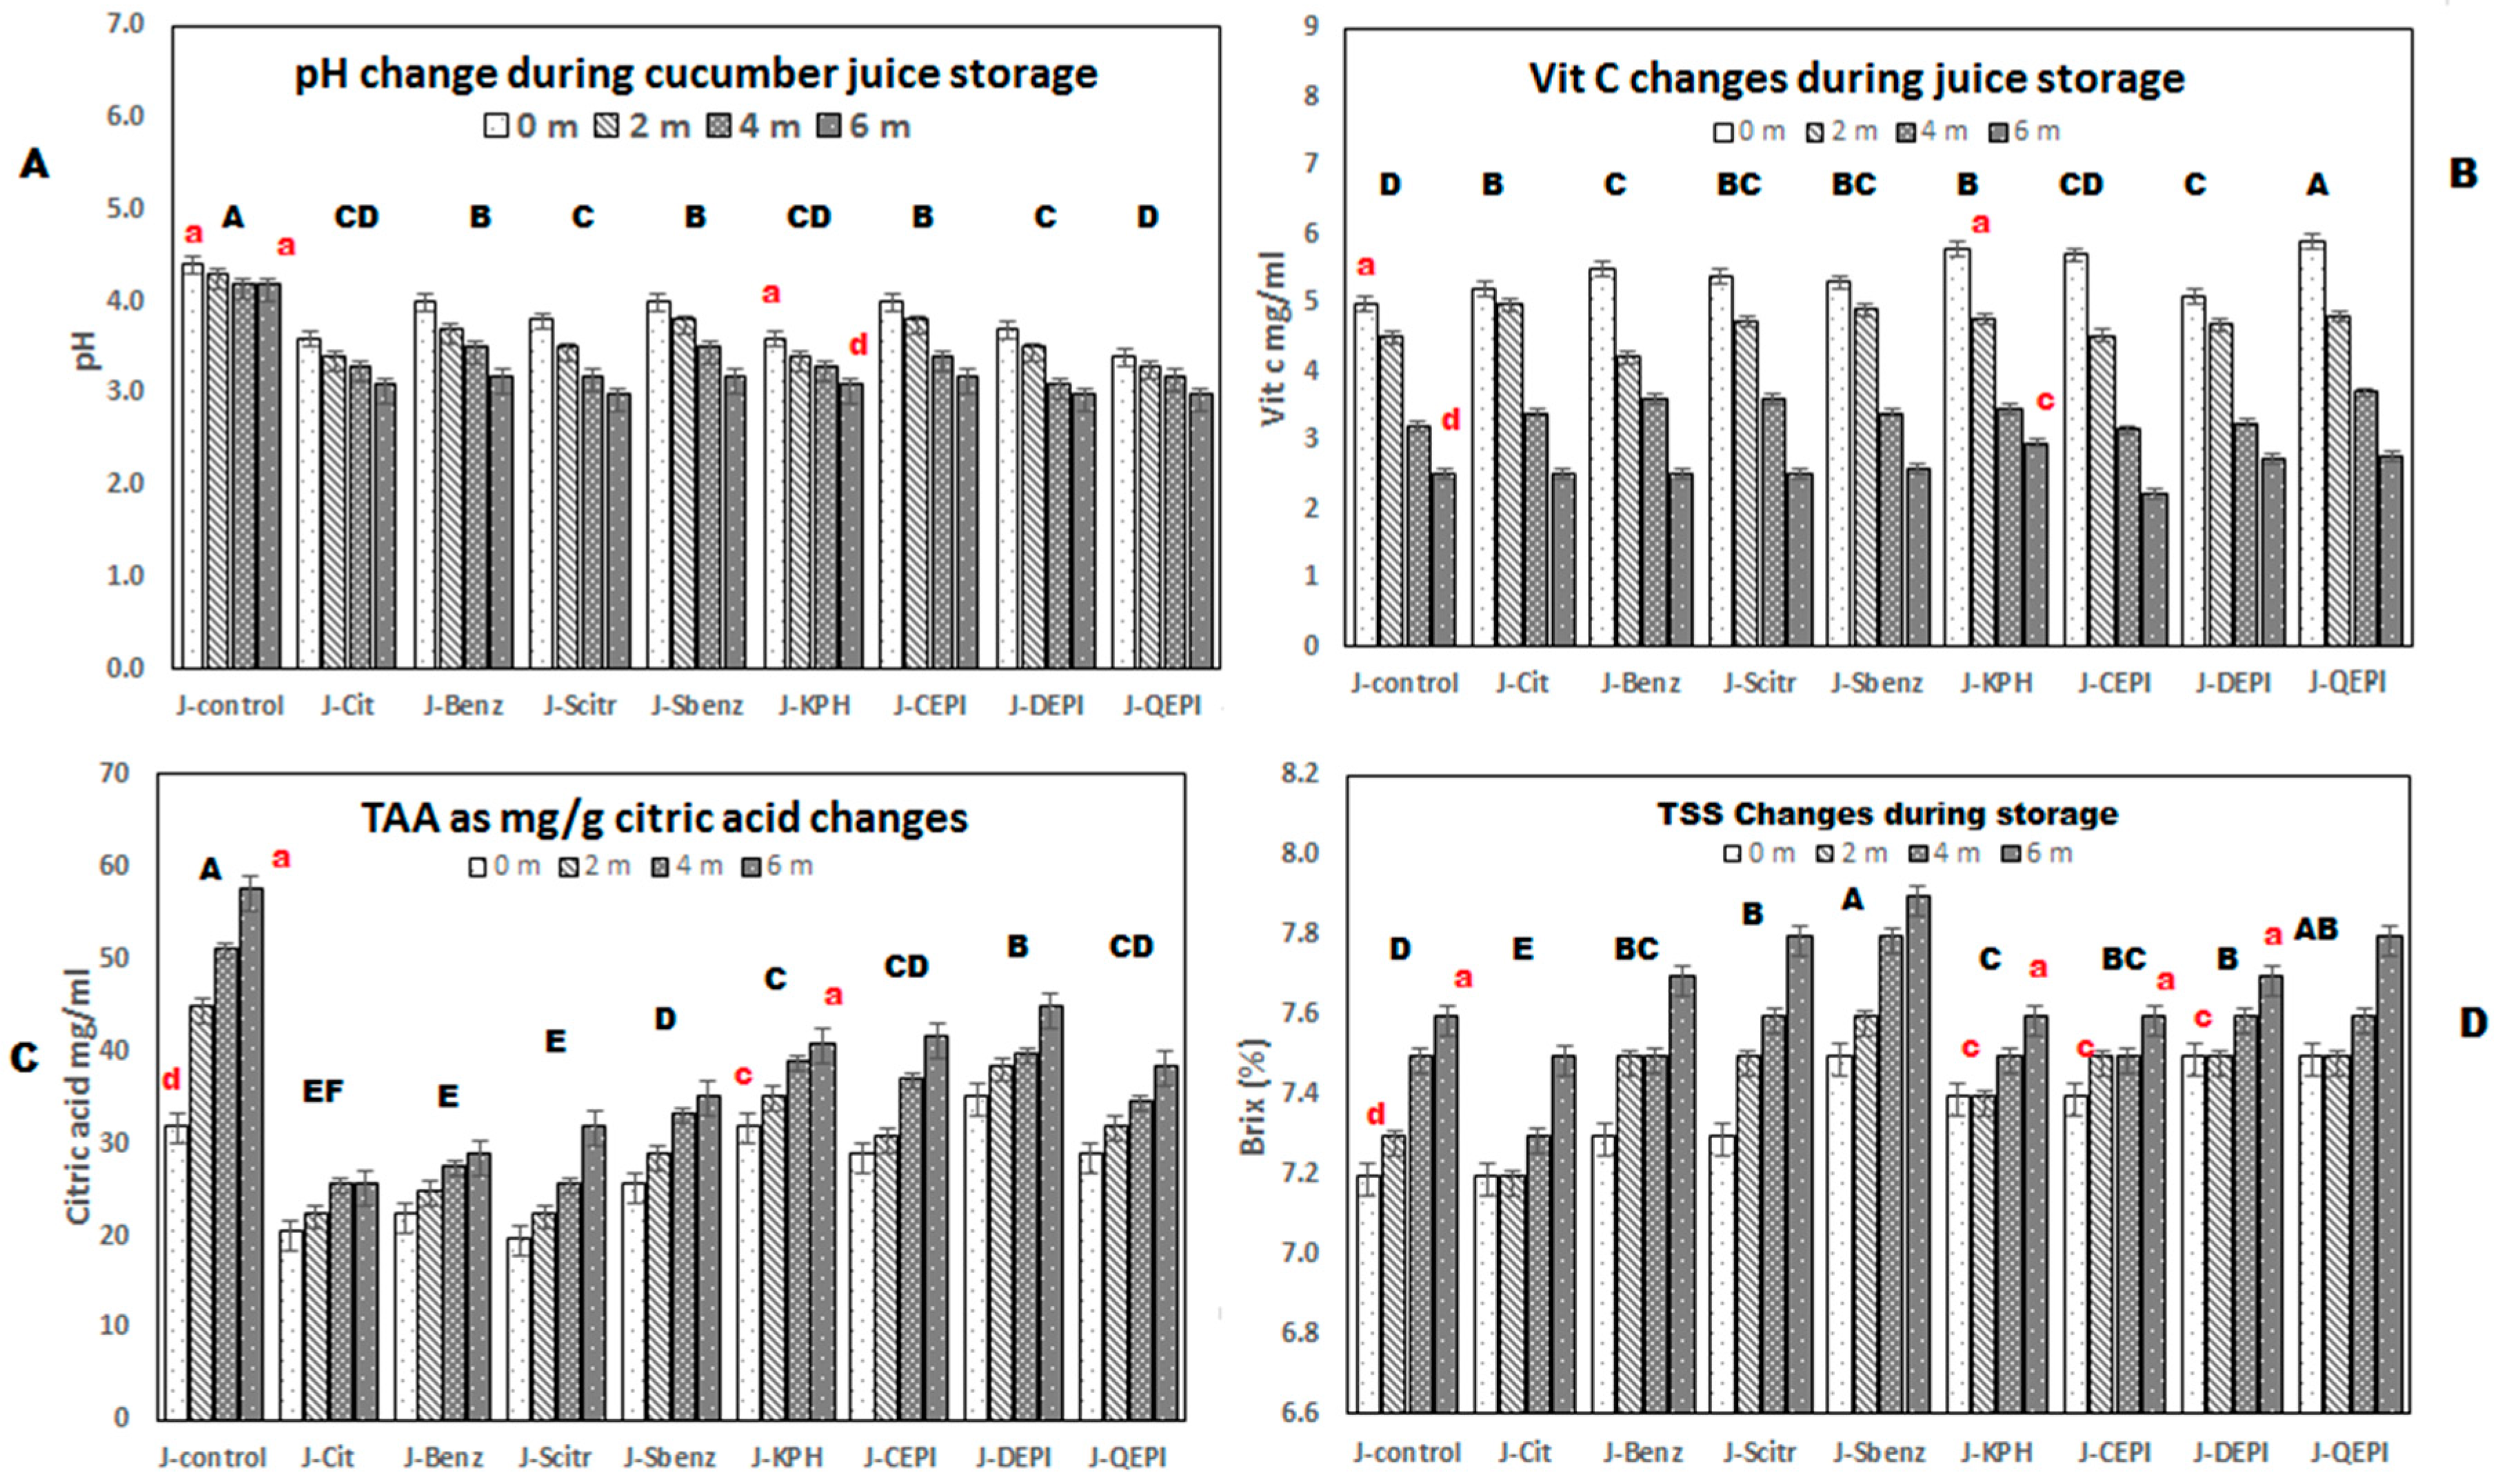
Table 1 shows the juices constitutes by the Abbe Refractometer. The prepared juices were packed into sterilized bottles (350 mL) and divided into four groups, each of which included nine bottles, one for control and the others for juices supplemented with chemical and natural additives. The bottles were capped and tightly sealed and stored at room temperature for six months. The following analyses were carried out at intervals of preservation (0, 2, 4, and 6 months).
2.2.3. Chemical Analysis
Estimation of Physiochemical Parameters
Titratable acidity of juices was calculated as citric acid (mg/mL) at the storage period of 0–6 months, at room temperature, according to standard method 942.15. Additionally, juice pH was assessed for the same samples by pH meter. Total soluble solids (TSS %) was determined by using an Abbe Refractometer (WZS portable refractometer, China). A few drops of the juice were mounted on the tip of the refractometer, and readings were taken [
32]. Vitamin C was determined according to Ranganna [
33]. A total carbohydrate was estimated according to the Chaplin [
34] method. Then, 200 μL of hydrolysate sample and glucose standard (0, 20–100 μg/mL) was added to 200 μL of phenol (5%) and 1 mL of concentrated sulfuric acid. After thirty minutes, the OD was estimated at ƛ 490 nm. The concentration of total sugars in cucumber juices was calculated by using the linear equation in the glucose standard curve:
where y is the absorbance, and x is glucose concentration (μg/ml).
Total Phenolic Compounds (TPC)
Total phenolic compounds (TPC) was assessed in cucumber juices supplemented with chemical preservatives and isolated proteins as GAE (0, 200–1000 μg/mL), following the Folin–Ciocalteu method [
35], according to the equation of the Gallic acid standard curve:
where y is the absorbance, and x is Gallic acid concentration (μg/mL).
Total Flavonoids
Three mL aliquot of 10 g/L AlCl
3 ethanoic solution was added to 0.5 mL of each juice supplemented with chemical preservatives and isolated proteins, the mixtures were then incubated for an hour, at room conditions [
36]. The absorbance was estimated at 430 nm. Total flavonoids in samples was measured as QE (0, 20–100μg/mL), using the quercetin acid standard curve equation.
where y is the absorbance, and x is the quercetin concentration (μg/mL).
DPPH Radical-Scavenging Activity
DPPH radical-scavenging activity was followed in milk samples, as an indicator of antioxidant activity [
37]. An aliquot (100 μL of each sample) was added to 1 mL of 1 mL DPPH in ethanol and incubated at room temperature for thirty minutes [
38], before measuring the color absorbance at 517 nm against a control. The percentage of antioxidant activity of free radical DPPH was calculated as follows:
where
Acontrol is the control absorbance, and
Asample is sample absorbance, i.e., DPPH reaction absorbance.
2.2.4. Color Measurements
The color of cucumber juices was measured by using a spectrophotometer (Hunter Lab, Color Flex EZ’s 45°/0°, Reston, VA, USA). CIELAB system: L* (lightness–darkness), a* (redness–greenness), b* (yellowness–blueness), H (Hue angle), C* (Chroma), WI (whiteness index), and differences values were measured. The instrument was calibrated by using a standard white title: X = 72.26, Y = 81.94, Z = 88.141, L* = 92.46, a* = −0.86, and b* = −0.16 [
39].
2.2.5. Sensory Evaluation
Eighty members (faculty staff and students) from the Food Science Department, Faculty of Agriculture, Zagazig University, Egypt, evaluated the sensory properties of cucumber juices, (control+ eight juice with different additives), using a scorecard for each sensory attributes (color, odor, flavor, taste, and overall acceptability), using a 9-point Hedonic scale, whereby the scores ranged from dislike extremely (1) to like extremely (9) [
40]. The room was illuminated with white light, and each session continued for two hours. Water was provided to each panelist for mouth-rinsing after testing each product, to avoid the carry-over effect.
2.2.6. Microbial Analysis
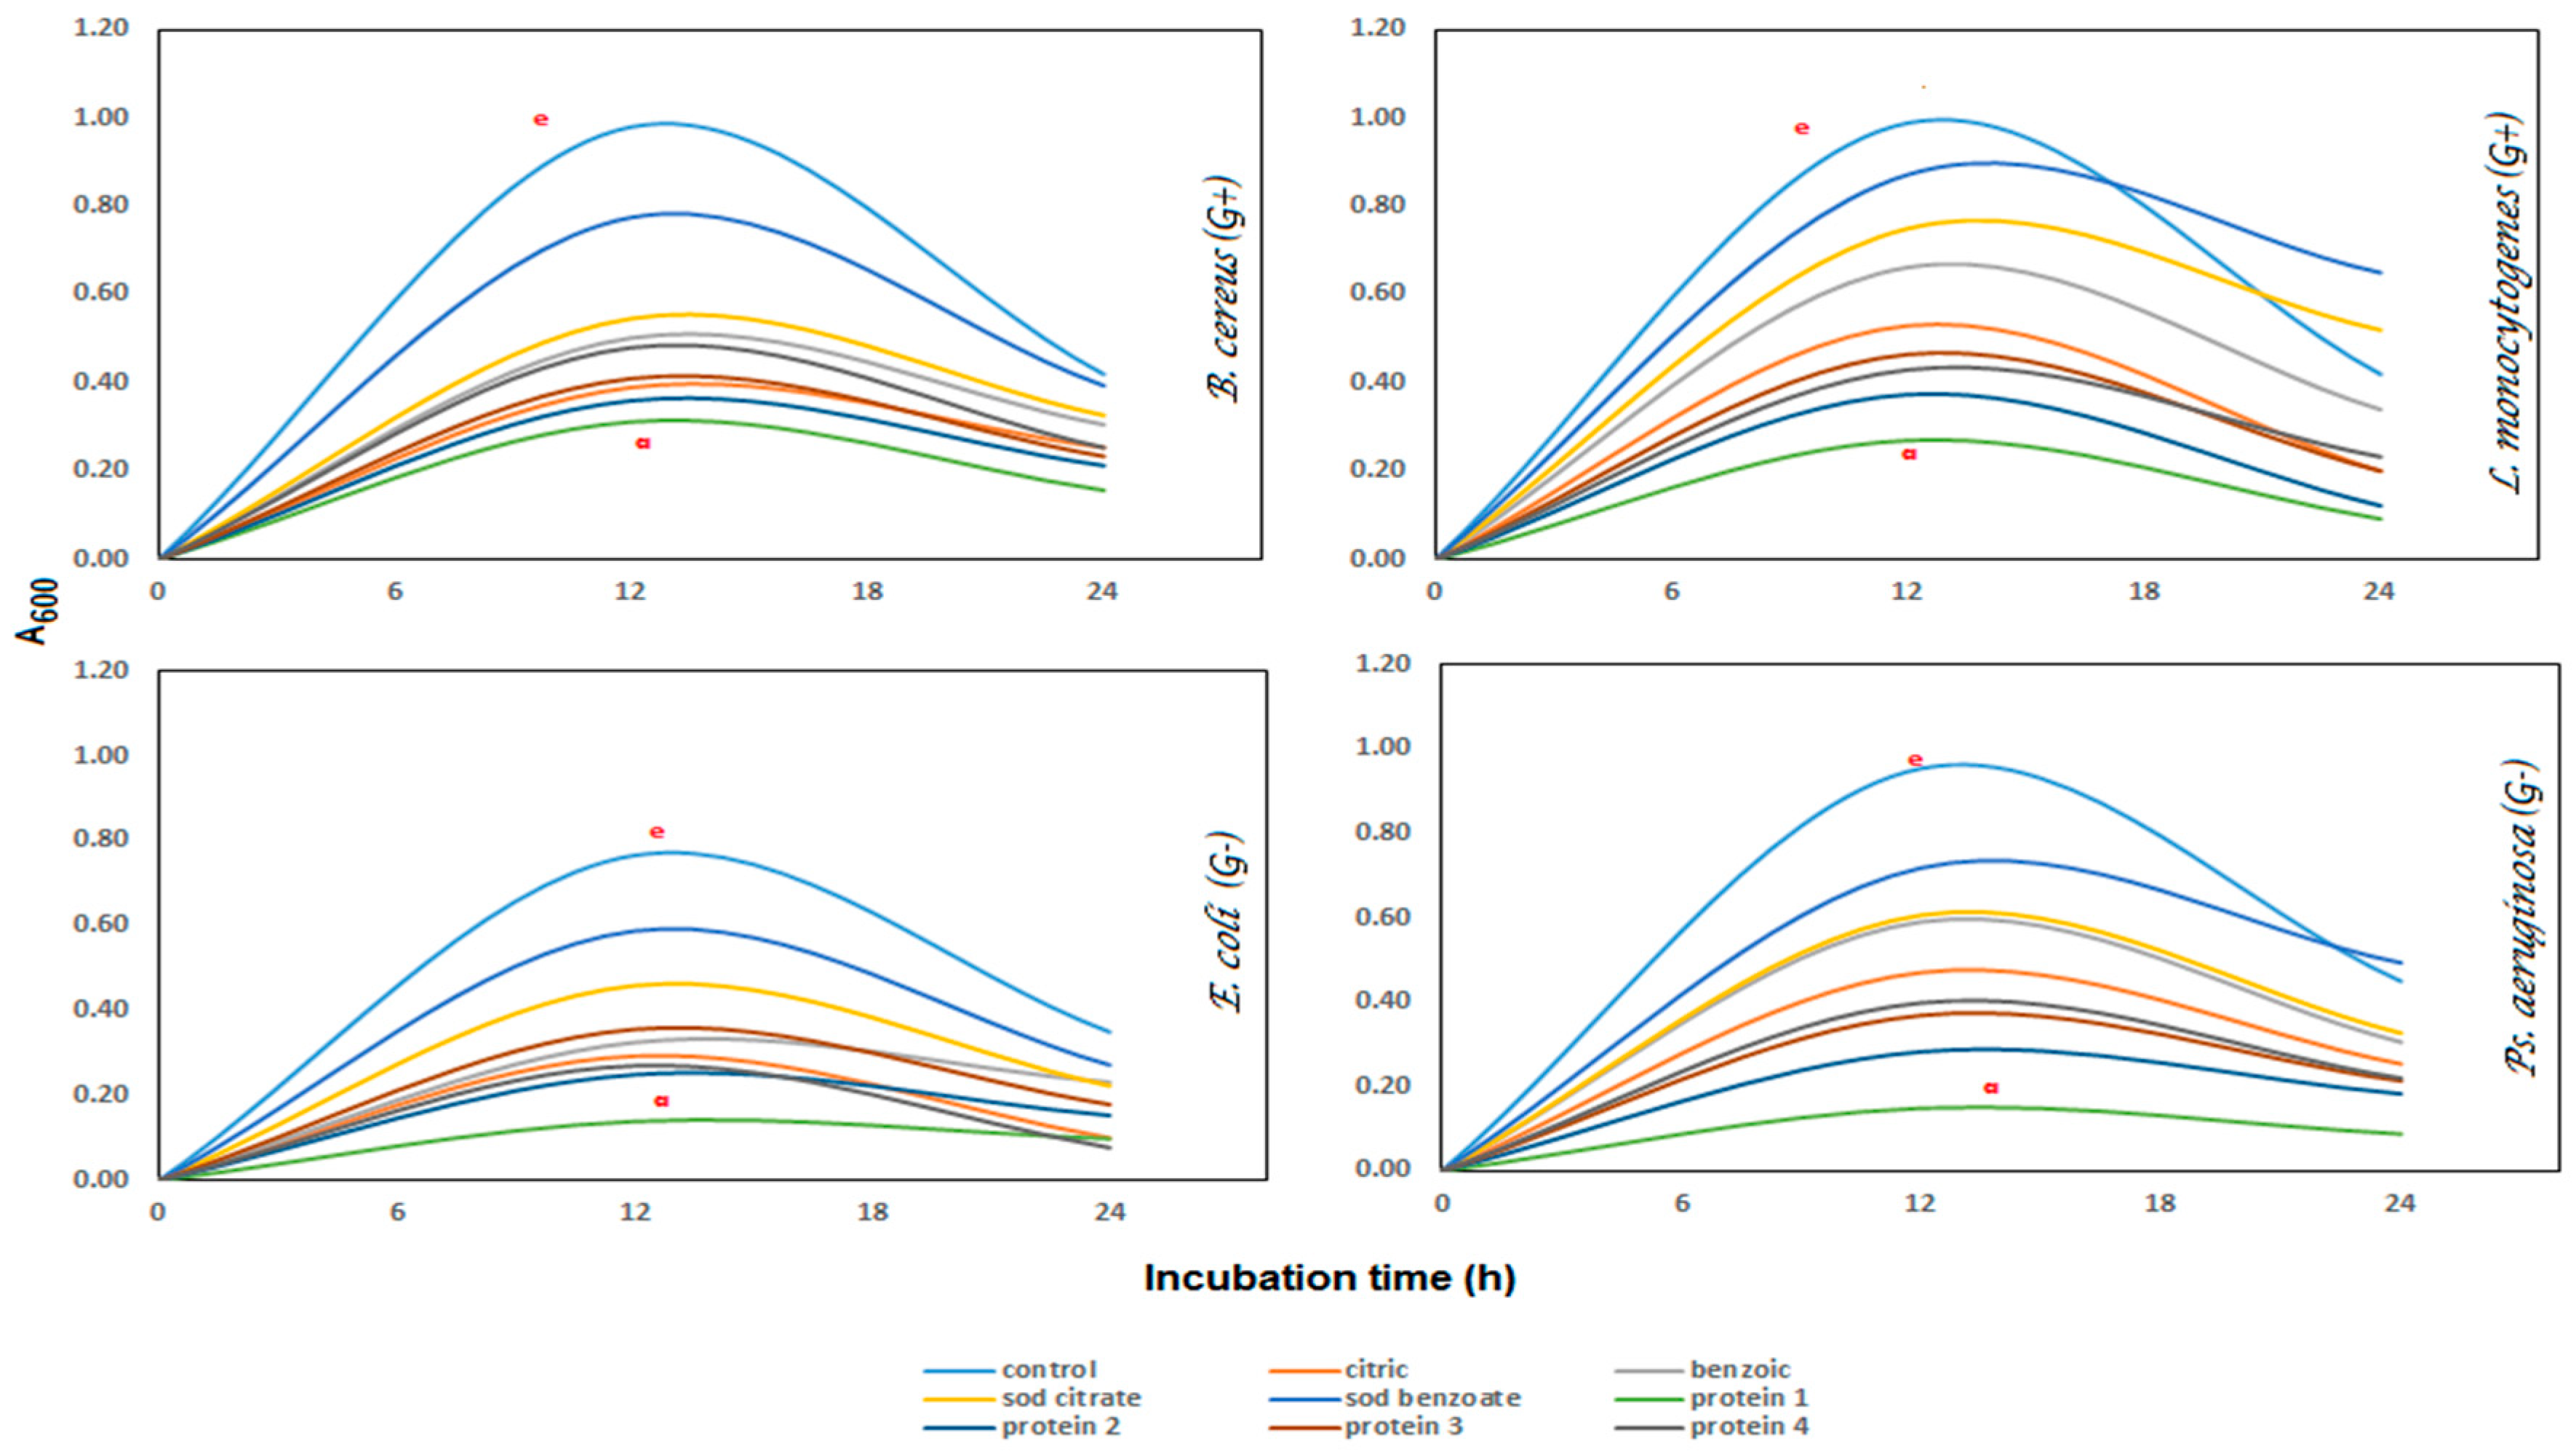
Antibacterial Activity
Antibacterial activity was estimated [
41,
42]. Paper discs saturated with 30 μL of each additive at different concentrations (0, 50, 100, and 200–1000 mg/mL) were then added to Petri dishes containing nutrient agar infected with pathogenic microorganisms,
the G+ bacteria (L. monocytogenes and
B. cereus), and
G− bacteria (E. coli and
Ps. aeruginosa) incubated at 37 °C for 24 h. The developed inhibition zones (mm) were manually measured by using a transparent ruler. The negative control was disc-saturated with distilled water. Minimum inhibitory concentration (MIC) was estimated as the lowest concentration and showed a clear zone on MHA plates.
Turbidity (A600) assay was used to determine the extent of the bacterial growth in nutrient broth media suspensions during 24 h of incubation. The MIC of each sample was added to a tube containing 100 μL of pathogenic bacteria in 10 mL nutrient broth, incubated at 37 °C and measured every six hours, before recording the turbidity compared with control.
Microbial Count
Total viable count and coliform bacterial count in cucumber juices supplemented with chemical preservatives and isolated proteins at 0.2% (
w/
v) were performed during preservation periods (0–6 months), at room temperature, by using the pour plate technique [
43]. First, 1 mL (
v/
v) of the sample was diluted with one-fold of 2% sterile sodium citrate solution, to prepare a suspension. Then, 1 mL of the suspension was used for the serial dilution of between 10
−1 and 10
−5. After that, 1 mL of each dilution was placed in sterile disposable Petri dishes (sterilin) in triplicates. At about 44 to 50 °C, the number of different bacteria was determined by using specified media [
44,
45,
46]. Colon bacteria were counted on MacConkey agar and brooded at 37 °C for 24 h. The total viable count (TVC) on Agar media was counted and incubated at 25 m, for a period of 72 h. Microbiological results were converted to logarithms (CFU/g).
Antifungal Activity
The inhibition action of the chemical and natural additives against three fungal species were obtained from the Department of Agricultural Microbiology, Faculty of Agriculture, Zagazig University, Egypt [
47,
48]. First, 5 mL of each additive, at different concentrations (0, 50, 100, 200, 400, 800, and 1000 μg/mL), was poured into potato dextrose agar (PDA) medium in Petri dishes and then protected at 28 °C for seven days. After 24 h of incubation, mycelia disk (5 mm) was carefully picked from the edge of fungal cultures and placed in the center of each Petri dish containing the additives. The PDA plates without any addition or water were prepared as negative and positive controls, respectively. The fungal mycelium’s radial growth was recorded (cm). The minimum fungal concentration was estimated according to [
49], by inoculating the contents of all the prepared fungi combined with the additives’ concentrations in test tubes, as prepared in case of an MIC test on new PDA tubes. All test tubes were nurtured at 28 °C, for 48 to 72 h.
2.2.7. Statistical Analysis
The obtained data means were statistically analyzed by using Microsoft Office Excel (version 2019) and ANOVA variance single factor, at a probability level of p ≤ 0.05; multiple comparisons were carried out, applying the least significant difference (LSD).
4. Conclusions
The study was able to establish the KBH, and Sod-Benzoate has a significant effect on the lifetime and sensory properties of the treated juice samples. It could be concluded that cucumber juice blended/enhanced with KPH and sodium benzoate (0.2%) was rated higher when compared to other samples. The addition of KBH to the cucumber juice maintained the storage life of the juice for six months, at room temperature, with 50–75 MPa, thus making it an available meal, ready to serve, and a refreshing drink with a good nutritional, medicinal, and caloric value. The results of this research work confirmed both the vulnerability of pure cucumber juice to a microbial attack due to its high moisture content and the preservative potentials of natural additives, especially KBH, because of their antioxidant and antimicrobial activity. It was observed that KBH had two significant roles in the juice samples; that of a flavor (natural) and a preservative. We recommended the utilization of natural additives because of their safety, unlike chemical ones. Finally, this preservation method protected the cucumber crop from spoilage and increased the manufacture of high-quality and valuable juice.

 ,
, 


