Lean, Green and Clean? Sustainability Reporting in the Logistics Sector


1
Department of Marketing & Supply Chain Management, Open University of the Netherlands, 6401 DL Heerlen, The Netherlands
2
Department of Business Administration, MEF University, 34396 Sariyer, Istanbul, Turkey
*
Author to whom correspondence should be addressed.
Logistics 2019, 3(1), 3; https://0-doi-org.brum.beds.ac.uk/10.3390/logistics3010003
Submission received: 30 November 2018
/
Revised: 21 December 2018
/
Accepted: 4 January 2019
/
Published: 9 January 2019
(This article belongs to the Section Sustainability and Reverse Logistics)
Abstract
:Transport and logistics activities contribute heavily to global sustainability problems, yet the implementation of corporate social responsibility and sustainability reporting in the sector lags behind. This paper aims to analyze sustainability reporting in the logistics sector, with focus on environmental, social and economic indicators. An extensive operationalization of sustainability indicators is used to examine and analyze the sustainability reports of 52 organizations in the logistics sector worldwide. Results show that the sector does not agree on the materiality of sustainability indicators. Furthermore, sustainability reporting seems to be incompatible with daily operations, leading to obscurity in reports. This contrast, between the necessary existence of organizations in the logistics sector and their undesirable environmental and social effects, calls for future research into how organizations are coping with this paradox. A viable way forward is needed in order to ensure materiality in the sectors’ efforts toward sustainability reporting.
1. Introduction
The logistics sector is one of the foci of societal and environmental debate due to a broad range of central themes such as its possible contribution to traffic congestion, its emissions of carbon dioxide (CO2) and other pollutants, and, especially from an Eastern European perspective, the growing concern to become “lean and green,” and about social misconduct within its operations. Despite the controversy surrounding the sector, these issues have been addressed in a rather dispersed way and to a limited degree in the academic literature.
The logistics sector plays an important role in today’s globalized business environment [1], yet it also contributes to the world’s most pressing sustainability issues of environmental pressure and climate change [2]. As a result, logistics companies increasingly incorporate Corporate Social Responsibility (CSR) within their operations [3]. Given the tension between contributing to global trade and environmental depletion, and the increasing trend toward sustainability reporting, it could be expected that, by now, logistics firms also have introduced sustainability reporting.
The fact that the Global Reporting Initiative (GRI) released a pilot version of the sector supplement for logistics and transportation as early as 2006 [4], may serve as (potential) indicator for the rising attention to the issue related to logistics. What is interesting, however, are the two apparent gaps in the literature: On the one hand, only 13% of world’s largest Logistic Service Providers (LSPs) produce a formal CSR report and release at least some CSR associated aspects [5]. On the other hand, research on sustainability reporting in the logistics sector seems to concentrate mainly on environmental indicators, and furthermore from a single country or organization perspective [2,6,7,8]. Put succinctly, both the practice of sustainability reporting lags behind in the logistics sector, and the academic attention to the phenomenon seems to be underdeveloped, especially regarding the social sustainability indicators, and, particularly, from a global perspective.
This paper aims to address the first gap, by analyzing sustainability reporting in the logistics sector, considering environmental, social and economic indicators. Further, previous research is often limited to one single country or even one organization, and thus to one type of transport operation. To fill this second gap, the present study takes into account several countries and organizations comprising different types of transport operations. Specifically, the main (research) question addressed in this article is: How do companies in the logistics sector worldwide report on (environmental, social and economic) sustainability issues?
The scope of this study covers sustainability reports contained in the GRI database. Despite the lack of consensus among scholars on sustainability assessment, especially in contested industries (e.g., [9]), GRI-G4 is regarded as a legitimate sustainability reporting standard [10]. A sample of 52 sustainability reports was selected, offering a variety of organizations and countries. The results present a clear overview on which indicators are included (or excluded) in the analyzed sustainability reports. This study offers insight to enrich the academic debate concerning the materiality of sustainability indicators for logistics, while proving clarification on issues related to obscurity in the reports and legitimacy of the sector. Hence, this research contributes to understanding the nature of sustainability reporting and highlights the importance of adopting an integrated approach in the sector, as this need is specifically expressed in the literature (e.g., [11,12]). Logistics is important because it creates value: Value for customers and suppliers of the firm, and value for the firm’s stakeholders (e.g., [13]). With an increasing number of internal and external stakeholders of the firm paying attention to dealing with businesses with environmentally-friendly operations as well as requiring triple bottom line returns apart from securing solely monetary rewards, there is no doubt that sustainability research in the logistics sector will flourish.
The structure of this article is as follows: Section 2 presents the literature review concerning sustainability reporting in the logistics sector. Section 3 outlines the methods and materials of this study. The results are presented in Section 4, following the structure of the selected GRI reports. Section 5 discusses the results of this study in relation to the existing body of knowledge, with specific focus on issues of materiality and obscurity of sustainability indicators. Section 6 highlights the conclusions of the study and presents recommendations for further research.
2. Literature Review
The rise of global supply chains and an increased stakeholder consciousness has led to an increased interest in sustainability [6], influenced by a growing concern of climate change and resource depletion [14]. Consequently, companies are shifting from a conventional economic perspective of business to a more sustainable business model, which involves social, environmental, and economic consternations [7]. This relates to the three common interdependent and interrelated components of sustainability: Society, environment and economy, which are in line with the triple bottom line of sustainability, consisting of people, planet and profit (PPP) as originally coined by Elkington [15,16].
More and more organizations try to develop their own social, environmental, and economic indicators in order to measure, improve, and report their sustainability [17]. Sustainable, environmental, social responsibility or social reporting are interchangeably used terms, which in essence refer to the same phenomenon. Deegan [18] provides a comprehensive definition of social reporting which he defines as the provision of information about the performance of an organization in relation to its interaction with its physical and social environment and includes, among others: (a) interaction with the local community; (b) level of support for community projects; (c) level of support for developing countries; (d) health and safety record; (e) training, employment and education programs; and (f) environmental performance.
Organizations and professional bodies in the 1990s pioneered in the preparation of stand-alone reports, which were initially called environmental reports, then social reports, nowadays known as sustainability reports [19]. Over the years, an increasing number of national and international institutional groups have convened and cooperated to discuss how non-financial information should be reported and to what extent. Among others, the Social Accounting Standards Board (SASB), the Global Reporting Initiative (GRI) [20], and the International Integrated Reporting Council (IIRC) have paved the way in developing social accounting standards and related disclosures for organizations. While originated in the west, sustainability reporting has also become popular among Asian countries such as Indonesia, where companies are interested in following the Sustainability Reporting Award (SRA) organized by the National Center for Sustainability Reporting (NCSR) [21].
While there are companies that are fairly new to the concept of CSR, there are also firms already advanced in its implementation, like companies operating in the highly competitive branch of the transport and logistics sector. In today’s globalized and interconnected economy, the logistics sector plays a crucial role in enhancing the efficiency of domestic and international trade [3]. Thus, logistics is of great importance to globalized companies, as it contributes to the advancement of foreign trade [1]. The GRI released a pilot version of a sector supplement for logistics and transportation in 2006 [4], nevertheless, Piecyk and Björklund [5] conclude that only 13% of world’s largest Logistic Service Providers (LSPs) produce a formal CSR report. This seems to be contradictory with the fact that more than half of the LSPs show CSR related aspects on their corporate websites [5] and with the statement that CSR is becoming of increasingly important to logistics companies, who are said to already be advanced in the implementation as such [3]. Piecyk and Björklund [5] attempt to explain this phenomenon by arguing that the application of CSR within the logistics sector became known just recently, and that CSR principles have not been widely adopted yet.
Recently, the transport and logistics sector has become increasingly important on the green agenda, because of the link of its operations to environmental problems [2]. This as a result of the current technology relying heavily on combustion of hydrocarbons, which leads to higher negative effects of transportation on environmental systems [22]. Consequently, transportation activities have become known as a major cause of emission of harmful pollutants, such as CO2 and nitrogen oxides (N2O). These revive climate disturbance and atmospheric changes, which elicit health risks and are damaging the environments [2]. Not surprisingly, environmental aspects seem to be the most outstanding issues of CSR reviewed in recent academic publications [5,6,23]. However, as previously mentioned, a comprehensive analysis of sustainable business operations should consider environmental, economic as well as social aspects simultaneously [24]. Azevedo and Barros [7], Björklund et al. [6], Garza-Reyes et al. [2], and Hahn and Kühnen [8] evince the gap in academic studies whereby not all sustainability indicators are considered in the research on sustainability aspects in the logistics sector.
Garza-Reyes et al. [2] moreover imply the need for further research on this subject applied to different types of transport operations, such as air, rail, and water transport. Evangelista et al. [23] and Piecyk and Björklund [5] emphasize the scarcity of comparative research on sustainability reporting in the logistics sector among different countries. Both indicate the need for further research on sustainability aspects in the logistics sector, whereby different countries are considered. Lun et al. [25] conclude their research as well with desirability of future research in development of greening capability in the logistics sector. Furthermore, Lam and Dai [14] draw attention to the limited literature available about the environmental sustainability issues of LSPs. However, recently several studies about CSR reporting in the logistics sector have been presented; mostly solely on the environmental aspects of sustainability [2,6]. Björklund et al. [6] therefore suggest future research and deeper investigation to be carried out that includes social considerations, indicators and consciousness related to logistics. Evangelista et al. [23] further emphasize the limitation of research on the environmental aspects of sustainability conducted from a single country perspective and underline the scarcity of comparative research in aspects of sustainability analyzing different countries. Likewise, Piecyk and Björklund [5] indicate a need for further research with regard to CSR reporting among different countries in the logistics industry.
There are different global standards that provide organizations direction on how to report their social, environmental, and economic aspects, such as the GRI and the United Nations Global Compact (UNGC) [26]. GRI is the best-known framework for voluntary reporting of these components by organizations worldwide [27]. The GRI guidelines are nowadays widely accepted for sustainability disclosure on environmental, social, and economic aspects [17], and are acknowledged as the most trustworthy and useful base for sustainable information disclosure [28,29]. More than 40 countries and regions currently reference the GRI-G4 Guidelines in their policies, with more than 24 stock exchanges and market regulators worldwide referring to the GRI Guidelines [30]. There are also numerous studies that have established a link between financial performance and the company’s reporting practices on their social, economic and environmental performance, commonly referred to as “CSR” or “triple bottom line reporting” [31].
The idea of GRI originates from consumers, investors, and shareholders from the years of activism during the 1960s and 1970s in the USA. This grew during the 1990s with the rise of the CSR concept [29]. Subsequently, the GRI was one major organization that developed leading standard and guidelines for CSR reporting. The first set of guidelines of the GRI, named G1, was developed in 2000. The second set of guidelines, G2, was released in 2002. The third set, called G3, was drawn up in 2006. In addition, as an advance to the expected changes toward G4, G3.1 was developed in 2011. Ultimately, in 2013, G4 was released, with a new set of guidelines, such as enhancement of disclosures on governance, ethics and integrity, anti-corruption, and gas emissions [28]. In 2016, the successor of GRI-G4, the GRI-Standards was launched. There are also Citing-GRI guidelines, meaning that organizations make use of GRI’s sustainability reporting guidelines (G3, G3.1, or G4) in their reports, but do not enclose a GRI Content Index. Further, the term “non-GRI sustainability reporting” indicates that the report in question does neither reference or utilize the GRI framework, nor is it prepared according to GRI-Standards or any other type of sustainable corporate responsibility guideline. Reports adhering to the GRI framework cover a wide range of sustainability themes, including economic, environmental and social aspects (http://database.globalreporting.org/register-report). The application of the GRI guidelines used for sustainability reporting is continually expanding [32]. In this study various versions of the GRI framework, such as GRI-G3.1, GRI-G4, GRI-Standards, Citing-GRI, as well as Non-GRI standards are taken into account.
To what extent organizations communicate through their reports, indicates how committed they are to CSR. There can be a multitude of motivational biases for why companies volunteer CSR information to the public. As discussed in Durden [33], various researchers suggest that the goal is often window dressing or business image enhancement, rather than a strong desire to be accountable to stakeholders and presenting a broader range of information [34,35,36]. In their “Rebuttal of Legitimacy Theory,” Guthrie and Parker [37] assert that various rationales have been advanced to explain the phenomenon of corporate social reporting. While there are many theories, the two theories that stand out the most in terms of research are (positive) stakeholder theory and legitimacy theory [38,39,40].
According to stakeholder theory, the corporation’s continued existence requires the support of the stakeholders. Their approval must be sought, and the activities of the corporation adjusted to gain that approval. The more powerful the stakeholders, the more the company must adapt. Social disclosure is thus seen as part of the dialogue between the company and its stakeholders [41]. Legitimacy Theory, on the other hand, is probably the most widely used theory to explain non-financial reporting [39] and has an advantage over other theories in that it provides disclosing strategies that organizations may adopt to legitimize their existence that may be empirically tested [41]. While there are differences between stakeholder and legitimacy theory, they both focus on the nexus between the organization and its operating environment [36]. When this environment is, at the micro-level, engagement with identified stakeholders, a stakeholder approach is suggested as the ‘best’ theory to explain managerial behavior.
Therewith, the strategic integration of CSR in the organization’s business core, influences the communication between the organization and its stakeholders [28]. More and more companies are involved in stakeholder engagement, and have to exhibit responsibility through sustainability reporting [42]. The stakeholder theory acknowledges that organizations have obligations and responsibilities to many parties, both internal and external to the firm, who affect and are affected by the organization [32,43,44,45]. Freeman [43] defines these stakeholders as: “any group or individual who can affect or is affected by the achievement of the organization’s objectives” (p. 46). They consist of shareholders, employees, customers, communities and the environment [45]. These obliged externalities often induce stakeholders to increase pressures on organizations, in order to diminish negative impacts and to enlarge positive impacts [44]. The stakeholder theory looks at CSR as a response to substantial pressures from the organization’s external environment [17]. As mentioned previously, the response to the demands of the stakeholders is necessary for competitive advantage and business survival [46].
Stakeholder theory and legitimacy theory are considered to be the most widely used and prominent theories to investigate the concept of corporate sustainability [32,47,48]. The legitimacy theory assumes that the organization’s operations are desirable, proper or appropriate within certain socially composed systems of norms, values, beliefs, and definitions [32]. The organizations ensure that their activities and performances are accepted by the community [8,17]. They report information on their operations to fulfill the legitimacy gap between social expectations and the organizations operations [17]. According to Adams and Whelan [49], there is similarity between the stakeholder theory and the legitimacy theory. Therefore, both theories should be seen as complementary rather than substitutes. The acceptance of an organization by the community, for instance, is directly linked to the stakeholder thinking with regard to the assumption that companies should operate in the interest of all their stakeholders, not only in the interest of their shareholders [8,43]. Furthermore, stakeholder theory as well as legitimacy theory see the necessity of reporting different sustainability indicators among organizations from different industries [32]. The stakeholder theory recognizes that different organizations have different stakeholders, and the legitimacy, urgency and power of the stakeholders are continuously changing [32,50]. Organizations from different industries have different priorities for different stakeholders. This would imply that, without mandatory reporting requirements, sustainability reports targeted to particular stakeholders would have different indicators than other reports targeted to other stakeholders [50]. Likewise, legitimacy theory views sustainability reporting as part of the organizations overall strategy, to set up and keep up its legitimacy. However, organizations from different industries may be exposed to different expectations from society, which makes it desirable to report different indicators in order to be seen as legitimate [32].
3. Materials and Methods
This study aims to expand the knowledge with regard to the integration and reporting of sustainability indicators by companies in the logistics sector. Different sustainability indicators, in the social, environmental, and economic categories, are explored in the sustainability reports of different organizations in the logistics sector on a global scale. Appendix A provides an overview of the sustainability indicators analyzed in this study.
In order to select organizations that are disclosing their sustainability performance through a formal CSR report, the GRI Sustainability Disclosure Database (published on the website http://database.globalreporting.org/) was used. In identifying suitable organizations, the first selection criterion applied was the limitation of firms operating in the logistics sector only. This resulted in 238 organizations and 974 reports (retrieved 29 December 2017). Sustainability reports are published in various languages and the database also offers a restriction with respect to the language. The limitation for reports solely written in English and Dutch, resulted in 93 organizations. A next selection criterion applied was timeframe: Only recent reports from 2014 onwards were included in the sample. In a subsequent selection criterion, in order to maximize comparability, organization size was included, for which only ‘large’ organizations (GRI category) were selected.
This resulted in the final sample of 52 large organizations who reported at least once since 2014. Thus, the final sample of analysis consists of the following countries/regions (reporting organizations), Africa (8), Asia (18), Europe (18) Latin America and the Caribbean (2), Northern America (3), and Oceania (3). The reports consist of different types of sustainability reporting guidelines: 25 reports are based on the GRI-G4 reporting framework, 18 on Non-GRI, five on Citing-GRI, two on GRI-G3.1, and two on GRI-Standards. An overview of these reporting organizations, including their name, region, country, GRI type and year, can be found in Appendix B.
In order to explore and analyze the sustainability indicators in the reports of the selected organizations, all mentioned sustainability aspects were screened thoroughly in the reports and coded simultaneously in a coding framework based on Appendix A, offering a detailed description and definition for each indicator, thus allowing for uniform and reliable analysis. For each indicator, both the number of the report (organization) as well as a citation from the report was included in the coding framework, allowing for a quantitative (number of occurrence of each indicator in the sample) as well as qualitative analysis (how are indicators mentioned, framed, etc.). Coding was undertaken by one researcher and was validated by two other researchers. Subsequently, the results were further analyzed, after which conclusions about occurrence and possible detected patterns could be made.
The internal validity [51] in this research was supported by the fact that the examined indicators were based on existing literature. Thereby, all indicators were extensively operationalized based upon a substantial body of literature. Most indicators and their operationalization originate from at least two sources (See Table A1 in Appendix A). External validity concerns the generalizability of the results [52]. The external validity in this research was supported through the examination of the sustainability indicators in no less than 52 sustainability reports of different actual organizations in the logistics sector, from all over the world. However, the external validity is limited to just the logistics sector, since organizations from different industries exhibit differences in what material sustainability indicators are [53].
4. Results
This section starts with a clarification of certain ambiguities experienced during the analysis. Subsequently, the results regarding the reported sustainability indicators (social, environmental and economic) are presented, followed by an aggregated view of the indicators.
4.1. Ambiguities and Their Clarification
Clearness of sustainability indicators in sustainability reports has been criticized [27,54]. This research also experienced some ambiguity and non-specificity of sustainability indicators in the investigated reports. These will be elucidated in this section.
The first issue relates to indicator compliance. This research investigates compliance with respect to society, product responsibility, and environment. However, some of the reports only mention ‘compliance to all laws and regulations’ in general terms, but do not indicate to what subjects these laws and regulations exactly apply. In this case, assumed is, that when a category, for example product responsibility, does appear in the report that ‘compliance to all laws and regulations’ relates to this subject as well. In this way, the non-specific items are included.
The second issue is the vagueness concerning indicators related to supplier assessment. This research investigates supplier assessment for labor practices, human rights, impacts on society, and environmental concerns. Nonetheless, some of the reports solely mention the existence of supplier evaluation, without clarifying the specific subject. This is a crucial shortcoming since supplier evaluation could also relate to other subjects, such as the reliability of deliveries. Therefore, reports that did not clarify what areas the supplier evaluation applied to, were excluded from the analysis.
Third, some of the reports contain an appendix referred to as the GRI Content Index, including general and specific standard disclosures. These encompass various sustainability indicators with references to respective page numbers where they can be found in the reports. However, during the research, some indicators appeared to have no reference to a page number or which were defined as ‘not developed’ or ‘not reported’. These indicators are “training,” “investment,” “non-discrimination,” “grievance mechanisms for impacts on society,” and “spills” in report 9. The page references of the indicators “overall” and “environmental grievance mechanisms” in report 12 are left blank. The indicator “products and services” is, according to report 33, ‘not reported’. Finally, the indicators “labor management relations,” labor practices grievance mechanisms,” “supplier assessment for labor practices,” “supplier assessment for impacts on society,” “grievance mechanisms for impacts on society,” “customer health and safety,” and “marketing communications” mentioned in report 36 in their GRI content index, appears to be ‘not developed’. This brings along ambiguity about the existence and integration of these sustainability indicators by these companies. The indicators do appear in the reports, though only in the appendices, without reference to the actual sustainability report of the company. Therefore, it is assumed that these indicators are not integrated by the companies, and thus are excluded from the analysis.
4.2. Results Relating to Social Sustainability Indicators
Social sustainability indicators are further subdivided into the GRI categories ‘labor practices and decent work’, ‘human rights’, ‘society’, and ‘product responsibility’.
4.2.1. Labor Practices and Decent Work
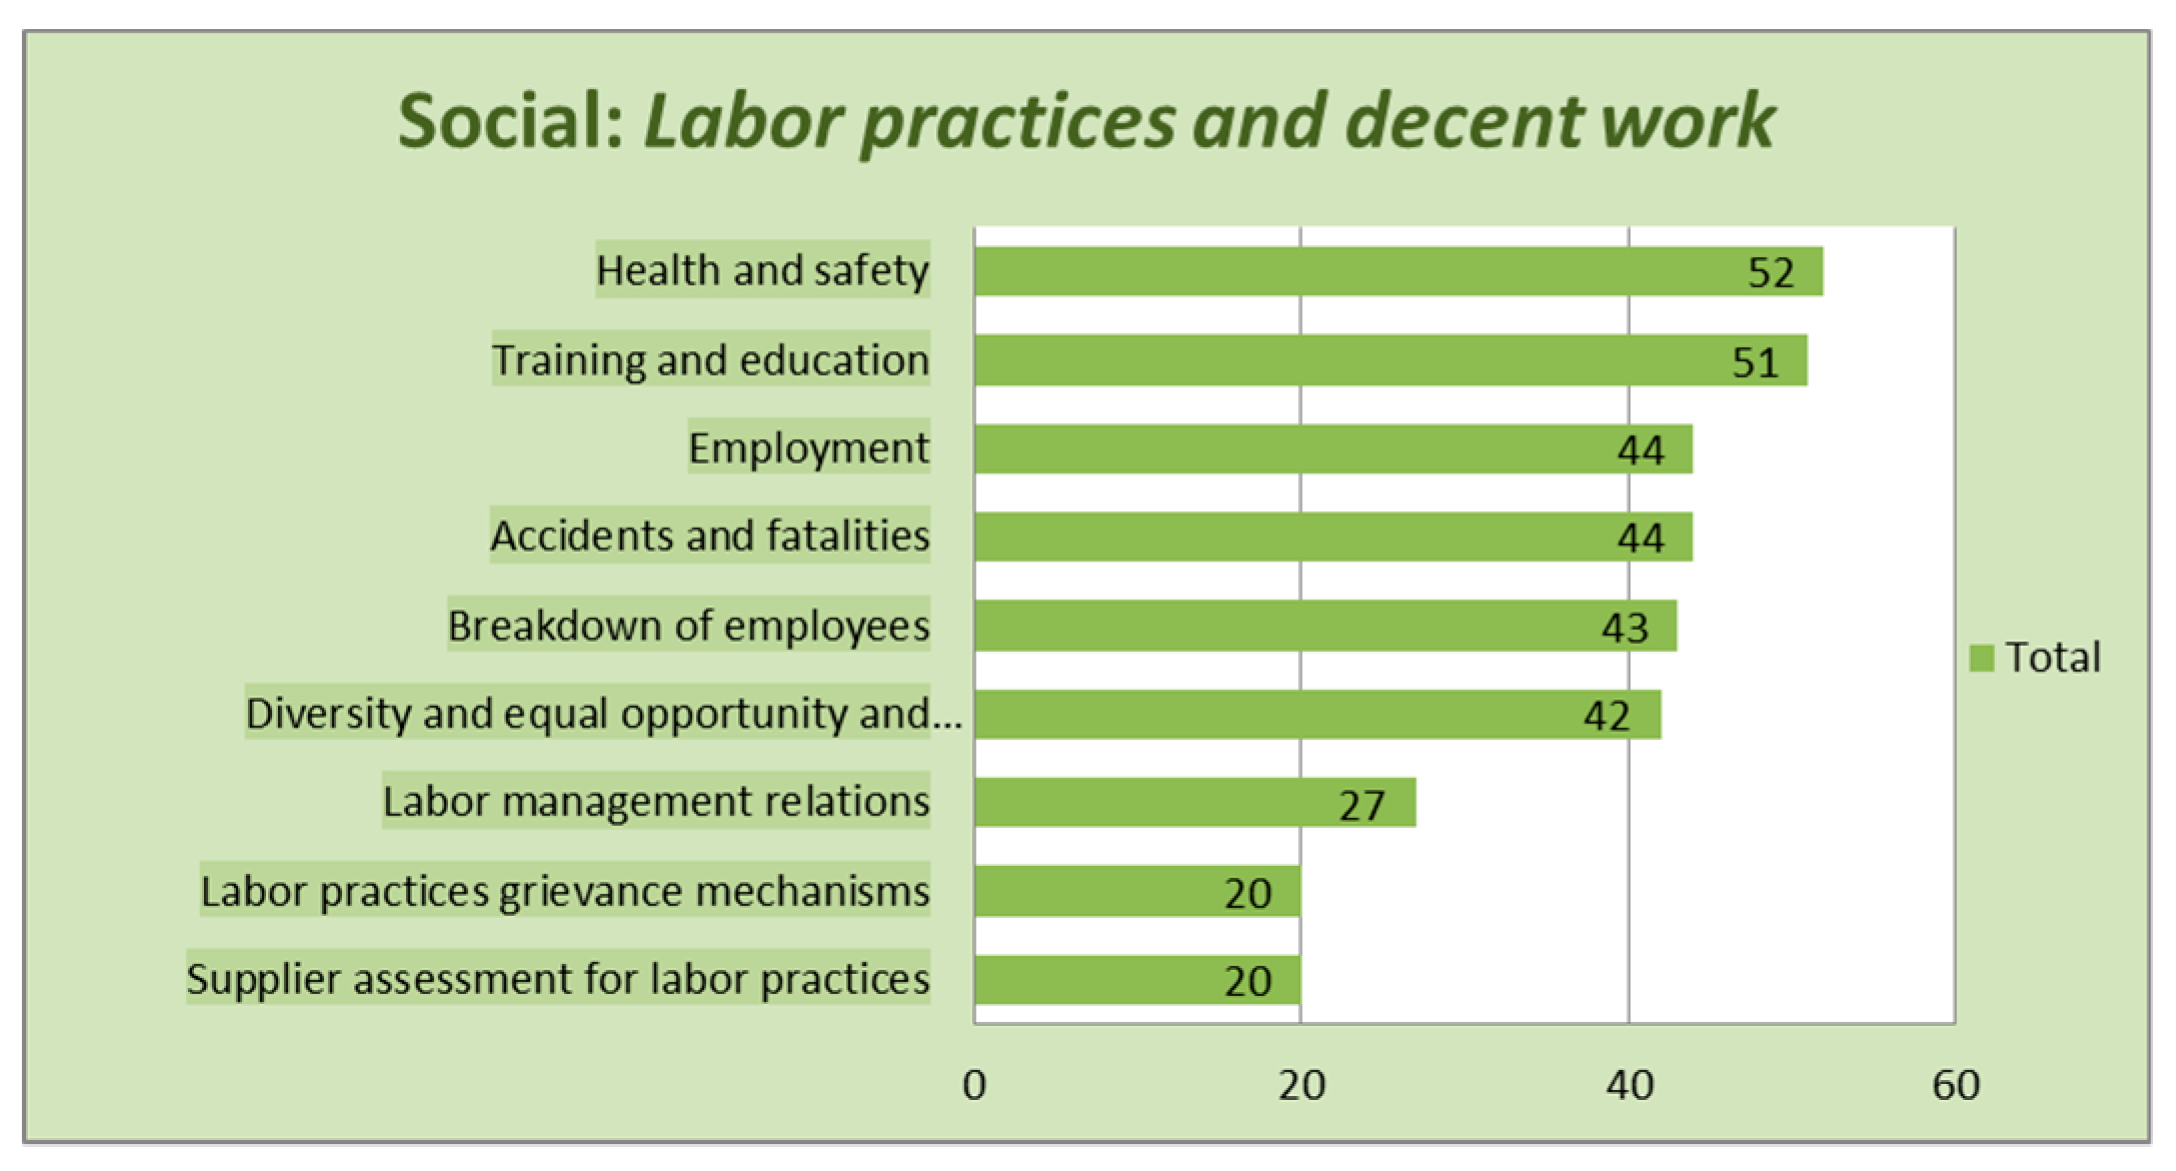
Figure 1 presents an overview of the number of times the sustainability indicators related to “labor practices and decent work” appear. The sustainability indicator “health and safety” appears in all of the reports analyzed. All reports exhibit care for their employees and try to ensure a decent workplace for their workforce through various initiatives. Not all reports reproduce their rates of injuries, but from the reports that did, the number of injuries varies from 7 to 268 injuries per year. Many reports mention safety training for their employees. Like for instance the Westports Holding Berhad reports: “Employees are required to complete mandatory safety training classes that are relevant to their job descriptions.” The organization Tristar received the IOSH (“Institution of Occupational Safety and Health”) Safety Campaign of the Year award. The indicator “training and education” is present in all reports, except for one. The number of hours of training varies quite across the organizations. Aramex, for example, provides continuous on-the-job training to every employee in the company with mandatory courses and employee development courses, resulting in an average of 134 h of training per employee per year, whereas CNCo mentions 5.2 h of training per employee per year. The majority of the reports indicate on average between 15 and 50 h of training per employee per year. The indicators “accidents and fatalities,” and “employment” both occur in 44 of the reports. “Breakdown of employees” follows close with occurrence in 43 reports, just as “diversity and equal opportunity and remuneration,” which is present in 42 reports. “Labor management relations” shows up in 27 reports, and lastly, “labor practices grievance mechanisms,” and “supplier assessment for labor practices” both occur in 20 of the 52 reports. Supplier assessment for labor practices concerns in these reports especially supplier evaluation, whereby about half of the reports mention screening of new suppliers as well. Like Singamas, that has formulated systems such as “Supplier Access Requirements,” and “Standard Management Process for Suppliers,” and simultaneously “regulates the supplier selection process to systematically evaluate and screen new suppliers.” Labor practices grievance mechanisms concerns mainly communication channels, like the V-Connect Intranet service of Bidvest, in order to encourage employees to make complaints. The organizations ACT and Aramex make use of a whistleblowing system, that enables employees to report anonymous any concerns or grievances.
4.2.2. Human Rights
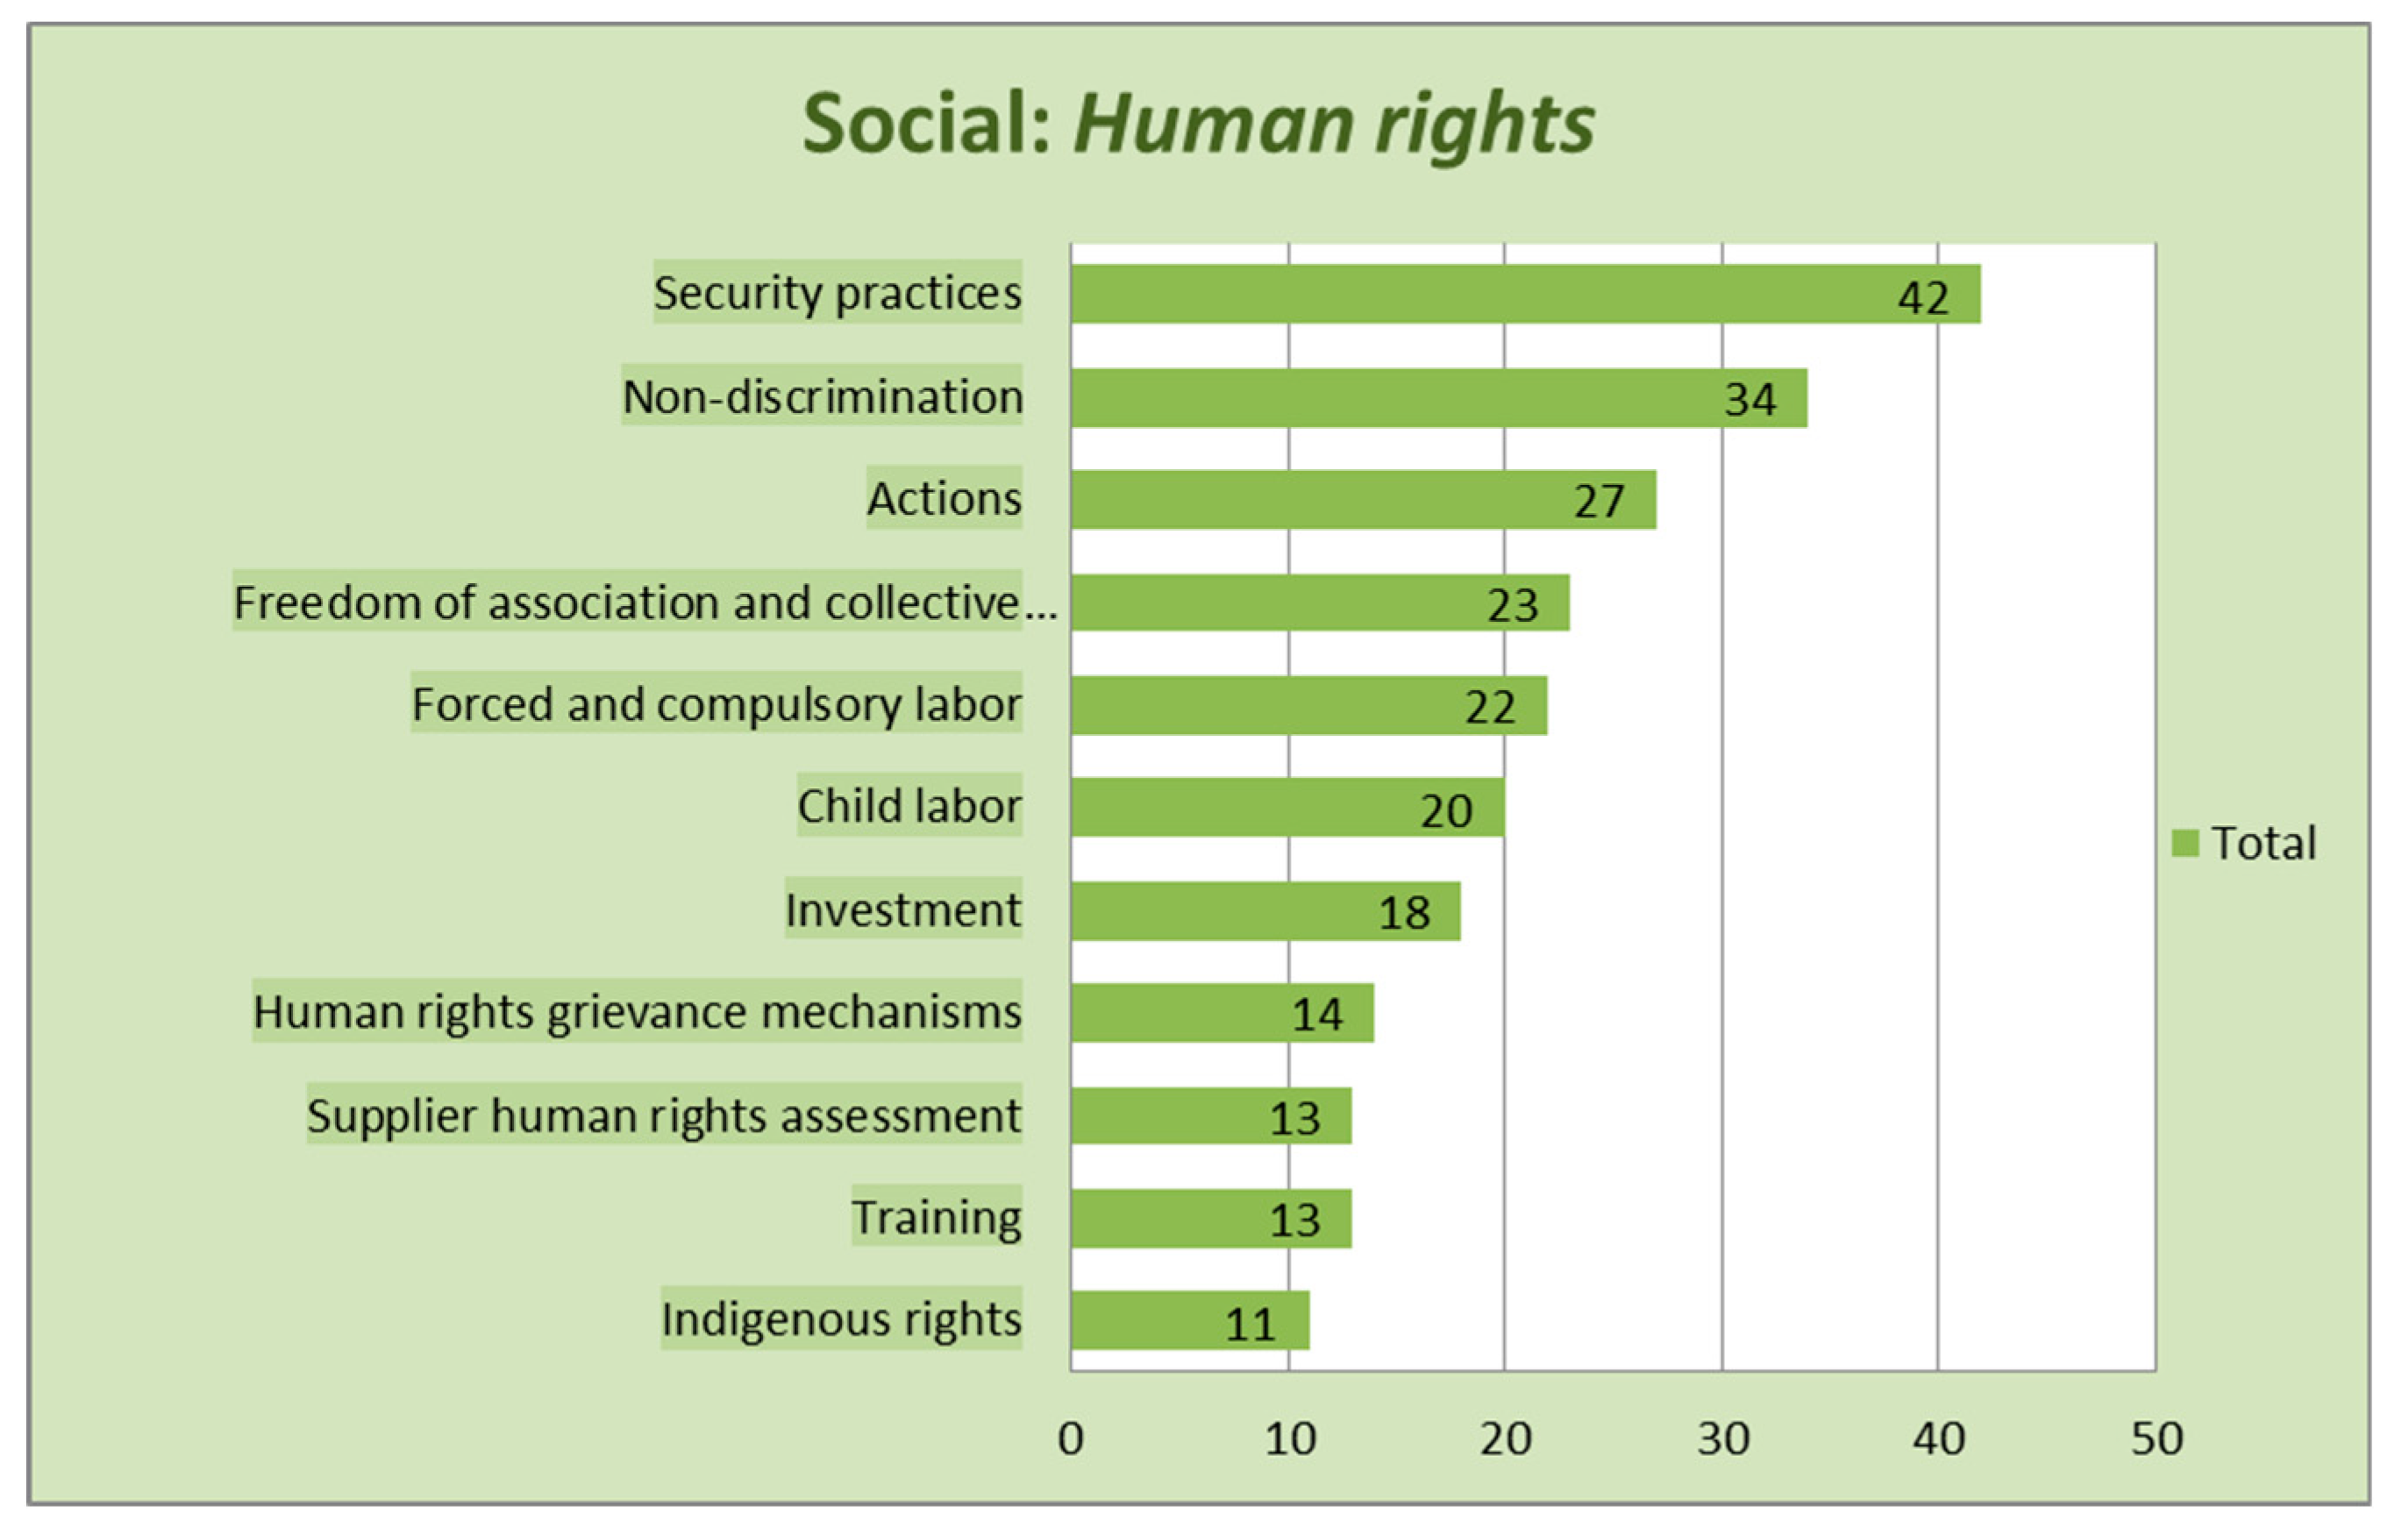
Figure 2 presents an overview of the occurrence of the social sustainability indicators from the ‘human rights’ category. The indicator “security practices” appears in 42 out of the 52 reports. Most of the organizations reporting on security practices, have integrated risk management practices in their company, in which risks proactively are addressed. For instance, China Merchants Bank practices risk management “to strengthen the awareness of risks” and “to identify potential risks through analysis.” Additionally, NCB Holdings uses Enterprise Risk Management (“ERM”) in order to “systematically identify, analyze, measure, monitor and report on risks.” The indicator non-discrimination occurs in 34 reports.
Actions taken regarding human rights appear to occur in about half of the reports. “Freedom of association” and “collective bargaining agreement,” “forced and compulsory labor,” “child labor,” and “investment” are close to each other in terms of occurrence: They show up in 23, 22, 20 and 18 reports respectively. “Human rights grievance mechanisms,” “supplier human rights assessment,” and “training on human rights practices” lie close to each other as well with occurrence in 14, 13 and 13 reports respectively. Finally, the indicator “indigenous rights” is mentioned in 11 reports. These reports exhibit respect for local cultures, as CPR reports: “We provide subsequent cultural monitoring for the purposes of project engagement, preservation and protection. These processes allow us to build a better understanding of “indigenous history and culture.” Care for “native vegetation” is mentioned by Transnet and The Sociedad Portuaria de Santa Marta.
4.2.3. Society
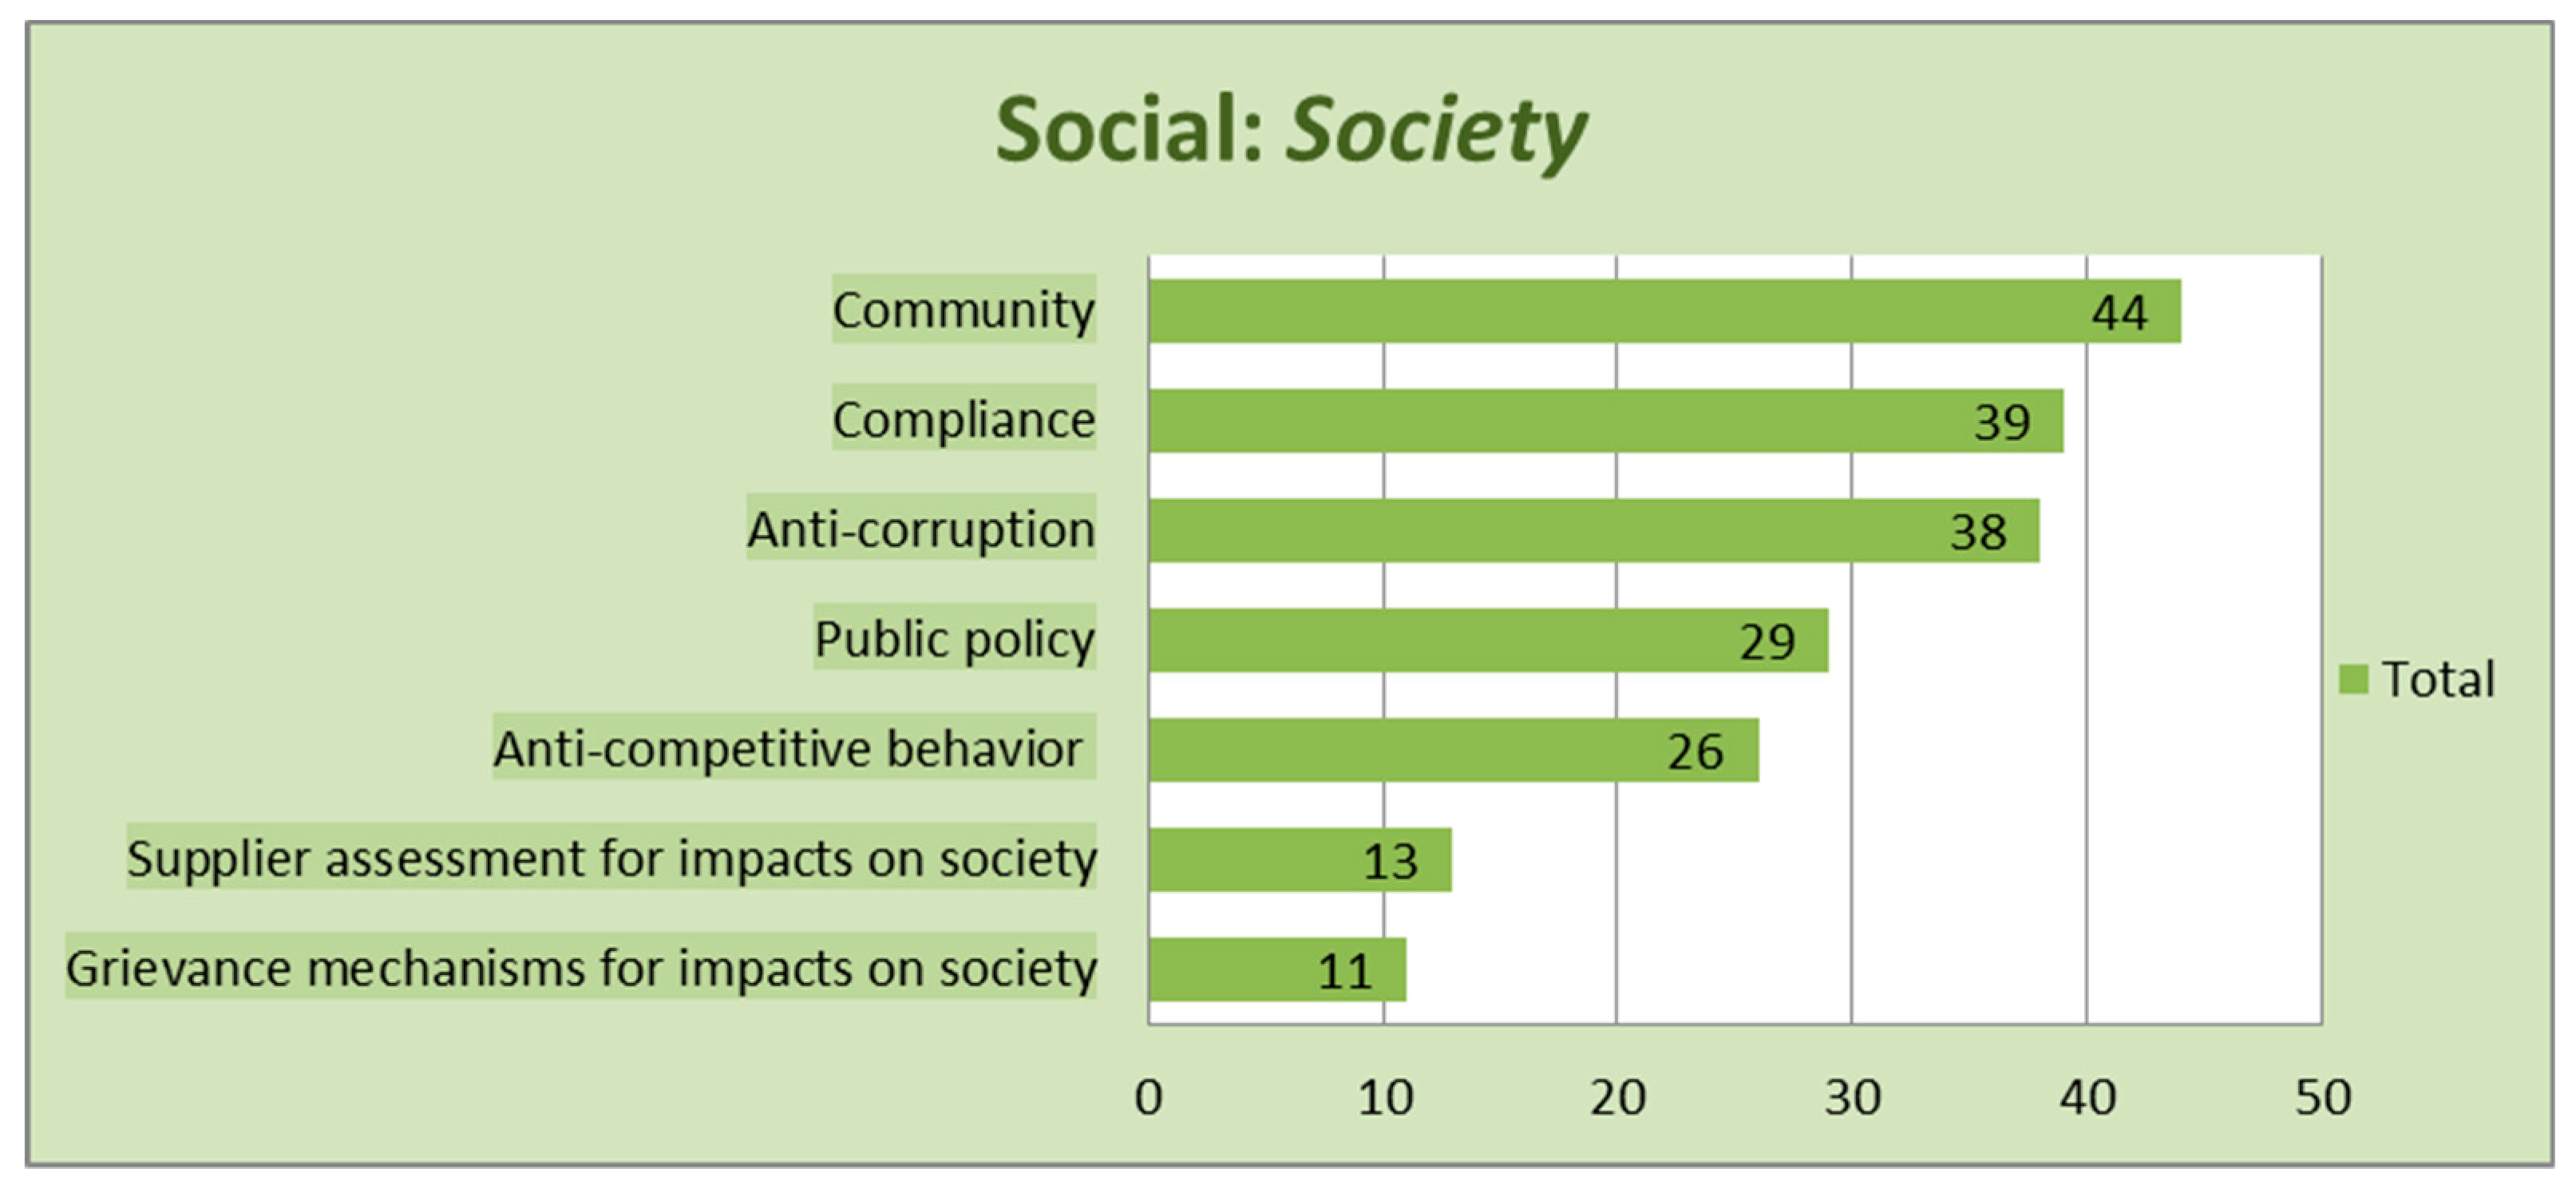
Figure 3 provides an overview of the occurrence of the social sustainability indicators from the ‘society’ category. In this category, the indicator “community” occurs in 44 reports. Most of these companies support multiple community projects. Trencor Limited, for example, provides monetary assistance to the Community Chest Western, financially supports a children’s hospital, and also makes various other donations. The organization CPR implemented a complete program to support a community project. As indicated in their report: “Through our community investment program CP Has Heart, we have helped raise more than $10 million for organizations focused on heart health.”
The indicators “compliance” and “anti-corruption” follow with occurrence in 39 and 38 reports, respectively. Subsequently, the indicators “public policy” and “anti-competitive behavior” occur in 29 and 26 of the reports. The indicator “supplier assessment for impacts on society” occurs in 13 reports, followed by the indicator “grievance mechanisms for impacts on society” that is present in 11 of the reports. These reports mostly mention their number of grievances about impacts on society filed, addressed, and resolved through formal grievance mechanisms. Panalpina reports for example that “In 2015, there were no significant instances of grievances that were filed regarding negative impacts that Panalpina had in the communities where it operates.”
4.2.4. Product Responsibility
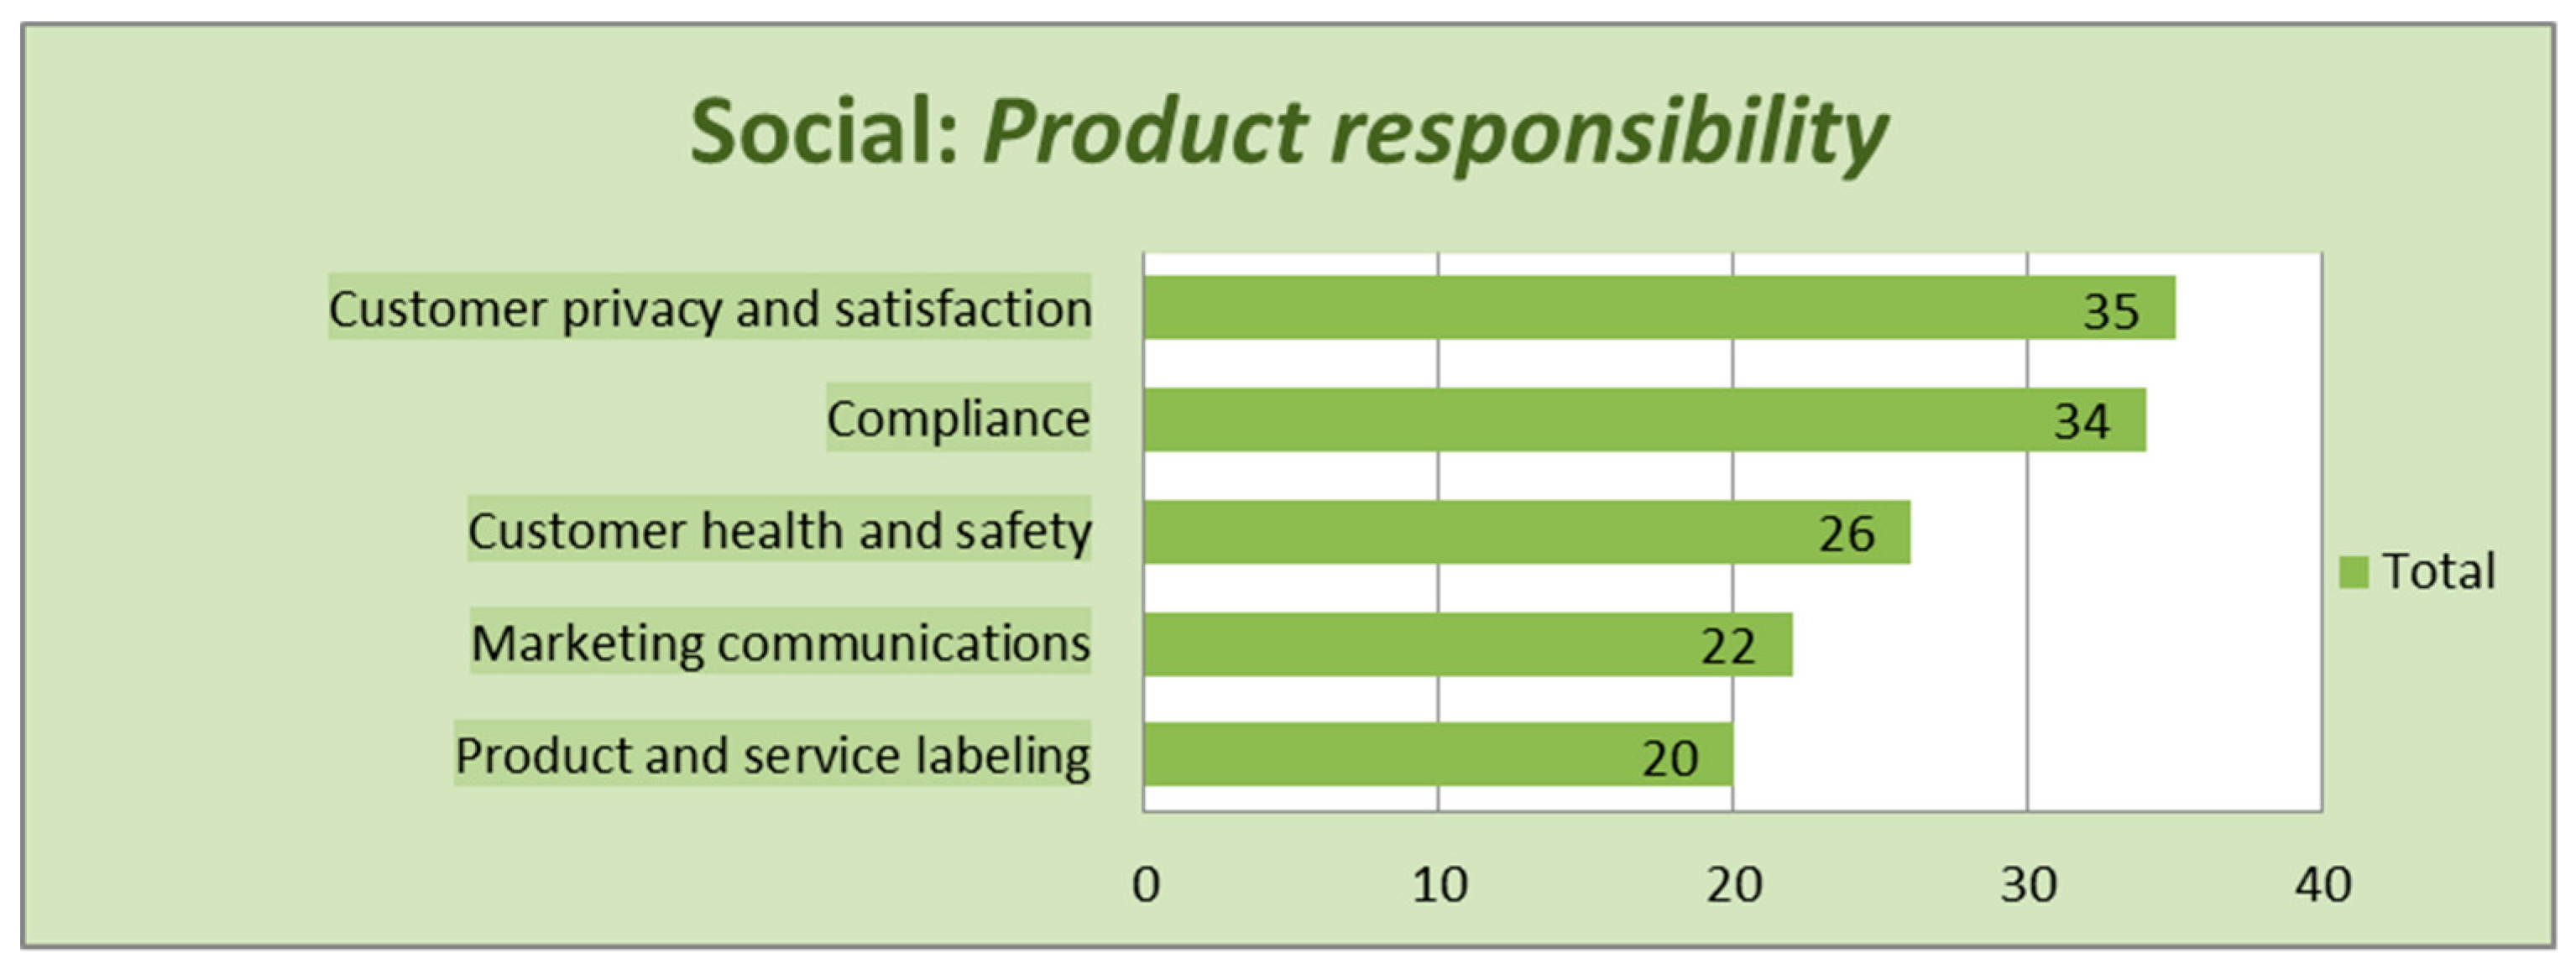
The results of the indicators with respect to the ‘product responsibility’ category are displayed in Figure 4. The indicator “customer privacy and satisfaction” occurs most in this category, as it is reported in 35 reports. The use of customer satisfaction surveys is very popular among logistics companies. Royal Mail, for instance, states: “We survey around 600 business customers and 3000 consumers every month as part of ongoing customer satisfaction research.” Furthermore, they have a privacy policy and they acknowledge the importance of, among others, their customers. China Merchants Bank has built on this a normalized customer satisfaction evaluation mechanism, whereby several matters can be dynamically analyzed, such as their products and service level, detection of disadvantages and weaknesses from customers’ suggestions and advices, and customer satisfaction. The indicator “compliance” closely follows the former with an occurrence in 34 of the reports. “Customer health and safety” is present in 26, “marketing communications” in 22, and “product and service labeling” in 20 of the reports. Product and service labeling concerns the provision of product information. For example, NCB: “strictly follows all requirements regarding labelling for the transport of products according to ISO9001:2008, Halal, OSHAS (Kuantan branch only) and Dangerous goods requirements.”
4.3. Results Regarding the Environmental Sustainability Indicators
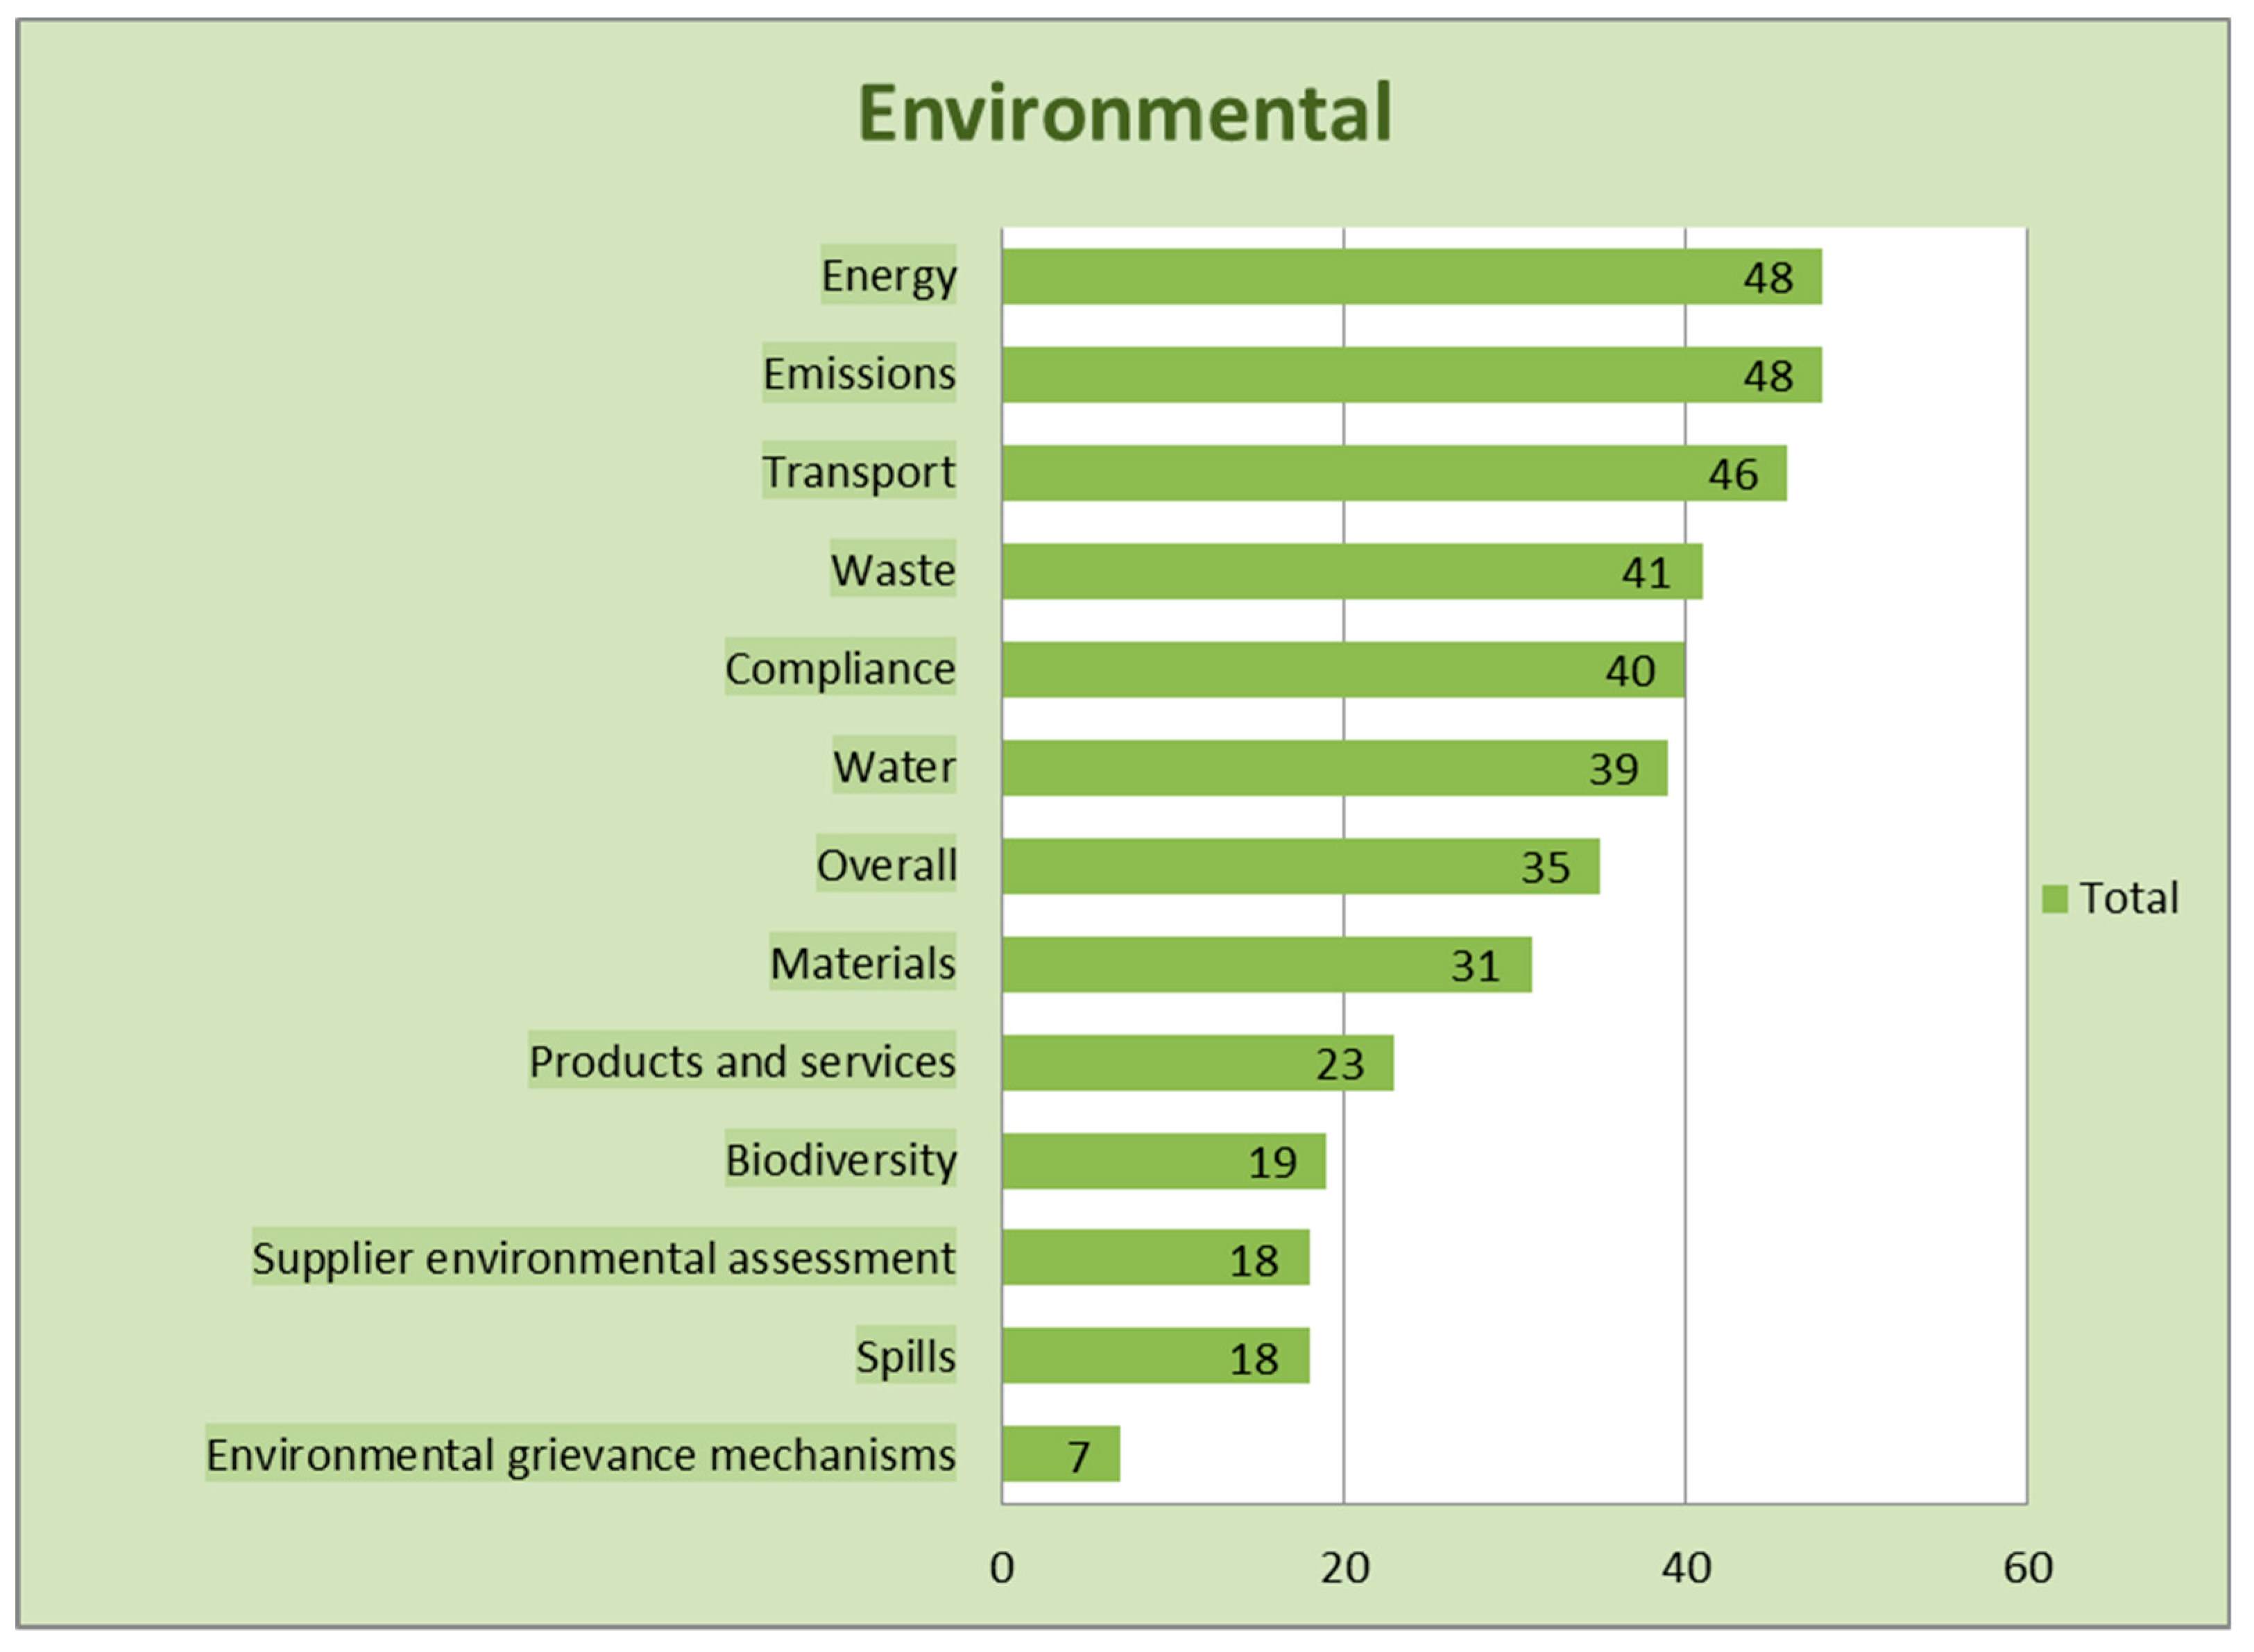
The outcomes of the sustainability indicators concerning the environmental component are presented in Figure 5. Both indicators “emissions” and “energy” occur in 48 of the investigated 52 reports. These indicators are often linked to each other in the reports as well. For example, as the company BEM notes in its report: “In 2016, the company implemented the energy-saving policy to save energy and minimize CO2 emission.” Most of the organizations reporting on emissions provide their emissions rates of CO2, GHG, and several other emissions, such as NOx and SOx. Grieg Star, for example, announces 659,740 metric tons direct and indirect greenhouse gas emissions, 15,700 metric tons NOx, and 3550 metric tons SOx emissions. Reduction of emissions appears to be important to these organizations as well, since most organizations describe their awareness of, and initiatives for, diminishing emissions. With regards to the indicator “energy,” all of these organizations indicate their energy consumption, and some of them mention initiatives for energy reduction as well. The Sociedad Portuaria de Santa Marta, for example, reports on their energy consumption of 17,030,426 kWh in 2014, together with having a program for the efficient use and saving of energy, that is geared to minimize the consumption and give these resources an efficient use. After the indicators “emissions” and “energy,” the indicator “transport” closely follows, with occurrence in 46 reports. “Waste” is present in 41 of the reports, after which “compliance” occurs in 40 reports, and “water” in 39 of the reports. The indicator “overall,” that comprises expenditures on environmental protection, occurs in 35 of the reports. The indicator “materials” is present in 31 of the reports, and “products and services” in 23 of the reports. “Biodiversity” is reported in 19 of the reports, followed by “spills” and “supplier environmental assessment,” which both occur in 18 of the reports. “Environmental grievance mechanisms” occur least of all, in only seven of the 52 reports. These seven organizations report on complaints about environmental impacts, whereby five of them mention their number of grievances about environmental impacts. However, these appear to be zero in all five cases.
4.4. Results Regarding the Economic Sustainability Indicators
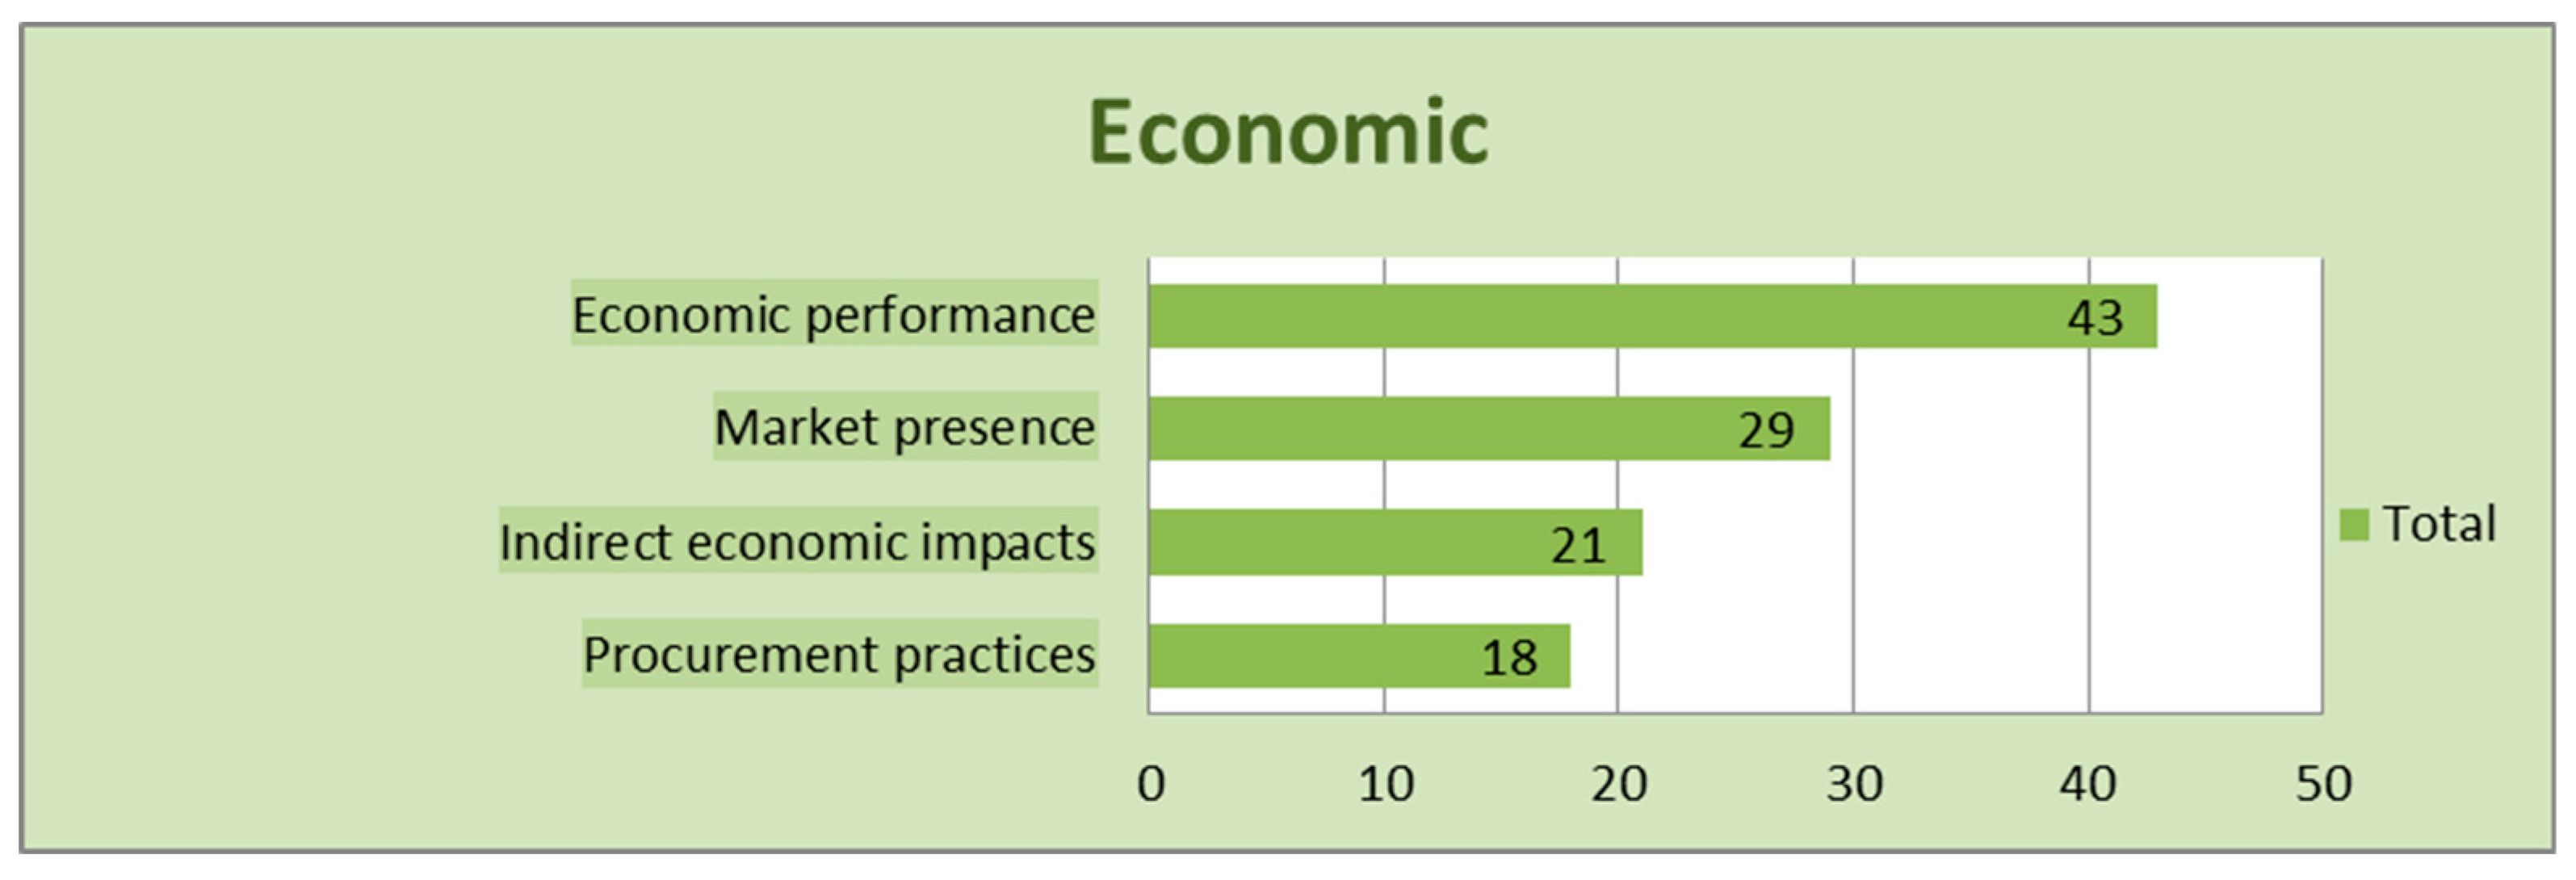
The outcomes of the investigated sustainability indicators concerning the economic component are shown in Figure 6. From the economic indicators, “economic performance” occurs most, in 43 of the 52 reports. In addition to the direct economic value generated, a lot of companies also bring up financial risks in their reports. Bumi Armada Berhad, for example, implemented an overall risk management program because of, as they state: “The Group’s activities expose it to a variety of financial risks: Market risk including currency risk and interest rate risk, credit risk and liquidity risk.” “Market presence” follows with occurrence in 29 reports, after which the indicator “indirect economic impacts” is present in 21 of the reports. The indicator “procurement practices” is included in 18 of the reports. Procurement practices comprise in most reports a procurement policy in which specific procurement guidelines are formulated. For instance, as Konecranes states: “Steel prices are fixed as a normal part of the procurement process.”
4.5. Aggregated Results
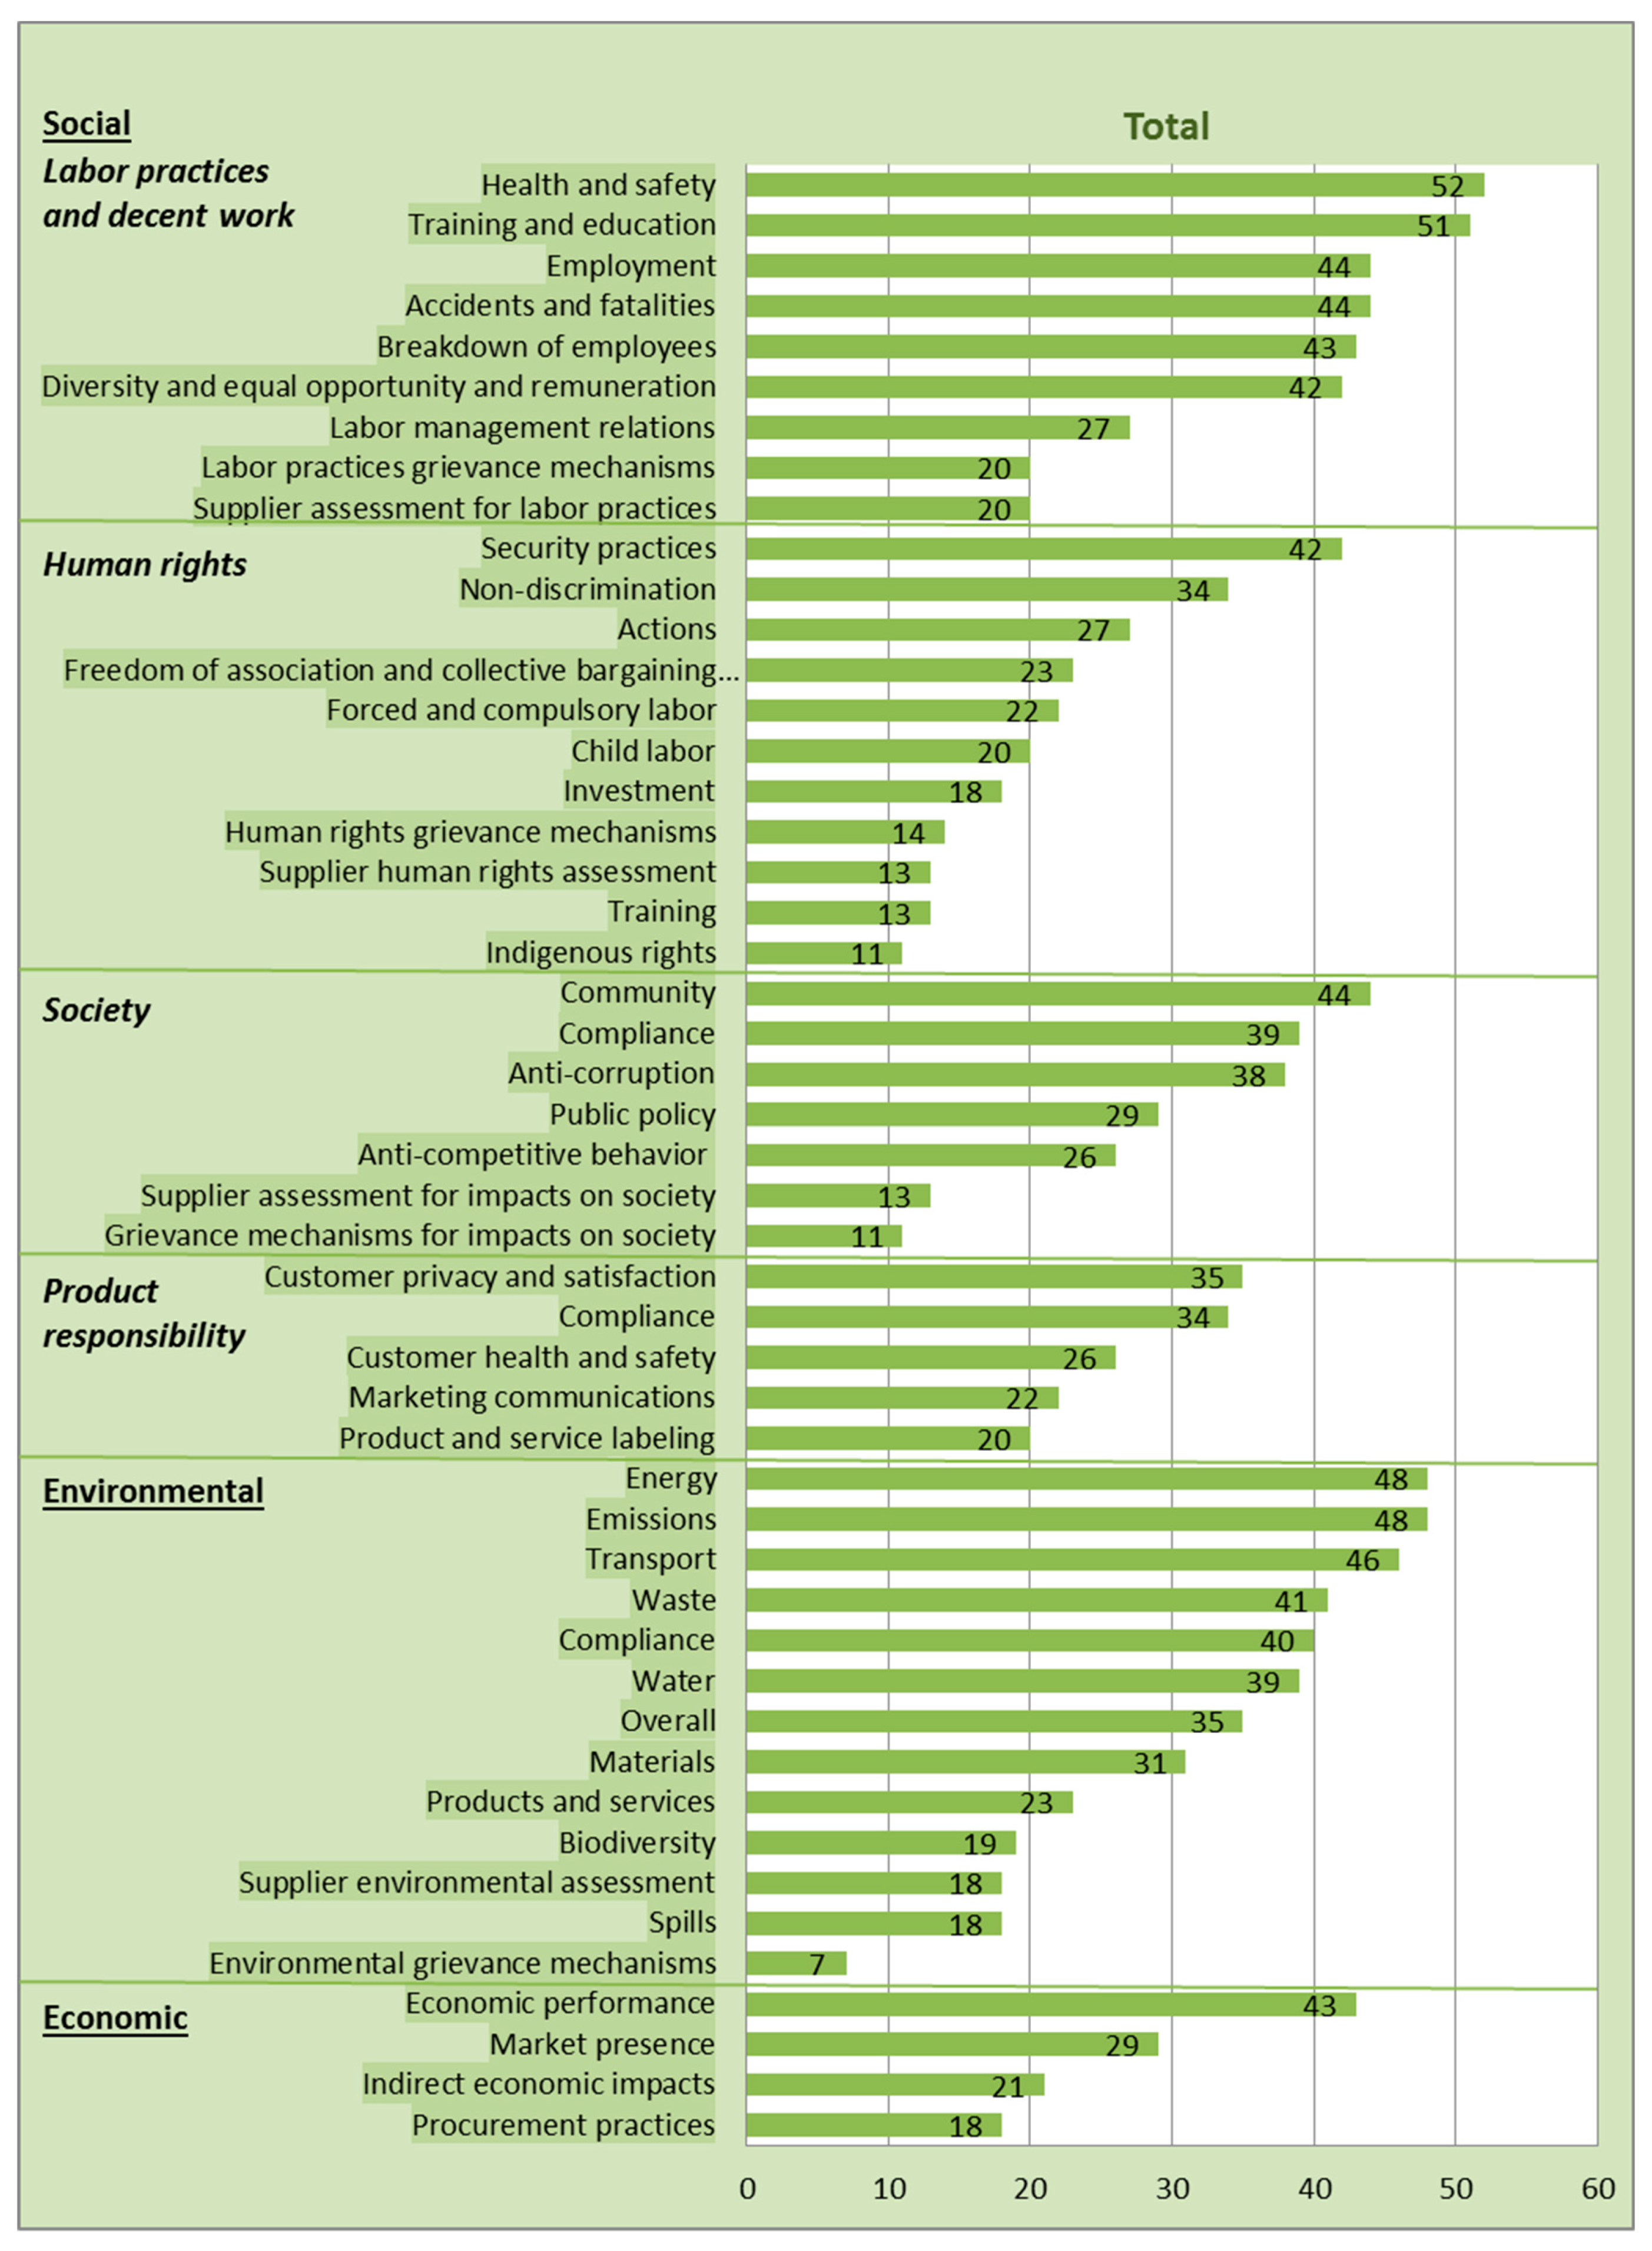
Figure 7 provides an aggregated overview of the appearance of all sustainability indicators in the reports. In terms of aggregated results for the occurrence of indicators in the reports, it is clear that “health and safety,” from the social subcategory labor practices and decent work, is the only indicator that occurs in all of the reports. The indicator “training and education” follows closely, with one exception where the indicator is not present. These indicators are followed by three environmental indicators: “energy,” “emissions,” and “transport.” Subsequently, there are several indicators from different categories close to each other: “Employment,” “accidents and fatalities,” “community,” “breakdown of employees,” “economic performance,” “diversity and equal opportunity and remuneration,” “security practices,” “waste,” “environmental compliance,” “society compliance,” “water,” and “anti-corruption”; which occur in 38 to 44 of the reports. The indicators “customer privacy and satisfaction,” “overall,” “non-discrimination,” and “product responsibility compliance” occur in 35 or 34 of the reports. The indicator “materials” occurs in 31 of the reports. The indicators “public policy,” “market presence,” “labor management relations,” “human right actions,” “anti-competitive behavior,” and “customer health and safety,” are present in 26 to 29 of the reports. The following group of sustainability indicators occur in 18 to 23 reports: “Freedom of association and collective bargaining agreement,” “products and services,” “forced and compulsory labor,” “marketing communications,” “indirect economic impacts,” “labor practices grievance mechanisms,” “supplier assessment for labor practices,” “child labor,” “product and service labeling,” “biodiversity,” “investment,” “supplier environmental assessment,” “spills,” and “procurement practices.” “Human rights grievance mechanisms” is present in 14 reports. “Supplier human rights assessment,” “human rights training,” and “supplier assessment for impacts on society” occur in 13 reports. “Indigenous rights and grievance mechanisms for impacts on society” are present in 11 reports. Lastly, “environmental grievance mechanisms” occur in seven of the reports.
Overall, the social subcategories “labor practices and decent work” are covered in nearly all sustainability reports. From the social sustainability component, this category could be considered as internally oriented, whereas the categories “human rights,” “society,” and “product responsibility” are to a greater extent externally oriented. It is striking that the internally oriented category is much more reported on than the other three, more externally focused, categories. Even six of the nine social sustainability indicators from the subcategory labor practices and decent work are present in 42 or more reports, while from the subcategory human rights just one of the 11 indicators occurs in this amount of reports. From the category society, also one of the seven indicators is present in 42 or more reports, and from the category product responsibility even none of the five indicators do occur in that amount of the reports. From this last subcategory, however, it is remarkable that customers appear to be more material than the products and services themselves, and their merchandizing. That is, the indicators “customer privacy and satisfaction,” and “customer health and safety” is present in more reports than the indicators “product and service labeling” and “marketing communications.”
Noticeably, “environmental grievance mechanisms” are little reported by the investigated organizations, while the “grievance mechanisms of labor practices,” “human rights,” and “impacts on society” do occur more often. “Grievance mechanisms of human rights” is present in twice as many reports, and “grievance mechanisms of labor practices” in even nearly three times as much as the “environmental grievance mechanisms.” However, generally speaking, indicators concerning grievance mechanisms as well as supplier assessment (both applying to labor practices and decent work, human rights, society, and economic) do not occur often.
Finally, from the economic sustainability component, the indicator “economic performance” is by far reported the most. This indicator is internally oriented, while the more externally oriented economic indicators “market presence,” and “indirect economic impacts” appear to occur less. However, the indicator procurement practices, internally oriented as well, occurs most infrequently from the economic component.
5. Discussion
5.1. Materiality of Indicators
GRI developed the materiality principle for its reporting standards [55]. It is assumed that organizations in the same industry show compatible patterns of what they consider to be material sustainability indicators, that are important to be disclosed in order to enable informed decisions concerning the company [56]. This would mean that the reports investigated in this research, which are all based on organizations in the logistics sector, should mostly agree on which indicators they report and which not. It appears that the organizations do pretty much agree concerning 14 indicators: 13 indicators occur in more than 40 of the reports, and one indicator (“environmental grievance mechanisms”) occurs in just seven reports. With respect to the indicators health and safety, and training and education from the social component labor practices and decent work, the investigated organizations exhibit even a very strong compatible pattern of materiality, since these indicators occur in, respectively, 52 and 51 of the reports. However, the remaining 35 indicators are present in the middle category, that is in 11 to 40 of the reports. Thus, concerning more than 70% of the indicators, the investigated organizations in the logistics sector do not exhibit compatible patterns of what they value as material sustainability indicators. Although this is contrary to the findings of Farooque and Ahulu [17] and Eccles et al. [53], who both pointed out the differences in materiality of sustainability indicators across industries, and hereby the tendency of organizations in the same industry to show compatible patterns in sustainability reporting, it confirms the observations of Piecyk and Björklund [5] with regard to the existing obscurity and uncertainty about what sustainability indicators should be reported on. Developing sector-specific guidelines on sustainability indicators could enhance clarity and stimulate compatible reporting patterns with regard to material sustainability indicators.
Regarding the appearance of specific indicators in the sustainability reports, this study found that the indicator “health and safety” is present in all reports of the investigated organizations. “Training and education” is enclosed in all of the reports, except for one. All other indicators from this subcategory occur less often. Hence, the findings of Piecyk and Björklund [5], Farooque and Ahulu [17], and Calabrese et al. [57] regarding this category are confirmed by the results found in this research. Results differ however concerning the human rights category, more specifically regarding the term “investment.” Calabrese et al. [57] and Farooque and Ahulu [17] found that investment occurred most frequently, and in the research of Piecyk and Björklund [5] investment also appeared to be mostly reported on from this category. However, these three sources did not define the term investment. The operationalization of investment in this research is based on articles from Farooque and Ahulu [17] and Yira [58]. Possibly Calabrese et al. [57], Farooque and Ahulu [17], and Piecyk and Björklund [5] understood investment as being different than is interpreted in this research, through which the reports are analyzed in some other way, and could explain the different results found in this study.
Regarding product responsibility, it could be assumed that product and service labeling, and marketing communications would be regarded as material social sustainability indicators. However, the findings in this study appear to contradict this proposition: Product and service labeling, and marketing communications occur least often in the investigated reports, whereas customer privacy and satisfaction appears to occur most often. Nevertheless, some controversy exists within the literature. Farooque and Ahulu [17] and Piecyk and Björklund [5] both conclude that product and service labeling is the indicator most often reported on, whereas Calabrese et al. [57] indicates marketing communications as being most important in this subcategory of social sustainability. However, there is obscurity about the definition of product and service labeling in Piecyk and Björklund [5], and in all three articles an operationalization of the indicator marketing communications is missing. This could partly explain some differences in interpretations and therewith in the results. Nonetheless, since customer privacy and satisfaction, as well as customer health and safety, appear to be more important in this research than both product and service labeling, and marketing communications, this could also indicate a growing awareness of the importance of the well-being of customers. To confirm this statement further research is required.
With regard to the environmental sustainability indicators, the findings in this study support the results of the research by Piecyk and Björklund [5], in which emissions and energy appear to be of prominent importance in most of the investigated sustainability reports. Garza-Reyes et al. [2] implied only the indicator emissions as being most important for organizations in the logistics sector, whereas Björklund et al. [6] found out that emissions, energy as well as the indicator “overall” are the most frequent environmental sustainability indicators. Calabrese et al. [57] conclude from their research that waste showed up most frequently. Our study only confirms the frequent occurrence of the indicators “emissions” and “energy.”
Regarding the economic sustainability indicators, the organizations in this study value economic performance as the most important economic sustainability indicator, with an occurrence in 43 of the reports. Though in this category, market presence follows with occurrence in 29 reports, and indirect economic performance appears to occur in just 21 of the 52 reports. Farooque and Ahulu [17] discovered that economic performance is considered as being most exhibited in sustainability reporting, whereas Calabrese et al. [57] experienced the highest occurrence of the indicator indirect economic impacts. In sum, the findings in this research confirm the findings of Farooque and Ahulu [17], while the results of Calabrese et al. [57] are not supported.
5.2. The Contradiction of Sustainability Reporting in the Logistics Sector
Growing concern of climate change is rising [14]. Transportation activities have become known as a major cause of emission of harmful pollutants [22]. However, logistics are of great importance for foreign trade [1], and the development of other sectors depends on the efficiency of its logistics [3]. Thus, the existence of organizations in the logistics sector is of importance, though there has been criticism on the negative environmental effects arising from its functioning. This paradox places companies in the logistics sector in a difficult position: They have to continue executing their operations, which goes along with pollutant emissions, while they also have to reduce these pollutant emissions in order to meet the concerns about the negative environmental influences stemming from their operations.
Logistics operations are impossible to carry out without any adverse effects on the environment. This raises questions as to how these companies report on the negative effects stemming from their operations. Marshall et al. [59] recognize three possibilities in the way organizations could communicate their controversial issues. First of all, directly, whereby the issues are already publicly acknowledged, and thus cannot be evaded anymore. Second, indirectly, where the organizations denote negative effects and their role in it, however, just at the operational level, not at product level. For instance, they mention their operational ways in reducing emissions, but fail to address how they deal with the issue of combustion of their products and their negative environmental effects [59]. This indirect way of communicating controversial issues, however, may cause loss of legitimacy for the organization, and ensuing possible loss of allowance to continue operating [60]. The third strategy concerns avoidance, whereby the most important controversial issues are completely avoided, while bringing up solutions to other issues in the organization [59]. It is clear from our analysis that the sustainability reports in the logistics sector exhibit these three sustainability reporting strategies as well: ‘Directly’, ‘indirectly’, and ‘avoiding’. More specifically, the indirect strategies seem to occur the most, which might be ascribed to the contradiction of sustainability reporting in logistics.
6. Conclusions
This study aims at filling the gaps with regard to the scarcity of research on the disclosed sustainability indicators by organizations in the logistics sector [2,5,6,23,25]. From the social sustainability aspect concerning the subcategory “labor practices and decent work,” the indicators “health and safety,” and “training and education” are found to be regarded as being most material. Interestingly, the indicator “health and safety” is the only one that is present in all reports. “Training and education” is enclosed in all of the reports, except for one. From this category, the indicators “labor practices grievance mechanisms,” and “supplier assessment for labor practices” are least reported on. The indicator “security practices” appears mostly in the social subcategory human rights, whereas the indicator “indigenous rights” occurs less in this category. From the social sustainability component with respect to the subcategory society, judging by the frequency of occurrence, the indicator “community” seems to be regarded as being material, whilst the indicator “grievance mechanisms for impacts on society” occurs most infrequently. Finally, with respect to the social dimension of sustainability and specifically concerning the subcategory product responsibility, the indicators “customer privacy and satisfaction,” and “compliance” occur most often, while “product and service” labeling is least reported on in this category. With regard to the environmental aspect of sustainability, the indicators “emissions” and “energy” are considered as being most material, closely followed by the indicator “transport.” One of the least reported indicators in this category is “environmental grievance mechanisms.” From the economic category of sustainability indicators, the indicator “economic performance” seems to be regarded as being most material, whereas “procurement practices” is reported most infrequently.
In the aggregated overview of the results, the social sustainability indicators “health and safety,” and “training and education” seem to be regarded as being most material, followed by “emissions” and “energy” from the environmental indicators. Based on our findings and their frequency of occurrence, we could argue that social sustainability indicators are considered as being more material than environmental and economic sustainability indicators. Except for the indicators health and safety (that occur in all of the reports), and training and education (that occurs in all of the reports, except for one), there is no compatible pattern in the consideration of what material sustainability indicators are. This is in contrast to the literature, inducing tendency of organizations in the same industry to apply compatible patterns in sustainability reporting [53].
Clearly, there is still a lot of ambiguity involved in relation to which indicators should be reported besides the lack of sector-specific indicators in sustainability reporting that has been established in literature [5]. Therefore, further research on which sustainability indicators organizations should disclose by taking into account sector-specific concerns, is necessary. Thereby, it is recommended to use a larger sample size, not influenced by language restrictions. Furthermore, there appears to exist ambiguity and non-specificity in the terminology of sustainability indicators. In order to get a better understanding of the definitions of these indicators, more research on clarity of the meaning of the sustainability indicators would be valuable. This study also reports about confusion concerning what organizations consider as material sustainability indicators. Thus, to determine patterns in sustainability reporting, it would be beneficial to analyze organizations operating in the same industry. Moreover, this research underlined the importance of future research on customer-specific sustainability indicators, and on the environmental sustainability indicator “transport,” the latter being a crucial, yet neglected, indicator.
Clearly, there is great potential to address issues related to logistics in the realm of sustainability. Not only will such studies be of interest to academia but also to practitioners. The development of sustainability management tools, sector specific reporting frameworks or add-ons to the existing guidelines, as well as country specific exploratory research on performance management tools (such as the integration of benefit impact assessment indicators into overall sustainability performance management systems [61]), as well as integration of sustainability in supply chain perspective [62,63], are some areas that can be explored by future studies. The use of clear evaluation tools (e.g., the E-SET suggested by Zenya et al. [10]) that could facilitate the adoption of sustainable business strategies may be further developed to encompass the indicators suggested in the logistics and transportation supplement by the GRI.
Finally, the contradiction of the importance of the existence of organizations in the logistics sector and the criticism on the negative environmental effects stemming from their operations, calls for future research on how these organizations cope with this paradox, and the way they apply certain strategies (oriented toward direct-indirect-avoidance, as referred to by [59]) in sustainability reporting. In addition to analyzing publicly available sustainability reports, which potentially could provide biased results, we explicitly call for qualitative studies by means of in-depth interviews and focus groups (e.g., following the Delphi methodology) to provide information about the materiality, acceptance, appearance and reporting of sector-specific sustainability indicators. Furthermore, it could potentially provide information about institutional approaches, as well as processes of meaning-making related to organizational performance regarding sustainability integration and reporting, hence surpassing the discussion whether it concerns legitimate forms of reporting or could be characterized as greenwashing.
Author Contributions
Conceptualization, W.L., S.S.-T., L.R. and J.S.; Data curation, W.L. and L.R.; Formal analysis, W.L., S.S.-T. and L.R.; Investigation, W.L., S.S.-T. and L.R.; Methodology, W.L. and L.R.; Supervision, W.L. and J.S.; Validation, W.L., S.S.-T. and J.S.; Writing—original draft, W.L., S.S.-T., L.R. and J.S.; Writing—review & editing, W.L. and S.S.-T.
Funding
This research received no external funding.
Acknowledgments
The authors would like to thank the anonymous reviewers and the editors for their valuable feedback on this paper.
Conflicts of Interest
The authors declare no conflict of interest.
Appendix A

Table A1.
Sustainability indicators.
| Sustainability Indicator | Description | References |
|---|---|---|
| Social | ||
| Labor Practices and Decent Work | ||
| Training and education | Employees (e.g., percentage of employees and/or hours per employee) who get work-related education, training, and counseling in this | [5,17] |
| Health and safety | Rates of injury and occupational diseases, and actions to improve health and safety | [5,17] |
| Accidents and fatalities | Number of accidents and number of fatal accidents | [5] |
| Breakdown of employees | Number and percentage of employees broken down by e.g., gender, age and region | [5] |
| Employment | Employment compensations and wages, and/or percentage of employees covered by collective bargaining agreements in their employment contract | [5,32] |
| Labor management relations | Relationship between employer and employees, and/or number of arbitrations regarding disputes between employer and employee | [64] |
| Diversity and equal opportunity and remuneration | Ratio between the number of men and women employees, and/or ratio of basic salary and remuneration of men to women by employee category | [17,57] |
| Supplier assessment for labor practices | New suppliers screened and/or evaluating/performance measurement of suppliers for labor conditions | [57,65,66] |
| Labor practices grievance mechanisms | Grievances regarding labor practices and problem-solving actions on these | [67] |
| Human Rights | ||
| Actions | Actions to ensure human rights are respected | [5,57] |
| Training | Employees getting training on policies and procedures concerning human rights relevant to operations | [5] |
| Investment | Existence of investment agreements that include human rights clauses or have undergone human rights screening | [17,58] |
| Non-discrimination | Anti-discrimination policy and/or total number of incidents of discrimination | [17] |
| Freedom of association and collective bargaining agreement | Operations identified in which the right to exercise freedom of association and collective bargaining are present | [17] |
| Child labor | Issuing of rules concerning prohibition of children under 18 working in paid employment | [68] |
| Forced and compulsory labor | Issuing of rules concerning prohibition of unfree and slavery-like practices | [69] |
| Security practices | Operations identified as having significant risk and/or total number of incidents of violations | [17] |
| Indigenous rights | Heritage protection and actions to ensure indigenous rights are respected | [70,71] |
| Supplier human rights assessment | New suppliers screened and/or evaluating/performance measurement of suppliers for human rights practices | [57,65,66] |
| Human rights grievance mechanisms | Grievances regarding human rights practices and problem-solving actions on these | [67] |
| Society | ||
| Community | Support of community projects and/or total value of financial and in-kind contributions to community projects | [5,17] |
| Anti-corruption | Actions to ensure compliance with anti-corruption and anti-trust standards | [5,17] |
| Public policy | Presence of public policy positions and participation, such as political financial contribution | [17] |
| Anti-competitive behavior | Approach against unfair competition, related to practices such as collusive price fixing, creation of barriers to entry, and predatory pricing | [72] |
| Compliance | Adherence to laws and standards concerning society and/or total number of non-compliance incidents or substantiated complaints | [17] |
| Supplier assessment for impacts on society | New suppliers screened and/or evaluating/performance measurement of suppliers for societal impacts | [57,65,66] |
| Grievance mechanisms for impacts on society | Grievances regarding societal practices and problem-solving actions on these | [67] |
| Product Responsibility | ||
| Customer privacy and satisfaction | Practices related to customer satisfaction and privacy, such as results of customer satisfaction surveys | [5,17] |
| Customer health and safety | Health and safety impacts at different stages of the life cycle of products and services | [17] |
| Product and service labeling | Type of product and service information required by procedures | [17] |
| Marketing communications | Used marketing instruments and communication channels | [73,74] |
| Compliance | Adherence to laws and standards concerning product responsibility and/or total number of non-compliance incidents or substantiated complaints | [17] |
| Environmental | ||
| Emissions | Tons of CO2 (including greenhouse gas), N2O, SOx, NOx, VOCs, and PM emissions, and/or practices concerning emissions reduction | [5,57] |
| Transport | Amount of fuel used, measured in liters/ton-km, and/or practices concerning fuel use reduction | [5] |
| Energy | Electricity consumption, measured in kilowatt-hours (kWh), and/or practices concerning energy use reduction | [5,57] |
| Water | Water consumption and water recycled/reused, measured in m3, and/or practices concerning water use reduction | [5,57] |
| Waste | Effluents and waste recycled, measured in tons, and/or use of waste disposal and wastewater treatment systems | [5,57] |
| Spills | Amount of spills, measured in m3 | [5] |
| Materials | Material consumption (such as paper and steel), measured in tons, and/or percentage of materials recycled | [5,57] |
| Biodiversity | Actions to protect biodiversity | [5,57] |
| Products and services | Materials used for producing and packaging products and services and percentage of which is reclaimed, and/or the extent of impact mitigation of environmental impacts of products and services | [57] |
| Compliance | Adherence to laws and standards concerning the environment, total number of non-compliance incidents or substantiated complaints, and/or fines and sanctions for non-compliance to environmental laws and regulations | [17,57] |
| Overall | Environmental protection expenditures and investments | [6,57] |
| Supplier environmental assessment | New suppliers screened using environmental criteria, and/or evaluating/performance measurement of suppliers for environmental conditions | [57,65,66] |
| Environmental grievance mechanisms | Grievances regarding environmental practices and problem-solving actions on these | [67] |
| Economic | ||
| Economic performance | Direct economic value generated through economic activities, transactions and interactions, and/or financial risks and opportunities from the organization’s activities | [17,57] |
| Market presence | Policy, practices and proportion of spending on locally-based suppliers, procedures for local hiring and/or proportion of senior management hired from the local community at significant locations of operation | [17] |
| Indirect economic impacts | Perception of significant indirect economic impacts and their dimension, such as investments that are realized for broader public benefit which have therewith indirect effects on stakeholders | [17,57] |
| Procurement practices | Presence of guidelines for all procurement units to take economically acceptable decisions | [75] |
Appendix B
Table A2.
Overview of logistics companies analyzed in this study.
| # | Name | Region | Country | GRI-Type | Year |
|---|---|---|---|---|---|
| 1 | Trencor Limited | Africa | South Africa | Non-GRI | 2015 |
| 2 | Imperial Holdings | Africa | South Africa | GRI-G4 | 2015 |
| 3 | Onelogix Group | Africa | South Africa | GRI-G4 | 2016 |
| 4 | Transnet | Africa | South Africa | GRI-G4 | 2016 |
| 5 | Super Group | Africa | South Africa | Non-GRI | 2016 |
| 6 | DAWN (Distribution and Warehousing Network Limited) | Africa | South Africa | Citing-GRI | 2017 |
| 7 | Value Group | Africa | South Africa | GRI-G4 | 2017 |
| 8 | Cargo Carriers | Africa | South Africa | Non-GRI | 2017 |
| 9 | China Merchants Bank | Asia | Hong Kong | GRI-G4 | 2015 |
| 10 | Singamas Container Holdings Limited | Asia | Hong Kong | Non-GRI | 2015 |
| 11 | CONCOR (Container Corporation of India) | Asia | India | Non-GRI | 2015–2016 |
| 12 | DMRC (Delhi Metro Rail Corporation) | Asia | India | GRI-G4 | 2015–2016 |
| 13 | Yamato Group | Asia | Japan | GRI-G4 | 2016 |
| 14 | Lino Lines | Asia | Japan | Citing-GRI | 2017 |
| 15 | Naouri Group | Asia | Jordan | Non-GRI | 2015–2016 |
| 16 | ACT (Aqaba Container Terminal) | Asia | Jordan | GRI-Standards | 2016 |
| 17 | Aramex | Asia | Jordan | GRI-Standards | 2016 |
| 18 | NCB Holdings | Asia | Malaysia | GRI-G4 | 2014–2015 |
| 19 | Bumi Armada Berhad | Asia | Malaysia | Non-GRI | 2016 |
| 20 | MISC Berhad | Asia | Malaysia | GRI-G4 | 2016 |
| 21 | Westports Holding Berhad | Asia | Malaysia | Citing-GRI | 2016 |
| 22 | CNCo (China Navigation Company) | Asia | Singapore | GRI-G4 | 2015 |
| 23 | BEM (Bangkok Expressway and Metro) | Asia | Thailand | Non-GRI | 2016 |
| 24 | OMSAN Logistics | Asia | Turkey | GRI-G4 | 2014 |
| 25 | Emirates Transport | Asia | United Arab Emirates | GRI-G4 | 2015 |
| 26 | Tristar | Asia | United Arab Emirates | GRI-G4 | 2015 |
| 27 | Arctia | Europe | Finland | Non-GRI | 2016 |
| 28 | Konecranes | Europe | Finland | GRI-G4 | 2016 |
| 29 | Posti | Europe | Finland | GRI-G4 | 2016 |
| 30 | La Poste | Europe | France | GRI-G4 | 2015 |
| 31 | Neptune Lines | Europe | Greece | GRI-G4 | 2014–2015 |
| 32 | Havenbedrijf Rotterdam | Europe | Netherlands | GRI-G4 | 2015 |
| 33 | Grieg Star | Europe | Norway | GRI-G3.1 | 2014 |
| 34 | Posten Norge | Europe | Norway | GRI-G4 | 2015 |
| 35 | ADAMPOL SA | Europe | Poland | Non-GRI | 2015–2016 |
| 36 | Luís Simões | Europe | Portugal | GRI-G4 | 2015 |
| 37 | Luka Koper | Europe | Slovenia | Non-GRI | 2016 |
| 38 | PostNord | Europe | Sweden | GRI-G4 | 2015 |
| 39 | DB Schenker | Europe | Sweden | Non-GRI | 2015 |
| 40 | The Gothenburg Port | Europe | Sweden | GRI-G4 | 2016 |
| 41 | Panalpina | Europe | Switzerland | GRI-G4 | 2015 |
| 42 | Planzer | Europe | Switzerland | Non-GRI | 2016 |
| 43 | FirstGroup | Europe | United Kingdom | Non-GRI | 2015–2016 |
| 44 | Royal Mail | Europe | United Kingdom | GRI-G4 | 2016–2017 |
| 45 | Wilson Sons | Latin America & the Caribbean | Brazil | Non-GRI | 2014 |
| 46 | The Sociedad Portuaria de Santa Marta | Latin America & the Caribbean | Colombia | Non-GRI | 2014 |
| 47 | CPR (Canadian Pacific Railway) | Northern America | Canada | GRI-G4 | 2016 |
| 48 | PITT OHIO | Northern America | United States of America | Non-GRI | 2015 |
| 49 | USCS (United States Cold Storage) | Northern America | United States of America | Citing-GRI | 2015 |
| 50 | Bidvest | Oceania | Australia | Citing-GRI | 2015 |
| 51 | Port Authority | Oceania | Australia | Non-GRI | 2015–2016 |
| 52 | Steamships | Oceania | Papua New Guinea | GRI-G3.1 | 2014 |
References
- Yu, M.; Wang, C.; Ho, N. A Grey Forecasting Approach for the Sustainability Performance of Logistics Companies. Sustainability 2016, 8, 866. [Google Scholar] [CrossRef]
- Garza-Reyes, J.A.; Villarreal, B.; Kumar, V.; Ruiz, P.M. Lean and green in the transport and logistics sector—A case study of simultaneous deployment. Prod. Plan. Control 2016, 27, 1221–1232. [Google Scholar] [CrossRef]
- Turoń, K. Corporate Social Responsibility to Employees: The Best Labour Practices in Transport and Logistics Companies. J. Corp. Responsib. Leadersh. 2016, 3, 37–47. [Google Scholar] [CrossRef]
- GRI—Global Reporting Initiative. Pilot Version of the Logistics and Transportation Sector Supplement. 2006. Available online: https://www.globalreporting.org/information/sector-guidance/sector-guidance/pilot-versions/logistics-and-transportation/Pages/default.aspx (accessed on 20 November 2018).
- Piecyk, M.I.; Björklund, M. Logistics service providers and corporate social responsibility: Sustainability reporting in the logistics industry. Int. J. Phys. Distrib. Logist. Manag. 2015, 45, 459–485. [Google Scholar] [CrossRef]
- Björklund, M.; Forslund, H.; Isaksson, M.P. Exploring logistics-related environmental sustainability in large retailers. Int. J. Retail. Distrib. Manag. 2016, 44, 38–57. [Google Scholar] [CrossRef] [Green Version]
- Azevedo, S.; Barros, M. The Application of the Triple Bottom Line Approach to Sustainability Assessment: The Case Study of the UK Automotive Supply Chain. J. Ind. Eng. Manag. 2017, 10, 286–322. [Google Scholar] [CrossRef]
- Hahn, R.; Kühnen, M. Determinants of sustainability reporting: A review of results, trends, theory, and opportunities in an expanding field of research. J. Clean. Prod. 2013, 59, 5–21. [Google Scholar] [CrossRef]
- Boiral, O.; Henri, J.F. Is sustainability performance comparable? A study of GRI reports of mining organizations. Bus. Soc. 2017, 56, 283–317. [Google Scholar] [CrossRef]
- Zenya, A.; Nystad, Ø. Assessing Corporate Sustainability with the Enterprise Sustainability Evaluation Tool (E-SET). Sustainability 2018, 10, 4661. [Google Scholar] [CrossRef]
- Carter, C.R.; Rogers, D.S. A framework of sustainable supply chain management: Moving toward new theory. Int. J. Phys. Distrib. Logist. Manag. 2008, 38, 360–387. [Google Scholar] [CrossRef]
- Carter, C.R.; Jennings, M.M. Logistics social responsibility: An integrative framework. J. Bus. Logist. 2002, 23, 145–180. [Google Scholar] [CrossRef]
- Ballou, R.H. Business logistics: Importance and some research opportunities. Gest. Prod. 2017, 4, 117–129. [Google Scholar] [CrossRef]
- Lam, J.S.L.; Dai, J. Environmental sustainability of logistics service provider: An ANP-QFD approach. Int. J. Logist. Manag. 2015, 26, 313–333. [Google Scholar] [CrossRef]
- Elkington, J. Cannibals with Forks. The Triple Bottom Line of 21st Century Business; New Society Publishers: Gabriola Island, BC, Canada, 1998. [Google Scholar]
- Elkington, J. 25 years ago I coined the phrase “Triple Bottom Line”. Here’s why it is time to rethink it. Harv. Bus. Rev. 2018. online first. [Google Scholar]
- Farooque, O.A.; Ahulu, H. Determinants of social and economic reportings: Evidence from Australia, the UK and South African multinational enterprises. Int. J. Account. Inf. Manag. 2017, 25, 177–200. [Google Scholar] [CrossRef]
- Deegan, C. Organizational legitimacy as a motive for sustainability reporting. In Sustainability Accounting and Accountability; Unerman, J., Bebbington, J., O’Dywer, B., Eds.; Routledge: London, UK, 2007; pp. 146–168. [Google Scholar]
- ACCA—The Association of Chartered Certified Accountants. Mapping the Sustainability Reporting Landscape. Lost in the Right Direction. 2016. Available online: https://www.accaglobal.com/content/dam/ACCA_Global/Technical/sus/ACCA_CDSB%20Mapping%20the%20sustainability%20landscape_Lost%20in%20the%20right%20direction.pdf (accessed on 21 November 2018).
- GRI—Global Reporting Initiative. About Sustainability Reporting. 2017. Available online: https://www.globalreporting.org/information/sustainability-reporting/Pages/default.aspx (accessed on 12 December 2018).
- Sutopo, B.; Kot, S.; Adiati, A.K.; Ardila, L.N. Sustainability Reporting and Value Relevance of Financial Statements. Sustainability 2018, 10, 678. [Google Scholar] [CrossRef]
- Demir, E.; Bektaş, T.; Laporte, G. A review of recent research on green road freight transportation. Eur. J. Oper. Res. 2014, 237, 775–793. [Google Scholar] [CrossRef] [Green Version]
- Evangelista, P.; Colicchia, C.; Creazza, A. Is environmental sustainability a strategic priority for logistics service providers? J. Environ. Manag. 2017, 198, 353–362. [Google Scholar] [CrossRef]
- Govindan, K.; Khodaverdi, R.; Jafarian, A. A fuzzy multi criteria approach for measuring sustainability performance of a supplier based on triple bottom line approach. J. Clean. Prod. 2013, 47, 345–354. [Google Scholar] [CrossRef]
- Lun, Y.H.V.; Lai, K.; Wong, C.W.Y.; Cheng, T.C.E. Greening propensity and performance implications for logistics service providers. Transp. Res. E-Logist. 2015, 74, 50–62. [Google Scholar]
- Kimbro, M.B.; Cao, Z. Does voluntary corporate citizenship pay? An examination of the UN Global Compact. Int. J. Account. Inf. Manag. 2011, 19, 288–303. [Google Scholar] [CrossRef]
- Brown, H.S.; De Jong, M.; Levy, D. Building institutions based on information disclosure: Lessons from GRI’s sustainability reporting. J. Clean. Prod. 2009, 17, 571–580. [Google Scholar] [CrossRef]
- Fernandez-Feijoo, B.; Romero, S.; Ruiz, S. Commitment to Corporate social responsibility measured through global reporting initiative reporting: Factors affecting the behavior of companies. J. Clean. Prod. 2014, 81, 244–254. [Google Scholar] [CrossRef]
- Nikolaeva, R.; Bicho, M. The role of institutional and reputational factors in the voluntary adoption of corporate social responsibility reporting standards. J. Acad. Mark. Sci. 2011, 39, 136–157. [Google Scholar] [CrossRef]
- GRI—Global Reporting Initiative. Enabling Smart Policy: The role of GRI Standards. 2016. Available online: https://www.globalreporting.org/resourcelibrary/Enabling%20Smart%20Policy_The%20role%20of%20GRI%20Standards_Web.pdf (accessed on 20 November 2018).
- Son-Turan, S. Compliance and Reporting Trends: Essential Strategies. In Risk Management, Strategic Thinking and Leadership in the Financial Services Industry; Springer: Cham, Switzerland, 2017; pp. 287–296. [Google Scholar]
- Roca, L.C.; Searcy, C. An analysis of indicators disclosed in corporate sustainability reports. J. Clean. Prod. 2012, 20, 103–118. [Google Scholar] [CrossRef]
- Durden, C. Towards a socially responsible management control system. Account. Audit. Account. J. 2008, 21, 671–694. [Google Scholar] [CrossRef]
- Dowling, J.; Pfeffer, J. Organizational legitimacy: Social values and organizational behavior. Pac. Sociol. Rev. 1975, 18, 122–136. [Google Scholar] [CrossRef]
- Deegan, C.; Gordon, B. A study of the environmental disclosure practices of Australian corporations. Account. Bus. Res. 1996, 26, 187–199. [Google Scholar] [CrossRef]
- Neu, D.; Warsame, H.; Pedwell, K. Managing public impressions: Environmental disclosures in annual reports. Account. Org. Soc. 1998, 23, 265–282. [Google Scholar] [CrossRef]
- Guthrie, J.; Parker, L.D. Corporate social reporting: A rebuttal of legitimacy theory. Account. Bus. Res. 1989, 19, 343–352. [Google Scholar] [CrossRef]
- Moir, L. What do we mean by corporate social responsibility? Corp. Gov. Int. J. Bus. Soc. 2001, 1, 16–22. [Google Scholar] [CrossRef]
- Campbell, D.; Craven, B.; Shrives, P. Voluntary social reporting in three FTSE sectors: A comment on perception and legitimacy. Account. Audit. Account. J. 2003, 16, 558–581. [Google Scholar] [CrossRef]
- Deegan, C. Introduction: The legitimising effect of social and environmental disclosures—A theoretical foundation. Account. Audit. Account. J. 2002, 15, 282–311. [Google Scholar] [CrossRef]
- Gray, R.; Kouhy, R.; Lavers, S. Corporate social and environmental reporting: A review of the literature and a longitudinal study of UK disclosure. Account. Audit. Account. J. 1995, 8, 47–77. [Google Scholar] [CrossRef]
- Hsu, C.; Lee, W.; Chao, W. Materiality analysis model in sustainability reporting: A case study at Lite-On Technology Corporation. J. Clean. Prod. 2013, 57, 142–151. [Google Scholar] [CrossRef]
- Freeman, R.E. Strategic Management: A Stakeholder Approach; Pitman Publishing: Boston, MA, USA, 1984. [Google Scholar]
- Sarkis, J.; Zhu, Q.; Lai, K. An organizational theoretic review of green supply chain management literature. Int. J. Prod. Econ. 2011, 130, 1–15. [Google Scholar] [CrossRef] [Green Version]
- Sweeney, L.; Coughlan, J. Do different industries report Corporate Social Responsibility differently? An investigation through the lens of stakeholder theory. J. Mark. Commun. 2008, 14, 113–124. [Google Scholar] [CrossRef] [Green Version]
- Roy, A.; Goll, I. Predictors of various facets of sustainability of nations: The role of cultural and economic factors. Int. Bus. Rev. 2014, 23, 849–861. [Google Scholar] [CrossRef]
- Chen, J.C.; Roberts, R.W. Toward a More Coherent Understanding of the Organization–Society Relationship: A Theoretical Consideration for Social and Environmental Accounting Research. J. Bus. Ethics 2010, 97, 651–665. [Google Scholar] [CrossRef]
- Ortas, E.; Álvarez, I.; Jaussaud, J.; Garayar, A. The impact of institutional and social context on corporate environmental, social and governance performance of companies committed to voluntary corporate social responsibility initiatives. J. Clean. Prod. 2015, 108, 673–684. [Google Scholar] [CrossRef]
- Adams, C.A.; Whelan, G. Conceptualising future change in corporate sustainability reporting. Account. Audit. Account. J. 2009, 22, 118–143. [Google Scholar] [CrossRef]
- Gallego-Álvarez, I.; Ortas, E. Corporate environmental sustainability reporting in the context of national cultures: A quantile regression approach. Int. Bus. Rev. 2017, 26, 337–353. [Google Scholar] [CrossRef]
- Whittemore, R.; Chase, S.K.; Mandle, C.L. Validity in qualitative research. Qual. Health Res. 2001, 11, 522–537. [Google Scholar] [CrossRef] [PubMed]
- Hannes, K.; Lockwood, C.; Pearson, A. A comparative analysis of three online appraisal instruments’ ability to assess validity in qualitative research. Qual. Health Res. 2010, 20, 1736–1743. [Google Scholar] [CrossRef]
- Eccles, R.G.; Krzus, M.P.; Rogers, J.; Serafeim, G. The Need for Sector-Specific Materiality and Sustainability Reporting Standard. J. Appl. Corp. Financ. 2012, 24, 8–14. [Google Scholar] [CrossRef]
- Schaltegger, S.; Herzig, C. Managing and accounting for health, safety and the environment: The case of the mechanical engineering company Bisma Jaya, Indonesia. Issues Soc. Environ. Account. 2011, 5, 82–105. [Google Scholar] [CrossRef]
- GRI—Global Reporting Initiative. Materiality in the context of the GRI Reporting Framework. 2013. Available online: https://www.globalreporting.org/information/g4/G3andG3-1/guidelines-online/TechnicalProtocol/Pages/MaterialityInTheContextOfTheGRIReportingFramework.aspx (accessed on 20 November 2018).
- Zadek, S.; Merme, M. Redefining Materiality: Practice and Public Policy for Effective Corporate Reporting; Institute of Social and Ethical AccountAbility: London, UK, 2003; ISBN 1901-693-14-7. [Google Scholar]
- Calabrese, A.; Costa, R.; Levialdi, N.; Menichini, T. A fuzzy analytic hierarchy process method to support materiality assessment in sustainability reporting. J. Clean. Prod. 2016, 121, 248–264. [Google Scholar] [CrossRef]
- Yira, S.A. Restoring the balance in bilateral investment treaties: Incorporating human rights clauses. Rev. Derecho 2009, 32, 139–161. [Google Scholar]
- Marshall, D.; Rehme, J.; Kelly, S.; Chicksand, D.; Boojihawon, D.K. Naughty but nice: Communications in controversial industries. Presented at the IPSERA Conference, Athens, Greece, 25–28 March 2018. [Google Scholar]
- Mol, A.P.J. Transparency and value chain sustainability. J. Clean. Prod. 2015, 107, 154–161. [Google Scholar] [CrossRef]
- Nigri, G.; Del Baldo, M. Sustainability Reporting and Performance Measurement Systems: How do Small- and Medium-Sized Benefit Corporations Manage Integration? Sustainability 2018, 10, 4499. [Google Scholar] [CrossRef]
- Kot, S. Sustainable Supply Chain Management in Small and Medium Enterprises. Sustainability 2018, 10, 1143. [Google Scholar] [CrossRef]
- Veit, C.; Lambrechts, W.; Quintens, L.; Semeijn, J. The Impact of Sustainable Sourcing on Customer Perceptions: Association by Guilt from Scandals in Local vs. Offshore Sourcing Countries. Sustainability 2018, 10, 2519. [Google Scholar] [CrossRef]
- Tobias, R.M. Future of Federal-Sector Labor-Management Relations. Confl. Resolut. Q. 2015, 33, 101–105. [Google Scholar] [CrossRef]
- Gimenez, C.; Tachizawa, E.M. Extending sustainability to suppliers: A systematic literature review. Supply Chain Manag. 2012, 17, 531–543. [Google Scholar] [CrossRef]
- Handfield, R.; Walton, S.V.; Sroufe, R.; Melnyk, S.A. Applying environmental criteria to supplier assessment: A study in the application of the Analytical Hierarchy Process. Eur. J. Oper. Res. 2002, 141, 70–87. [Google Scholar] [CrossRef]
- Kaufman, J.; McDonnell, K. Community-driven operational grievance mechanisms. Bus. Hum. Rights J. 2016, 1, 127–132. [Google Scholar] [CrossRef]
- Frank, A.L. Child Labor. Toxicol. Ind. Health 2009, 25, 79. [Google Scholar] [CrossRef]
- Lerche, J. A Global Alliance against Forced Labour? Unfree Labour, Neo-Liberal Globalization and the International Labour Organization. J. Agrar. Chang. 2007, 7, 425–452. [Google Scholar] [CrossRef] [Green Version]
- Ween, G.B. World Heritage and Indigenous rights: Norwegian examples. Int. J. Herit. Stud. 2011, 18, 257–270. [Google Scholar] [CrossRef]
- Wiessner, S. The Cultural Rights of Indigenous Peoples: Achievements and Continuing Challenges. Eur. J. Int. Law 2011, 22, 121–140. [Google Scholar] [CrossRef]
- Mishra, A.K.; Rao, G. Analysing Anti-competitive Behaviour: The Case for Indian Telecom Industry. Sci. Technol. Soc. 2015, 20, 21–43. [Google Scholar] [CrossRef] [Green Version]
- Kozhukhovskaya, R.B. Essence and Principles of Realisation of Integrated Marketing Communications. Biz. Inform. 2013, 3, 362–367. [Google Scholar]
- Reinold, T.; Tropp, J. Integrated marketing communications: How can we measure its effectiveness? J. Mark. Commun. 2010, 18, 113–132. [Google Scholar] [CrossRef]
- Meehan, J.; Bryde, D. Sustainable Procurement Practice. Bus. Strateg. Environ. 2011, 20, 94–106. [Google Scholar] [CrossRef]
Figure 1.
Tallies of occurrence of the social sustainability indicators from the category “labor practices and decent work.”
Figure 1.
Tallies of occurrence of the social sustainability indicators from the category “labor practices and decent work.”

Figure 2.
Tallies of occurrence of the social sustainability indicators from the human rights category.
Figure 2.
Tallies of occurrence of the social sustainability indicators from the human rights category.

Figure 3.
Tallies of occurrence of the social sustainability indicators from the society category.

Figure 4.
Tallies of occurrence of the social sustainability indicators from the product responsibility category.
Figure 4.
Tallies of occurrence of the social sustainability indicators from the product responsibility category.

Figure 5.
Tallies of occurrence of the environmental sustainability indicators.

Figure 6.
Tallies of occurrence of the economic sustainability indicators.

Figure 7.
Overview of the results.

© 2019 by the authors. Licensee MDPI, Basel, Switzerland. This article is an open access article distributed under the terms and conditions of the Creative Commons Attribution (CC BY) license (http://creativecommons.org/licenses/by/4.0/).
Share and Cite
MDPI and ACS Style
Lambrechts, W.; Son-Turan, S.; Reis, L.; Semeijn, J. Lean, Green and Clean? Sustainability Reporting in the Logistics Sector. Logistics 2019, 3, 3. https://0-doi-org.brum.beds.ac.uk/10.3390/logistics3010003
AMA Style
Lambrechts W, Son-Turan S, Reis L, Semeijn J. Lean, Green and Clean? Sustainability Reporting in the Logistics Sector. Logistics. 2019; 3(1):3. https://0-doi-org.brum.beds.ac.uk/10.3390/logistics3010003
Chicago/Turabian StyleLambrechts, Wim, Semen Son-Turan, Lucinda Reis, and Janjaap Semeijn. 2019. "Lean, Green and Clean? Sustainability Reporting in the Logistics Sector" Logistics 3, no. 1: 3. https://0-doi-org.brum.beds.ac.uk/10.3390/logistics3010003