Are We Ready to Ride Autonomous Vehicles? A Pilot Study on Austrian Consumers’ Perspective


Institute for Transport and Logistics Management, WU (Vienna University of Economics and Business), Welthandelsplatz 1, 1020 Vienna, Austria
*
Author to whom correspondence should be addressed.
Logistics 2019, 3(4), 20; https://0-doi-org.brum.beds.ac.uk/10.3390/logistics3040020
Submission received: 30 June 2019
/
Revised: 29 August 2019
/
Accepted: 6 September 2019
/
Published: 20 September 2019
Abstract
:Automotive manufacturers are competing to be the first to introduce customer-ready autonomous vehicles. Some manufacturers are claiming to launch their first self-driving cars as early as 2020. Which all sounds very good and futuristic; however, the question arises, are customers even ready to adopt this new technological advancement? Therefore, this pilot study is aimed at finding out the answer to this question in the Austrian market. This study discovers the standpoint of Austrian consumers concerning the acceptance of self-driving cars for daily usage and gives an overview of the current point of view regarding autonomous vehicles (AVs). The data for this study was collected using an online, user-friendly, Likert scale survey. The collected data were processed and analyzed for empirical significance in SPSS using Spearman’s rank correlation and the Mann–Whitney U test supported by descriptive analysis. The results of the study indicate that Austrian consumers are well aware of autonomous vehicles and their technology. However, they have specific concerns about reliability, cybersecurity, and futuristic car-sharing models. Therefore, these concerns about AVs should be addressed by auto manufactures in order to gain consumers’ trust and sell them a new form of mobility.
1. Introduction
Over a period, the automotive industry has introduced significant technological advancements, which has led to convenient, safer, and more affordable cars. However, no other industry has caused as much harm in terms of lost lives and disabilities compared to the automobile industry. Statistics show that on average, every 30 s, someone dies in a car accident. Additionally, 90% of those accidents are caused by human failure [1]. Moreover, underutilization of a vehicle is also a concern, which needs some attention; on average, a car is used only two hours per day, which eventually adds to the cost of ownership for an underutilized commodity [2]. Both accidents, as well as low utilization, can lead to internal and external costs [3]. Therefore, it is time to think about ownership and the usage of cars seriously. The solution to mitigate or completely solve these grave problems is hidden in the “Autonomous Vehicle,” also known as self-driving cars, driverless cars, and robotic cars [4].
Various types of automobile automation (for example, driver assistance, partial or full autonomy) can increase mobility, diminish accidents entirely, or reduce their severity. However, it is not clear if consumers fully understand the complexity of automobile automation. It is also not clear if and how developments can be used to facilitate the mobility needs of consumers. It should be evident that older people will experience very significant advantages using self-driving cars. Nevertheless, it can be noticed that the willingness to use automation in cars differs. While younger people tend to be ready for autonomous vehicles (AVs), older consumers show little willingness to use AVs. Therefore, it is crucial to understand what kind of training for new automobile technologies consumers currently acquire, and which technologies are required in the future in order to satisfy consumers’ mobility needs [5].
Research Objective
Although the adoption of AVs “is no longer a matter of science fiction,” little attention has been paid to consumers’ point of view [4]. Therefore, authors have designed this pilot study to find out the standpoint of Austrian consumers concerning the acceptance of AVs for daily usage and to give an overview of the current point of view regarding AVs. The aim is to find out which requirements AVs must meet in order to satisfy consumers’ mobility needs.
2. Literature Review
2.1. Evolution of AVs
The development of AVs took place in several steps [6]. Surprisingly, the idea of autonomous cars has been whispered since the automotive industry came into existence. In 1958 RCA Labs and the State of Nebraska conducted, among other efforts, a large-scale test on a 400-foot strip of official highway. In that time, the technology was fitted in the roadway, which could perceive the speed of the car and could, therefore, send the car instruction signals [7]. Between approximately 1980 and 2003, “university research centers worked on two visions of vehicle automation” [8] (p. 18). The first group was focused on automated highway systems where vehicles, depend on highway infrastructure to direct them. Other groups worked on autonomous cars, where particular roads were not necessary [8]. It became apparent that the entire specification of an autonomous highway system would be too difficult at that time. Thus, the focus was shifted to short-term research goals that could be implemented at an earlier date. For example, several systems were developed in a field-operational test in the course of the Intelligent Vehicle Initiative (IVI). The system included adaptive cruise control (ACC), forward collision warning (FCW), lane change assist (LCA), lane departure warning (LDW), intersection movement assist (IMA), and vehicle stability systems (for commercial vehicles) [7].
The U.S. Defense Advanced Research Projects Agency (DARPA) held three grand challenges from 2003 to 2007. The first two challenges were carried out in rural areas. The third one was held in an urban environment. The challenges of the DARPA considerably accelerated technological advance in AVs and spurred university teams to enhance the technology [8]. The vehicles in the challenges already encompassed all essential elements of today’s AVs and were, therefore, the origin for developmental projects like the Google car. Google’s car project had a significant impact on the automotive industry, although the technology would not be commercially available for several years. However, this project provided a ground-breaking platform for different car manufacturers to design their autonomous vehicle programs as well as working prototypes [7].
2.2. The Core of AV Technology
“Developing autonomous systems that can assist humans in everyday tasks is one of the grand challenges in modern computer science” [9] (p. 1). In this section, the underlying technology of AVs will be explored by emphasizing the most usual strategies. The technology used in AVs should be able to evaluate questions like:
- What is the current status of AVs?
- Are AVs able to confidently identify different objects in their surroundings?
- When is it suitable, safe, and legal to move further?
2.3. Connected Vehicles (Car2X-Communication)
Car 2X-Communication also referred to as Vehicle-to-Infrastructure (V2I), and Vehicle-to-Vehicle (V2V) communication aims to increase convenience and is, additionally, capable of optimizing traffic flows. Therefore, it is an exciting field of research which also has high potential. The primary function of Car2X-Communication is the exchange of information between infrastructure and road users. This means that the concept can send and receive standardized messages over the air interface and is able to interpret the status information of road users. The higher-level engineering system for ensuring Car2x-Communication is known as the intelligent transport system (ITS).
Through Car2X-Communication, self-driving cars should be able to define the position of surrounding traffic. V2V communication should allow cars to travel at a higher speed, cross road junctions without stopping, and travel in closer proximity to each other in order to create a more efficient traffic flow [13,14,15,16,17,18,19,20].
2.4. Levels of Automation—Process of Autonomous Driving
A self-driving car is turning science fiction into reality at an unprecedented rate. As explained in the table below, the framework issued by America’s National Highway Traffic Safety Administration defines five levels for the automation of vehicles (Table 2) [21,22].
In the table above, due to the sake of compactness, a different classification of the levels was made. In our table, there is no level 5, as we combined levels 0 and 1.
2.5. Timeline for Complete Autonomy
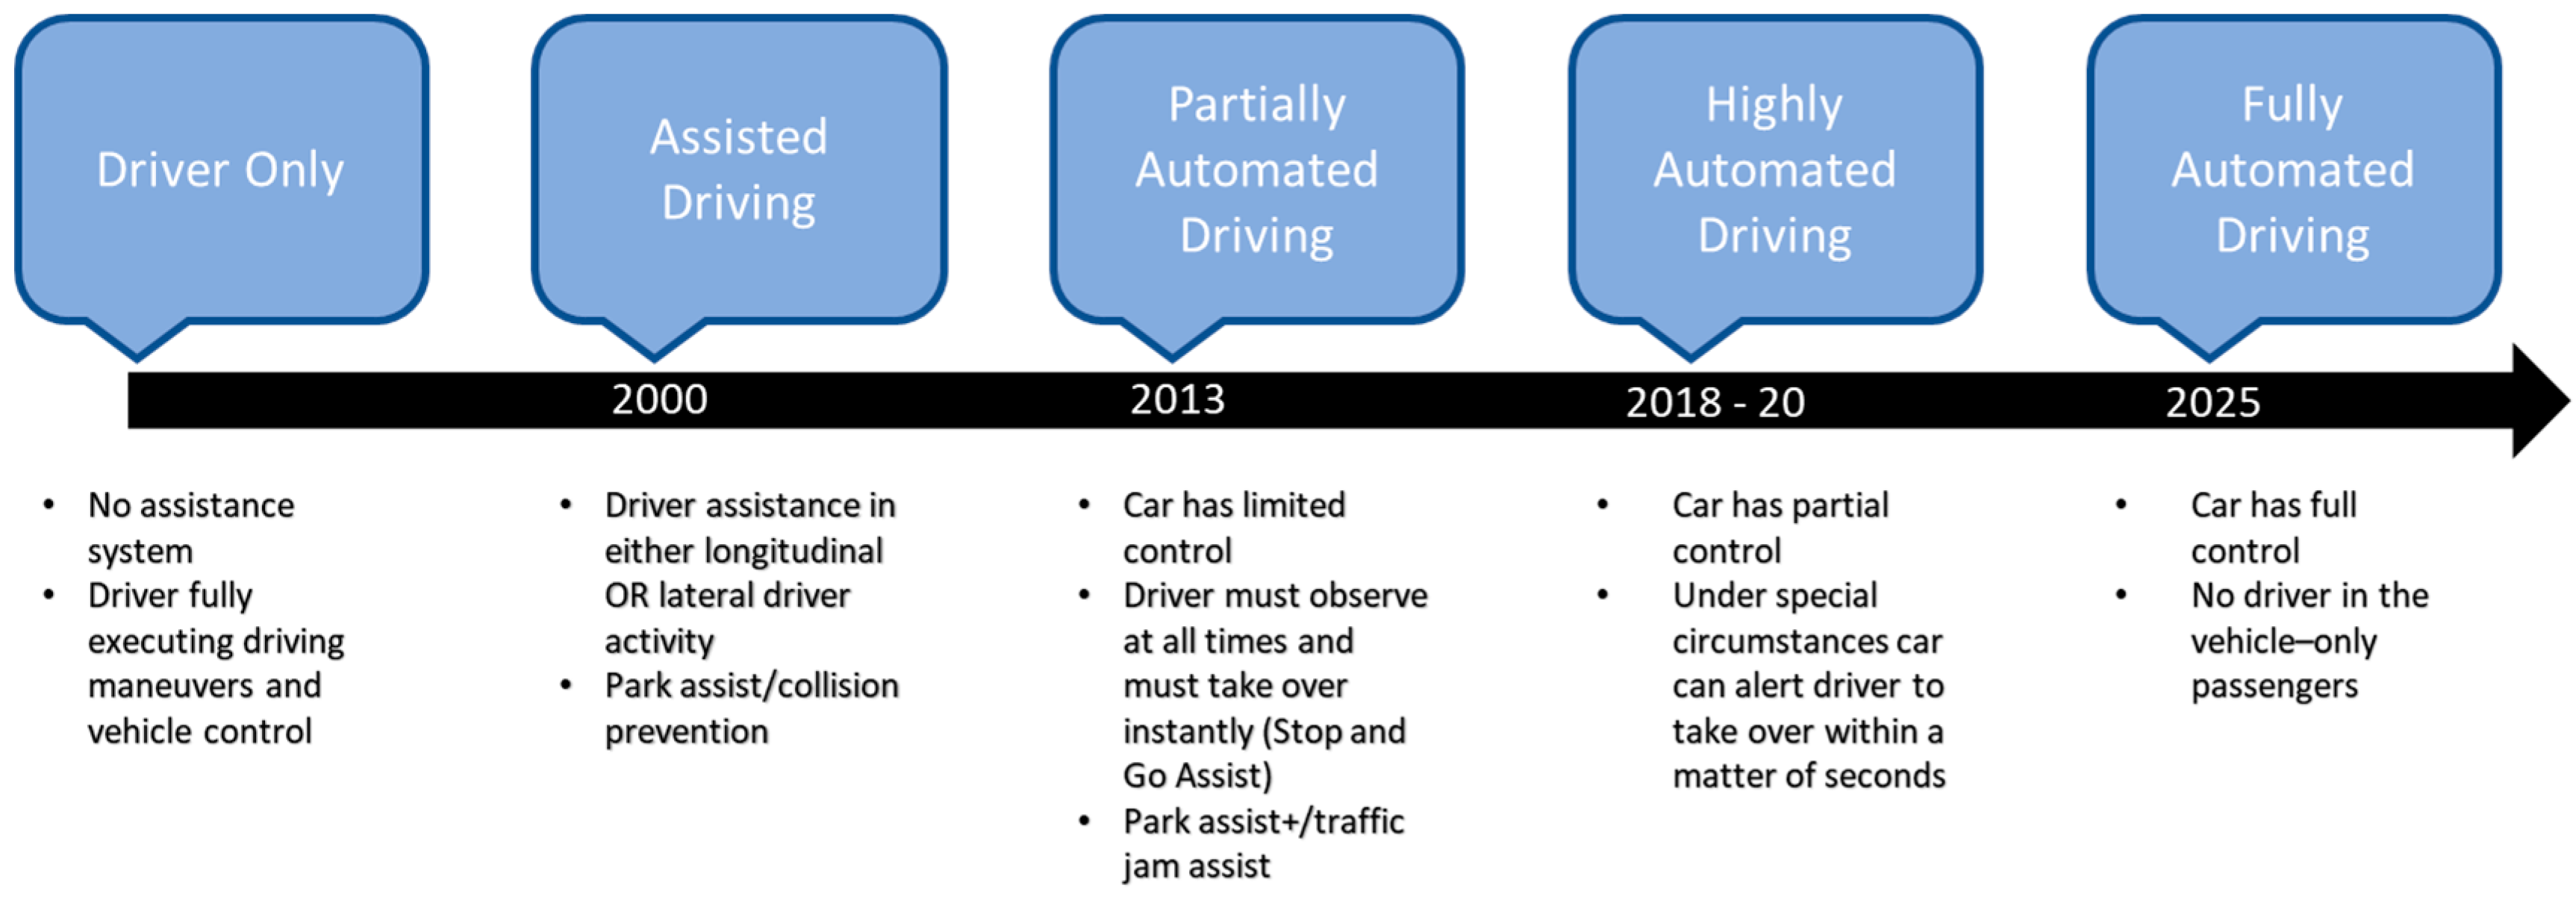
Self-driving cars are not yet available for end consumers. The first sales to consumers will happen somewhere between 2020 and 2035 (Figure 1). Nevertheless, a remarkable penetration of the market will take even longer. After the first consumer sale, there will be a lengthy transition period between 10–40 years until a substantial quantity of AVs are on the road. Moreover, both fully autonomous and ordinary cars will be together on roads for a more extended period [10,29].
The timeline shows us that autonomous vehicles “are no longer a fantasy and may soon become a daily mode of transport for hundreds of millions of people” [30] (p. 2). However, in order to facilitate the implementation of autonomous vehicles, early public acceptance must take place. Research on AVs has already shown that society’s population groups differ systematically in the willingness to use automated vehicles [31]. Men purchase AVs earlier and think that AVs are safer. “It was also found that men would be willing to pay more for automation than women” [32] (p. 39). Thus, it leads to our first hypothesis:
Hypothesis 1.
Women in comparison to men will show a higher level of concerns to use self-driving cars.
2.6. Few of the Most Discussed Benefits and Challenges of AVs
Self-driving car technology has the potential to impact safety, congestion, and travel behavior [33,34,35,36]. Therefore, advantages like crash savings, fuel efficiency, parking benefits, and time reduction can be achieved. Considering, for example, the crash numbers from the U.S., technological changes are necessary. In the U.S. there are 5.5 million crashes per year. Of those crashes, 93% are caused by human failure. AVs have the potential to decrease the number of crashes dramatically.
There are different opinions on how self-driving cars will affect traffic. On the one hand, the reduction in travel cost will increase traffic congestion. On the other hand, the usage of advanced driver-assistance systems ADAS systems will raise the throughput capacity on roads and decline the number of crashes. Both factors will cause a decrease in traffic congestion [8]. Table 3 below summarizes the most discussed benefits of AVs.
As discussed previously, the main issue of automobile accidents is human failure. Most of them would be preventable by AVs. Research by the World Health Organization claims that road traffic injuries will rise from the ninth (2.2% of the world total in 2004) to the fifth leading (3.6% of the world total) reason of worldwide death by 2013. Increasing prosperity in developing economies leads to a higher number of vehicles and drivers, which causes a likely increase in the death toll [1]. With the usage of AV technologies, the number of crashes could be decreased dramatically. Nearly a third of crashes could be prevented if all cars would be fitted with adaptive headlights, forward collision, lane departure warning systems, and side view assist. With this gadget, for example, the number of rear-end collisions can be reduced dramatically. Entirely autonomous cars will cut crash statistics because driver errors are responsible for a large percentage of crashes. Since 39% of crash fatalities are caused by the influence of alcohol, the usage of AVs could reduce this proportion near to zero [8]. Since many accidents are caused by human error, which can be prevented by the usage of autonomous vehicles, thus the researchers assume:
Hypothesis 2.
The higher level of automation in cars—the safer you feel in them.
As mentioned above, many advantages are arising from the introduction of AVs. To sum up, the safety and congestion-reducing effects of self-driving cars can lead to considerable changes in driving behavior. For example, AVs can enable mobility for people who are too young, as well as for older and disabled people, and thus make new demands on road capacity [40]. The parking pattern could change as AVs park themselves in less expensive areas. Moreover, car-sharing programs could be extended, as AVs could serve several people when needed [37]. We assume that there is a city–land gap in the willingness to use the technology. Due to the higher awareness of tradition, the use of new technologies in rural areas is lower than in cities.
Hypothesis 3.
People who live in cities in comparison with people who live in the countryside are well aware of AV technology.
The new technology of AVs has the power to dramatically modify how transportation systems run. Whereas the impacts of AVs for congestion and traffic safety have been predicted in detail, behavioral shifts have received little attention. Nevertheless, with the introduction of AVs, challenges will arise. Some of the most discussed challenges are listed in Table 4 [41].
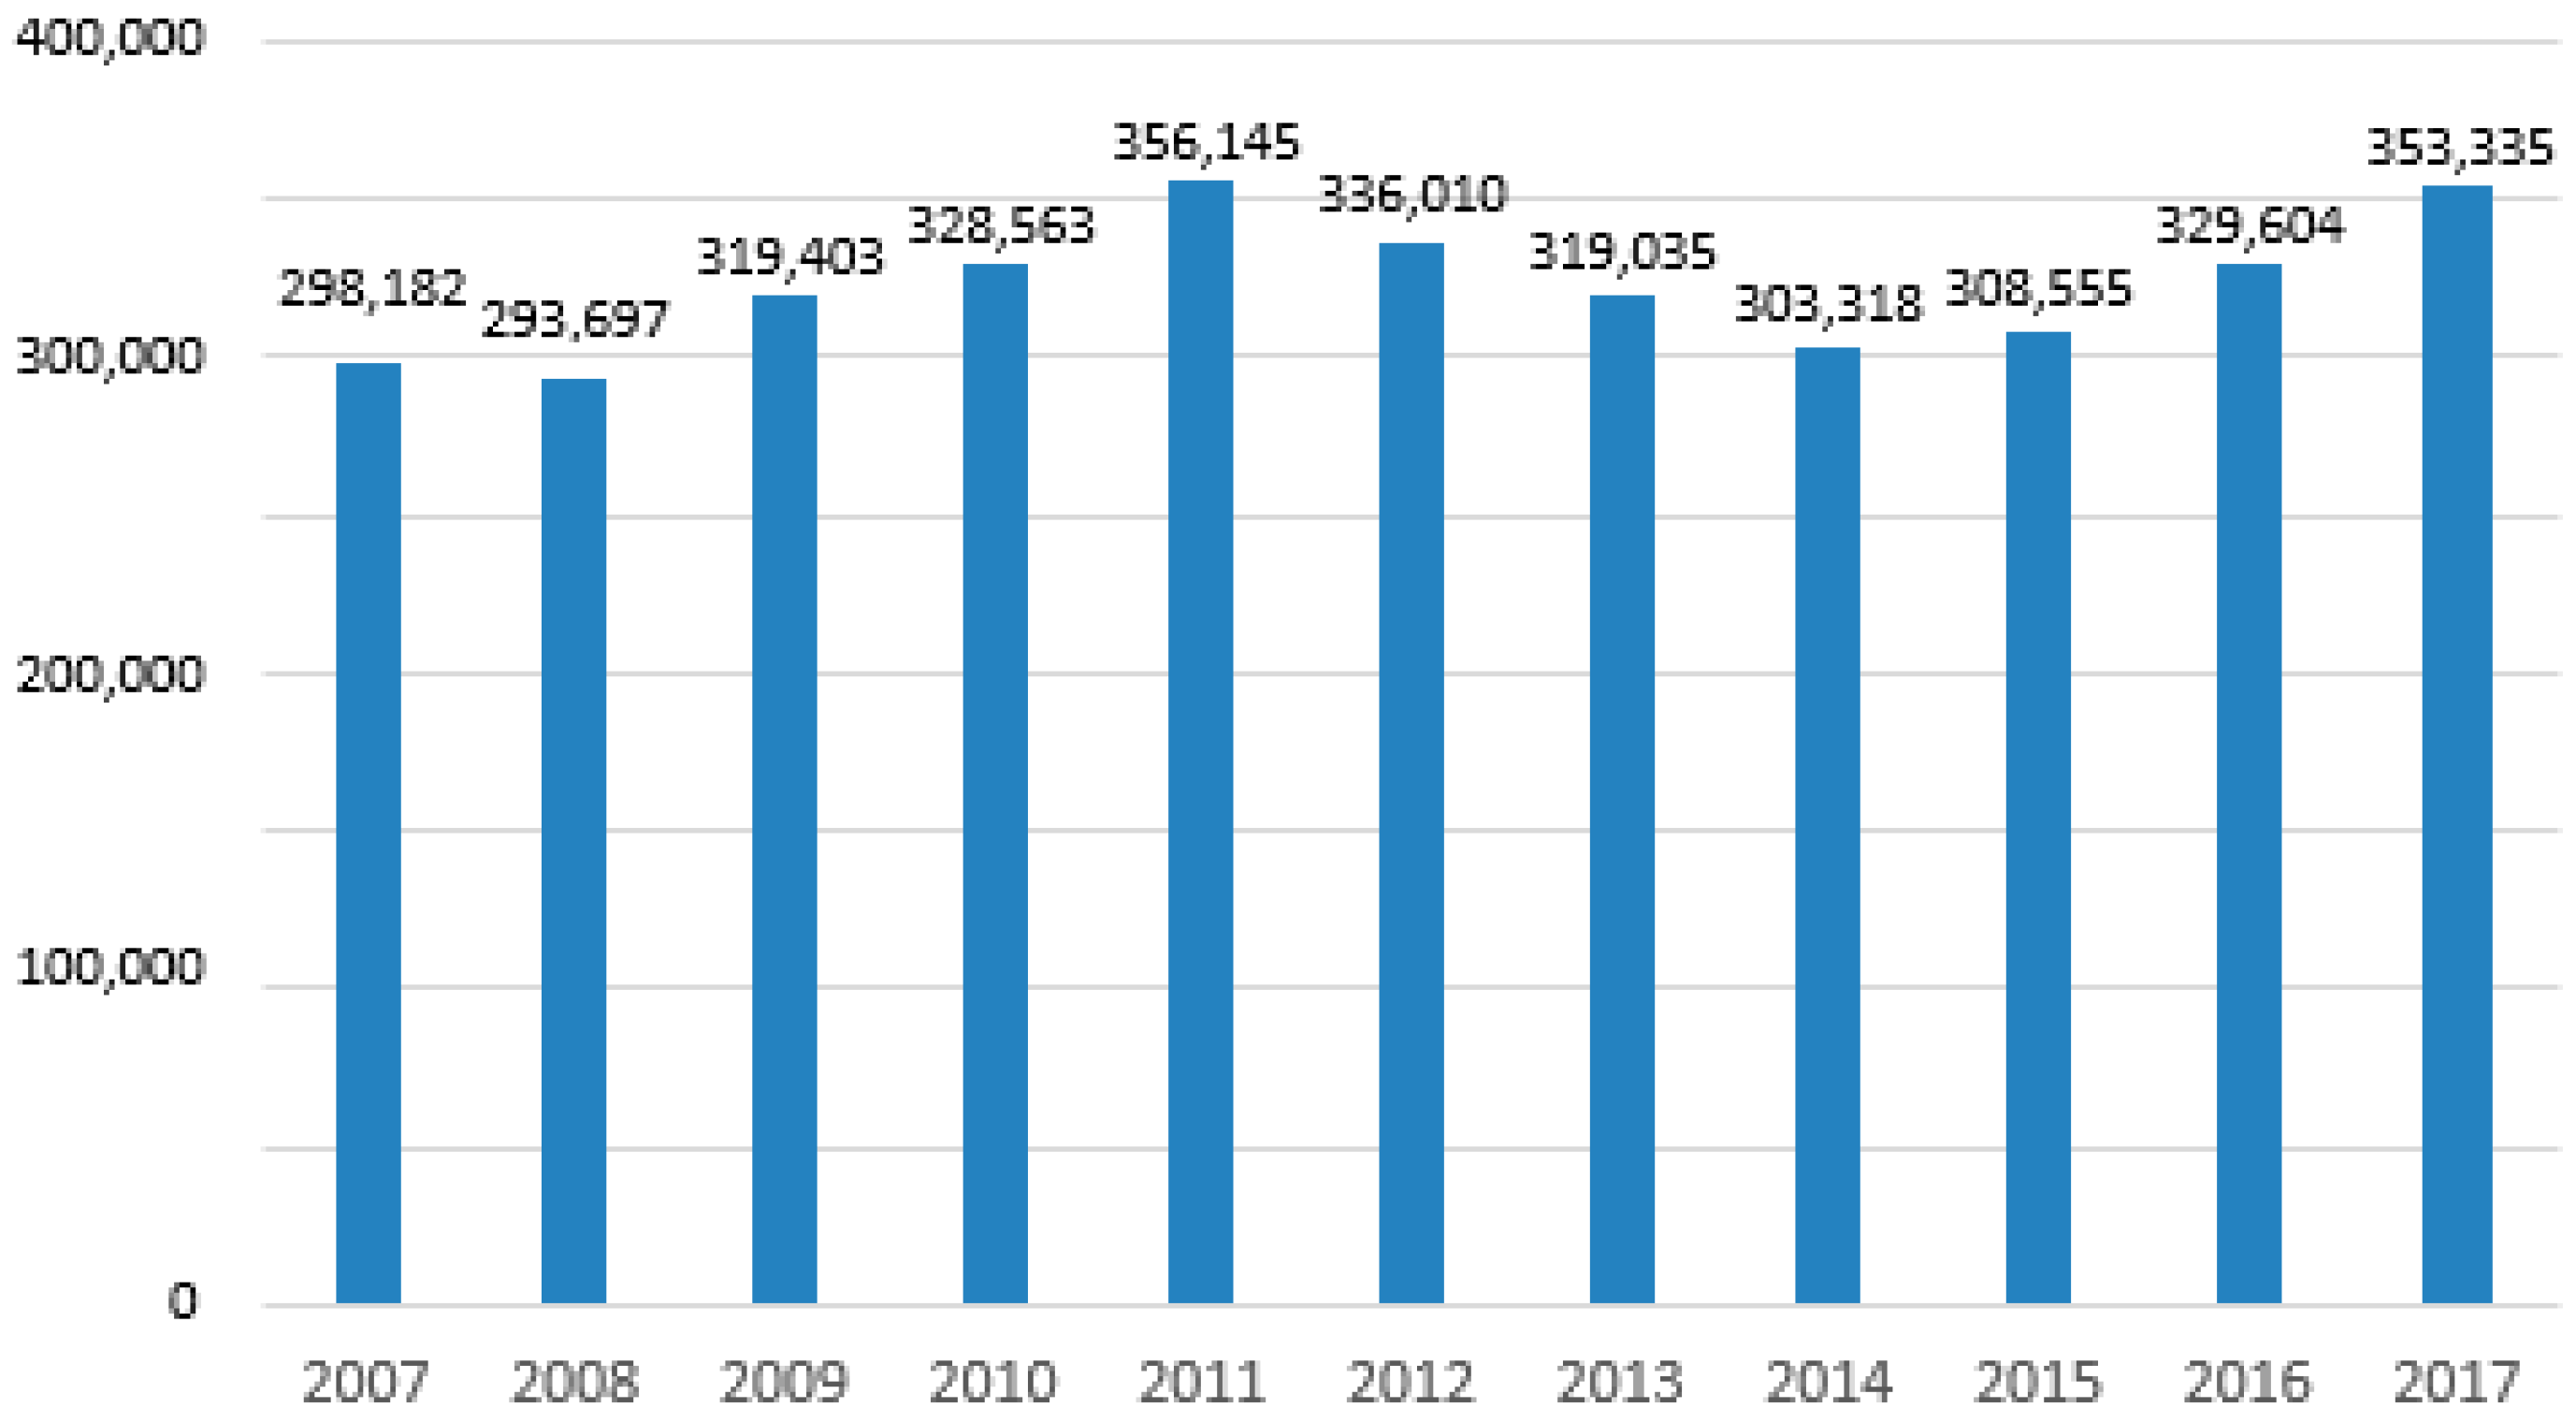
The number of passenger cars sold is very high. In Figure 2, we can see the number of cars sold in Austria from 2007 to 2017. Almost 300,000 cars are sold every year. In 2011 sales peaked, and 356,145 cars were sold. From 2014 to 2017, the number of cars sold rose steadily from 303,318 in 2014 to 353,335 in 2017 [45].
As mentioned above, the introduction of autonomous vehicles is only useful if there are many cars on the road. The attitude towards autonomous vehicles is, therefore, essential, as the success of the technology depends on it. Nevertheless, consumers’ confidence in conventional cars is still very high. Sales figures for conventional cars increase every year. As a result of this, the researcher assumes:
Hypothesis 4.
The higher concerns about AV technology—the lesser is consumers’ confidence and willingness to use the technology.
2.7. Point of View of Economic and Technical Trends—Car Sharing
An avenue for behavioral shifting could be car sharing. The program operates as a short-term rental where their members can rent a car which is typically located at an on-street parking space. Members of the car-sharing program pick up the car at the parking location, drive to a nearby destination, and finally pay the rental when finished with their trip. Different suppliers offer different rental rates like rentals by the minute or by longer rental intervals. Today car-sharing programs such as Car2Go and Zip Car exist around the globe, and the number of users is rising and will become even more critical as capacity utilization can be improved [41,47].
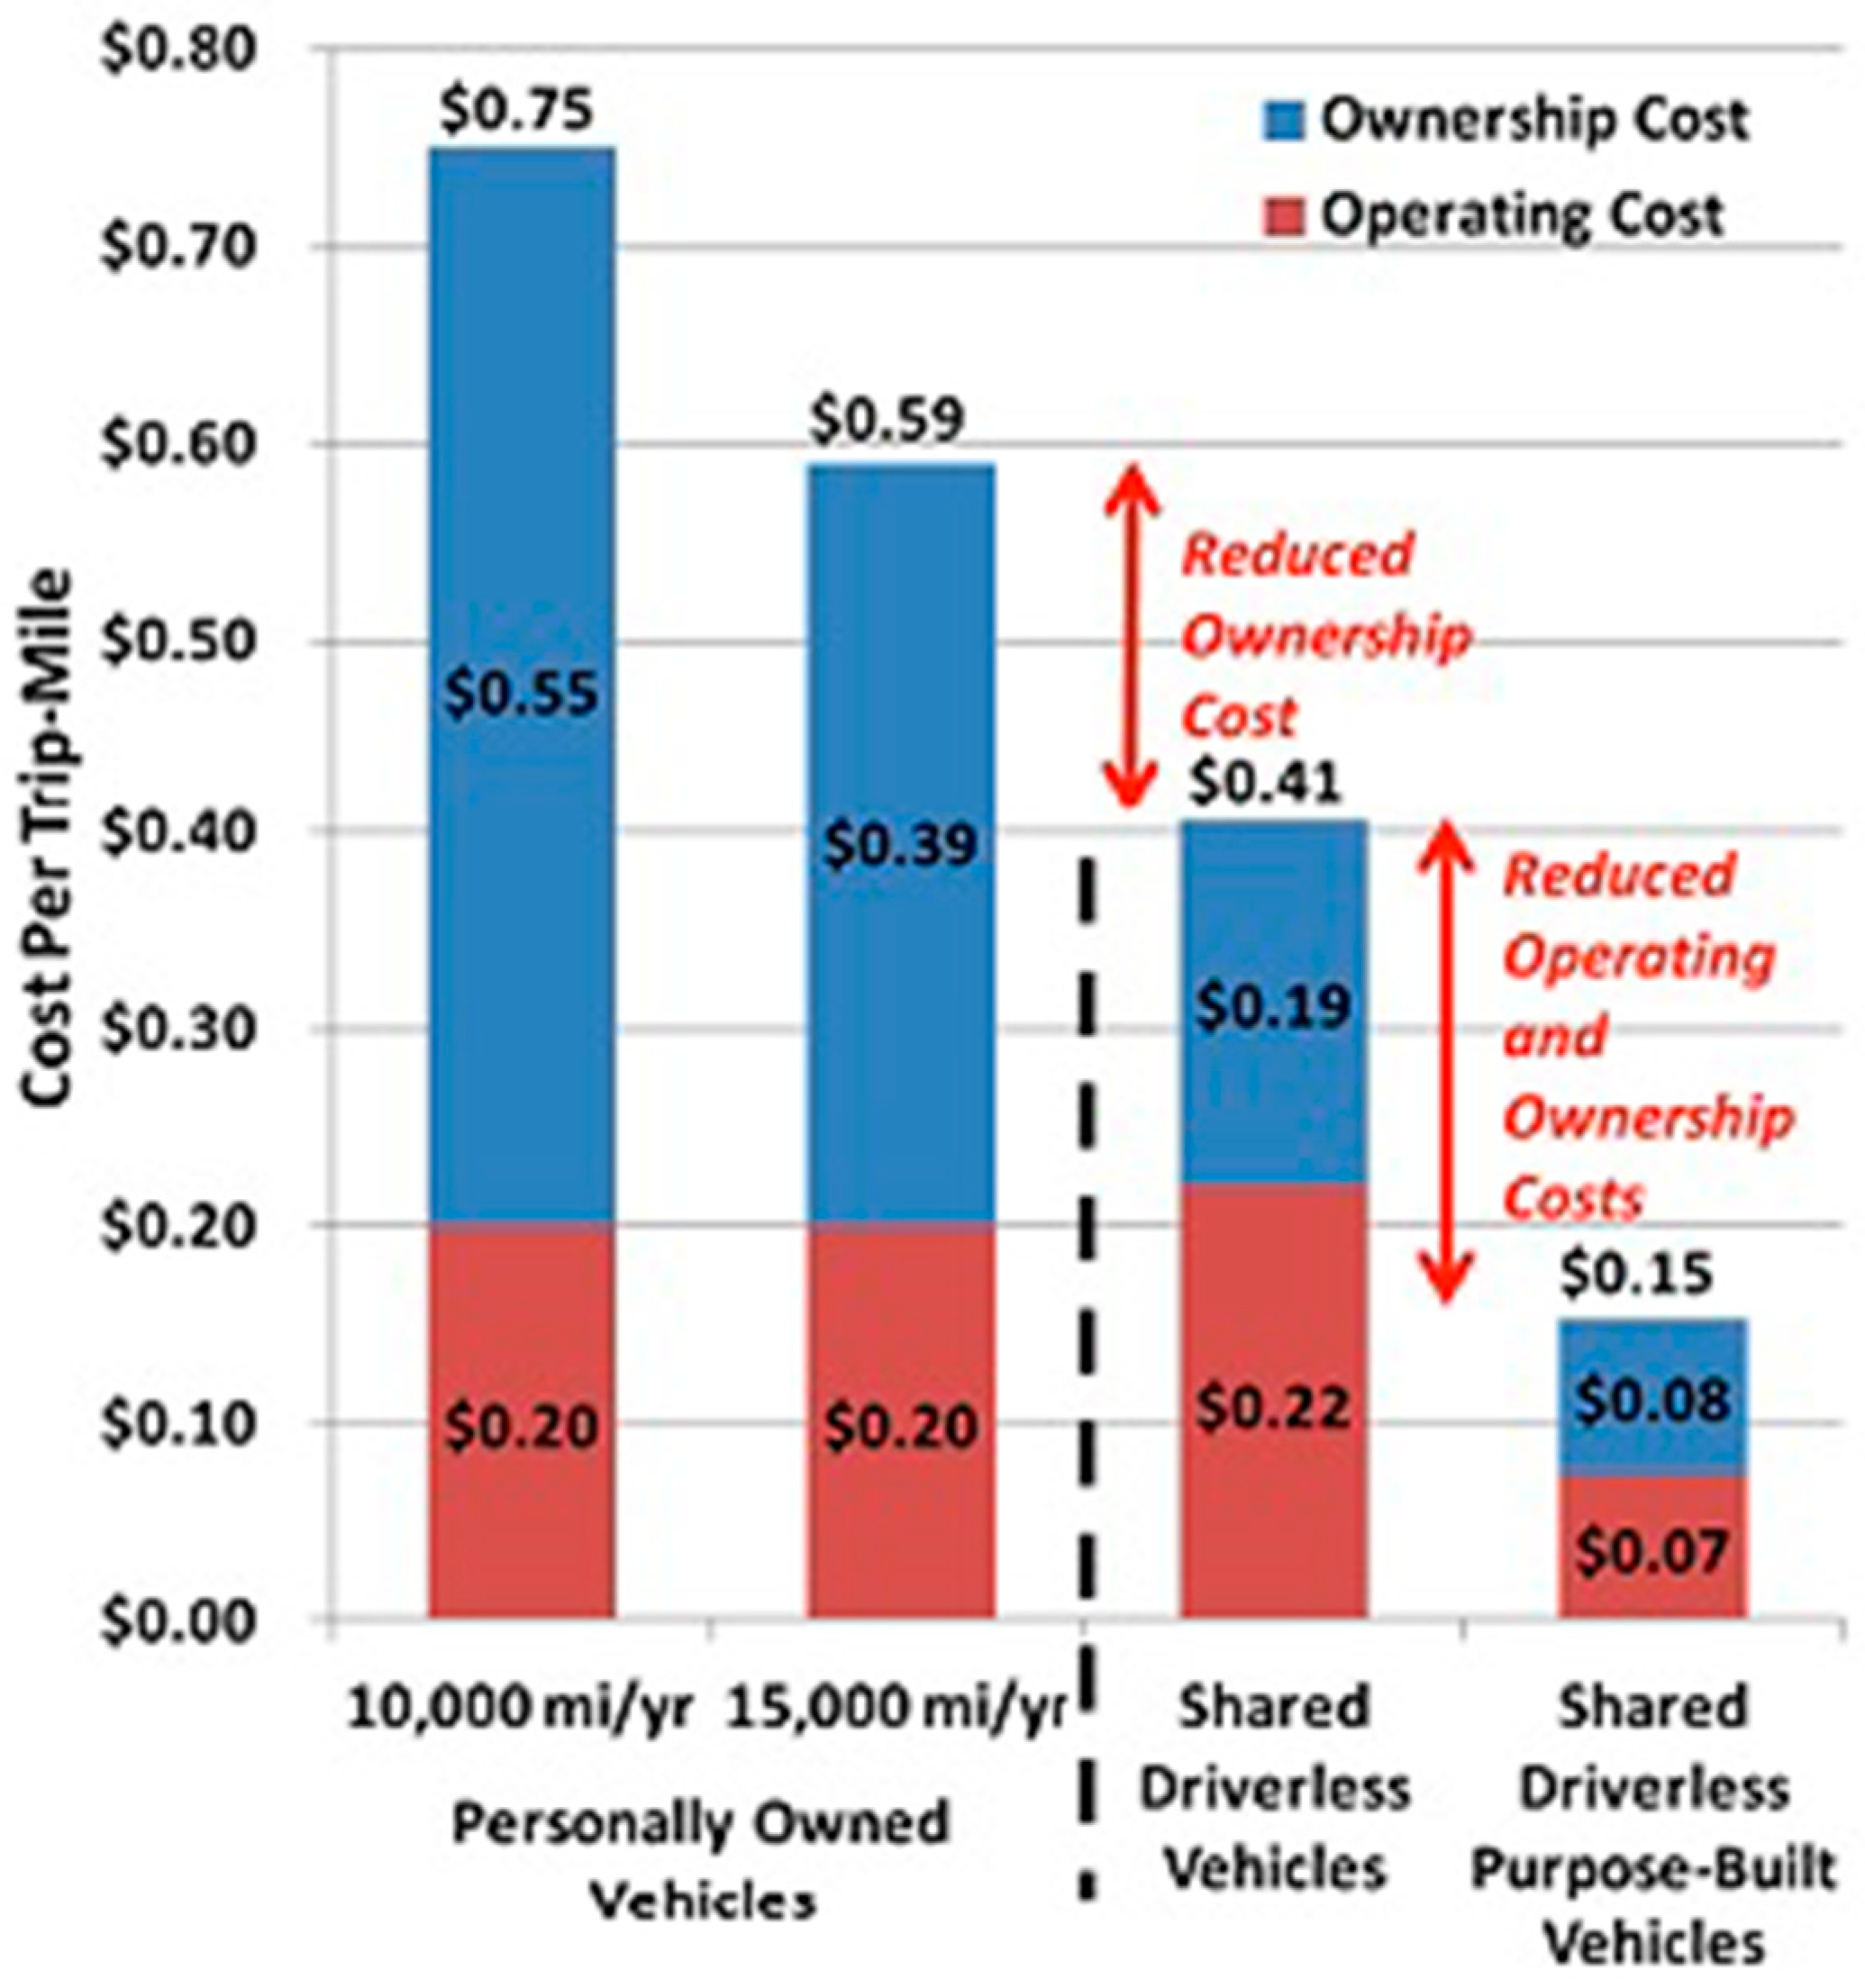
However, why is car sharing so important? On the one hand, the high acquisition costs of autonomous vehicles will favor car sharing. Moreover, combining AVs with shared vehicle systems generate new opportunities to provide better mobility at a lower cost. The new automated system would enable a monthly or shared pay-by-the-mile subscription business model instead of outright ownership [1,48,49,50]. Such visions may provide significant environmental benefits. For example, in the form of reduced parking and car ownership needs [41]. Although the impacts are difficult to predict, shared vehicles could reduce car ownership up to 43% and rise vehicle travel by up to 75% [23]. According to a case study of Ann Arbor, Michigan, a shared driverless car can lower the trip cost by 80% [1]. As we can see in Figure 3, there are many advantages of combining AVs, which leads to our next hypothesis:
Hypothesis 5.
The higher level of automation in cars—the higher is the willingness to use the AV for car sharing.
Carmakers are reacting to the opportunities and risks by fostering their self-driving technology. They are supporting owners of cars to earn money by renting unused cars out to other individuals (using GM’s OnStar technology). General Motors and Relay Ride, for instance, introduced a peer-to-peer car sharing marketplace. In this system, car owners can connect with others who need to rent a car. In this process, only the smartphone is used. It is possible that at least a proportion of the car drivers will entirely depend on a shared ownership business model. Such a model would also affect the existing automobile industry. Over time net units’ sales would decline [1].
3. Methodology
This section briefly explains the methods and materials used to analyze the collected data.
3.1. Data Collection
As discussed by Azmat et al. [29], a five-level Likert scale-based online survey was used to collect data for this study. “Using a web-based method to gather public opinions, is a reliable tool in social research for quantitative or empirical research” [31] (p. 377). In order to measure personal preferences, the scaling method ‘5-point Likert scale’ was mainly used. The respondents can, therefore agree or not agree to a greater or lesser extent with each statement (the higher the agreement, the higher the number). For the online implementation, the survey program ‘Lime Survey’ was chosen. Lime survey makes it possible to conduct multilingual surveys. Since the survey was carried out in German-speaking country (Austria), users were given a choice to select their language as English and German. The data collected through this survey was completely anonymous; no identifiable personal information was collected. The type of data collected through this survey was ordinal.
3.2. Analysis Technique
The initial examination and testing of the data showed that the data do not meet the requirements of an approximately normal distribution, which are necessary to apply parametric tests. Therefore, a non-parametric statistical testing approach was used to assess and analyze the collected data [29]. The outcomes of the survey were calculated using Mann–Whitney U Test as suggested by Rivera et al. [49] and Song and Wang (2009) [51] and Spearman’s rank correlation as suggested by Abraham et al. [5]. The Mann–Whitney U test has great significance when the data are not normally distributed; besides, the variables only need to be ordinal in type. This test allows the researcher to assess whether the central tendencies of two independent samples are different, whereas, Spearman’s rank correlation analysis calculates the linear relationship of at least two ordinal variables. The advantage of rank correlation analysis is that the data do not have to be distributed normally.
During the creation of the questionnaire (see supplementary file), five sections (A to E) were formed. The formation of question groups made it possible to set priorities (Table 5). The following table shows which research questions have been incorporated into which sections and its related hypotheses. In order to evaluate as accurate as possible, all questions have been defined as mandatory.
Section A was constituted for collecting the demographic data. The sample consists of 192 participants (n = 192). A total of 115 female and 77 male participants responded to the online questionnaire.
4. Results
This section highlights the principal findings of this study.
4.1. Descriptive Statistics about Consumers’ Concerns towards AV Technology
In order to find out more about consumers’ attitudes towards AV technology, participants were asked questions like: “What are your concerns about replacing conventional cars with self-driving cars?”
In order to obtain an overview of individual concerns, descriptive statistics were carried out (the variables concerns were metrically scaled), which can be seen in Table 6 below. If we look at the minimum and the maximum, it is noticeable that for each sub-question, both the answer with the least (1 = strongly disagree) as well as the answer with the most (5 = strongly agree) agreement was chosen, which indicates that there is a notable difference in consumers’ concerns. Nevertheless, if you look at the mean, you can see that the value for all sub-questions is 3.68 or higher. It can be said that on average, the participants agree with the concerns given in the questionnaire. The variable ‘legal concerns’ has the highest agreement with a mean of 4.08. Which means that for this part of the question, participants have at least chosen the answer, “I agree.” Therefore, legal concerns among participants are high. Also, it is interesting to consider the standard deviation for this variable. In general, the standard deviation indicates the average distance between the individual measured values and the mean value. With a value of 0.978, the standard deviation is lowest for this variable, which means that there is a lower deviation of data around the mean in legal terms than in other concerns. The variable ‘cost concerns’ has the lowest agreement with a mean value of 3.68. For this question, participants have at least chosen the answer “Neutral”. Compared to the other concerns, ‘cost concerns’ are least pronounced. The standard deviation for this variable is 1.068. Thus the ‘cost concerns’ deviate more from the mean than others.
4.2. Index Concerns
Next, we will verify the correlation between the variables concerns and ‘age.’ To simplify the evaluation, an index, regarding consumers concerns, is formed. The reliability analysis is used to examine if the variables ‘safety concerns’, ‘transition concerns’, ‘legal concerns’, ‘cost concerns’, and ‘cyber concerns’ check the data reliability so that further analysis could be performed on the obtained data. The concern variables are combined to create a new variable ‘concerns index’. To determine the internal consistency, Cronbach’s alpha (Table 7) was calculated for the positive subscale effect (five questions in total). Cronbach’s alpha indicates the extent to which the indicators correlate with each other. Following researches followed this pattern [52]. The internal consistency was high, with Cronbach’s alpha = 0.70 for positive affect. Due to the strong correlation of the items to each other, an index may be formed.
Table 8 shows the correlation between the indicators. All indicators have a positive correlation. The lowest value is 0.220 (correlation between the variable ‘transition concerns’ and the variable ‘cost concerns’), and the highest value is 0.388 (correlation between the variables ‘transition concerns’ and ‘cyber concerns’). The higher the value in the table, the more correlated the items are with each other.
4.3. The Influence of Gender on People’s Concerns
Next, we will consider if gender has an impact on people’s concerns. In Table 9, ‘1’ represents female respondents, and ‘0’ represents male respondents.
Although the number of participants (n = 192) is high, due to the non-normal distribution of the variable gender, a non-parametric method was used. In order to answer the research question, the Mann–Whitney U test was used (Table 10). In this case, the test allows seeing whether there is a dependency between the variable ‘gender’ and the variable ‘concerns index.’ The null hypothesis of the test indicates that the variable ‘gender’ and the variable ‘concerns index’ are stochastically independent of each other. Since the sample is sufficiently large (n > 30), the asymptotic significance is reported. The U-value is 3351.00. The critical value can be taken from tables. For the two-sided significance level 0.05, it is ±1.96. Since the amount of the test statistic is higher than the critical value, the difference is significant. The p-value is 0.004. Since the p-value (significance) is below 0.05, H1 is accepted.
4.4. Descriptive Statistics about the Feeling of Safety
In order to find out more about the feeling of safety of consumers in a conventional car and in an AV, the participants of the survey were asked the following question: “How safe would you feel in an AV vs. a conventional car?”
As already mentioned above, the Likert scale was used to measure the attitudes of the participants. In Table 11 below you can see the descriptive statistics for the feeling of safety in a conventional car (variable ‘safety conventional’) and the feeling of safety in an AV (variable ‘safety AV’). The variables are scaled metrically. Analyzing the minimum and the maximum we can see that for each question the answer with the lowest (1 = very unsafe), as well as the answer with the highest (5 = very safe) agreement, was chosen. If we compare the means, there are considerable differences. The variable ‘safety conventional’ has a mean of 3.81 and a standard deviation of 0.848. As the mean is higher than 3, participants have at least chosen the answer “Neutral.” However, as the mean value is almost 4, there is a tendency that consumers feel safe in a conventional car. In comparison, the variable ‘safety AV’ has a mean of 2.64 (on average, participants have indicated that they feel slightly unsafe in an AV) and a standard deviation of 1.083, which is slightly higher than the standard deviation of the variable ‘safety conventional’. In general, one can say that on average consumers feel safer in a conventional car.
4.5. Feeling of Safety
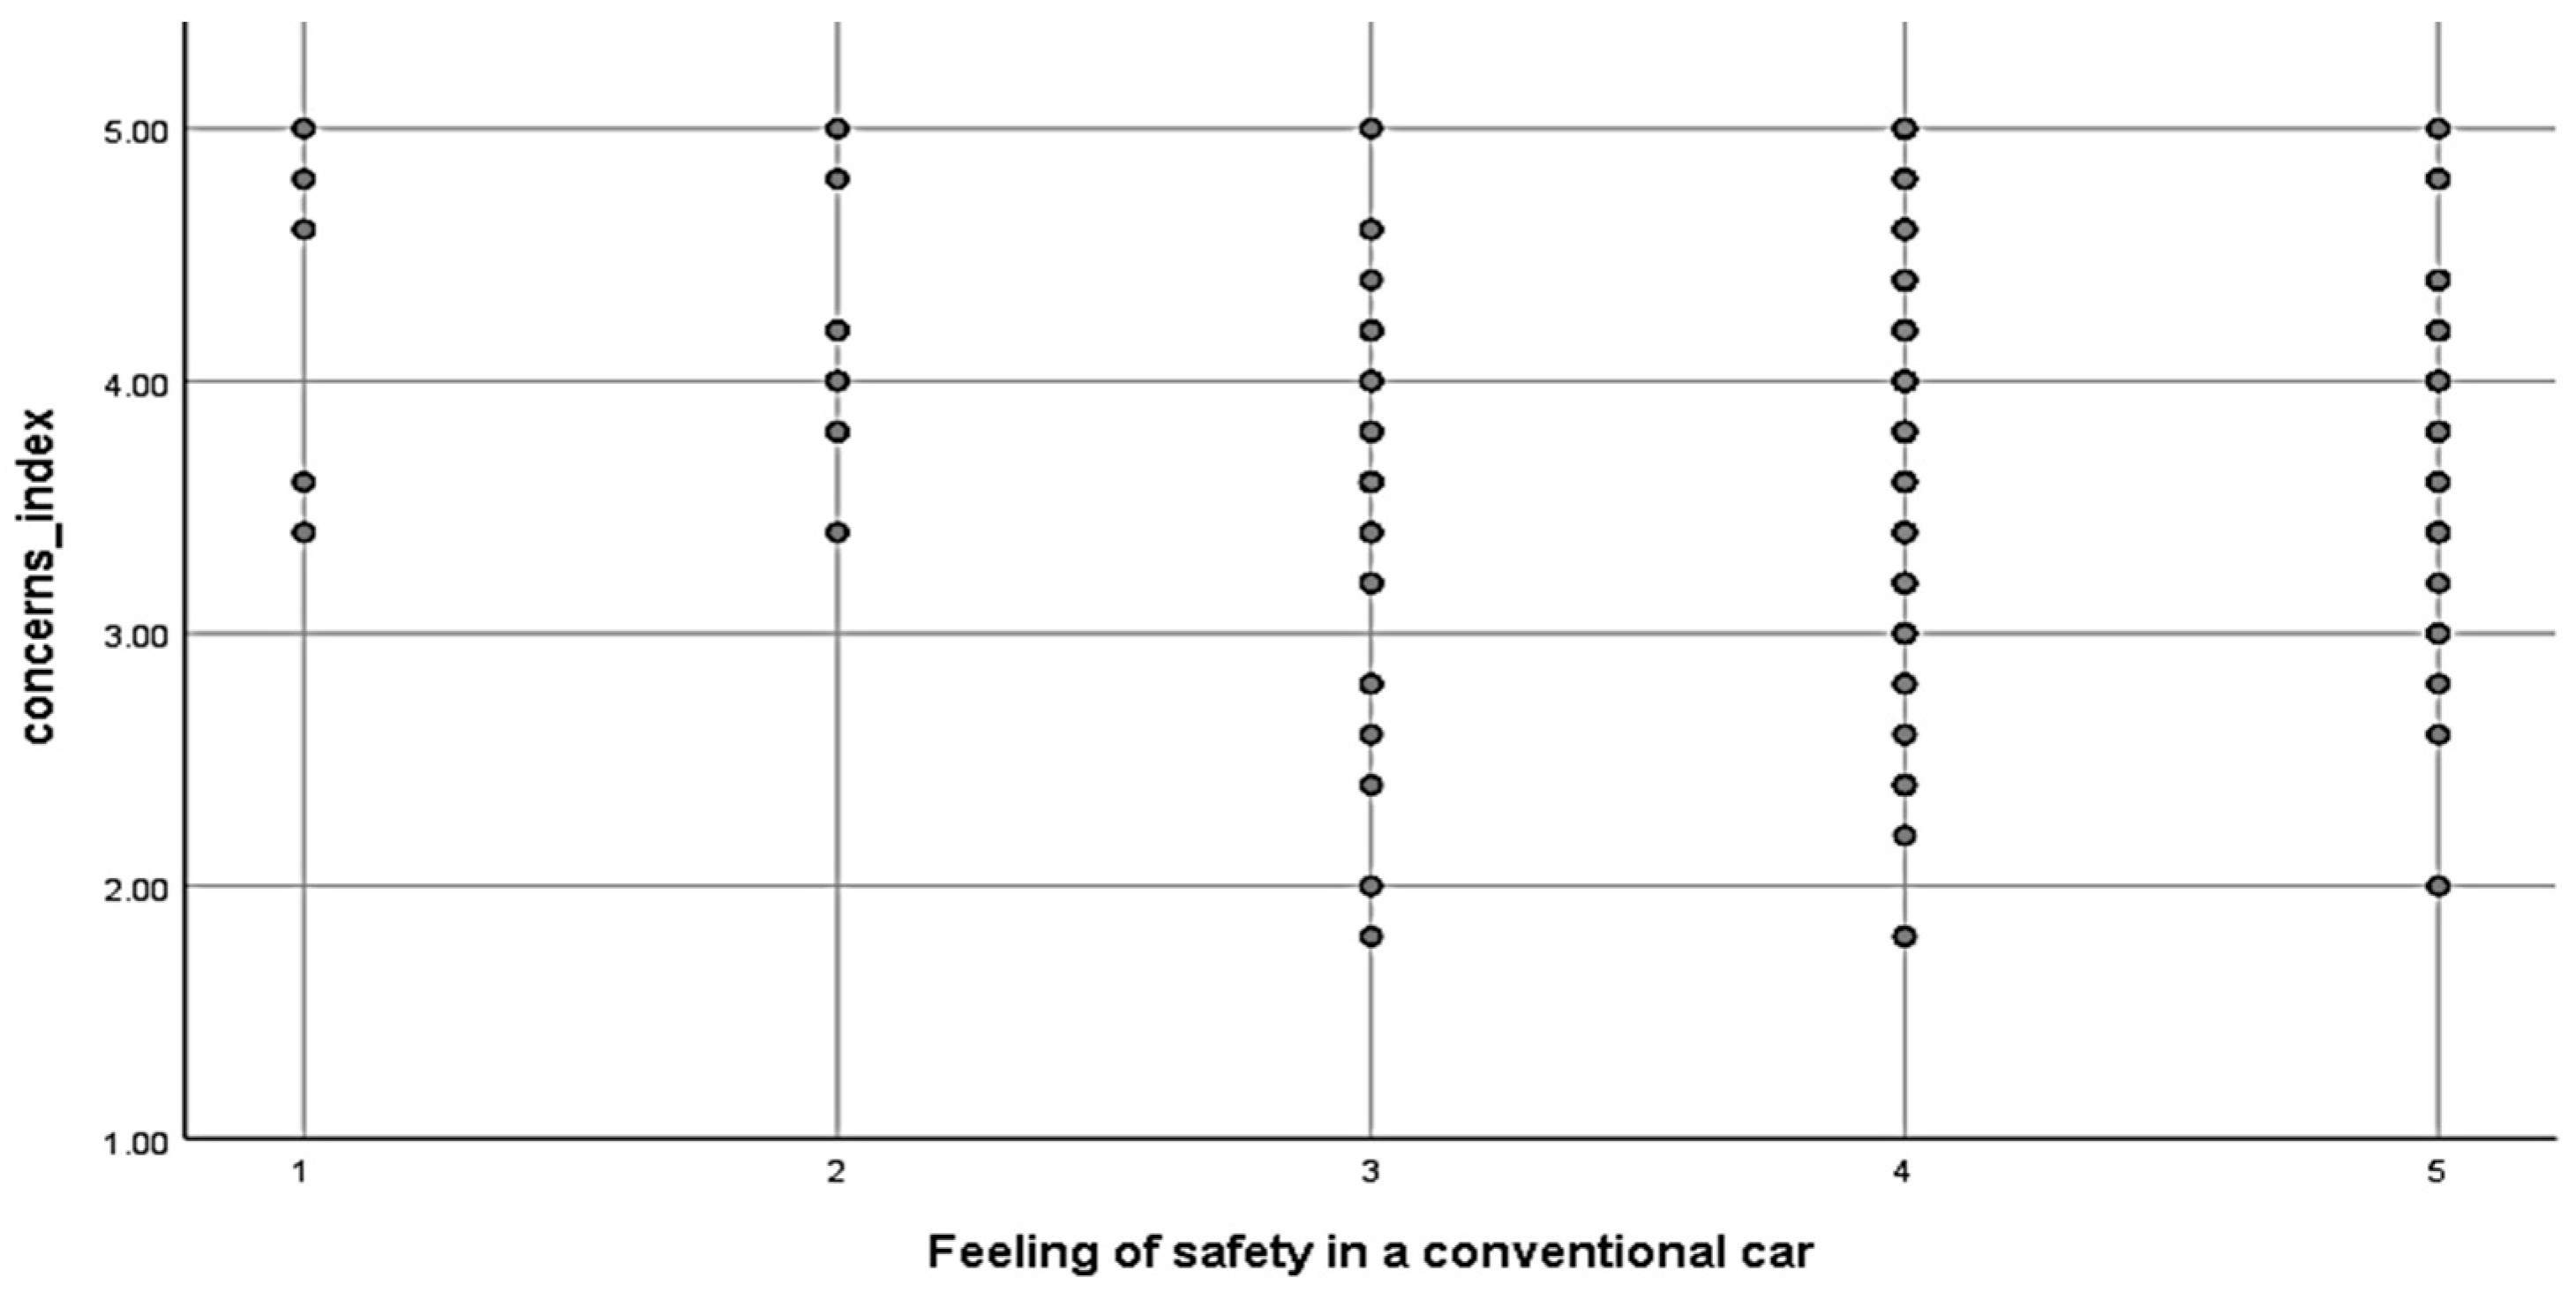
To determine the connection between the variables ‘safety conventional’ and ‘concerns index’ ranking correlations, according to Spearman, are used Table 12. Correlations are between concerns index and feeling of safety in a conventional car. The correlation coefficient shows the strength of cohesion between the variables. With a value of 0.038 barely any correlation can be determined (r = 0.10). For significance, one considers the p-value. In this case, the p-value is 0.605, which is higher than 0.05; therefore, it may be assumed that correlation is not statistically significant.
The scatterplot in Figure 4 below shows the correlation between the two variables ‘safety conventional’ and ‘concerns index.’ On the x-axis, you can find the variable ‘safety conventional,’ and the y-axis indicates the variable ‘concerns index.’ One can see that there is only a small correlation between the variables.
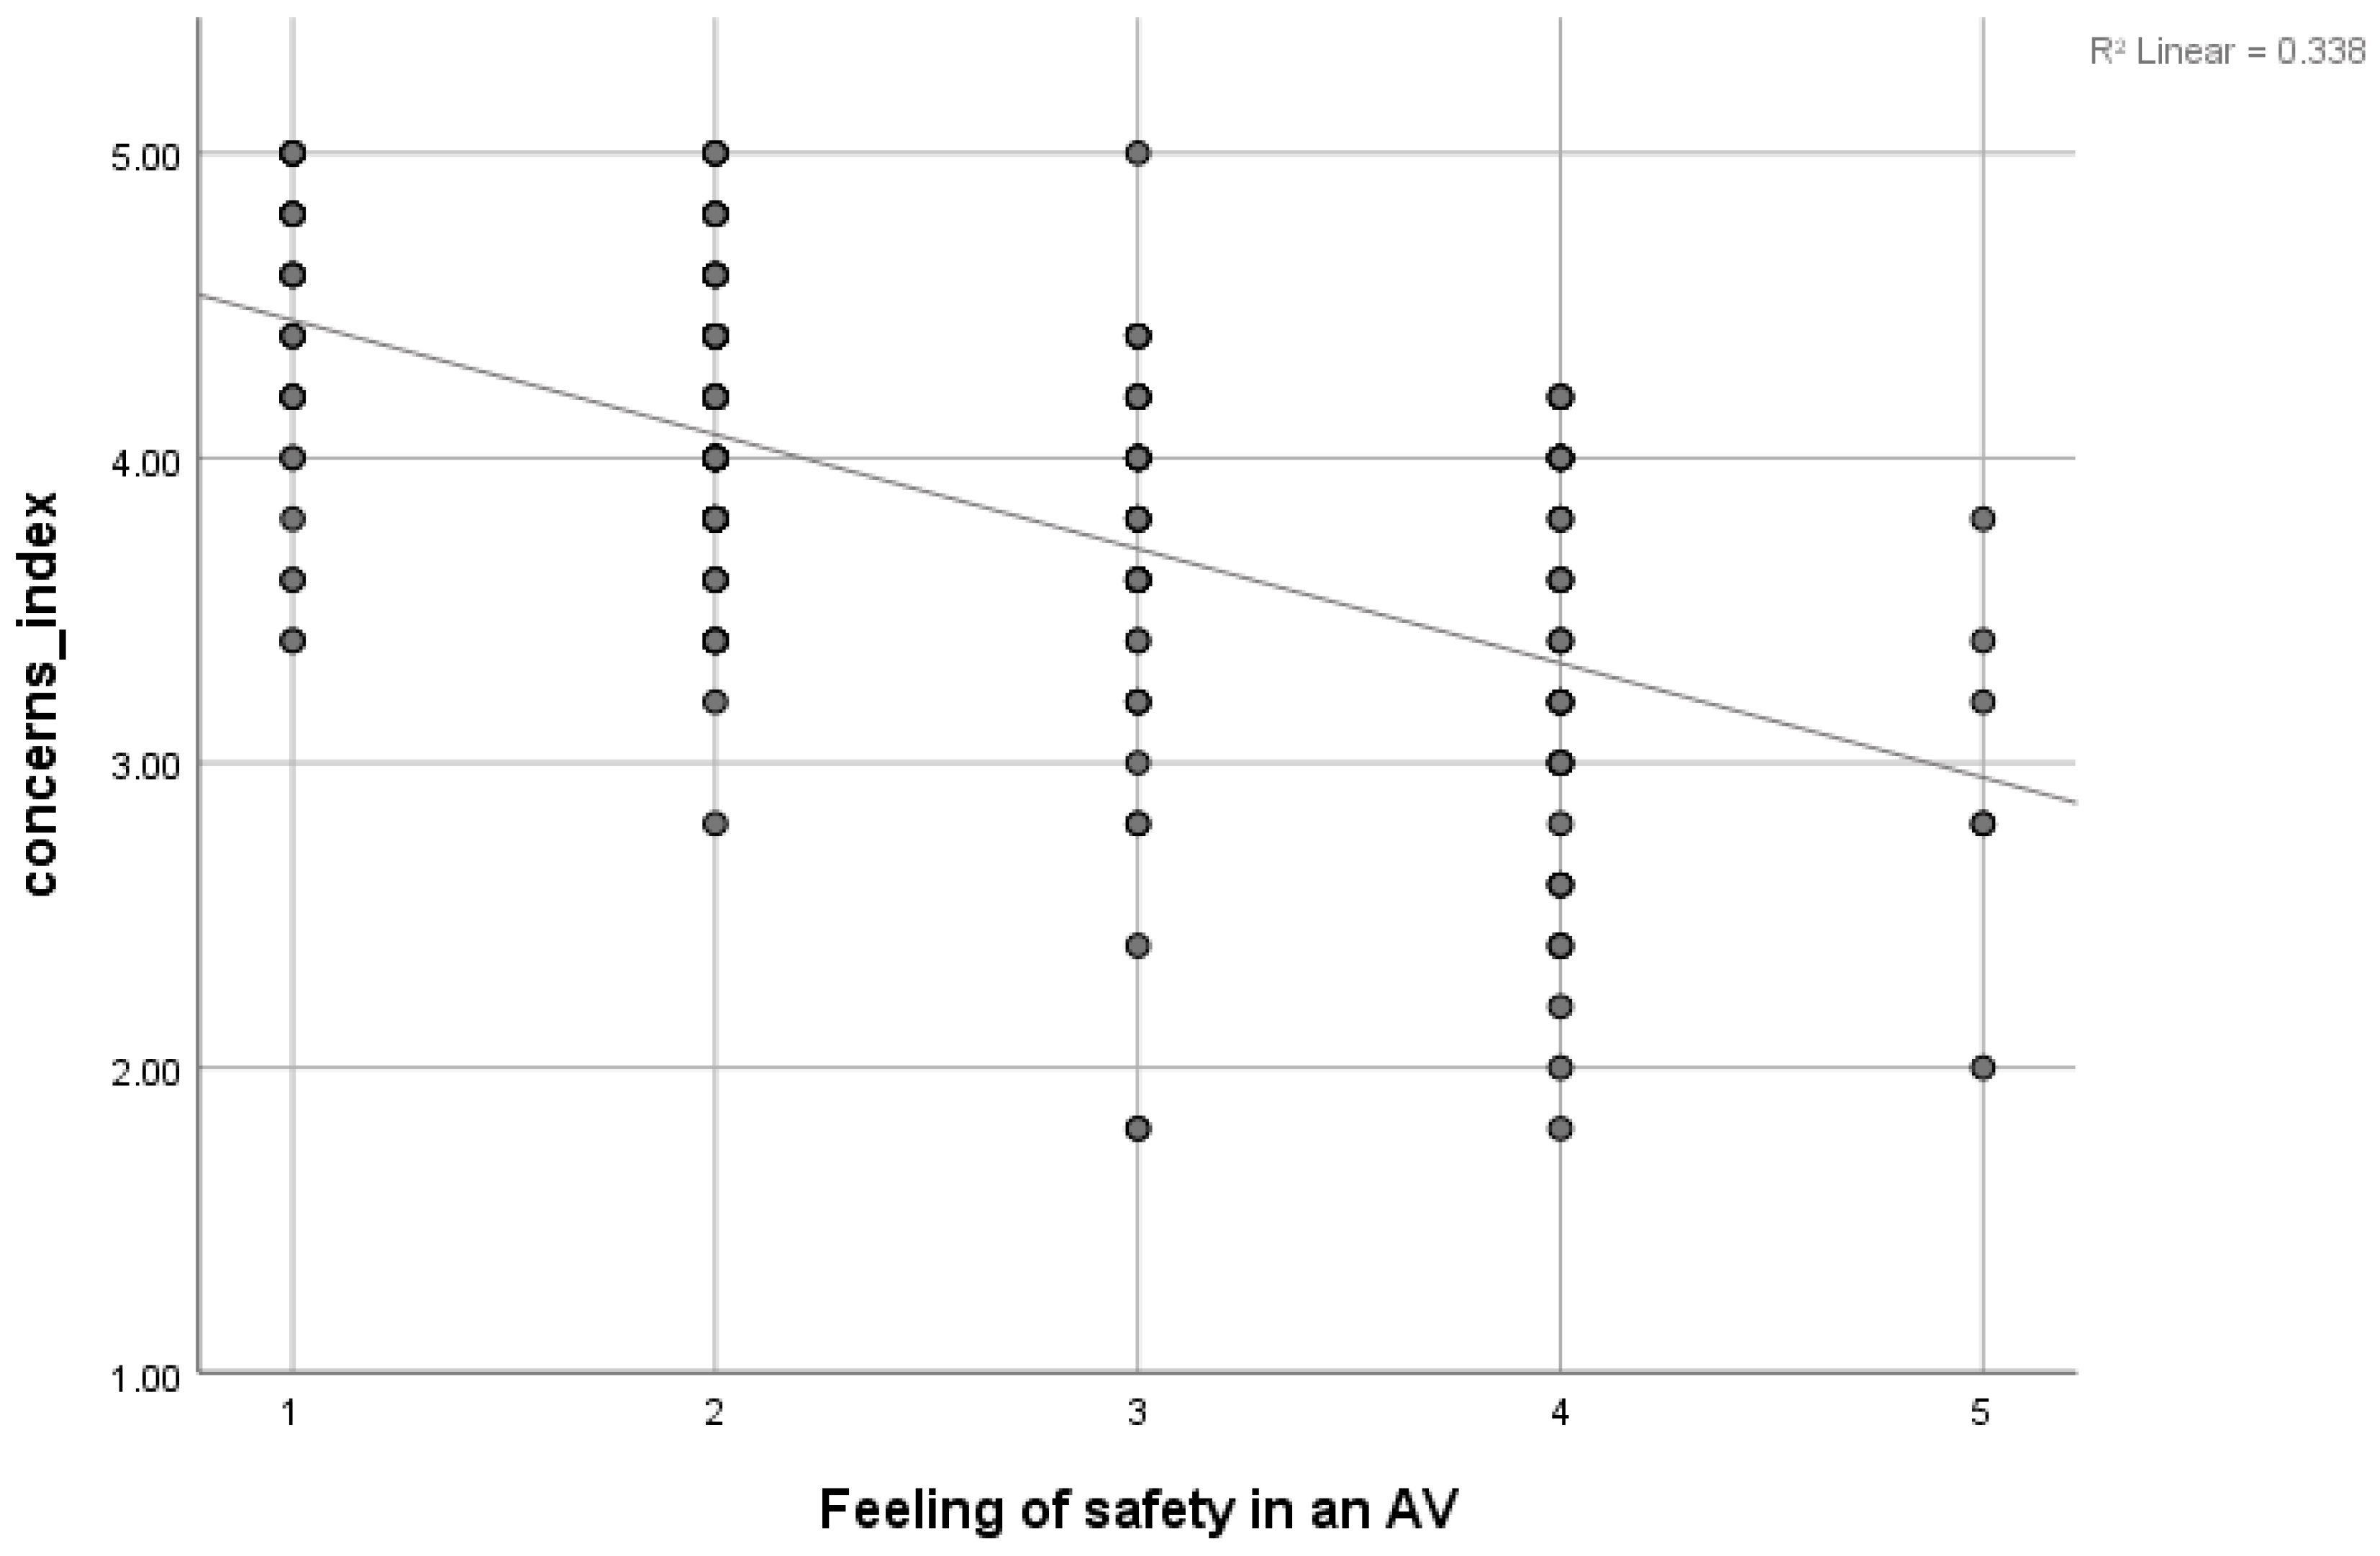
The next step is to determine whether there is a correlation between the variables ‘safety AV’ and ‘concerns index.’ The rank correlation analysis, according to Spearman, tells that the correlation coefficient is –0.58. Thus, one can speak of a strong effect (r = 0.50). To determine whether there is a significant correlation between the variables, we look at the p-value. The p-value is 0.000. Therefore, the correlation is statistically significant (p < 0.01) (Table 13). Since the algebraic sign of the correlation coefficient is negative, we use the term negative correlation, which means that a higher feeling of safety in an AV is accompanied by lower concerns about AV technology.
In Figure 5 below, one can see the scatterplot of the variables ‘safety AV’ and ‘concerns index.’ The x-axis indicates the variable ‘safety AV,’ on the y-axis you find the variable ‘concerns index.’ In the figure, we can see that there is a linear, negative correlation between the variables.
4.6. Influence of Place of Residence on People’s Concerns
Most of the participants do not have their principal residence in a city but in the countryside (0 = countryside and 1 = city) as shown in Table 14. Furthermore, the Mann–Whitney U test was used to see whether there is a difference between the variable ‘city’ and the variable ‘concerns index’ (Table 15). The null hypothesis of the Mann–Whitney U test indicates that the variable ‘city’ and the variable ‘concerns index’ are stochastically independent of each other. Since the sample is sufficiently large (n > 30), the asymptotic significance is described. The critical value can be taken from the tables. For the two-sided significance level 0.05, it is ±1.96. Since the amount of the test statistic is lower than the critical value, the difference is not significant. The p-value is 0.293. Since the p-value is above 0.05, the null hypothesis is retained.
4.7. Timeline
Finally, the participants of the survey were asked: “When do you think the following scenarios will take place” (section E in the questionnaire). Three scenarios were questioned: first AV on Austrian roads, private use of an AV, and conventional cars are entirely replaced by self-driving ones. These five answer options were given: 2025, 2030, 2035, 2040, or later and never. More than 80 out of 192 people believe that the first AV will already be on Austrian roads in 2025.
Moreover, more than 60 people think that the first AV will be on Austrian roads in 2030. Fewer participants agree with the answer options 2035, 2040, or later and never. Only two participants indicated that they could never think of the scenario “First AV on Austrian roads.” Next, we consider the scenario “Private use of an AV.” Many of the participants, more than 50 out of 192 people, indicated that they think that the private use of an AV will not happen until 2035. Furthermore, almost the same number of people believe that private use will take place in 2030. The answer option 2040 or later is ranked third. Fewer participants agree with the answer option 2025 and never. Finally, the scenario “Conventional cars are completely replaced by self-driving ones” is regarded. More than 100 out of 192 participants think that this scenario will take place in the year 2040 or later. Over 70 people believe that a complete replacement by self-driving cars will never happen. The other answer options have little or no agreement.
It can be assumed that thinking AVs will not replace conventional cars, and high concerns regarding AVs are somehow related. Therefore, the next step is to find out whether there is a correlation between the two variables ‘concerns index’ and ‘when replaced.’ Both variables are scaled metrically. The rank correlation analysis, according to Spearman calculates the correlation coefficient as 0.289. Thus, one can speak of a medium effect (r = 0.30). In order to identify whether there is a significant correlation between the variables, we consider the p-value. The p-value is 0.000 (Table 16). Therefore, the correlation is statistically significant (p < 0.05). The algebraic sign of the correlation coefficient is positive, which means that consumers with more severe concerns about AV technology think that a complete replacement by self-driving cars will happen late or never.
4.8. Attitudes of Consumers towards Car Sharing
The participants were asked: “Which of the following reasons/statement will motivate you to share/lend your AV?” One answer option was, “I can never think of sharing my car.” Almost half of the respondents, 86 out of 192 people, agreed to the answer that they can never think of sharing their personal car. The related frequency table is shown below where 0 means that a subject rejected the statement, and 1 means that they agreed with the statement (Table 17).
4.9. Use Case Scenarios of an AV
In addition, the participants were asked the following question: “What are the potential use case scenarios of an AV for you?”. A total of 72 out of 192 people (37.50%) indicated that it is highly likely or likely using an AV for personal use only. Additionally, 70 people (36.46%) neither agreed nor disagreed with this statement, and 50 participants (26.04%) stated that it is very unlikely or not likely to use AVs for personal use only. Furthermore, 55 out of 192 people (28.65%) stated that it would be highly likely or likely using AVs for personal use and car-sharing; 66 people (34.38%) neither agreed nor disagreed with the statement, and 71 participants (36.98%) indicated the usage of AVs for personal use and car-sharing is very unlikely or not likely.
4.10. The Motivation of Consumers to Lend/Share Their AV
Finally, we analyzed how to motivate consumers to share/lend their AV. The participants were asked the following question: “Which of the following reasons/statement will motivate you to share/lend your AV?”. In Table 18 below, we will always find the two expressions 0 and 1, where 0 stands for no (rejection of the statement) and 1 for yes (agreement of the statement). The answer option “Car sharing is ecofriendly, and I care about CO2 emissions/environment” has the most agreement. In the table below, one can see that 86 out of 192 people (44.79%) agree to the statement. In contrast, 106 out of 192 people (55.21%) do not agree with this statement.
Table 19 shows that more than a quarter of the respondents indicated that they would be motivated to share/lend their AV if they make some extra money (rental for fees). In contrast, 141 out of 192 people (73.4%) did not agree.
Table 20 shows that only 39 out of 192 people (20.31%) of the respondents would share/lend their AV due to tax relief from the government. In contrast, 153 out of 192 people (79.69%) do not agree with this statement.
4.11. Hypotheses Assessment Summary
This section summarizes the results of all the hypotheses in Table 21. Hypotheses where the p-value is less than 5% are statistically significant (Accepted), and test values where the p-value is more than 5% are considered statistically insignificant (Rejected).
5. Conclusions and Limitations
Since autonomous vehicles are mainly addressed from a technical perspective, this pilot study aimed at addressing the consumer side predominantly. The most important points were to find out if Austrian consumers are ready to use AVs and which challenges will arise with the implementation of AVs. Additionally, consumers’ attitudes toward sharing models were analyzed.
The findings of the online survey are highly relevant. It was noted that concerns about the technological advancements in the automotive industry are extreme in all groups. Although concerns are very pronounced, they vary in different groups. In order to reduce consumer skepticism about the technology, target specific approaches must be adopted. Another interesting point was that despite the high number of traffic accidents, the subjective feeling of safety in conventional cars is very high among consumers. This distorted perception makes the introduction of autonomous cars more complicated. Also, it could be found that the desire to own a car is still highly pronounced. Car sharing is an option, but only for the minority of respondents.
In order to enable a successful implementation of self-driving cars, consumers need to be involved in the process of development. Only a comprehensive approach will make it possible to find a solution that is suitable for all parties involved. If a nationwide implementation of self-propelled cars is successful, it could be accompanied by many advantages like better utilization of vehicle capacity and a decrease in traffic accidents.
The literature analysis is limited by the fact that there are very few studies on autonomous vehicles where consumers have been involved/questioned. Readers should note that the second part of the paper is based on data collected by the authors themselves. Since the survey was conducted, online, older consumers were more challenging to reach. Which is also reflected in the age distribution which is not equally distributed. Moreover, the results of this pilot study set a tone for further studies with a more diverse and larger sample size; although the results of this study are significant, a broader data set could make it easier to generalize. Thus, with the limited data set, the authors have focused on answering the research questions in the best way possible.
Supplementary Materials
The following are available online at https://0-www-mdpi-com.brum.beds.ac.uk/2305-6290/3/4/20/s1, A copy of the questionnaire is added in the supplementary file.
Author Contributions
Conceptualization, M.A., S.W. and S.K.; data curation, S.W.; formal analysis, M.A. and S.W.; investigation, M.A. and S.W.; methodology, M.A. and S.W.; project administration, S.K. and M.A.; supervision, S.K. and M.A.; validation, M.A., S.W. and S.K.; visualization, M.A. and S.W.; writing—original draft, S.W.; writing—review and editing, M.A., S.W. and S.K.
Funding
This research received no external funding.
Conflicts of Interest
The authors declare no conflicts of interest.
References
- Hudda, R.; Kelly, C.; Long, G.; Luo, J.; Pandit, A.; Phillips, D.; Sidhu, I. Self Driving Cars; University of California, Collage of Engineering: Berkeley, CA, USA, 2013. [Google Scholar]
- KPMG. Self-Driving Cars: The Next Revolution; Technology Review, KPMG and Car Group: Amstelveen, The Netherlands, 2012; pp. 1–36. [Google Scholar]
- The European Commission. Towards Fair and Efficient Pricing in Transport; Directorate-General for Transport-Dg Vii; The European Commission: Brussels, Belgium, 1995. [Google Scholar]
- Azmat, M.; Schumayer, C.; Kummer, S. Innovation in Mobility: Austrian Expert’s Perspective on the Future of Urban Mobility with Self-Driving Cars. In Quality and Business Management Conference; Hbmsu Publishing House: Dubai, UAE, 2016. [Google Scholar]
- Abraham, H.; Lee, C.; Brady, S.; Fitzgerald, C.; Mehler, B.; Bryan, R.; Coughlin, J.F. Autonomous Vehicles, Trust and Driving Alternatives: A Survey of Consumer Preferences; Massachusetts Institute of Technology, Massachusetts Institute of Technology: Cambridge, MA, USA, 2016. [Google Scholar]
- Azmat, M. Impact of Autonomous Vehicles on Urban Mobility; Wu Wien, Schriftenreihe Des Instituts Für Transportwirtschaft und Logistik-Verkehr: Vienna, Austria, 2015. [Google Scholar]
- Schwarz, C.; Thomas, G.; Nelson, K.; Mccrary, M.; Schlarmann, N. Towards Autonomous Vehicles; Final Reports and Technical Briefs from Mid-America; Mid-America Transportation Center, University of Nebraska, Lincoln: Michigan, MI, USA, 2013. [Google Scholar]
- Anderson, J.M.; Kalra, N.; Stanley, K.D.; Sorensen, P.; Samaras, C.; Oluwatola, O.A. Autonomous Vehicle Technology; A Guide for Policymakers; Rand Corporation: Santa Monica, CA, USA, 2016. [Google Scholar]
- Geiger, A.; Lenz, P.; Urtasun, R. Are We Ready for Autonomous Driving? In Proceedings of the CVPR, Florence, Italy, 7–13 October 2012; pp. 3354–3361. [Google Scholar]
- Surden, H.; Wiliams, M.-A. Technological Opacity, Predictability, and Self-Driving Cars; University of Colorado Law School, Colorado Law Scholarly Commons, Colorado Law Faculty Scholarship: Boulder, CO, USA, 2016. [Google Scholar]
- The Guardian. Google’s Self-Driving Car: How Does It Work and When Can We Drive One? 29 May 2014. Available online: https://Www.Theguardian.Com/Technology/2014/May/28/Google-Self-Driving-Car-How-Does-It-Work (accessed on 29 May 2019).
- Choi, T.; Wallace, S.W.; Wang, Y. Big Data Analytics in Operations Management. Prod. Oper. Manag. 2017, 27, 1868–1883. [Google Scholar] [CrossRef]
- Schaal, H.-W.; Löffler, T. Car2x-from Research to Product Development (How Automotive OEMS and Suppliers Are Successfully Completing Production Car2x Projects); Vector Informatik GMBH: Stuttgart, Germany, 2012. [Google Scholar]
- Röglinger, S.; Facchi, C. How Can Car2x-Communication Improve Road Safety; University of Applied Sciences, Institute of Applied Research: Ingolstadt, Germany, 2009. [Google Scholar]
- Morgan, S. Self-Driving the New Auto Industry Paradigm; Morgan, Stanley: New York, NY, USA, 2013. [Google Scholar]
- Lu, N.; Cheng, N.; Zhang, N.; Shen, X.; Mark, J.W. Connected Vehicles: Solutions and Challenges. IEEE Internet Things J. 2014, 1, 289–299. [Google Scholar] [CrossRef]
- Knapik, P.; Schoch, E.; Kargl, F. Electronic Decal: A Security Function Based on V2x Communication. In Proceedings of the 2013 IEEE 77th Vehicular Technology Conference (Vtc Spring), Dresden, Germany, 2–5 June 2013. [Google Scholar]
- Muhammad, M.; Safdar, G.A. Survey on Existing Authentication Issues for Cellular-Assisted V2x Communication. Veh. Commun. 2018, 12, 50–65. [Google Scholar] [CrossRef]
- Noori, H.; Valkama, M. Impact of Vanet-Based V2x Communication Using IEEE 802.11p on Reducing Vehicles Traveling Time in Realistic Large Scale Urban Area. In Proceedings of the 2013 International Conference on Connected Vehicles and Expo (Iccve), Las Vegas, NV, USA, 2–6 December 2013. [Google Scholar]
- Dixit, M.; Kumar, R.; Sagar, A.K. Vanet: Architectures, Research Issues, Routing Protocols, and Its Applications. In Proceedings of the 2016 International Conference on Computing, Communication and Automation (ICCCA), Noida, India, 29–30 April 2016. [Google Scholar]
- Horrell, P. Autopilot for Cars-Are We Nearly There Yet? 7 March 2014. Available online: https://360.Here.Com/2014/03/07/Autopilot-For-Cars-Are-We-Nearly-There-Yet/ (accessed on 12 May 2017).
- Maurer, M.; Gerdes, J.C.; Lenz, B.; Winner, H. Autonomes Fahren: Technische, Rechtliche Und Gesellschaftliche Aspekte; Springer: Berlin, Germany, 2015. [Google Scholar]
- Litman, T. Autonomous Vehicle Implementation Predictions; Victoria Transport Policy Institue: Victoria, BC, Canada, 2017. [Google Scholar]
- Harding, J.; Powell, G.R.; Fikentscher, J.; Doyle, C.; Sade, D.; Lukuc, M.; Wang, J. Vehicle-To-Vehicle Communications: Readiness of V2v Technology for Application; Report No. Dot Hs 812 014; National Highway Traffic Safety Administration: Washington, DC, USA, 2014.
- Trien, L.T.; Adachi, K.; Yamao, Y. Packet Relay-Assisted V2v Communication with Sectorised Relay Station Employing Payload Combining Scheme. IET Commun. 2018, 12, 458–465. [Google Scholar] [CrossRef]
- Huang, C.-L.; Sengupta, R.; Krishnan, H.; Fallah, Y.P. Implementation and Evaluation of Scalable Vehicle-to-Vehicle Safety Communication Control. IEEE Commun. Mag. 2011, 49, 134–141. [Google Scholar] [CrossRef]
- Wang, C.; He, M. Image Style TransferWith Multi-Target Loss for Lot Applications. In Proceedings of the 2018 15th International Symposium on Pervasive Systems, Algorithms and Networks (I-Span), Yichang, China, 16–18 October 2018. [Google Scholar]
- Abdennour, Z.; Weijia, J. Heterogeneous Vehicular Communications: A Comprehensive Study. Ad Hoc Netw. 2018, 75, 52–79. [Google Scholar]
- Azmat, M.; Kummer, S.; Moura, L.T.; Gennaro, F.D.; Moser, R. Future Outlook of Highway Operations with Implementation of Innovative Technologies like AV, CV, IoT and Big Data. Logistics 2019, 3, 15. [Google Scholar] [CrossRef]
- Bansal, P.; Kockelman, K.M.; Singh, A. Assessing Public Opinions of and Interest in New Vehicle Technologies: An Austin Perspective. Transp. Res. Part C Emerg. Technol. 2016, 67, 1–14. [Google Scholar] [CrossRef]
- Hohenberger, C.; Spörrle, M.; Welpe, I.M. How and Why Do Men and Women Differ in Their Willingness to Use Automated Cars? The Influence of Emotions across Different Age Groups. Transp. Res. Part A Policy Pract. 2016, 94, 374–385. [Google Scholar] [CrossRef]
- Haboucha, C.J.; Ishaq, R.; Shiftan, Y. User Preferences Regarding Autonomous Vehicles. Transp. Res. Part C Emerg. Technol. 2017, 78, 37–49. [Google Scholar] [CrossRef]
- Bierstedt, J.; Gooze, A.; Gray, C.; Peterman, J.; Raykin, L.; Walters, J. Effects of Next Generation Vehicles on Travel Demand and Highway Capacity; Fehr and Peers: Washington, DC, USA, 2014. [Google Scholar]
- Gkartzonikas, C.; Gkritza, K. What Have We Learned? A Review of Stated Preference and Choicestudies on Autonomous Vehicles. Transp. Res. Part C 2019, 98, 323–337. [Google Scholar] [CrossRef]
- Kyriakidis, M.; Happee, R.; Winter, J.D. Public Opinion on Automated Driving: Results of an International Questionnaire among 5000 Respondents. Transp. Res. Part F Traffic Psychol. Behav. 2015, 32, 127–140. [Google Scholar] [CrossRef]
- Milakis, D.; Snelder, M.; van Arem, B.; vanWee, B.; de Almeida Correia, G.H. Development and Transport Implications of Automated Vehicles in the Netherlands: Scenarios for 2030 and 2050. Eur. J. Transp. Infrastruct. Res. 2017, 17, 63–85. [Google Scholar]
- Fagnant, A.J.; Kockelman, K. Preparing a Nation for Autonomous Vehicles (Opportunities, Barriers and Policy Recommendations); Eno-Center for Transportation: Washington, DC, USA, 2013. [Google Scholar]
- Reimer, B. Driver Assistance System and the Transition to Automated Vehicles: A Path to Increase Older Adult Safety and Mobility. Public Policy Aging Rep. 2014, 24, 27–31. [Google Scholar] [CrossRef]
- Meyer, J. Personal Vehicle Transportation. In Technology for Adaptive Aging; National Academies Press: Washington, DC, USA, 2004. [Google Scholar]
- Schaefer, A.; Heywood, J.B.; Jacoby, H.D.; Watiz, I.A. Transportation in A Climate-Constrained World; MIT Press: London, UK, 2009. [Google Scholar]
- Fagnant, D.; Kockelman, K.M. The Travel and Environmental Implications of Shared Autonomous Vehicles; Using Agent-Based Model Scenarios. Transp. Res. Part C Emerg. Technol. 2014, 40, 1–13. [Google Scholar] [CrossRef]
- Howard, D.; Dai, D. Public Perceptions of Self-Driving Cars: The Case of Berkeley, California. In Proceedings of the Transportation Research Board 93rd Annual Meeting, Washington, DC, USA, 12–16 January 2014; Volume 14, pp. 1–16. [Google Scholar]
- Milakis, D.; Arem, B.V.; Wee, B.V. Policy and Society Related Implications of Automated Driving: A Review of Literature and Directions for Future Research. J. Intell. Transp. Syst. 2017, 21, 324–348. [Google Scholar] [CrossRef]
- West, D.M. Moving Forward: Self-Driving Vehicles in China, Europe, Japan, Korea, and the United States; Center for Technology Innovation at Brookings: Washington, DC, USA, 2016. [Google Scholar]
- Statista. Anzahl Der Verkauften Personenkraftwagen (Pkw) in Österreich von 2007 Bis 2017. 2018. Available online: https://de.statista.com/statistik/daten/studie/814661/umfrage/pkw-absatz-in-oesterreich/ (accessed on 28 May 2019).
- Bonnefon, J.F.; Shariff, A.; Rahwan, I. The social dilemma of autonomous vehicles. Science 2016, 352, 1573–1576. [Google Scholar] [CrossRef] [Green Version]
- Bartl, M. The Future of Autonomous Driving-Introducing the Foresight Matrix to Support Strategic Planning. Mak. Innov. (E-Journal) 2015, 1–7. Available online: http://www.michaelbartl.com/article/the-future-of-autonomous-driving-%E2%80%93-introducing-the-foresight-matrix-to-support-strategic-planning/ (accessed on 12 September 2019).
- Mahmassani, H.S. Autonomous Vehicles and Connected Vehicle Systems: Flow and Operations Considerations. Transp. Sci. 2016, 50, 1140–1162. [Google Scholar] [CrossRef]
- Rivera, L.; Sheffi, Y.; Welsch, R. Logistics agglomeration in the US. Transp. Res. Part A Policy Pract. 2014, 59, 222–238. [Google Scholar] [CrossRef]
- Peever, B. Autonomous Cars (The Next Netflix?); Municipal World: St. Thomas, ON, Canada, 2017; pp. 3–5. [Google Scholar]
- Song, H.; Wang, L. The status and development of logistics cost management: evidence from Mainland China. Benchmarking Int. J. 2009, 16, 657–670. [Google Scholar] [CrossRef]
- Deb, S.; Strawderman, L.; Carruth, D.W.; DuBien, J.; Smith, B.; Garrison, T.M. Development and validation of a questionnaire to assess pedestrian receptivity toward fully autonomous vehicles. Transp. Res. Part C Emerg. Technol. 2017, 84, 178–195. [Google Scholar] [CrossRef]
Figure 1.
Timeline for complete autonomy [21] (rendition by authors).
Figure 1.
Timeline for complete autonomy [21] (rendition by authors).

Figure 2.
The number of passenger cars sold in Austria from 2007 to 2017 [45] (rendition by authors).
Figure 2.
The number of passenger cars sold in Austria from 2007 to 2017 [45] (rendition by authors).

Figure 3.
Cost reduction by shared cars [1].
Figure 3.
Cost reduction by shared cars [1].

Figure 4.
Scatterplot from the variables ‘safety conventional’ and concerns index.

Figure 5.
Scatterplot from the variables ‘safety AV’ and concerns index.


Table 1.
Components of autonomous vehicles (AVs).
| Components | References | |
|---|---|---|
| Hardware | In terms of the hardware, self-driving cars use multiple sensors which aim to gather information about the vehicle itself and the nearby environment and send it to the car’s on-board computer. The speed, movement, and position of such items can be determined by sending out radio (continuous) waves which are naturally reflected off adjacent solid surfaces. It constitutes an indication that an object is there if a radio wave is sent out and reflected. Moreover, AVs are typically built on various other types of sensors, including inertial navigation systems, light detection and ranging (LIDAR), sound navigation ranging (SONAR), and video cameras. The multi-sensor data fusion enables safe autonomous driving. | [6,8,10] |
| Navigation | AVs also count on digital maps for autonomous driving. Such maps contain geographical information as associated coordinates for any point on the road and overhead layouts of roads. Furthermore, the maps are often manually provided with additional information such as a traffic signals, signs, and traffic lights. Due to double-checking the preloaded-information with live sensor information (e.g., the usage of a video camera can ensure if there is a traffic signal for sure), the car can make more accurate driving decisions. | [10,11] |
| Software | Software (coordinating computer system/artificial intelligence) is another crucial component of AV technology. The system is capable of organizing and planning all of the car’s activities. The system connects data from sensors and the map and uses sophisticated computer algorithms. For instance, Google’s self-driving car use the software called “Google-Chauffer.” The objective of the software is to take the passenger to its target location safely. In doing so, the software observes the rules of the road and additionally can recognize cars, objects, signs, and many random dangers such as cyclists and pedestrians, by interpreting all the communication between hardware and the ambiance. | [6,8,10,11,12] |
Table 2.
Levels of automation.
| Level | Description | References |
|---|---|---|
| 0 and 1 | At level 0 the driver is in full control all the time. Whereas, at level 1, some functional automation like anti-lock or skid control braking systems are in place. However, the driver always remains in command, with his/her foot on the pedal and hands on the wheel. | [21,23] |
| 2 | At this level, the driver is, in general, liable for monitoring the roadway and should always be available for control. This level is referred to as “combined function automation” by the National Highway Traffic Safety Administration (NHTSA). In general, a car at this level will change speed and keep itself in-lane on highways with the help of lane-sensing cameras, radar, and cruise control. | [21,23] |
| 3 | This level is referred to as “limited self-driving automation.” On this level, the drivers can give command of all safety-critical functions to the car’s on-board computer. However, an active attendance to take control is required. At this level, cars can take advantage of advance/adaptive cruise controls, surround cameras, sensors, radars, and other such technological gadgets to drive themselves to a certain distance. However, the active presence of the driver is always required. This technology is the least required to make possible the V2V communication, and it can drastically enhance an active platooning league for different cars. | [21,23,24,25,26,27,28] |
| 4 | Level four, which is known as “full self-driving automation” allows the driver to completely rely on the vehicle’s on-board computer and all its hardware and software technology in order to drive from one place to other. At this level, no active response from the driver/rider is needed. The car makes all critical decisions on its own. One piece of technology which plays the most important part in making a car self-driving is a combination of LIDAR and radio detection and ranging (RADAR). Both of which are used to sense different hurdles and objects en-route to the destination. However, significant technical improvements are necessary, and more years of development and testing are required before potential users (consumers) and regulators gain confidence in AVs. | [21,23,24] |
Table 3.
Benefits of AVs.
| Benefits | Description | References |
|---|---|---|
| Congestion reduction | The concept of connected vehicles would cause some positive effects on congestion. Advantages of this technology are shorter gaps between vehicles, a higher and constant speed at traveling, which leads to a reduction in traffic-destabilizing shockwave propagation, and fuel savings. However, some other researches claim that due to the reliefs mentioned above, the overall vehicle miles traveled (VMT) will rise. | [7,8] |
| Impacts on travel behavior | For older people, AVs would be a significant relief. Since fatal crash involvement (by VMT) climbs by age beginning in the mid-60s, many humans begin to restrict or stop driving. Yet not using cars can lead to considerable costs. For instance, if older adults do not use cars anymore, their personal freedom could be restricted. Innovations in personal mobility that ease the burden of age will be more critical over the coming decades. Additionally, with AVs, it would be possible to optimize fuel savings with a smart-parking decision. This system avoids “cruising for parking.” It is an in-vehicle system which shares data with parking infrastructure to get information for driverless drop-offs and pickups. | [37,38,39] |
| Land use and ownership of vehicles | Owners of AVs could have a longer distance to travel to and from work because they can use their time for alternative activities. The better use of travel time leads to an increase in the total number of commuters. So, the introduction of self-driving cars could lead to more dispersed and low-density models of land use surrounding metropolitan regions. A consideration which may reduce the rate of car ownership is the program of AV sharing (more information can be found in Section 2.7). This concept would reduce the number of parking areas necessary and would allow for more significant development of cities. Over time, the whole concept of vehicle ownership would be shifted. In the long term, the number of vehicles in the national fleet should be reduced. | [7,8] |
| Safety | Considering the benefits mentioned above of AVs, safety is an advantage which is directly concerned with consumers. That is why we have selected this benefit/advantage to be tested. Below we explain why AVs would prevent most automobile accidents. | [1,8] |
Table 4.
Challenges of AVs.
| Challenges | Description | References |
|---|---|---|
| Trusting the technology | Fully autonomous vehicles have the potential to improve mobility. However, the trust to adopt these technologies is still missing from many consumers and may need to build-up over time. There may be some hesitation with full automation among older people who would benefit the most. Moreover, there are age differences in preferred methods for learning to use in-vehicle technologies. Younger participants were more likely to prefer the trial and error method or have a family or friend member explain the technology. Whereas younger and middle-aged adults favored the option of having the vehicle teach them how the technology is used, older adults were less interested in this idea. Using the manual or having the dealership explain the system is preferred by elderly people. | [5] |
| Legal and insurance cost issues | As mentioned above, the trust of technology is an essential issue with the public. However, many other challenges still need to be addressed, including legal issues and the cost of technology. As explained above, with the introduction of AVs, connectivity of vehicles will rise. Therefore, massive investments in infrastructure will have to be provided. The cost of the technology could also be a barrier because network benefits can only be achieved when enough vehicles are on the road. With the introduction of AVs, legal issues will arise. Questions like “Are AVs legal?” and “Who is liable for damages in case of accidents?” come up. At the moment, the future for laws and regulations is currently somewhat uncertain, and legal factors are often mentioned as critical factors and obstacles for self-driving cars. However, progress towards AVs is approaching though improved ADAS. Given the advantages of AVs, the government can encourage the introduction of AVs. As with electric vehicles, the government may offer, for example, tax incentives to manufacturers and buyers. The next legal challenge for AVs operations is the transmission of liability in case of an accident. As the driver of autonomous vehicles will have little or no control over the vehicle, liability will likely be transferred to the manufacturers. In order to not discourage manufacturers from producing self-driving cars, there are demands for the registration of vehicle crash data via EDR (electronic data recorders). This data can be used, for example, to determine who had the power to control the vehicle at the time of the accident. | [1,7,42,43,44] |
| The higher number of sold passenger cars | Since there are statistics that the number of passenger cars sold is increasing, we have selected this challenge to be tested. More details can be found below. | [45] |
| Moral issues | AVs sometimes must decide between two evils. For example, sacrifice itself and its passengers or running over pedestrians. One of the difficulties will be the definition of algorithms to assist autonomous vehicles in making moral decisions. In any case, these three potentially incompatible objectives must be achieved: not to discourage buyers, not to arouse public outrage, and to be consistent. Nevertheless, the achievement of these goals can lead to moral inconsistencies. Even if moral contradictions are very rare, algorithms must agree with human values. In order to find out which algorithms citizens would accept, a collective discussion on the ethics of AVs must be started. | [46] |
Table 5.
Grouping of survey questions to assess the hypotheses.
| Research Questions | Related Hypothesis | Section of the Survey |
|---|---|---|
| RQ1: Are Austrians ready to adopt AVs as their daily driver? | H1, H3 | Section B: Current usage of cars and willingness to drive an AV |
| RQ2: How long will it take for AVs to be on the roads in Austria? | H4 | Section E: Timeline |
| RQ3: Are consumers ready to trust autonomous vehicle technology? | H2, H4 | Section C: Challenges of AVs |
| RQ4: What is the consumers’ perspective on using AVs for car-sharing/pooling? | H5 | Section D: Ownership/sharing of AVs |
Table 6.
Descriptive statistics about the variables concerns.
| N | Minimum | Maximum | Mean | Std. Deviation | Variance | |
|---|---|---|---|---|---|---|
| Safety concerns | 192 | 1 | 5 | 3.84 | 1.028 | 1.058 |
| Transition concerns | 192 | 1 | 5 | 3.77 | 1.079 | 1.165 |
| Legal concerns | 192 | 1 | 5 | 4.08 | 0.978 | 0.956 |
| Cost concerns | 192 | 1 | 5 | 3.68 | 1.068 | 1.141 |
| Cyber concerns | 192 | 1 | 5 | 3.82 | 1.009 | 1.019 |
| Valid n (listwise) | 192 |
Table 7.
Reliability analysis and reliability statistics.
| Cronbach’s Alpha | Cronbach’s Alpha Based on Standardized Items | Number of Items |
|---|---|---|
| 0.703 | 0.704 | 5 |
Table 8.
Inter-item correlation matrix; concerns.
| Safety Concerns | Transition Concerns | Legal Concerns | Cost Concerns | Cyber Concerns | |
|---|---|---|---|---|---|
| Safety concerns | 1.000 | 0.371 | 0.331 | 0.367 | 0.365 |
| Transition concerns | 0.371 | 1.000 | 0.336 | 0.220 | 0.388 |
| Legal concerns | 0.331 | 0.336 | 1.000 | 0.266 | 0.334 |
| Cost concerns | 0.367 | 0.220 | 0.266 | 1.000 | 0.246 |
| Cyber concerns | 0.365 | 0.388 | 0.334 | 0.246 | 1.000 |
Table 9.
Ranks concerns index and gender.
| Gender | N | Mean Rank | Sum of Ranks | |
|---|---|---|---|---|
| Concerns index | 0 | 77 | 82.52 | 6354.00 |
| 1 | 115 | 105.86 | 12,174.00 | |
| Total | 192 |
Table 10.
Mann–Whitney U test statistics concerns index and gender.
| Concerns Index | |
|---|---|
| Mann–Whitney U | 3351.000 |
| Wilcoxon W | 6354.000 |
| Z | −2.867 |
| Asymp. Sig. (2-tailed) | 0.004 |
Table 11.
Descriptive statistics about the feeling of safety in a conventional car/AV.
| N | Minimum | Maximum | Mean | Std. Deviation | Variance | |
|---|---|---|---|---|---|---|
| Feeling of safety in a conventional car | 192 | 1 | 5 | 3.81 | 0.848 | 0.719 |
| Feeling of safety in an AV | 192 | 1 | 5 | 2.64 | 1.083 | 1.174 |
| Valid n (listwise) | 192 |
Table 12.
Correlations between concerns index and feeling of safety in a conventional car.
| Concerns Index | The Feeling of Safety in a Conventional Car | |||
|---|---|---|---|---|
| Spearman’s rho | Concerns index | Correlation Coefficient | 1.000 | 0.038 |
| Sig. (2-tailed) | . | 0.605 | ||
| n | 192 | 192 | ||
| The feeling of safety in a conventional car | Correlation Coefficient | 0.038 | 1.000 | |
| Sig. (2-tailed) | 0.605 | . | ||
| n | 192 | 192 | ||
Table 13.
Correlations concerns index and feeling of safety in an AV.
| Concerns_Index | The Feeling of Safety in an AV | |||
|---|---|---|---|---|
| Spearman’s rho | concerns_index | Correlation Coefficient | 1.000 | −0.580 |
| Sig. (2-tailed) | . | 0.000 | ||
| n | 192 | 192 | ||
| The feeling of safety in an AV | Correlation Coefficient | −0.580 | 1.000 | |
| Sig. (2-tailed) | 0.000 | . | ||
| n | 192 | 192 | ||
Table 14.
Ranks concerns index and city.
| City | N | Mean Rank | Sum of Ranks | |
|---|---|---|---|---|
| Concerns index | 0 | 123 | 99.64 | 12,256.00 |
| 1 | 69 | 90.90 | 6,272.00 | |
| Total | 192 |
Table 15.
Mann–Whitney U Test Statistics concerns index and city.
| Concerns Index | |
|---|---|
| Mann–Whitney U | 3,857,000 |
| Wilcoxon W | 6,272,000 |
| Z | −1.051 |
| Asymp. Sig. (2-tailed) | 0.293 |
Table 16.
Correlations concerns index and conventional cars are completely replaced by AVs.
| Concerns Index | Conventional Cars Replaced by Self-Driving Ones | |||
|---|---|---|---|---|
| Spearman’s rho | Concerns index | Correlation Coefficient | 1.000 | 0.289 |
| Sig. (2-tailed) | . | 0.000 | ||
| n | 192 | 192 | ||
| Conventional cars are replaced by self-driving ones | Correlation Coefficient | 0.289 | 1.000 | |
| Sig. (2-tailed) | 0.000 | . | ||
| n | 192 | 192 | ||
Table 17.
Frequency table: I can never think of sharing my car.
| Frequency | Percent | Valid Percent | Cumulative Percent | ||
|---|---|---|---|---|---|
| Valid | 0 | 106 | 55.2 | 55.2 | 55.2 |
| 1 | 86 | 44.8 | 44.8 | 100.0 | |
| Total | 192 | 100.0 | 100.0 | ||
Table 18.
Frequency table: car sharing is ecofriendly.
| Frequency | Percent | Valid Percent | Cumulative Percent | ||
|---|---|---|---|---|---|
| Valid | 0 | 106 | 55.2 | 55.2 | 55.2 |
| 1 | 86 | 44.8 | 44.8 | 100.0 | |
| Total | 192 | 100.0 | 100.0 | ||
Table 19.
Frequency table: rental for fees.
| Frequency | Percent | Valid Percent | Cumulative Percent | ||
|---|---|---|---|---|---|
| Valid | 0 | 141 | 73.4 | 73.4 | 73.4 |
| 1 | 51 | 26.6 | 26.6 | 100.0 | |
| Total | 192 | 100.0 | 100.0 | ||
Table 20.
Frequency table sharing of cars will get me tax relief from the government.
| Frequency | Percent | Valid Percent | Cumulative Percent | ||
|---|---|---|---|---|---|
| Valid | 0 | 153 | 79.7 | 79.7 | 79.7 |
| 1 | 39 | 20.3 | 20.3 | 100.0 | |
| Total | 192 | 100.0 | 100.0 | ||
Table 21.
Hypotheses assessment summary table.
| No. | Hypotheses | Status |
|---|---|---|
| H1 | Women in comparison to men will show a higher level of concerns to use self-driving cars. | Accepted |
| H2 | The higher level of automation in cars—the safer you feel in them. | Accepted |
| H3 | People who live in cities in comparison with people who live in the countryside are well aware of AV technology. | Rejected |
| H4 | The higher concerns about AV technology—the lesser is consumers’ confidence and willingness to use the technology. | Accepted |
| H5 | The higher level of automation in cars—the higher is the willingness to use the AV for car sharing. | Rejected |
© 2019 by the authors. Licensee MDPI, Basel, Switzerland. This article is an open access article distributed under the terms and conditions of the Creative Commons Attribution (CC BY) license (http://creativecommons.org/licenses/by/4.0/).
Share and Cite
MDPI and ACS Style
Wintersberger, S.; Azmat, M.; Kummer, S. Are We Ready to Ride Autonomous Vehicles? A Pilot Study on Austrian Consumers’ Perspective. Logistics 2019, 3, 20. https://0-doi-org.brum.beds.ac.uk/10.3390/logistics3040020
AMA Style
Wintersberger S, Azmat M, Kummer S. Are We Ready to Ride Autonomous Vehicles? A Pilot Study on Austrian Consumers’ Perspective. Logistics. 2019; 3(4):20. https://0-doi-org.brum.beds.ac.uk/10.3390/logistics3040020
Chicago/Turabian StyleWintersberger, Sophie, Muhammad Azmat, and Sebastian Kummer. 2019. "Are We Ready to Ride Autonomous Vehicles? A Pilot Study on Austrian Consumers’ Perspective" Logistics 3, no. 4: 20. https://0-doi-org.brum.beds.ac.uk/10.3390/logistics3040020