A Simulation-Based Planning Tool for Floating Storage and Regasification Units


Laboratory for Maritime Transport, School of Naval Architecture and Marine Engineering, National Technical University of Athens, 15780 Athens, Greece
*
Author to whom correspondence should be addressed.
Logistics 2020, 4(4), 31; https://0-doi-org.brum.beds.ac.uk/10.3390/logistics4040031
Submission received: 10 October 2020
/
Revised: 23 October 2020
/
Accepted: 26 October 2020
/
Published: 30 November 2020
Abstract
:The objective of this paper was to propose a functional simulation model for the operation of floating storage and regasification units (FSRUs) used for the import of liquefied natural gas (LNG). The physical operation of an FSRU is decomposed for each critical component of the LNG carrier (LNGC) and the FSRU, in order to construct a realistic model in Simulink. LNG mass balance equations are used to perform flow calculations from the tanks of an LNG carrier to the tanks of the FSRU and from there to shore. The simulation model produces results for cases, when multiple LNG carriers discharge cargoes during a monthly time horizon. This produces an accurate operational profile for the FSRU with information about the volume of LNG inside each of the cargo tanks of the FSRU, LNG cargo discharging and gas send-out rate. Potential practitioners may exploit the proposed planning tool to explore the feasibility of alternative operation scenarios for an FSRU terminal. The simulations can check the system sensitivity to different parameters and support schedule regarding: (i) slots for LNG carrier calls, (ii) LNG inventory fluctuation, and (iii) impact of gas demand and send-out rate changes.
1. Introduction
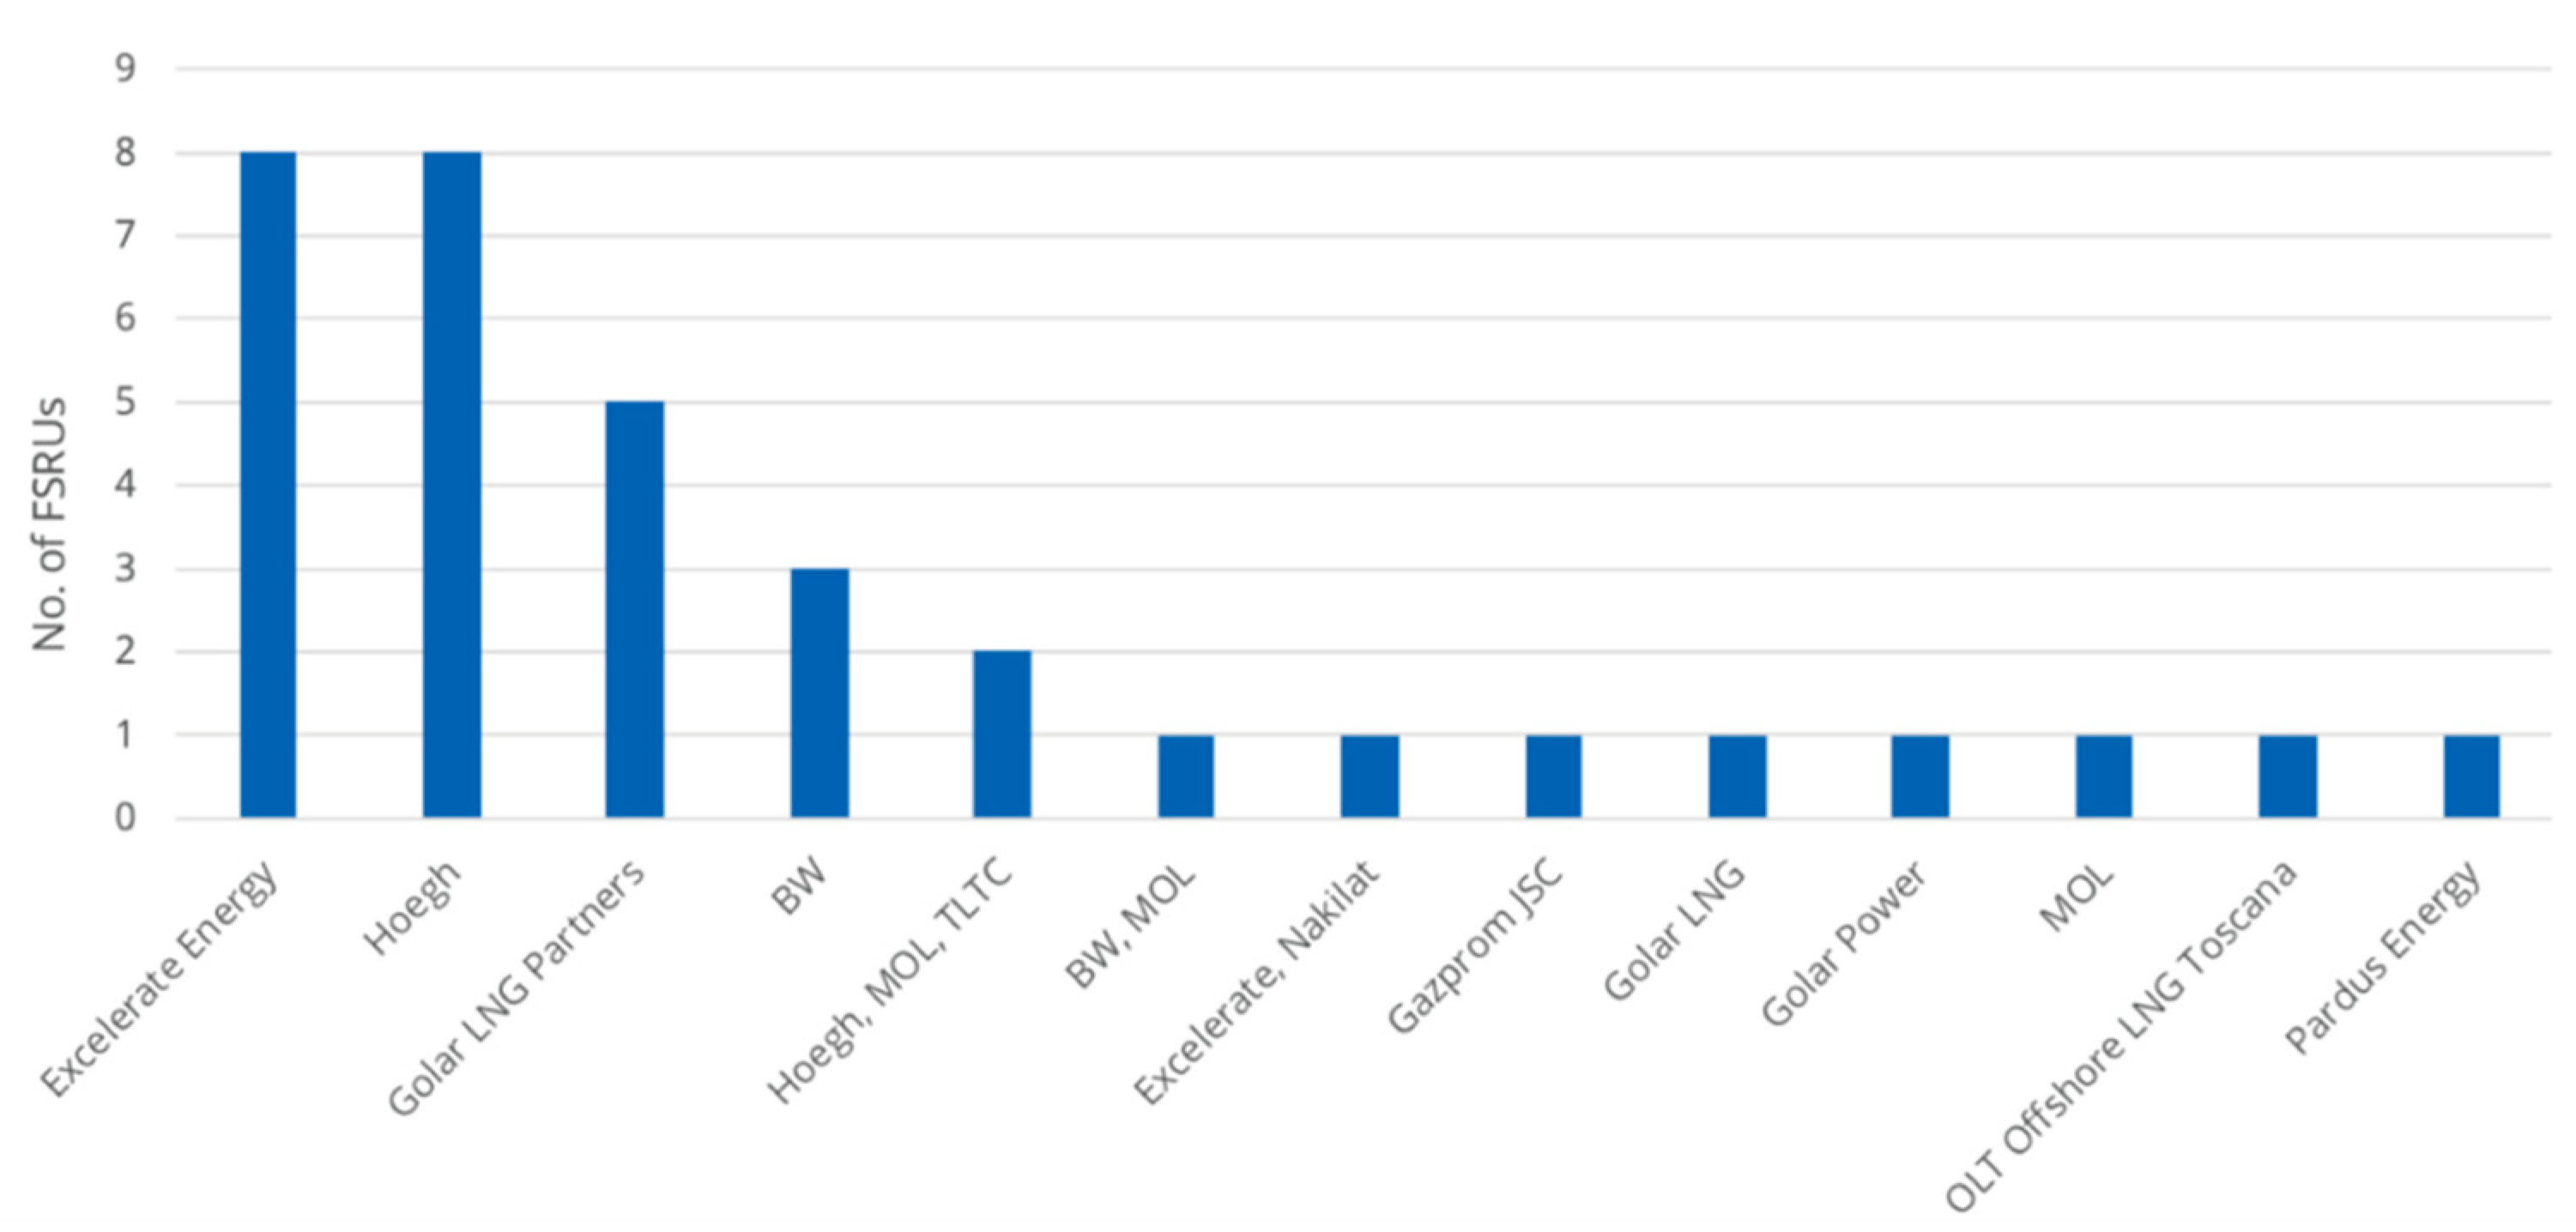
A floating storage regasification unit (FSRU) is a special type of ship, which is used for the storage and regasification of liquefied natural gas (LNG). Over the past two decades, they have been utilized to enable the import of LNG to remote markets lacking access to pipeline gas. An FSRU is a vital component of the LNG supply chain, required to convert natural gas back into its gaseous form and feed it into the gas network. FSRUs provide operators with much needed flexibility to address increasing gas demand, while allocating significantly fewer capital expenses than an onshore LNG import terminal. Currently, there are 34 FSRUs around the globe owned by specialized companies as shown in Figure 1, while 12 more are under construction as of February 2020 [1]. Apart from the number of niche FSRU owners, operators have also grown in number, as the technology is now well proven and in many cases it is more advantageous financially to build, own and operate the unit [2].
The increasing number as well as the higher utilization rate of operational FSRUs create planning challenges for the terminal operators. As more and more LNG vessels become active in the market and perform ship-to-ship (STS) cargo transfers to meet the growing LNG demand, precise scheduling for the slots of an FSRU terminal is required. However, the number of vessels and availability of unloading slots is only one aspect. The vaporization of LNG from the FSRU and subsequent transfer to the gas network is the other, which is conducted constantly and sometimes simultaneously with the unloading of the cargo from an LNG vessel. The send-out of gas from the FSRU to the network might be affected by the fluctuation of the end user demand (power plants, industries, residential distribution networks, transport sector) throughout the year. Causes behind this phenomenon may include seasonality patterns, general economic and market conditions, lower LNG price lower compared to other fuels or extraordinary events. As a result, the FSRU operator must be capable of adapting the schedule of the terminal to guarantee its constant operation and accommodate the discharging of all scheduled LNG vessels. This can be achieved proactively for different operation scenarios, if the simulation of the FSRU terminal is practicable.
The aim of the present research is to propose a simulation-based tool, which enables the FSRU operator to meet the aforementioned requirement. The simulation model incorporates the critical components of the FSRU and its interface with the LNG vessels in a realistic manner. It is constructed to generate volatile scenario cases, providing users with a reliable tool to validate their operations and check the system’s sensitivity to different parameters.
Previous research related to operational issues of FSRUs is rather limited and has dealt with the subject from different scopes. Artana [3] examined the strategic issue of optimum location selection for an FSRU based on quantitative (distance, current speed, water depth, tide, wave height, and wind speed) and qualitative criteria (noise, emissions, waste water, nearby housing/industry/explosive locations and sea traffic). To the authors’ knowledge, many research publications (indicatively [4,5,6,7]) related to FSRUs focus on technical aspects such as the simulation of chemical and thermodynamic processes related to the cargo tanks and the vaporizer unit.
To the best knowledge of the authors, only the work of Briano et al. [8] studied the subject of logistical planning for an FSRU terminal. The authors developed a simulation model to verify the feasibility of LNG supply via an FSRU to a power plant, under realistic operating conditions and with particular technical specifications for the vessels unloading the LNG. The developed model had the capacity to simulate three LNG vessel unloading scenarios (a dedicated LNG vessel, two dedicated vessels, and an emergency spot ship). Regardless of the scenario, the ships imported LNG from two designated terminals and operated with a given constant load/discharge rate. However, the discharging of cargo depended on two conditions affected by the environment, light of day and marine weather. To address the limited operational window during adverse conditions, a safety stock level was set. The constant send-out rate of the FSRU changed for two scenarios based on the workload of the power plant receiving gas from the terminal, albeit with no seasonality patterns. The demand-driven deterministic model used power plant operating conditions as inputs to simulate scenarios and identify the ones that minimize the cost and secure LNG availability. The simulation platform was implemented in the software Powersim Studio 8TM Expert.
The work of Briano et al. [8] and the current research share similarities on the subject of simulation, which is the LNG unloading from the vessel to the FSRU and the loading of the FSRU tank. However, the proposed tool extends the modeling to represent the vaporization of LNG and send-out gas to the network, which affects the inventory level of each cargo tank in the FSRU. In addition, a monthly time horizon is deemed more appropriate than the 4 days used by Briano et al., due to the fact it allows the simulation of multiple LNG vessel berths and gives a more comprehensive representation of the FSRU operation profile. Another reason is that service slots for an FSRU are usually booked by the operator for a monthly period, to optimize the overall schedule for the terminal users.
The simulation model proposed by the authors combines technical aspects to perform a realistic simulation of the STS transfer and FSRU send-out operations. LNG mass balance equations are used to perform flow calculations from the tanks of an LNG carrier to the tanks of the FSRU and from there to shore. The model is implemented using the Simulink software and produces an accurate operation profile for an FSRU, with information regarding the volume of LNG inside each of the cargo tanks of the FSRU, LNG cargo discharging and gas send-out rate. Potential practitioners may exploit the proposed planning tool to explore the feasibility of alternative operation scenarios and check how different parameters might affect: (i) slots for LNG Carrier (LNGC) calls, (ii) LNG inventory fluctuation, and (iii) the impact of gas demand and send-out rate changes.
Initially, the paper analyses the technical information linked with FSRU operation in order to clarify the system FSRU as an LNG intermediate storage and host system. The LNG STS procedures from an LNG carrier to the FSRU are described. These procedures are illustrated by a diagram (flowsheet) highlighting key elements that play an important role during LNG STS transfer. The last part of the methodology focuses on how the model works and how each technical parameter (pumps, valves, etc.) is simulated in Simulink.
Upon the completion of the model methodology, a structured case study was used to validate the proposed model. The case study consists of three scenarios. Each scenario is related to a different gas demand profile and a different set of transshipment technical parameters. The main target is to present the capability of the model to simulate the LNG in each of the FSRU cargo tanks in a period of one (1) month. The results are plotted in LNG-time charts. Following the results of the case study, discussion is made to understand the FSRU operations and draw preliminary conclusions on how the system can be optimized.
The remainder of the paper is organized as follows. In Section 2, the methodology used in the research is delineated. Section 3 outlines the assumptions and parameters used in the case study and presents the results of the simulation. Finally, Section 4 elaborates on the results and the conclusion of the research.
2. Methodology
2.1. Technical Description of the FSRU Operation
Technical fundamentals for FSRUs have been presented in various studies. Indicatively, the evolution of technology can be traced through the work of Leet et al. [9] and Songhurst [2,10]. In the referenced studies, the reader can find an extensive review of the technical solutions adopted by FSRU projects depending on the project site, specific commercial requirements, etc.
Further technical analysis of the FSRU operation in the form of standard procedures is described in specific documents. The documents issued by the shipyard, submitted to the FSRU owner and approved by a classification organization are three (3), namely the “cargo operation manual”, “operating manual for regasification” and “machinery operating manual”. Certainly, the terminal operation must be consistent with existing international and national rules and regulations, implemented by the flag state/port state of the terminal. Industry recommendations from organizations such as Oil Companies International Marine Forum (OCIMF), Society of International Gas Tanker and Terminal Operators (SIGTTO) and International Group of Liquefied Natural Gas Importers (GIIGNL) were also taken into consideration.
Before the loading of the FSRU initiates, certain preparatory procedures must be followed thoroughly, including works as well as the proper exchange of information and security measures. These steps are required to ensure that the tanks of the FSRU are clear of water and vapors, before the cooling of the piping system. During this step, the FSRU starts pumping LNG from the vessel at a slow rate for approximately 15 min, in order to avoid high stress on the pipes, minimize the likelihood of leaks through the joints or other parts of the piping system and prevent the formation of BOG (boil-off gas) as the LNG flows through.
Following the completion of the preparatory works, the discharging of the cargo from the LNG vessel and the loading of the FSRU takes place. LNG is pumped using submersible pumps located at the bottom of each tank. The usual procedure is to start two recirculation pumps in one tank and then start discharging. A similar procedure is then applied to the other tanks with a short period intervening for each tank. Since all pumps start operating at a 60% load, it slowly increases to the maximum. As the pressure drops on the tank, the BOG created in the FSRU tanks is sent back to the discharging tank of the LNGC, which maintains the tank pressure for the vessel at an agreed level.
The cargo is transferred with great care due to the movement of the LNGC in relation to the FSRU (roll, sway, heave, etc.). In parallel, the air trapped inside the piping of the cargo transfer system is removed, with Nitrogen gas (N2) injected and compressed to about 4 to 6 bars. After the compression, the vent valve opens to release the N2 gas into the atmosphere. This procedure is repeated and a pipeline leak test with soap is performed simultaneously. The purification of the pipeline gas ends when the oxygen (O2) content of the released gas from the pipes system drops below 2%.
With the release of the remaining liquids and vapor, the pipes must be cleaned after the cargo has been fully unloaded. After the cleaning is complete, a final tonnage measurement is performed and then the cargo transfer system is disconnected.
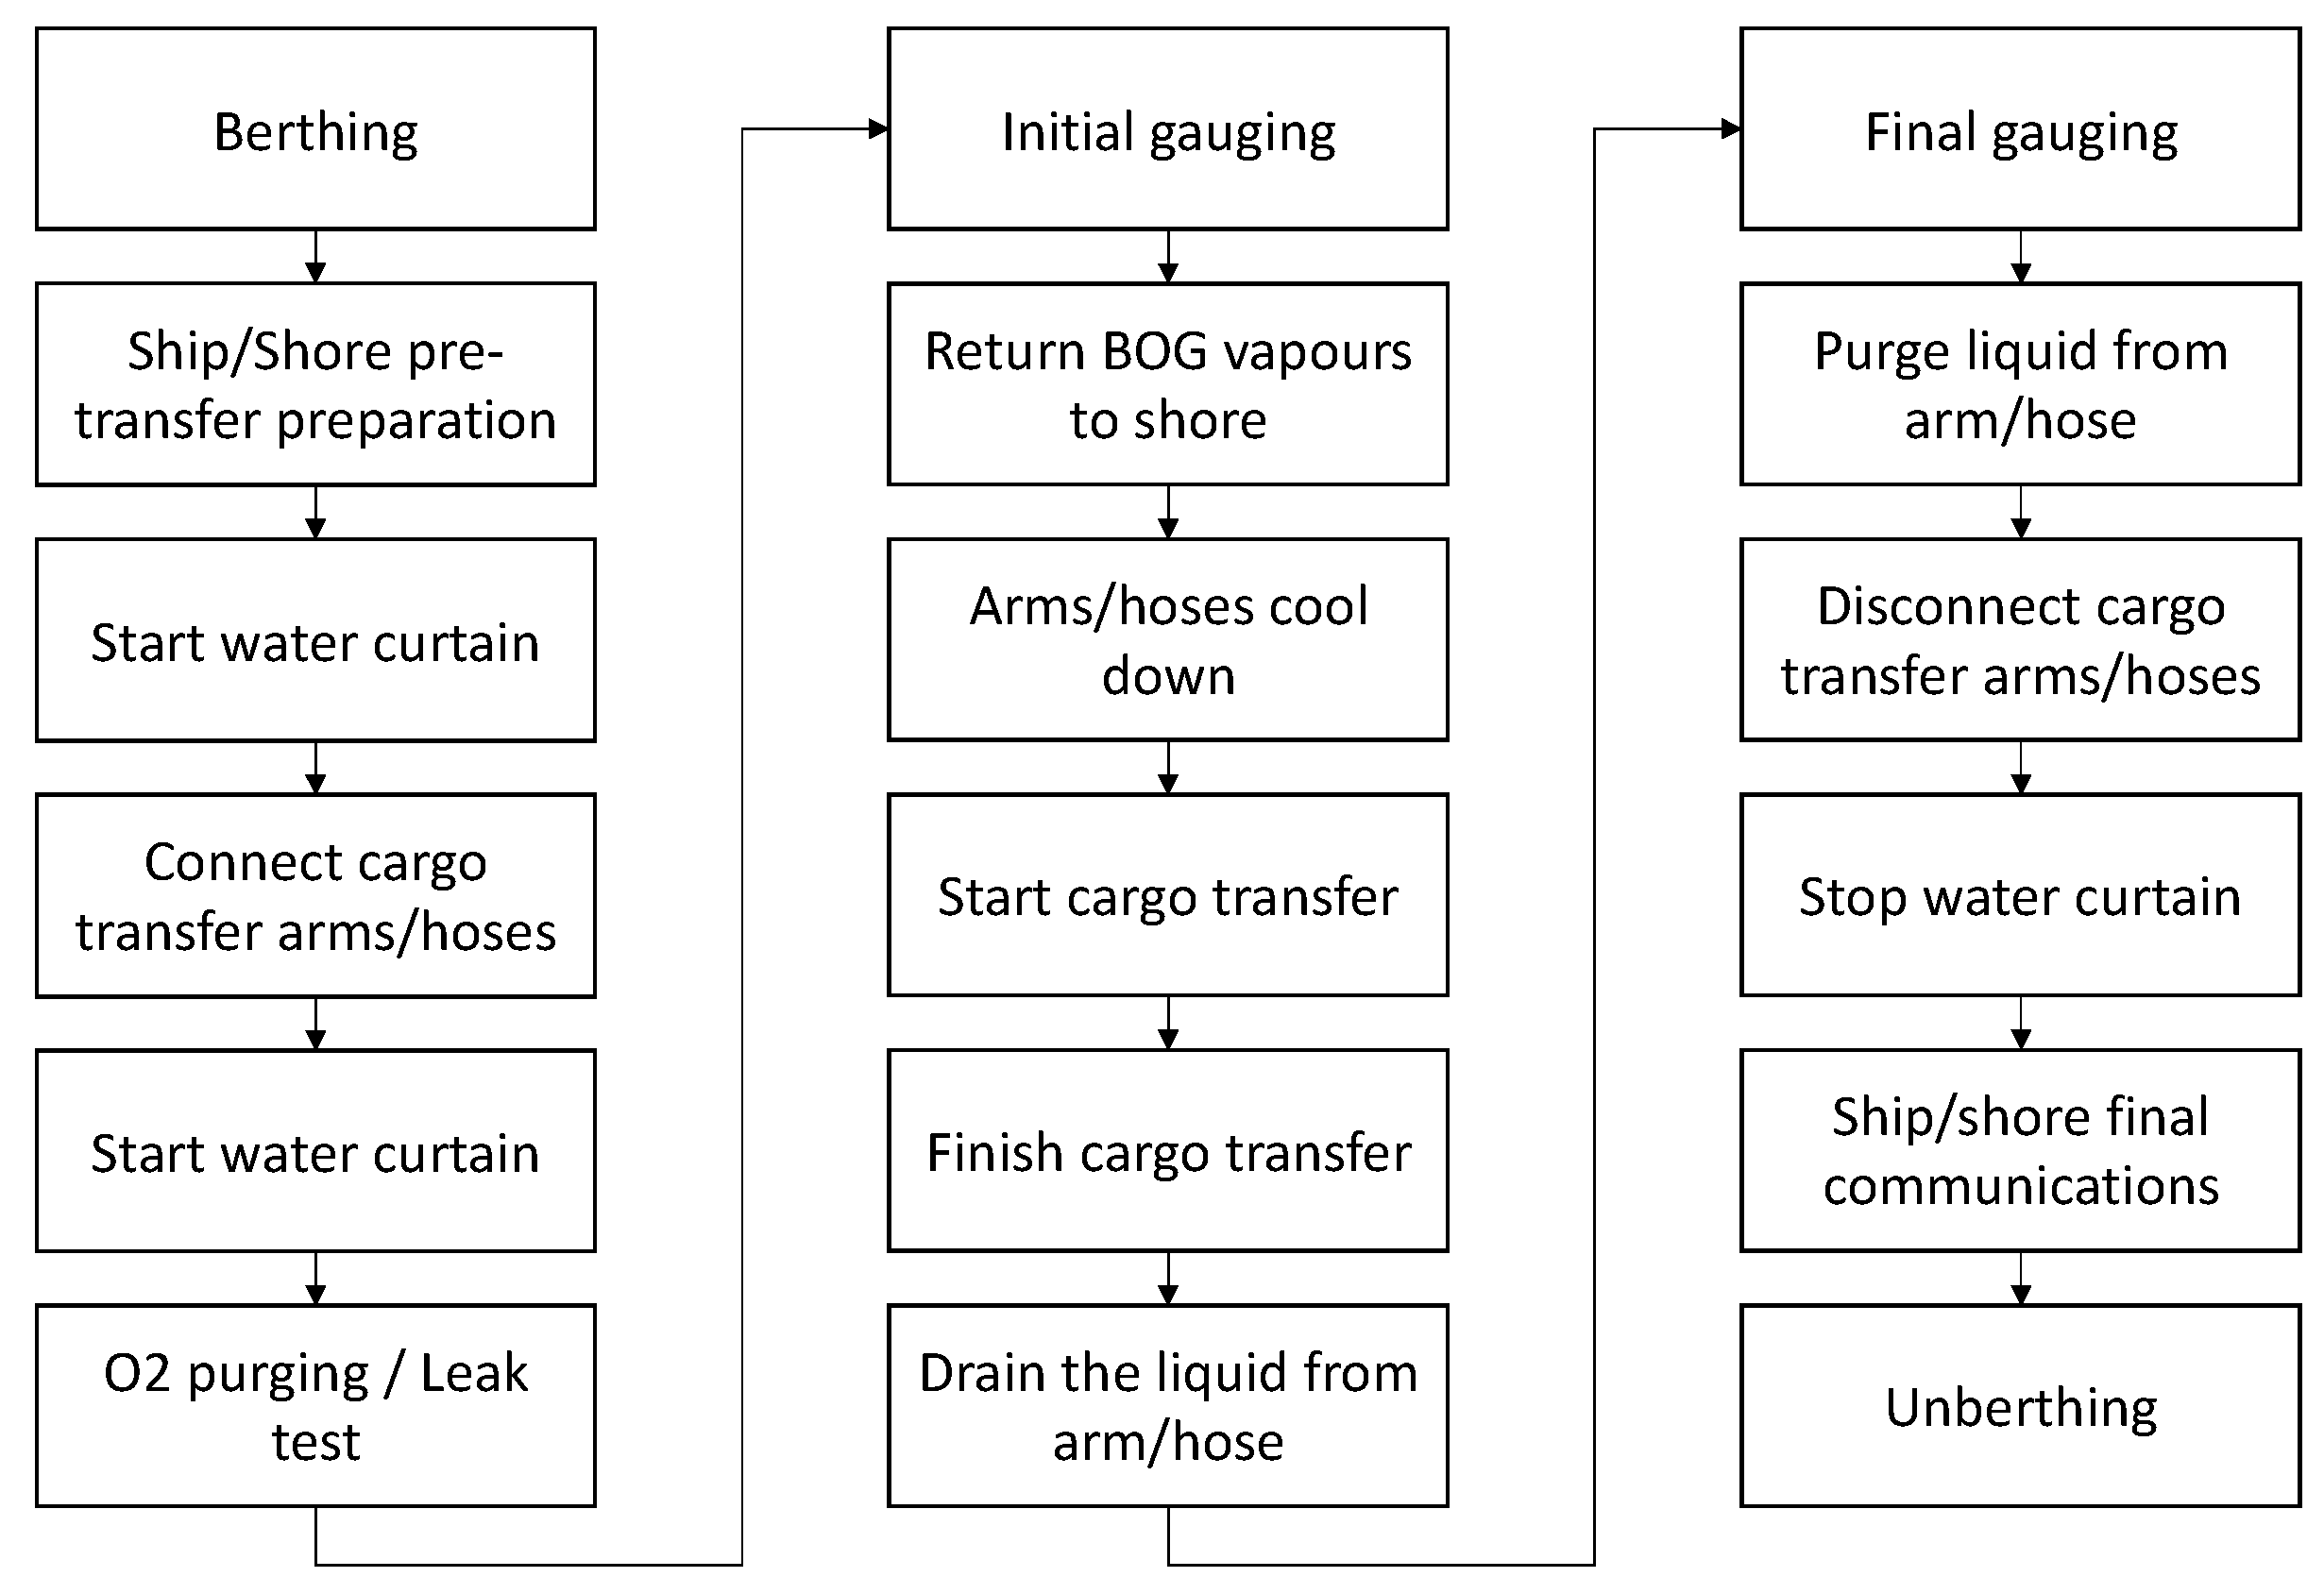
In terms of information exchange, immediately after the departure of the LNG vessel from the port of origin to the FSRU, a document containing all relevant information about the quantity, quality, composition of the cargo, ship configuration and the conditions under which she operates must be sent to the FSRU operator. In addition, this notice must include any other request for the STS transfer, as well as any information affecting the LNG. A more detailed scope of the LNG discharging from the vessel to the FSRU is illustrated in Figure 2.
A schematic representation of the LNGC and the FSRU developed in AutoCAD is presented in Appendix A, illustrating the main technical elements and parameters of the LNG transfer system. The schematic enables the distinction amongst several flows (LNG, BOG, etc.) and processes for the loading of FSRU and regasification of LNG is performed. The assumed layout and processes are the basis for the proposed simulation model.
Finally, some critical elements are controlled and monitored by the FSRU cargo control room constantly during operations. The most important elements are:
- LNGC and FSRU cargo tank levels;
- LNGC and FSRU cargo tank pressure;
- FSRU pump load and discharging pressure;
- Draft and trim of the LNGC.
Most of the aforementioned characteristics are incorporated in the proposed model described in the following section.
2.2. Description of the FSRU Simulation Model
The aim of the computational model was to simulate the operation of an FSRU in the context of tactical planning. With the loading and discharging parameters being known for the LNG vessel and the FSRU, the simulation model was able to calculate the time required to accomplish each process. In addition, the model produces results regarding the FSRU cargo tank level (or LNG inventory) and the send out rate of the natural gas from the FSRU to the gas network.
The simulation model consists of two basic subsystems, the LNG vessel and FSRU. The basis of the model is the cargo flows between the LNGC–FSRU subsystems. To encapsulate the flows in an accurate manner, specific input data parameters are required, namely technical characteristics for each LNG ship and the FSRU, as well as the estimated arrival time of each ship to the FSRU. The input parameters are presented in Table 1. Storage capacity is used in connection with the tank level to simulate the LNG cargo inside each cargo tank of the LNGC and the FSRU. The commencement and ceasing of STS operations is triggered by those parameters. Other input parameters are the flow rate used to simulate the LNG flows from each cargo tank to the vaporizer unit. “NG send out rate” refers to the gas end out rate to the shore network.
The simulation tool was developed using MathWorks software tools, MATLAB and Simulink. Initially, a MATLAB code is used to request input for all the technical elements presented in Table 1. This code makes the simulation modeling straightforward for the user, enabling them to insert data according to the specifications of the system under study. The features are not only able to meet the computational requirements, but also provide the user with a practical graphic interface of the Simulink processes. As a result, the user can produce a more intricate model for the FSRU operation by expanding the systems included in the initial model. Apart from the items in the Simulink library, developers can create their own functional blocks, either by designing them in Simulink or by coding them using the MATLAB platform.
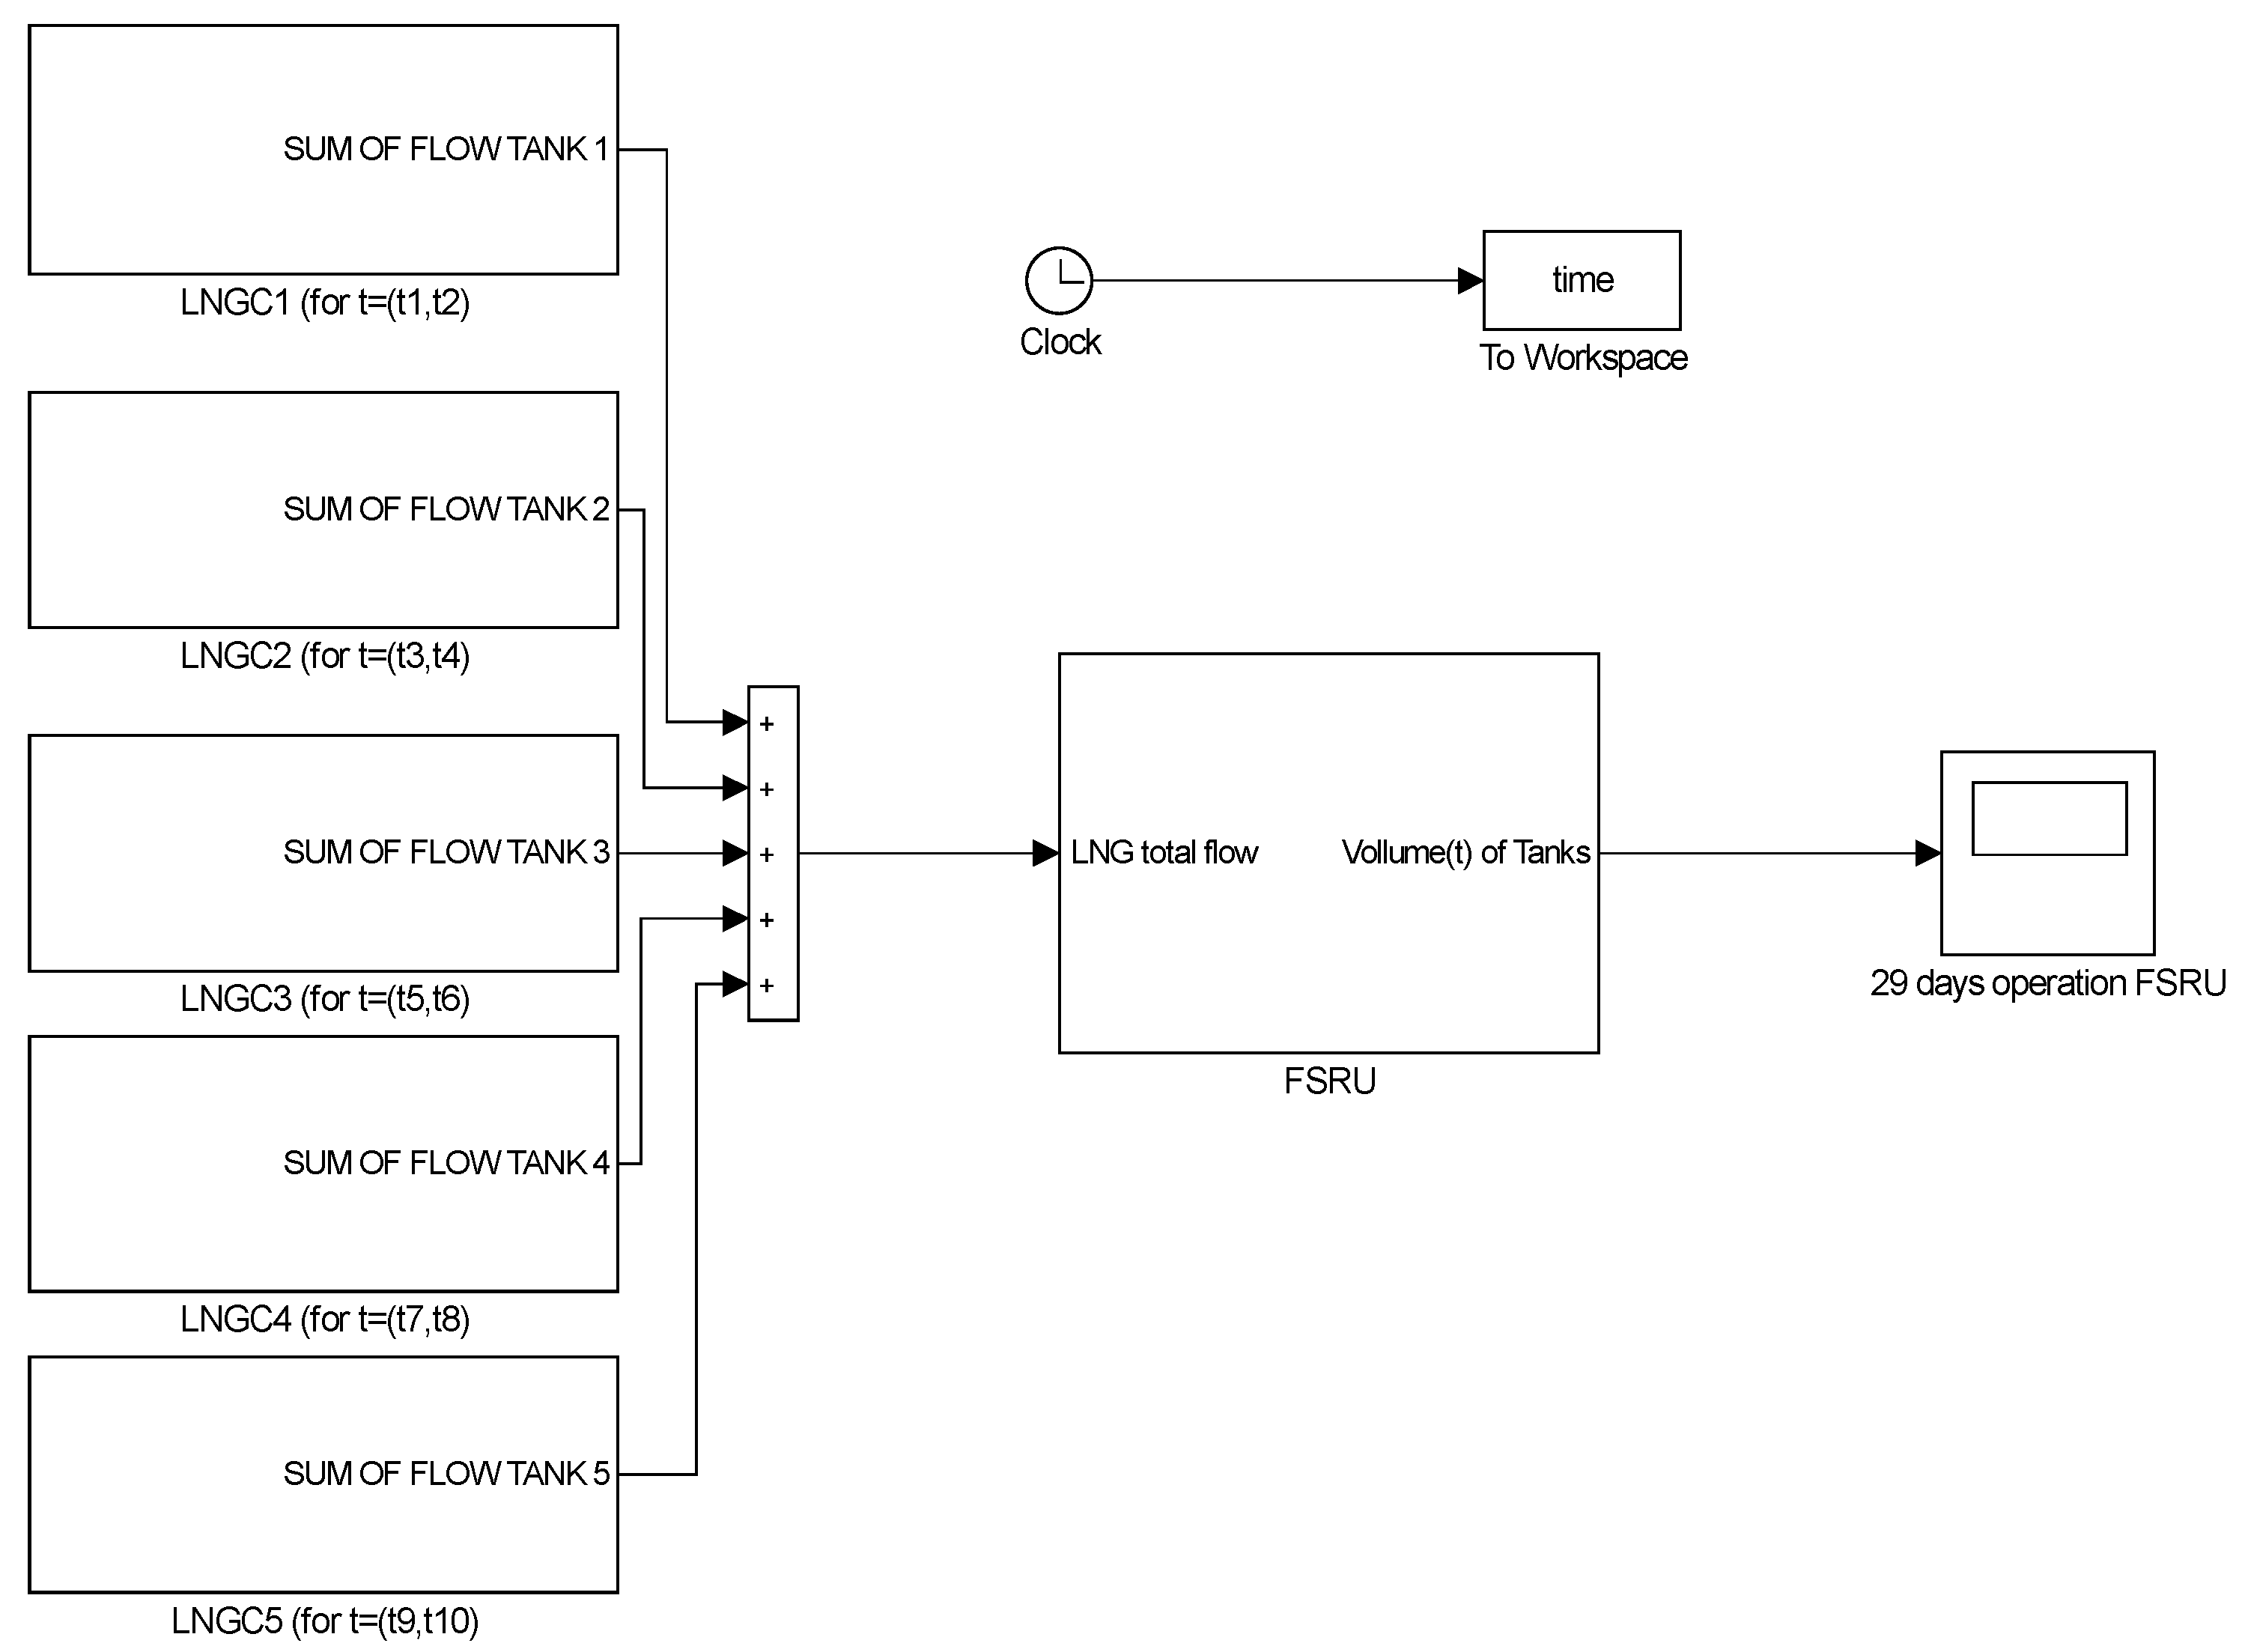
The basic principle of the model is the proper representation of LNG flows during the STS and FSRU operation. To achieve this, Simulink signals and blocks are used to model the LNGC and FSRU pipelines, pumps and valves. The underlying principle of the block arrangement is the mass balance principle. The planning horizon is 2.5 × 10⁶ s (or approximately 29 days), which is considered as a sufficient time period to simulate the operation of an FSRU and draw reasonable conclusions in terms of tactical planning [11]. The tool has the capacity to simulate multiple consecutive discharges, limited only by the time horizon. Figure 3 shows a conceptual representation of the model with an indicative number of five (5) LNG ships and the FSRU unit.
The general principle of the simulation is the calculation of the LNG flows during an STS transfer, according to the formula:
where V is the volume of LNG as a function of time, and Q is the flow of LNG.
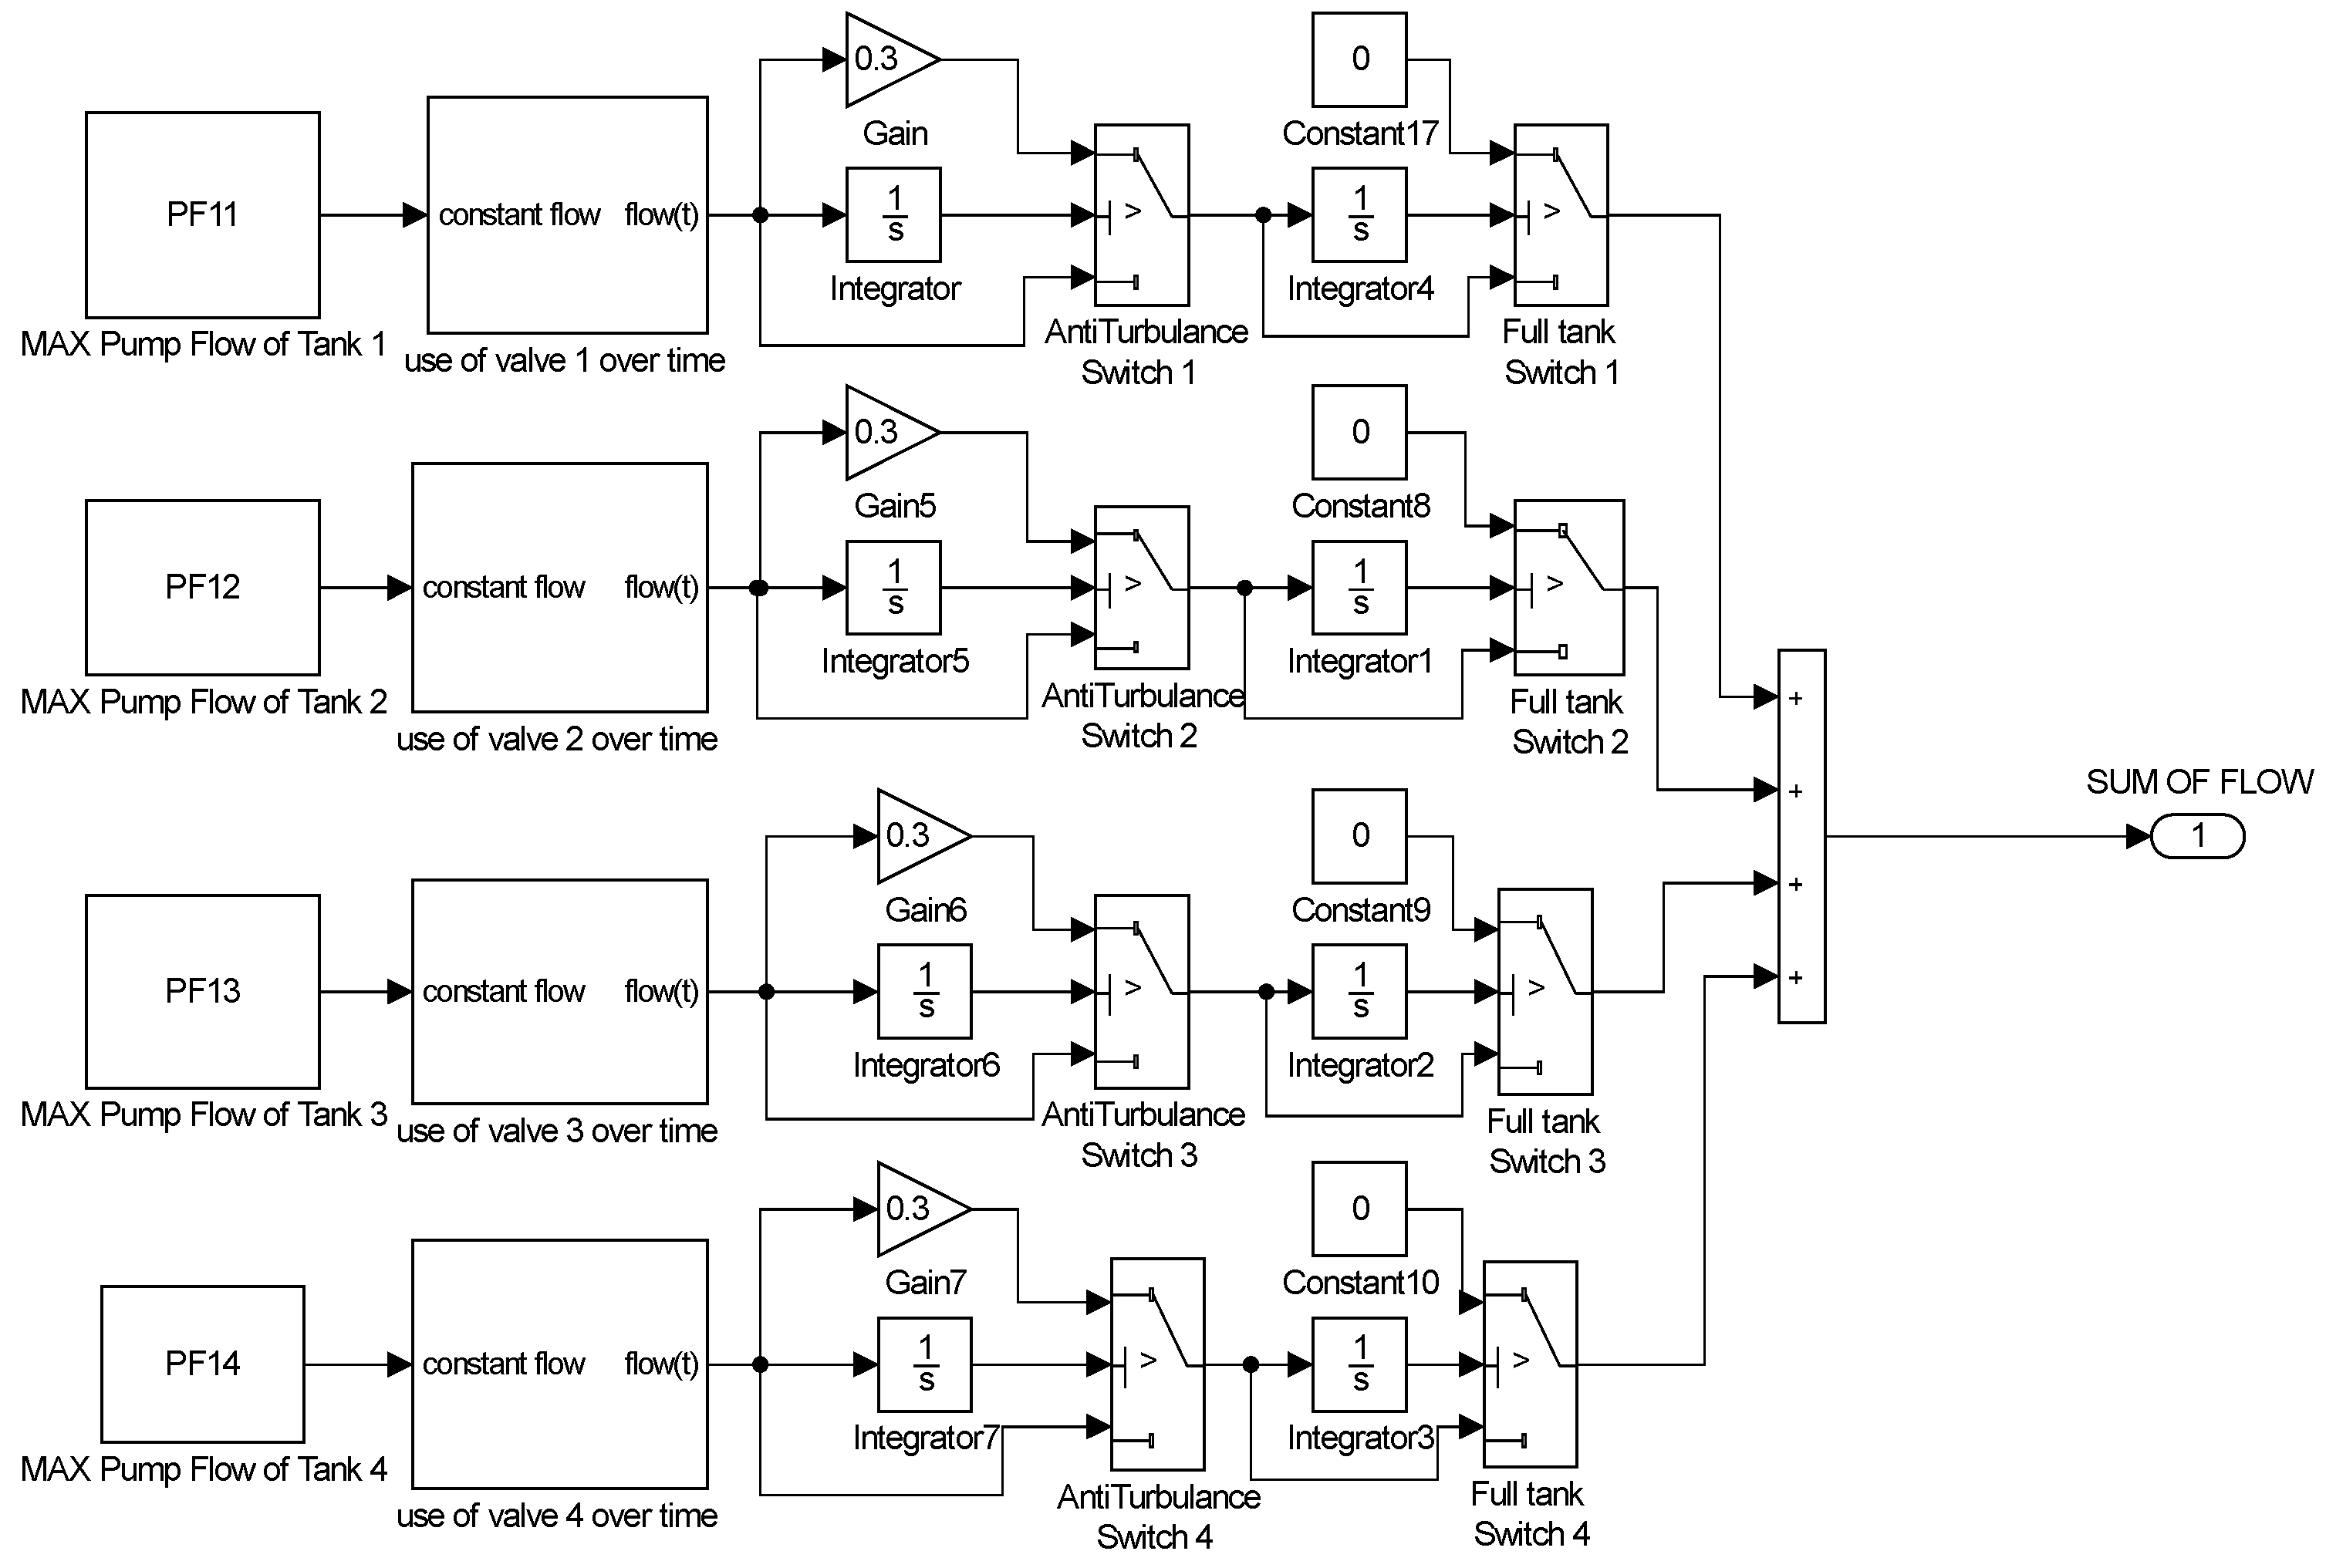
To ensure a realistic simulation approach, each LNG ship is further analyzed as a unique subsystem, shown in Figure 4. A block is assigned to each of the cargo tanks (i = 1,…,n), which sets a signal for the maximum value of the pump flow. By selecting each block, the user can enter a parameter that remains constant over time (“constant value”). Then, the signal enters the “use-valve over time” block in which the flow is represented as a function of time. The time sequence is completed by multiplying the flow signal by a new time-signal that the user creates based on the chosen scenario. The blocks “time” and “% of usage” are an f(t) signal function that takes the form the user decides by inserting two variables (time and %).
First, the subsystem “use of valve i over time” was used to formulate the signal as a function of time. The actual LNG flow is continuous and has been set as a function of time. Its signal will pass through the switch blocks. The role of the “anti-turbulence switch” and “full tank switch” is to reduce the pump flow for safety and functional reasons, when the LNGC cargo tank reaches a certain limit. In every case, the user sets the percentage by which the LNG flow will be reduced to. In the current research, the LNG flow decrease is represented by the 0.3 (or 30%) gain value. Furthermore, the switches are intended to stop the flow completely, when the LNGC tank has reached its preset limit. The two switches have an input which is the volume of LNG that has passed from the pump. Volume is calculated by integrating the flow of LNG over time, via the use of a pair of “integrator” blocks for each cargo tank. It is observed that when the full tank switch commutes between positions, the gas flow changes steeply without affecting the simulation result, because the valve placement is rapid in comparison with the time horizon of the simulation. Each switch block has three input, one threshold, and one output values. The two inputs are the signals which the block will process and select one as the output, while the third input is the reference value that the block uses to make the decision. The threshold is selected by the user for each LNGC and the FSRU. In the end, the signals from the four tanks are combined to create the overall flow to simulate the unloading of each LNGC in its entirety.
The modeling of the FSRU subsystem, as displayed in Figure 5, enables the simulation of the loading process and the subsequent LNG vaporization over time. The blocks for the FSRU cargo tanks are built in a similar fashion to the LNGC blocks. Indicatively, there are four tanks in the selected FSRU, as this is the usual case, and each one of them has its own block series.
The LNG flow from the LNGC to the FSRU is represented as a separate subsystem. The signal of the FSRU cargo tanks is processed to ensure that when a tank is filled up to its given limit, the LNG flow is directed to the next empty tank. With the loading rate known (LNG rate from LNGC to FSRU), the flow signal is an input for the FSRU tank valve component, which simulates the flows according to a user-defined function. The simulation time for the FSRU is not limited to the discharging process of one LNGC, but includes all the operations taking place during the time horizon of the tool (29 days).
FSRU loading must satisfy the mass balance principle and is assumed to comply with the respective rules and regulations to ensure its stability and safe operation. According to the mass balance principle the total mass accumulation in a system without buffer must be equal to zero. In order to satisfy the principle in the system, a feedback signal is added, which will re-introduce the excess LNG resulting from the valve block to the system, when a tank fills up. The Simulink component performing the above procedure is shown in Figure 5.
The signal of the FSRU tank subsystem accounts for the LNG flow into the tank and the outflow of gas (vaporized LNG) sent out over time. The technical characteristics for the vaporizer are set by the user and its flow time sequence generates the LNG flow rate heading for gasification. By comparing the total volume within the tank, to the tank filling limits the model which computes the LNG flow into the tank over time. The LNG flow is then converted to a volume signal, which is directed through a switch comparing the volume with the filling limit of the tank to avoid exceeding it. It is worth noting that the LNG balance within the FSRU can be negative, in case there is only LNG outflow for gasification without an LNGC discharging.
In Section 3, the validity of the proposed simulation model is checked through different structured scenarios for the operation of an FSRU. The simulation assumes basic technical characteristics for the LNGC and FSRU. In addition to validation, the case study results will be used to discuss implication in management issues regarding FSRU terminal operations.
3. Case Study
In this section, we present the results of the four numerical examples. In the first set of scenarios, we conducted a comparison between the two different demand scenarios to see how this factor affects the inventory management of the FSRU, when five (5) identical vessels discharge their cargo during a monthly period. In the second set of scenarios, we repeat the simulations, albeit with five (5) different vessels.
First, the assumptions and input parameters are presented, followed by the presentation of the results. The simulations were implemented in Simulink on a personal computer with an AMD Ryzen 5 3500U with Vega Mobile Gfx 2.10 GHz and 6 GB RAM.
3.1. Assumptions
The structured case study examines six (6) scenarios corresponding to a realistic FSRU operational profile, whilst adopting assumptions common to all scenarios. For the purpose of the study, five (5) vessels are calling the FSRU terminal, with the main parameters presented in Table 2 and Table 3. Each LNGC is assumed to arrive loaded to the terminal with the contracted cargo and without calculating part of the cargo consumed as fuel. In the beginning of the simulation, the FSRU is considered to be empty of cargo. Each LNGC and the FSRU consist of four (4) cargo tanks, with the nominal capacity of each of them set by the user prior to the simulation. The piping system and consequently the flow rate are considered to be identical for all the LNGCs as presented in Section 2.2.
The parameter “storage capacity” is an input for both the vessels and the FSRU. For each LNGC it accounts for the cargo delivered, whereas for the FSRU it quantifies the storage capacity available. This parameter is identical for each vessel in scenarios 1, 2 and 3, but it is given a different value in scenarios 4, 5 and 6, in order to check how it affects the planning process. The filling level for each cargo tank in the LNGCs and the FSRU are set in advance by the user to enable the start/stop of the LNG flow. Except for the above, a dedicated FSRU parameter, “NG send out rate”, is set to represent the onshore gas demand. This is an input parameter that relates to the replenishment of the LNG inventory and the gasification of LNG. The demand is presented in the form of a Figure displaying the time evolution of gas demand that the FSRU must meet, thus adjusting the operational capacity of its vaporizer unit. Figure 6 illustrates the onshore gas demand for the scenarios under study.
3.2. Results
In this section, the simulation results for the scenarios in regards to the monthly operation of an FSRU terminal are addressed. The operation includes the: (a) LNG STS transfer from the LNGCs to the FSRU, (b) the LNG inventory level in the FSRU and, (c) the gas send-out rate to the onshore network. The results obtained by the proposed simulation model are shown in Figure 7, Figure 8 and Figure 9.
Figure 7 shows the time evolution of the LNG sent from each cargo of the FSRU to the vaporizer unit. The difference of the LNG flow between low (a,d) and high (b,c,e,f) gas demand scenarios is evident. In all cases, it is adjusted to meet the required rate of gas send out to the onshore network.
Figure 8 and Figure 9 summarize the time evolution of the LNG volume inside the FSRU. The versatility of the proposed tool enables the user to simulate the LNG inventory in each tank independently, as well as monitor the total volume to enable holistic inventory management. As a result, the user has a complete picture of the volume of LNG within the FSRU tanks over the defined time period (29 days).
The user can check the scenarios for operational feasibility. This is proved by the fact that the simulation results in Figure 8b,e and Figure 9b,e show a defect in the preliminary vessel arrival schedule. Before the arrival of each LNGC, the LNG inventory stops decreasing, which is an indication that no further LNG is pumped for vaporization. Consequently, the FSRU does not send gas for a short time period before the arrival of each vessel.
In the aforementioned scenarios, the terminal would not operate as planned and consequently the gas demand onshore would not be satisfied. To resolve this issue, a different arrival time for each LNGC was used as input to the model. The results of the simulation with the new arrival time are those of scenarios 3 and 6. From Figure 8c,f and Figure 9c,f, it can be deduced that the new schedule for LNGC berths to the FSRU deals with the requirement for uninterruptible gas send out. The schedule of arrivals for each LNGC is presented in Table 4.
4. Conclusions and Discussion
The paper presents a novel simulation tool for FSRUs, as more and more such units have been operating in recent years worldwide. The underlying simulation model incorporates all the technical features of the LNGC and the FSRU involved in LNG STS (pumps, valves, tanks). Using a user defined gas demand, the model produces a simulation for the LNG discharged inside the FSRU, a volume stored there and the evolution of the LNG regasified and fed in the onshore network with a monthly frequency. The simulations can check the system sensitivity to different parameters. A support schedule regarding: (i) slots for LNG carrier calls, (ii) LNG inventory fluctuation, and (iii) the impact of gas demand and send-out rate changes.
The MATLAB and Simulink programming environment was used to implement the proposed tool. Simulink, through its simplicity as a graphical interface and its ability to handle a multitude of options (libraries, blocks, etc.) proves to be a suitable environment.
Different scenarios are selected to validate the proposed planning tool, while modifying various parameters. The tool was checked against variations in regard to the LNGC cargo size delivered to the FSRU. Another parameter was the LNG flow to the vaporizer as per gas demand onshore. By examining two gas demand profiles, the versatility of the tool is illustrated in terms of planning the LNGC arrivals and adjusting the flow rate to the FSRU vaporizer.
In conclusion, the simulation of an FSRU unit as shown by the results achieves the goals set initially. The model developed can support the preliminary tactical planning of FSRU operations. The interpretation of the aforementioned figures validate the capacity of the simulation model to create various scenarios, thus providing the user with a complete and comprehensive picture of the system’s sensitivity to natural gas consumption fluctuations, possible arrival delays for the LNGCs, maintenance operations, etc.
Several other interesting extensions of the problem studied can be considered in future work. Developing further the simulation of FSRU operations may include some technical aspects such as the management of BOG in the cargo tanks, which is part of the LNG cargo inside the FSRU. The presence of BOG in the model will affect the LNG flows which in turn will affect STS transfer time.
Another suggestion for future study is to add parameters related to weather. Wind and wave conditions affect the LNGC berthing to the FSRU terminal and the operation of the FSRU itself. The inclusion of such parameters could limit the operational window of the FSRU and provide a more accurate profile for locations and months with adverse weather.
Finally, a non-constant over time gas demand profile can be examined, i.e., with hourly peaks, daily peaks. Such changes might derive from the process of time-series for existing FSRUs in operation and will lead to several useful insights regarding tactical planning.
Author Contributions
Conceptualization, C.P.; methodology, C.P., E.A. and D.V.L.; software, E.A.; validation, E.A.; formal analysis, C.P. and E.A.; investigation, E.A.; resources, C.P.; data curation, E.A.; writing—original draft preparation, C.P. and E.A.; writing—review and editing, C.P. and E.A.; visualization, E.A.; supervision, D.V.L.; project administration, C.P. All authors have read and agreed to the published version of the manuscript.
Funding
This research received no external funding.
Conflicts of Interest
The authors declare no conflict of interest.
Appendix A
Figure A1.
A schematic of the LNGC components used during discharging (authors’ illustration based on relevant technical manuals).
Figure A1.
A schematic of the LNGC components used during discharging (authors’ illustration based on relevant technical manuals).

Figure A2.
A schematic of the FSRU components used during discharging (authors’ illustration based on relevant technical manuals).
Figure A2.
A schematic of the FSRU components used during discharging (authors’ illustration based on relevant technical manuals).

References
- IGU. 2020 World LNG Report—IGU; IGU: Barcelona, Spain, 2020; p. 68. [Google Scholar]
- Songhurst, B. Floating LNG Update-Liquefaction and Import Terminals; Oxford Institute for Energy Studies: Oxford, UK, 2019. [Google Scholar]
- Artana, K.B. Multiple Criteria Decision Making (MCDM) Process in Selecting Location for Floating Storage and Regasification Unit (FSRU): A Case Study of Bali Island Project. In Proceedings of the ASME 2009 28th International Conference on Ocean, Offshore and Arctic Engineering, Honolulu, HI, USA, 31 May–5 June 2009; pp. 393–400. [Google Scholar]
- Lee, S.; Choi, B.C. Thermodynamic assessment of integrated heat recovery system combining exhaust-gas heat and cold energy for LNG regasification process in FSRU vessel. J. Mech. Sci. Technol. 2016, 30, 1389–1398. [Google Scholar] [CrossRef] [Green Version]
- Bisen, V.S.; Karimi, I.A.; Farooq, S. Dynamic Simulation of a LNG Regasification Terminal and Management of Boil-off Gas; Elsevier Masson SAS: Paris, France, 2018; Volume 44. [Google Scholar]
- Yoonho, L. LNG-FSRU cold energy recovery regasification using a zeotropic mixture of ethane and propane. Energy 2019, 173, 857–869. [Google Scholar] [CrossRef]
- Zhang, G.; Li, B.; Zhang, X.; Wang, Q. Design and Simulation Analysis of Cold Energy Utilization System of LNG Floating Storage Regasification Unit. IOP Conf. Ser. Earth Environ. Sci. 2019, 300, 022117. [Google Scholar] [CrossRef]
- Briano, E.; Caballini, C.; Modula, D.; Revetria, R.; Testa, A. A System Dynamics Approach for Managing the LNG Procurement for an Offshore Platform Feeding a Power Plant. In Proceedings of the 9th WSEAS International Conference on System Science and Simulation in Engineering (ICOSSSE’10). World Scientific and Engineering Academy and Society (WSEAS), Stevens Point, WI, USA, 4–6 October 2010; pp. 259–269. [Google Scholar]
- Lee, D.H.; Ha, M.K.; Kim, S.Y.; Shin, S.C. Research of design challenges and new technologies for floating LNG. Int. J. Nav. Archit. Ocean. Eng. 2014, 6, 307–322. [Google Scholar] [CrossRef] [Green Version]
- Songhurst, B. The Outlook for Floating Storage and Regasification Units (FSRUs); Oxford Institute for Energy Studies: Oxford, UK, 2017. [Google Scholar]
- Christiansen, M.; Fagerholt, K.; Nygreen, B.; Ronen, D. Chapter 4 Maritime Transportation. Handb. Oper. Res. Manag. Sci. 2007, 14, 189–284. [Google Scholar]
Figure 1.
Active number of floating storage and regasification units (FSRUs) by owner [1].
Figure 1.
Active number of floating storage and regasification units (FSRUs) by owner [1].

Figure 2.
LNG to FSRU transfer processes (authors’ illustration based on relevant technical manuals).
Figure 2.
LNG to FSRU transfer processes (authors’ illustration based on relevant technical manuals).

Figure 3.
Conceptual representation of the simulation model.

Figure 4.
LNGC subsystem modeled in Simulink.

Figure 5.
The FSRU subsystem modeled in Simulink.

Figure 6.
Natural gas demand for different operation scenarios presented in the form of send out rate from the FSRU.
Figure 6.
Natural gas demand for different operation scenarios presented in the form of send out rate from the FSRU.

Figure 7.
LNG pumped to the vaporizer of the FSRU for different operation scenarios.

Figure 8.
LNG stored in each cargo tank of the FSRUs for different operation scenarios.

Figure 9.
LNG inventory held in the FSRU for different operation scenarios.


Table 1.
Parameters used in the simulation tool.
| Input Parameter | Subsystem | Component of the Subsystem | Units |
|---|---|---|---|
| Storage capacity | LNGC/FSRU | Each cargo tank | m3 |
| Tank level | LNGC/FSRU | Each cargo tank | m3 |
| LNG flow rate from the LNG Carrier (LNGC) | LNGC | Pump in each cargo tank | m3/h |
| NG send out rate | FSRU | LNG vaporizer | m3/h |
Table 2.
Parameters for scenarios 1, 2 and 3.
| Input Parameter | Value | Units | |||||
|---|---|---|---|---|---|---|---|
| LNGC 1 | LNGC 2 | LNGC 3 | LNGC 4 | LNGC 5 | FSRU | ||
| Tank 1 storage capacity | 20,000 | 35,000 | 35,000 | 35,000 | 35,000 | 20,000 | m3 |
| Tank 2 storage capacity | 40,000 | 42,182 | 42,182 | 42,182 | 42,182 | 40,000 | |
| Tank 3 storage capacity | 40,000 | 42,182 | 42,182 | 42,182 | 42,182 | 40,000 | |
| Tank 4 storage capacity | 32,000 | 37,096 | 37,096 | 37,096 | 37,096 | 32,000 | |
| Tank level | 2000 | ||||||
| LNG flow rate from the LNGC | 0.94 | - | m3/s | ||||
Table 3.
Parameters for scenarios 4, 5 and 6.
| Input Parameter | Value | Units | |||||
|---|---|---|---|---|---|---|---|
| LNGC 1 | LNGC 2 | LNGC 3 | LNGC 4 | LNGC 5 | FSRU | ||
| Tank 1 storage capacity | 18,750 | 10,200 | 21,000 | 11,250 | 16,500 | 20,000 | m3 |
| Tank 2 storage capacity | 37,500 | 20,400 | 42,000 | 22,500 | 33,000 | 40,000 | |
| Tank 3 storage capacity | 37,500 | 20,400 | 42,000 | 22,500 | 33,000 | 40,000 | |
| Tank 4 storage capacity | 31,250 | 17,000 | 35,000 | 18,700 | 27,500 | 32,000 | |
| Tank level | 2000 | ||||||
| LNG flow rate from the LNGC | 0.94 | - | m3/s | ||||
Table 4.
Arrival schedule for each LNGC.
| Scenario | LNGC1 | LNGC2 | LNGC3 | LNGC4 | LNGC5 | Units |
|---|---|---|---|---|---|---|
| 1, 2, 4, 5 | 0 | 500,000 | 1,000,000 | 1,500,000 | 2,000,000 | s |
| 3 | 0 | 450,000 | 940,000 | 1,402,400 | 1,850,000 | |
| 6 | 0 | 415,000 | 850,000 | 1,252,800 | 1,600,000 |
Publisher’s Note: MDPI stays neutral with regard to jurisdictional claims in published maps and institutional affiliations. |
© 2020 by the authors. Licensee MDPI, Basel, Switzerland. This article is an open access article distributed under the terms and conditions of the Creative Commons Attribution (CC BY) license (http://creativecommons.org/licenses/by/4.0/).
Share and Cite
MDPI and ACS Style
Papaleonidas, C.; Androulakis, E.; Lyridis, D.V. A Simulation-Based Planning Tool for Floating Storage and Regasification Units. Logistics 2020, 4, 31. https://0-doi-org.brum.beds.ac.uk/10.3390/logistics4040031
AMA Style
Papaleonidas C, Androulakis E, Lyridis DV. A Simulation-Based Planning Tool for Floating Storage and Regasification Units. Logistics. 2020; 4(4):31. https://0-doi-org.brum.beds.ac.uk/10.3390/logistics4040031
Chicago/Turabian StylePapaleonidas, Christos, Emmanouil Androulakis, and Dimitrios V. Lyridis. 2020. "A Simulation-Based Planning Tool for Floating Storage and Regasification Units" Logistics 4, no. 4: 31. https://0-doi-org.brum.beds.ac.uk/10.3390/logistics4040031