
Supplier Selection Risk: A New Computer-Based Decision-Making System with Fuzzy Extended AHP


1
Graduate Program in Industrial Engineering, Federal University of Bahia, Salvador, BA 40210-630, Brazil
2
Department of Applied Social Sciences, State University of Southwest Bahia, Vitória da Conquista, BA 45031-900, Brazil
3
Department of Information Systems, Münster School of Business and Economics, University of Münster, 48149 Münster, Germany
*
Author to whom correspondence should be addressed.
Logistics 2021, 5(1), 13; https://0-doi-org.brum.beds.ac.uk/10.3390/logistics5010013
Submission received: 29 January 2021
/
Revised: 25 February 2021
/
Accepted: 26 February 2021
/
Published: 3 March 2021
(This article belongs to the Special Issue Application of Multi-Criteria Decision-Making Methods for Evaluation in Logistics and Supply Chain)
Abstract
:Supplier risks have attracted significant attention in the supply chain risk management literature. In this article, we propose a new computational system based on the ‘Fuzzy Extended Analytic Hierarchy Process (FEAHP)’ method for supplier selection while considering the relevant risks. We sought to evaluate the opportunities and limitations of using the FEAHP method in supplier selection and analyzed the support of the system developed through the real case of a Brazilian oil and natural gas company. The computational approach based on FEAHP automates supplier selection by determining a hierarchy of criteria, sub-criteria, and alternatives. First, the criteria and sub-criteria specific to the selection problem were identified by the experts taking the relevant literature as a starting point. Next, the experts performed a pair-wise comparison of the predefined requirements using a linguistic scale. This evaluation was then quantified by calculating the priority weights of criteria, sub-criteria, and alternatives. The best decision alternative is the one with the highest final score. Sensitivity analysis was performed to verify the results of the proposed model. The FEAHP computer approach automated the supplier selection process in a rational, flexible, and agile way, as perceived by the focal company. From this, we hypothesized that using this system can provide helpful insights in choosing the best suppliers in an environment of risk and uncertainty, thereby maximizing supply chain performance.

1. Introduction
Currently, the supplier selection process is a vital aspect of the supply chain, as it encompasses several risks inherent to businesses. Supplier performance can influence the competitiveness of the overall supply chain. Selecting the right suppliers for a supply chain brings benefits such as reduced procurement costs, contributes to product innovation, and helps achieve effective production processes. In addition, the growing market competition forces supply chains to establish more successful and sustainable relationships with their suppliers. However, as the structure of a supply chain becomes broader, more complex, and more globalized, companies become more dependent on their suppliers and also vulnerable to risks and disruptions [1].
Certain ruptures can hinder the flow of products, resources, and capital, causing critical reactions from customers and markets. As a dramatic example of this, we experienced the coronavirus pandemic (COVID-19), which severely affected the companies’ operations worldwide, highlighting the need for effective supply risk management plans. Therefore, a suitable methodology for the selection of suppliers is an increasingly important need for the supply chain’s resilience and robustness.
A part of the previous literature on supply chain risk establishes that supplier selection can be treated as a multi-criteria decision-making problem. The different supplier selection criteria may vary depending on a company’s needs, preferences, technology strategy, and risks [2]. Modeling a decision problem may involve one single or multiple decision-makers, affecting one or more criteria throughout the process, such as price, quality, delivery, service, etc. Each decision-maker has personal judgment values on these selection criteria, so the value of these decision variables is subjectively influenced [3]. Hence, the supplier selection process involves imprecision, uncertainty, subjectivity, and ambiguity.
Decision-making models that involve more than one criterion are called multi-criteria decision-models. In these models, decision alternatives are evaluated according to the number of criteria (and sub-criteria) defined, requiring the use of an appropriate method for preference classification [4]. For this, the Analytic Hierarchy Process (AHP) has been widely used because it can deal with real multi-criteria decision-making problems [5]. Despite its popularity and conceptual simplicity, this method is often criticized for the inability to deal with the uncertainty and inaccuracy inherent in mapping the perception of the decision-maker [6]. In the traditional formulation of AHP, human judgments are represented as exact or crisp numbers. However, in many practical cases, such as the supplier selection problem, the human preference model is uncertain, vague, and subjective, and it is not feasible for the decision-maker to express his preferences through exact numerical values. In these cases, it is best for the decision-maker to use ‘interval evaluations’ or ‘fuzzy evaluations’.
Fuzzy set theory resembles human reasoning, mathematically representing the use of approximate and uncertain information in decisions [7]. The need of today’s world to find real solutions to problems with inherent inaccuracy has made fuzzy logic important in the economic, social, industrial, and political spheres [8]. In order to deal with the uncertainties of the decision problem and eliminate the disadvantages of AHP, the Fuzzy AHP integrated approach is preferred in supplier selection research [6] because it is more effective in representing the priority judgments of decision-makers.
Thus, in this article, we propose a new computational system based on the ‘Fuzzy Extended Analytic Hierarchy Process (FEAHP)’ method, introduced by Chang [9], for supplier selection considering risks. Specifically, we seek to: (i) evaluate the opportunities and limitations of using the FEAHP method in the selection of supplier considering risks; and (ii) analyze the support of the developed system through the real case of a Brazilian oil and natural gas company. There are three contributions provided by this article. First, we discussed the use of an integrated multi-criteria decision-making approach for solving an important problem in today’s supply chains, second, we proposed a new computational system that supports supplier selection in a rational, flexible, and agile way, and third, we applied the computational tool developed in a real case of supplier selection while considering risks of a large oil company, which allowed important empirical analyses for the area of supply chain, logistics, and operations management.
Besides this introduction, this paper has five more sections. In the next section, we present the literature review. In Section 3, we discuss the research methodology. In Section 4, we present the application of the FEAHP-based computing system in a Brazilian oil and natural gas company. We discuss the research empirical results in Section 5. Finally, in Section 6 we present the conclusion, limitations, and future work.
2. Literature Review
In the first two decades of this century, several events have highlighted the interdependencies between supply chain companies and their vulnerabilities to disruptive triggers with dramatic consequences [10,11]. According to [12], the risk of supply chain disruptions has increased in recent years due to the progress of globalization, increased outsourcing, and an intensified focus on efficiency and lean management. Despite the increased risks of the supply chain, few companies take effective measures to manage them [13]. This gap makes supply chain risk management (SCRM) an attractive area of research and professional practice. According to [14], SCRM results from coordination or collaboration between supply chain partners to ensure profitability and continuity, encompassing two dimensions: operational risks and violation; mitigation of risks. According to [15], SCRM involves all risks of the flow of finance, information, materials, and products, from suppliers to delivery of the product to the end user. From a process-oriented perspective, many scholars define the SCRM as a structure that involves the identification, evaluation, mitigation, and control of possible interruptions in the supply chain and its negative impacts [16,17,18,19,20,21,22].
According to [18], the supplier risks attracted significant attention in the studies on SCRM, with emphasis on supplier selection problems. Supplier selection is a critical issue because poor decisions can cause various supply-related difficulties, such as delays in deliveries and high defect rates [23]. In addition, as supply chains become global, external factors, in addition to internal factors, increasingly influence supplier risks [14]. The risks of supplier selection can be grouped into recurring risks if risk events are frequent but short, and risks of interruption if risk events are rare but long [24,25].
To identify and classify the supplier selection risks proposed in the literature, we reviewed several journal papers published between 2000 and 2020. First, the research terms were defined. The keywords used in the search process were ‘supplier’ or ‘vendor’ or ‘provider’ and ‘risk’ or ‘risk type’ or ‘risk factor’. Secondly, several academic databases were used to identify journal articles, including Emerald, Google Scholar, IEEExplore, ScienceDirect, Scopus, Springer, Taylor and Francis, and Web of Science. Only peer-reviewed articles written in English and published in international journals were selected. We did not restrict the list of journals to ensure the capture of all relevant studies.
Third, the reference lists of articles were also evaluated to ensure that there were no other relevant articles omitted from the research. Finally, the content of each article was completely revised to ensure that it fits the context of supplier selection considering risks. This analysis resulted in 26 journal articles. To classify these articles, we developed a conceptual structure that integrates several risks of supplier selection, as shown in Table 1. By synthesizing several points of view of the literature, we grouped the risks of supplier selection into 11 types. Each established ‘risk type’ has associated ‘risk factors’, i.e., several events and situations that lead to a specific ‘risk type’ [18].
As shown in Table 1, the risk types related to performance, delivery, quality, and sustainability attracted important attention in the literature, being considered as the main criteria in the selection of suppliers. The most significant risk factors were poor quality, delay in delivery, interruption of supply, supplier failure, and technological risks, which can be defined as the most relevant sub-criteria in supplier selection according to the above-mentioned literature review.
After determining the criteria (risk types) and sub-criteria (risk factors), decision-makers should choose an appropriate and systematic method to evaluate and select alternative suppliers. Many studies have reviewed the literature on supplier selection models [50,51,52,53]. Multi-criteria decision-making models (MCDM), mathematical programming (MP), and artificial intelligence (AI) techniques are some of the most popular approaches [50,53,54]. MCDM provides a methodological framework for decision support systems; MP is used to optimize or evaluate supplier selection; AI identifies approximate solutions to complex optimization problems [54]. MCDM approaches are the most popular and within MCDM the Analytical Hierarchy Process (AHP) is most often applied [53].
AHP is widely used because it is effective in evaluating qualitative and quantitative decision criteria [6]. It can be used alone or combined with other methods. The interaction and interdependent relationships between evaluation criteria are critical and should be considered in order to properly select a supplier. The hierarchy of decision criteria is the subject of an AHP pair-wise comparison, which converts human preferences among the available alternatives into ‘equal, not very strong, strong, very strong, and extremely strong’ [5]. Although the crisp scale of AHP has the advantages of simplicity and ease of use, it is unable to consider the uncertainty associated with subjective and individual evaluation of the decision-maker. Therefore, to deal with the uncertainties of the decision problem and eliminate the disadvantages of AHP, Fuzzy AHP is the preferred method in supplier selection studies [6]. The main motivation behind incorporating the Fuzzy set theory into the original AHP is based on the argument that human judgments and preferences cannot be accurately represented by crisp numbers due to the uncertainty inherent in human perception [55]. The Fuzzy set theory implements data classes with unclear limits, that is, fuzzy limits [56].
There are several approaches in the studies on supplier selection that used the AHP and Fuzzy methods in an individual or integrated way [57,58,59,60,61]. However, the literature on the use of AHP and Fuzzy methods in the problem of supplier selection that considers risks is more limited. In the work of [2], the integrated approach Fuzzy AHP is adopted to evaluate the relevant decision criteria, including risk factors, in the development of a global supplier selection system. In [32], Fuzzy, AHP, and TOPSIS (Technique for order preference by similarity to the ideal solution) methods are used in the selection of suppliers based on supply chain ecosystem, performance, and risk criteria. In [37], the integrated method Fuzzy AHP is applied to the concept of benefits, opportunities, costs, and risks to evaluate various aspects of suppliers. In [49], the combined Fuzzy-AHP-Input/Output model approach is used to evaluate the social risks of supplier selection in the German automotive industry. Finally, in [62] an integrated Fuzzy-AHP-VIKOR approach is used to select sustainable global suppliers.
Based on the literature review presented in this section, we identified some important observations on the problem of supplier selection considering risks: a. the risk types (decision criteria) and risk factors (decision sub-criteria) prominent in the literature refer mainly to aspects of supplier operational efficiency; b. the integrated Fuzzy AHP approach helps to develop the capabilities of traditional AHP and Fuzzy methods, overcoming some of their individual weaknesses; c. there is limited literature on the use of Fuzzy AHP integrated into supplier risk evaluation, as well as on the feasibility of its implementation in a practical and real manufacturing environment; and d. there is an insufficient discussion on the development of a computational tool for supporting the evaluation and selection of suppliers considering risks. Thus, to the best of our knowledge, this paper is an original effort at evaluating suppliers in the context of the risks inherent in a real supply chain through a computational solution that integrates the powerful AHP and Fuzzy techniques.
3. Methodology
The computational system for supplier selection considering risks proposed in this paper is based on the ‘Fuzzy Extended Analytic Hierarchy Process’ (FEAHP) method by Chang [9]. Although the first integrated Fuzzy AHP algorithm was introduced by [63], other authors presented different approaches to deal with this method, such as [64,65,66]. However, the extent analysis approach presented by [9] has become more successful, as it has a faster algorithm, requires less computational effort, and has more flexibility of practical implementation compared to the algorithms proposed by [63,64,65,66].
Chang’s method uses triangular fuzzy numbers (TFN) for the pair-wise comparison in AHP and consists of three essential parts [9]. In the first, the AHP approach is used to structure the problem into hierarchy. In the second, the fuzzy extent analysis is performed, from which normalized judgment matrices are obtained. Finally, the defuzzification and/or classification of the weights is conducted through the principle of comparing fuzzy numbers based on the degree of possibility.
Let be an object set, and be a goal set. According to the method of Chang’s extent analysis, each object is taken and extent analysis for each goal, , is performed, respectively. Therefore, m extent analysis values for each object can be obtained, with the following signs: with , where all are TFN, i.e., . The steps of Chang’s extent analysis can be given as in the following [9]:
Step 1. The fuzzy synthetic extent with respect to th object is defined as:
To obtain , the operation of fuzzy addition of the values of the extent analysis for a particular matrix is performed such that:
Also to get the fuzzy addition operator of the values is performed such that:
Then, the inverse of the calculated vector is obtained as:
Step 2. The degree of possibility of can be defined as:
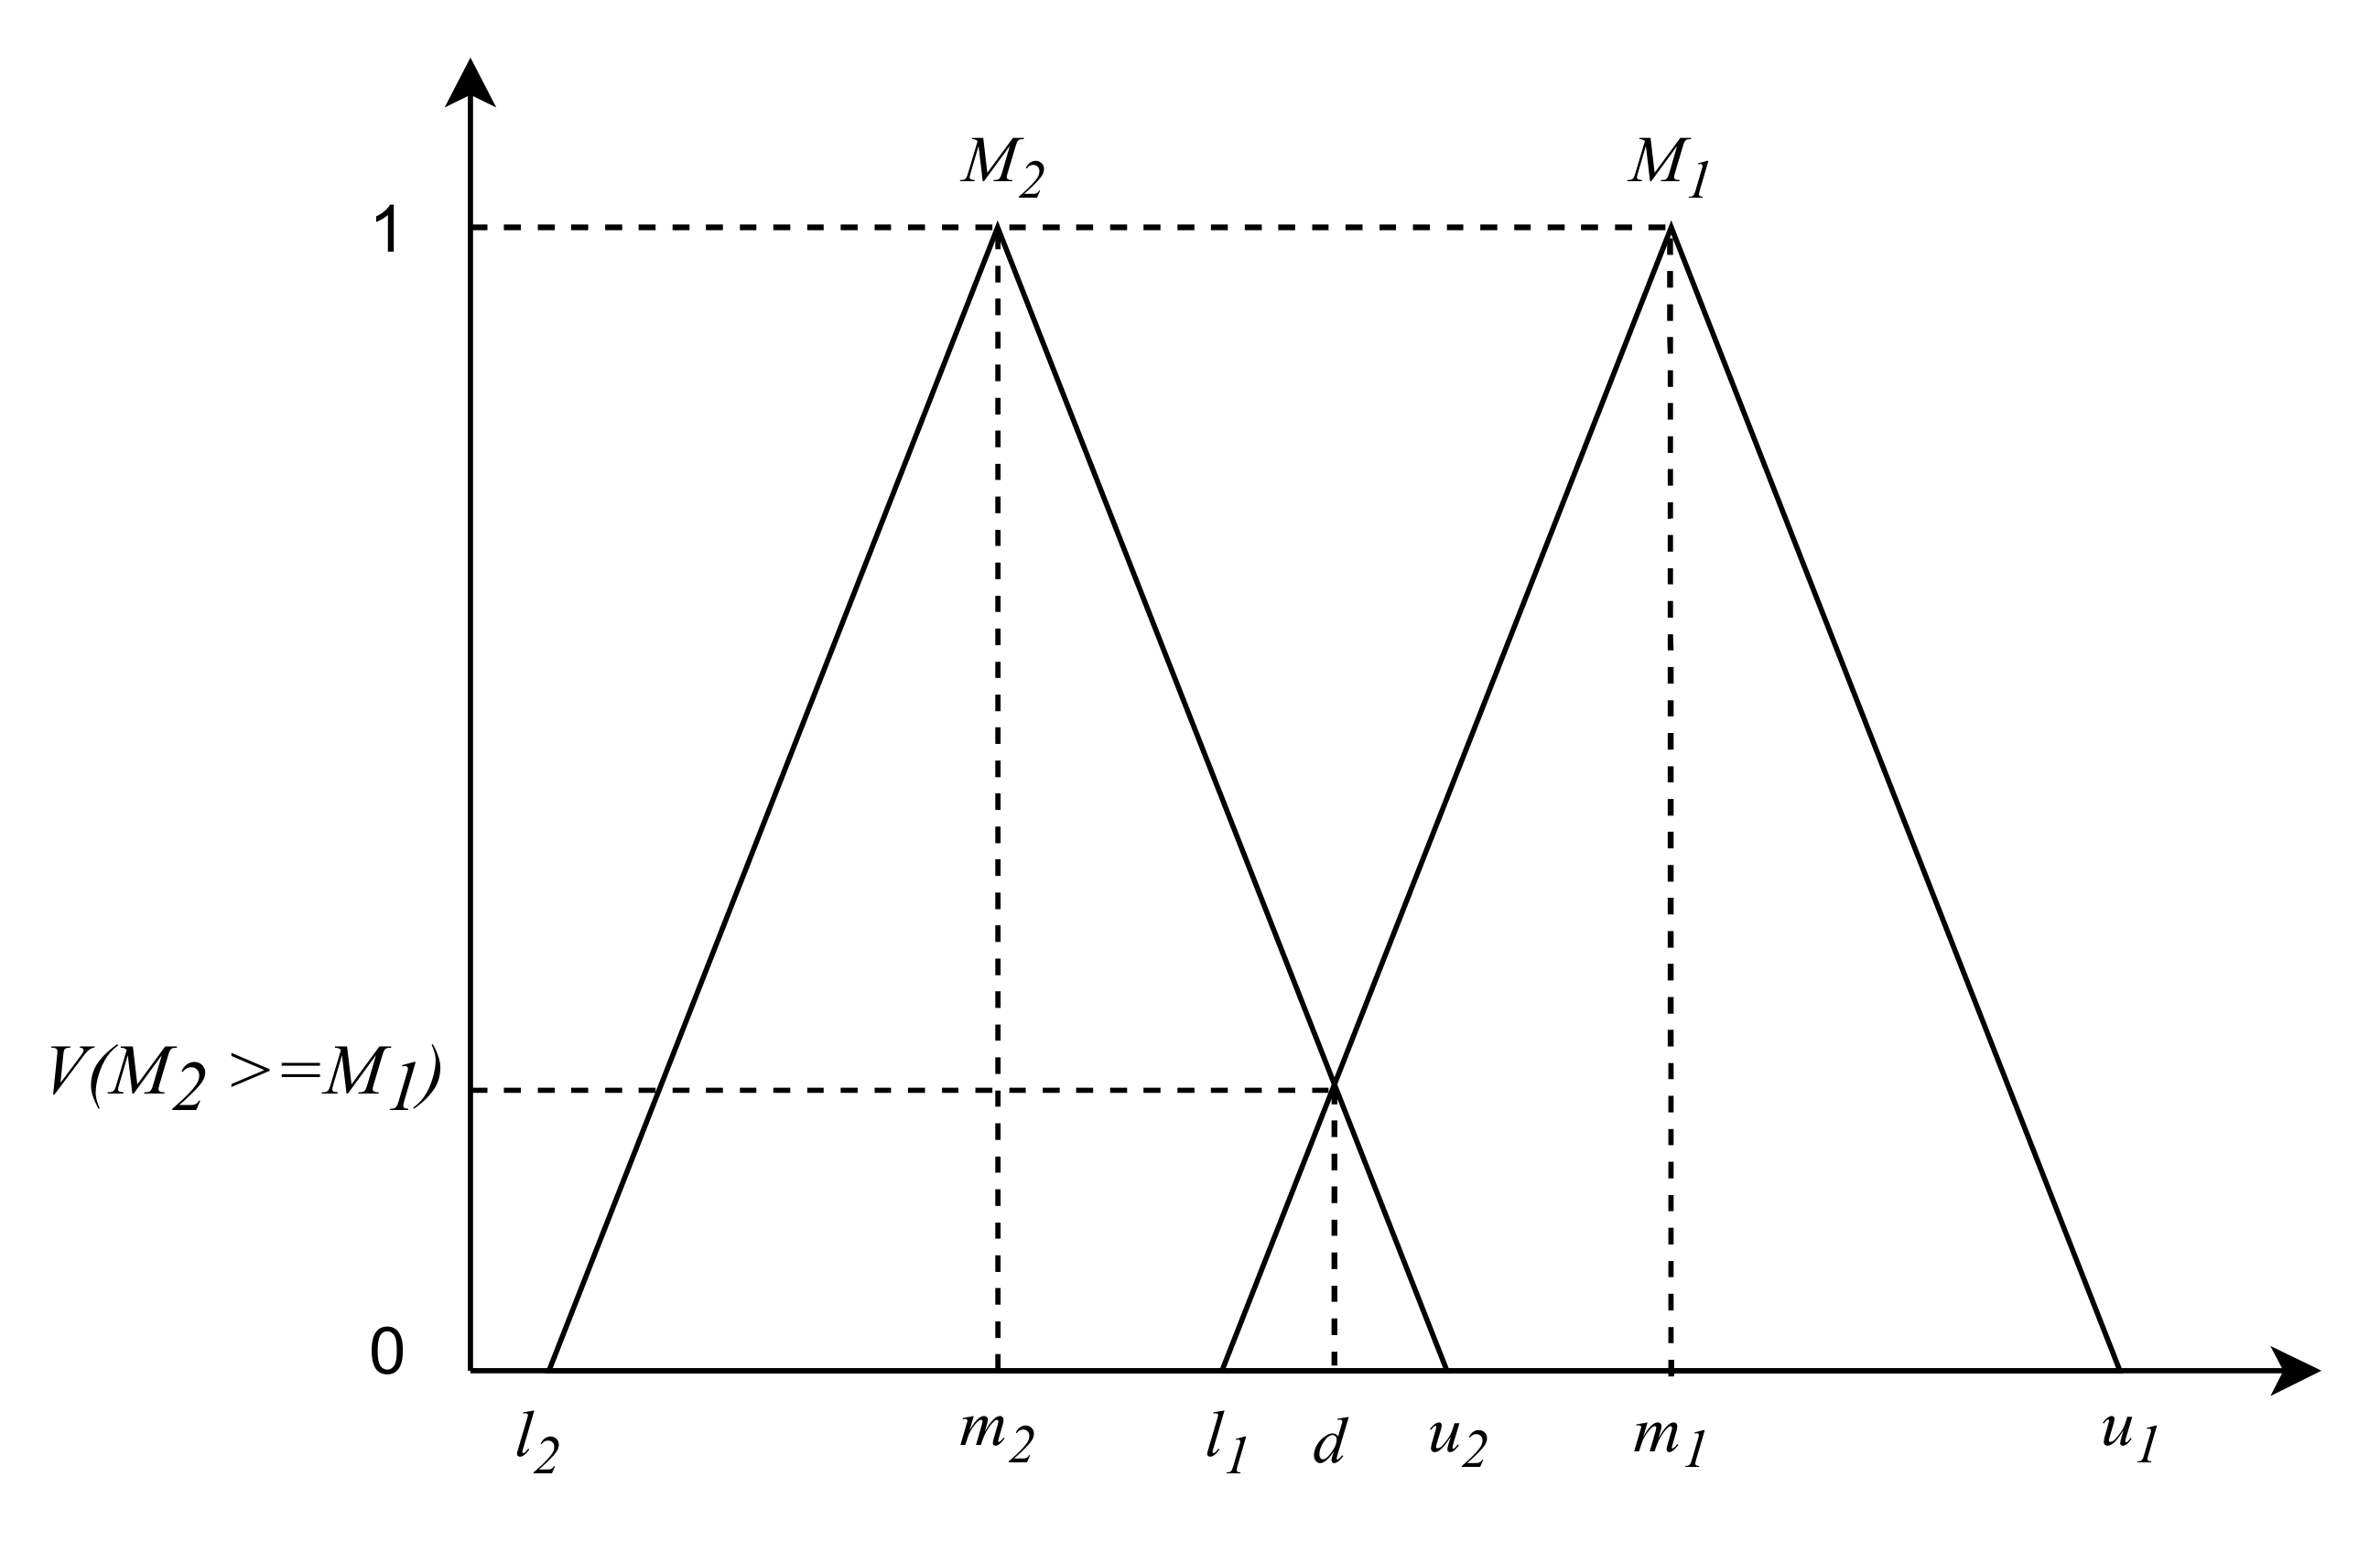
The result of Equation (5) corresponds to the point of highest intersection between and . This intersection is represented by the “point ” of Figure 1. However, to solve Equation (5), the calculations established in Equation (6) are necessary:
Step 3: The degree of possibility for a convex fuzzy number to be greater than convex fuzzy numbers can be defined by Equation (7):
Equation (8) is:
For weight vector is given by:
where are elements.
Step 4: after normalization, the normalized weight vectors are (where is a non-fuzzy number):
To automate the calculation of Chang’s FEAHP method [9], we developed a computational system, in Matlab language, in the software MATLAB 2020a, The MathWorks, Inc. This system is structured in three interactive and interdependent modules. Modules 1 and 2 represent codes called ‘functions’ and module 3 corresponds to the ‘main program’. In the execution of the developed programming, modules 1 and 2 are activated by module 3, according to the system architecture shown in Figure 2.
Module 1 converts the pair-wise evaluation/judgement matrices of the decision-maker(s) and applies the TFN concept. The results of module 1 are arranged hierarchically in module 2. Module 3 provides the system’s communication interface with the end user and is able to model the fuzzy extended analytical hierarchy of any multi-criteria decision problem, regardless of the number of variables. The interaction between the three modules of the system provides as the main output the most appropriate multi-criteria decision, i.e., the best supplier among the available supplier alternatives. If the system output meets the general decision goal, the result is approved by the decision-maker(s); otherwise, the structure of the decision problem and its data can be rectified and, consequently, reprocessed (system feedback).
4. Application of the FEAHP-Based Computing System in a Real Case of Supplier Selection Risk
Brazil’s largest independent onshore oil and natural gas exploration and production company is specialized in operating mature and/or economically marginal fields through innovative hydrocarbon recovery methodologies and efficient operating costs. The company’s long-term goal is to be the safest, most efficient, and most profitable independent onshore oil operator in Brazil. To this end, it has established in its new strategic directives a global supplier development plan, in which the problem of supplier selection should become of vital importance. However, the current supplier determination process in this company is often carried out intuitively and with weak operating procedures in terms of standardization. The company’s managers recognize that this current supplier selection practice consumes a lot of effort and time from the purchasing team, as several risks have to be considered when determining the priority supplier. Therefore, the desired global supplier development strategy of this company depends directly on the decision to select the best suppliers considering multiple criteria.
It is within this context that we applied the FEAHP-based computing system to select the best supplier for a critical component of the aforementioned company: industrial steel pipes and fittings for gas and oil pipelines. For this, we had the participation of a specialized team of five members from the purchasing and supply management area of the focal company, with an average experience of more than nine years. This team consists of a Purchasing Executive, a Purchasing Planner, a Purchasing Supervisor, and two Material Controllers.
The participation of this expert team took place through a series of brainstorming sessions and interviews. First, the consent of all experts was obtained in order to identify the main criteria and sub-criteria relevant in supplier selection considering risks. Subsequently, the consent of all experts was obtained to comparatively evaluate the predefined criteria, sub-criteria, and supplier alternatives.
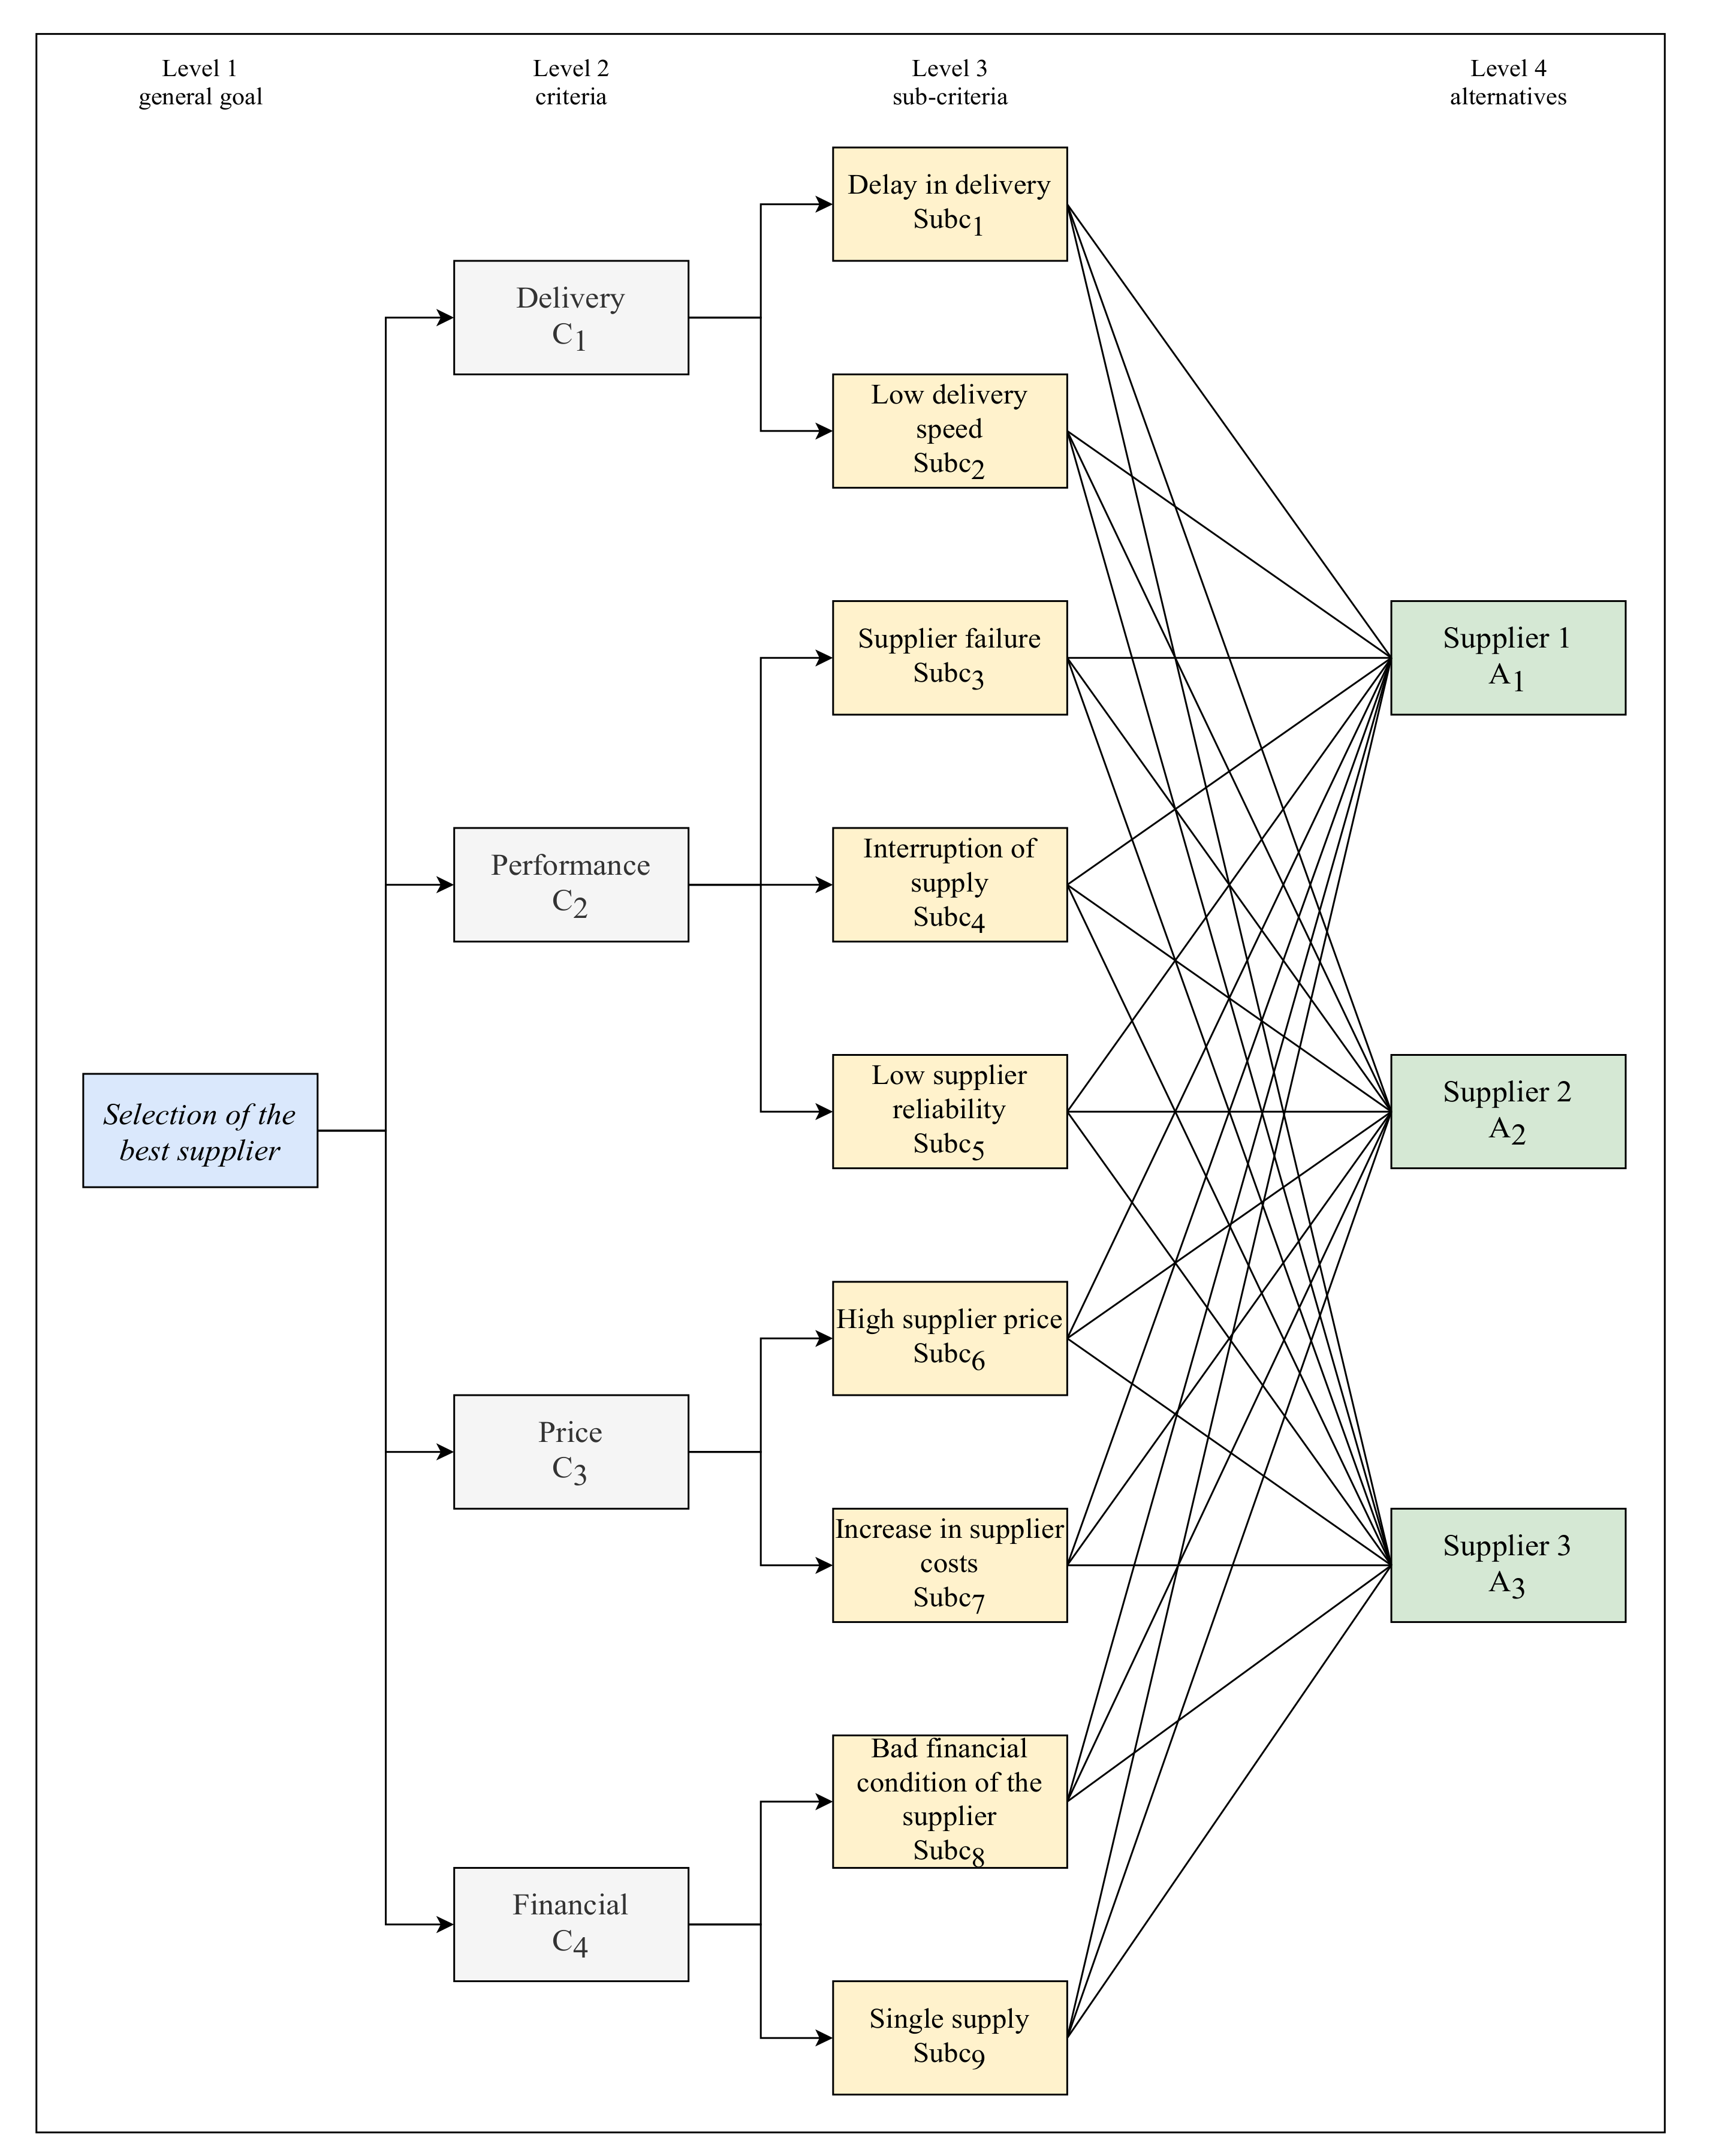
Taking the typical risk types and risk factors for most companies as a starting point, as presented in Table 1, the experts identified by consensus the following criteria () and sub-criteria () as the most important in the company’s supplier selection process: delivery (—delay in delivery; —low delivery speed), performance (—supplier failure; —interruption of supply; —low supplier reliability), price (—high supplier price; —increase in supplier costs), and financial (—bad financial condition of the supplier; —single supply that causes the buyer’s financial loss). Almost all of these criteria and sub-criteria identified by the company have already been considered in previous research of the area, with the exception of the sub-criteria and . Therefore, the specific risk factors represented by and can be considered as unique to the Brazilian oil and gas company studied.
From these criteria and sub-criteria for supplier selection, the hierarchy of the decision problem was structured, as shown in Figure 3. The alternative suppliers were identified as and . Thus, in the hierarchical structuring of the selection problem, we defined the general goal at the first level, the criteria in the second level, the sub-criteria in the third level, and the alternatives suppliers in the fourth level. After the development of the problem hierarchy, the different priority weights of each criterion, sub-criterion, and alternative supplier were calculated using the FEAHP method. The comparison of the importance of the criteria, sub-criteria, and alternative suppliers in relation to others was carried out with the help of the questionnaire applied to the focal company’s purchasing experts. The questionnaires made it easier to answer pair-wise comparison questions. The preference of one measure over another was decided consensually by the experience of the company’s experts. First, these experts compared the criteria with respect to the general goal, then, they compared the sub-criteria with respect to the main criteria. At the end, they compared the supplier in relation to each sub-criterion.
To define the different priority weights of each criterion, sub-criterion, and alternative supplier, a first fuzzy evaluation matrix was constructed by pair-wise judging the criteria in relation to the general goal, as shown in Table 3.
The values of the fuzzy synthetic extension in relation to each of the criteria were calculated using Equation (1) and the fuzzy algebraic operations defined in Equations (2)–(4), according to and :
The degree of possibility over ) was determined using Equation (6):
Using Equation (8), the minimum degree of possibility was established as:
Therefore, with Equation (9) the weight vector was given as. After the normalization process, the weight vector in relation to the decision criteria and was represented in Equation (10) as .
Subsequently, the different sub-criteria were compared separately according to each of the criteria, following the same procedure described above. As an example, the fuzzy evaluation matrix of the sub-criteria with respect to the criterion and the respective weight vectors are shown in Table 4. The fuzzy evaluation procedure of the other sub-criteria in relation to the criteria , and was the same.
Similarly, we determined the fuzzy evaluation matrices of the decision alternatives and their weight vectors in relation to the corresponding sub-criteria. As an example, we present in Table 5 the fuzzy evaluation matrix of the alternatives in relation to and their weight vectors. The fuzzy evaluation procedure of decision alternatives in relation to the other sub-criteria was also the same.
At this point, based on the values obtained, we performed the summary combination of the priority weights of the alternatives of suppliers in relation to each of the criteria. For this, the supplier’s weights were added, which were multiplied by the corresponding sub-criteria. To exemplify this procedure, we present the results of Table 6. The same conduct was carried out in the calculation of the weights of the alternatives in relation to the other sub-criteria of the criteria , and .
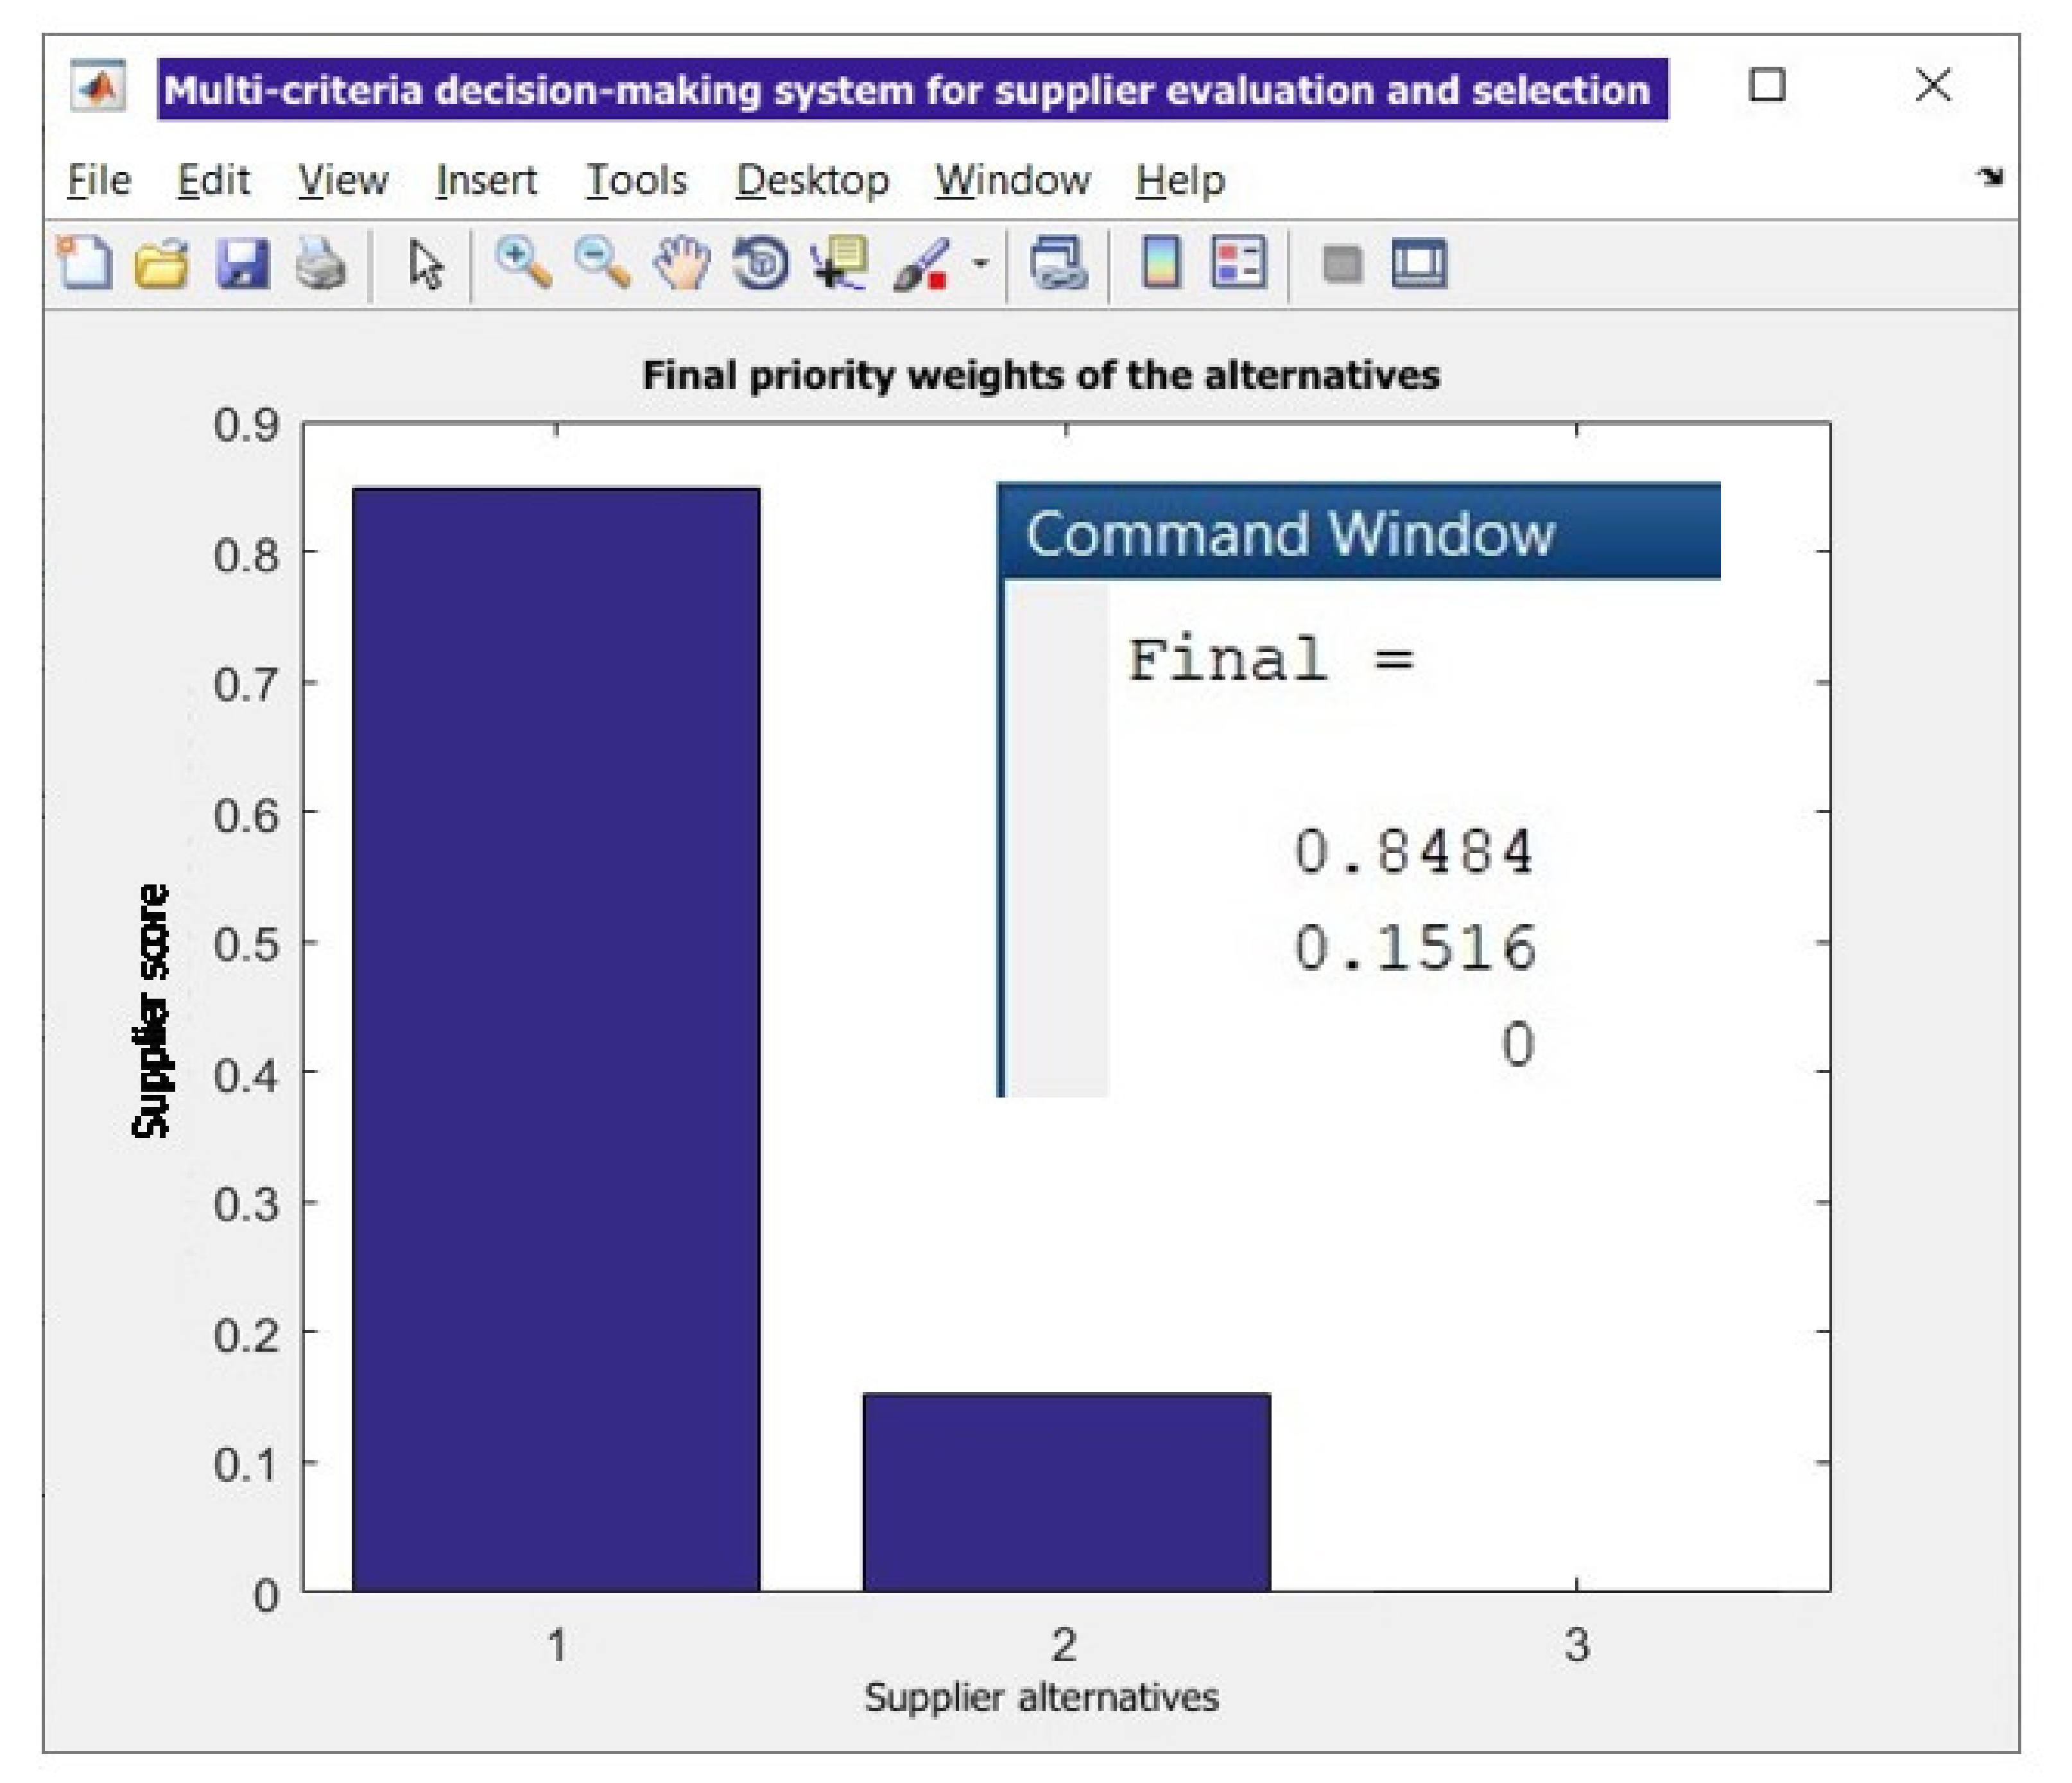
Finally, the final priority weights of each supplier were calculated by adding the supplier’s weights multiplied by the corresponding criteria weights. The alternative that obtained the highest priority weight was defined as the best supplier for the company studied. The results of this procedure are shown in Table 7.
5. Results and Discussions
According to the results of Table 7, the final priority weights of the different criteria show that the performance of the supplier has had the greatest importance. Because it is a critical supply for the addressed company, any supplier failure, interruption of supply, or low reliability of the products/services provided could affect industrial operations and the value delivered to the end customer. This result of the case experts’ evaluation corroborates the validation of performance as a key criterion for most companies’ supplier selection risk problem, as described in the previous literature review. In fact, suppliers are manufacturer’s external organizations or business partners, and indeed their performance will decide the future performance of the whole supply chain [2].
A finding that contributes to the understanding of the importance of the performance criterion is the high priority weight of one of its sub-criteria, the sub-criterion ‘low reliability of the supplier ’ (which obtained weight equal to 1). The interpretation of this result is that the component to be supplied to the focal company must strictly meet the safety and maintainability requirements intrinsic to the oil and natural gas exploration and production industry. Regarding the other sub-criteria, we found that the sub-criteria ‘high supplier price ’ and ‘single supply ’ also obtained high priority weights (weight equal to 1 for each): the first for the risk of increasing the buyer’s production and operating costs, and the second for the risk of increasing dependence with the supplier, decreasing the buyer’s bargaining strength. In addition, the fact that the sub-criterion ‘single supply ’ has not been considered in previous literature as a typical risk factor, thus proving to be unique to the company studied, allowed us to infer that certain sub-criteria common to most companies may not present typical results for other companies, as evidenced in the case studied.
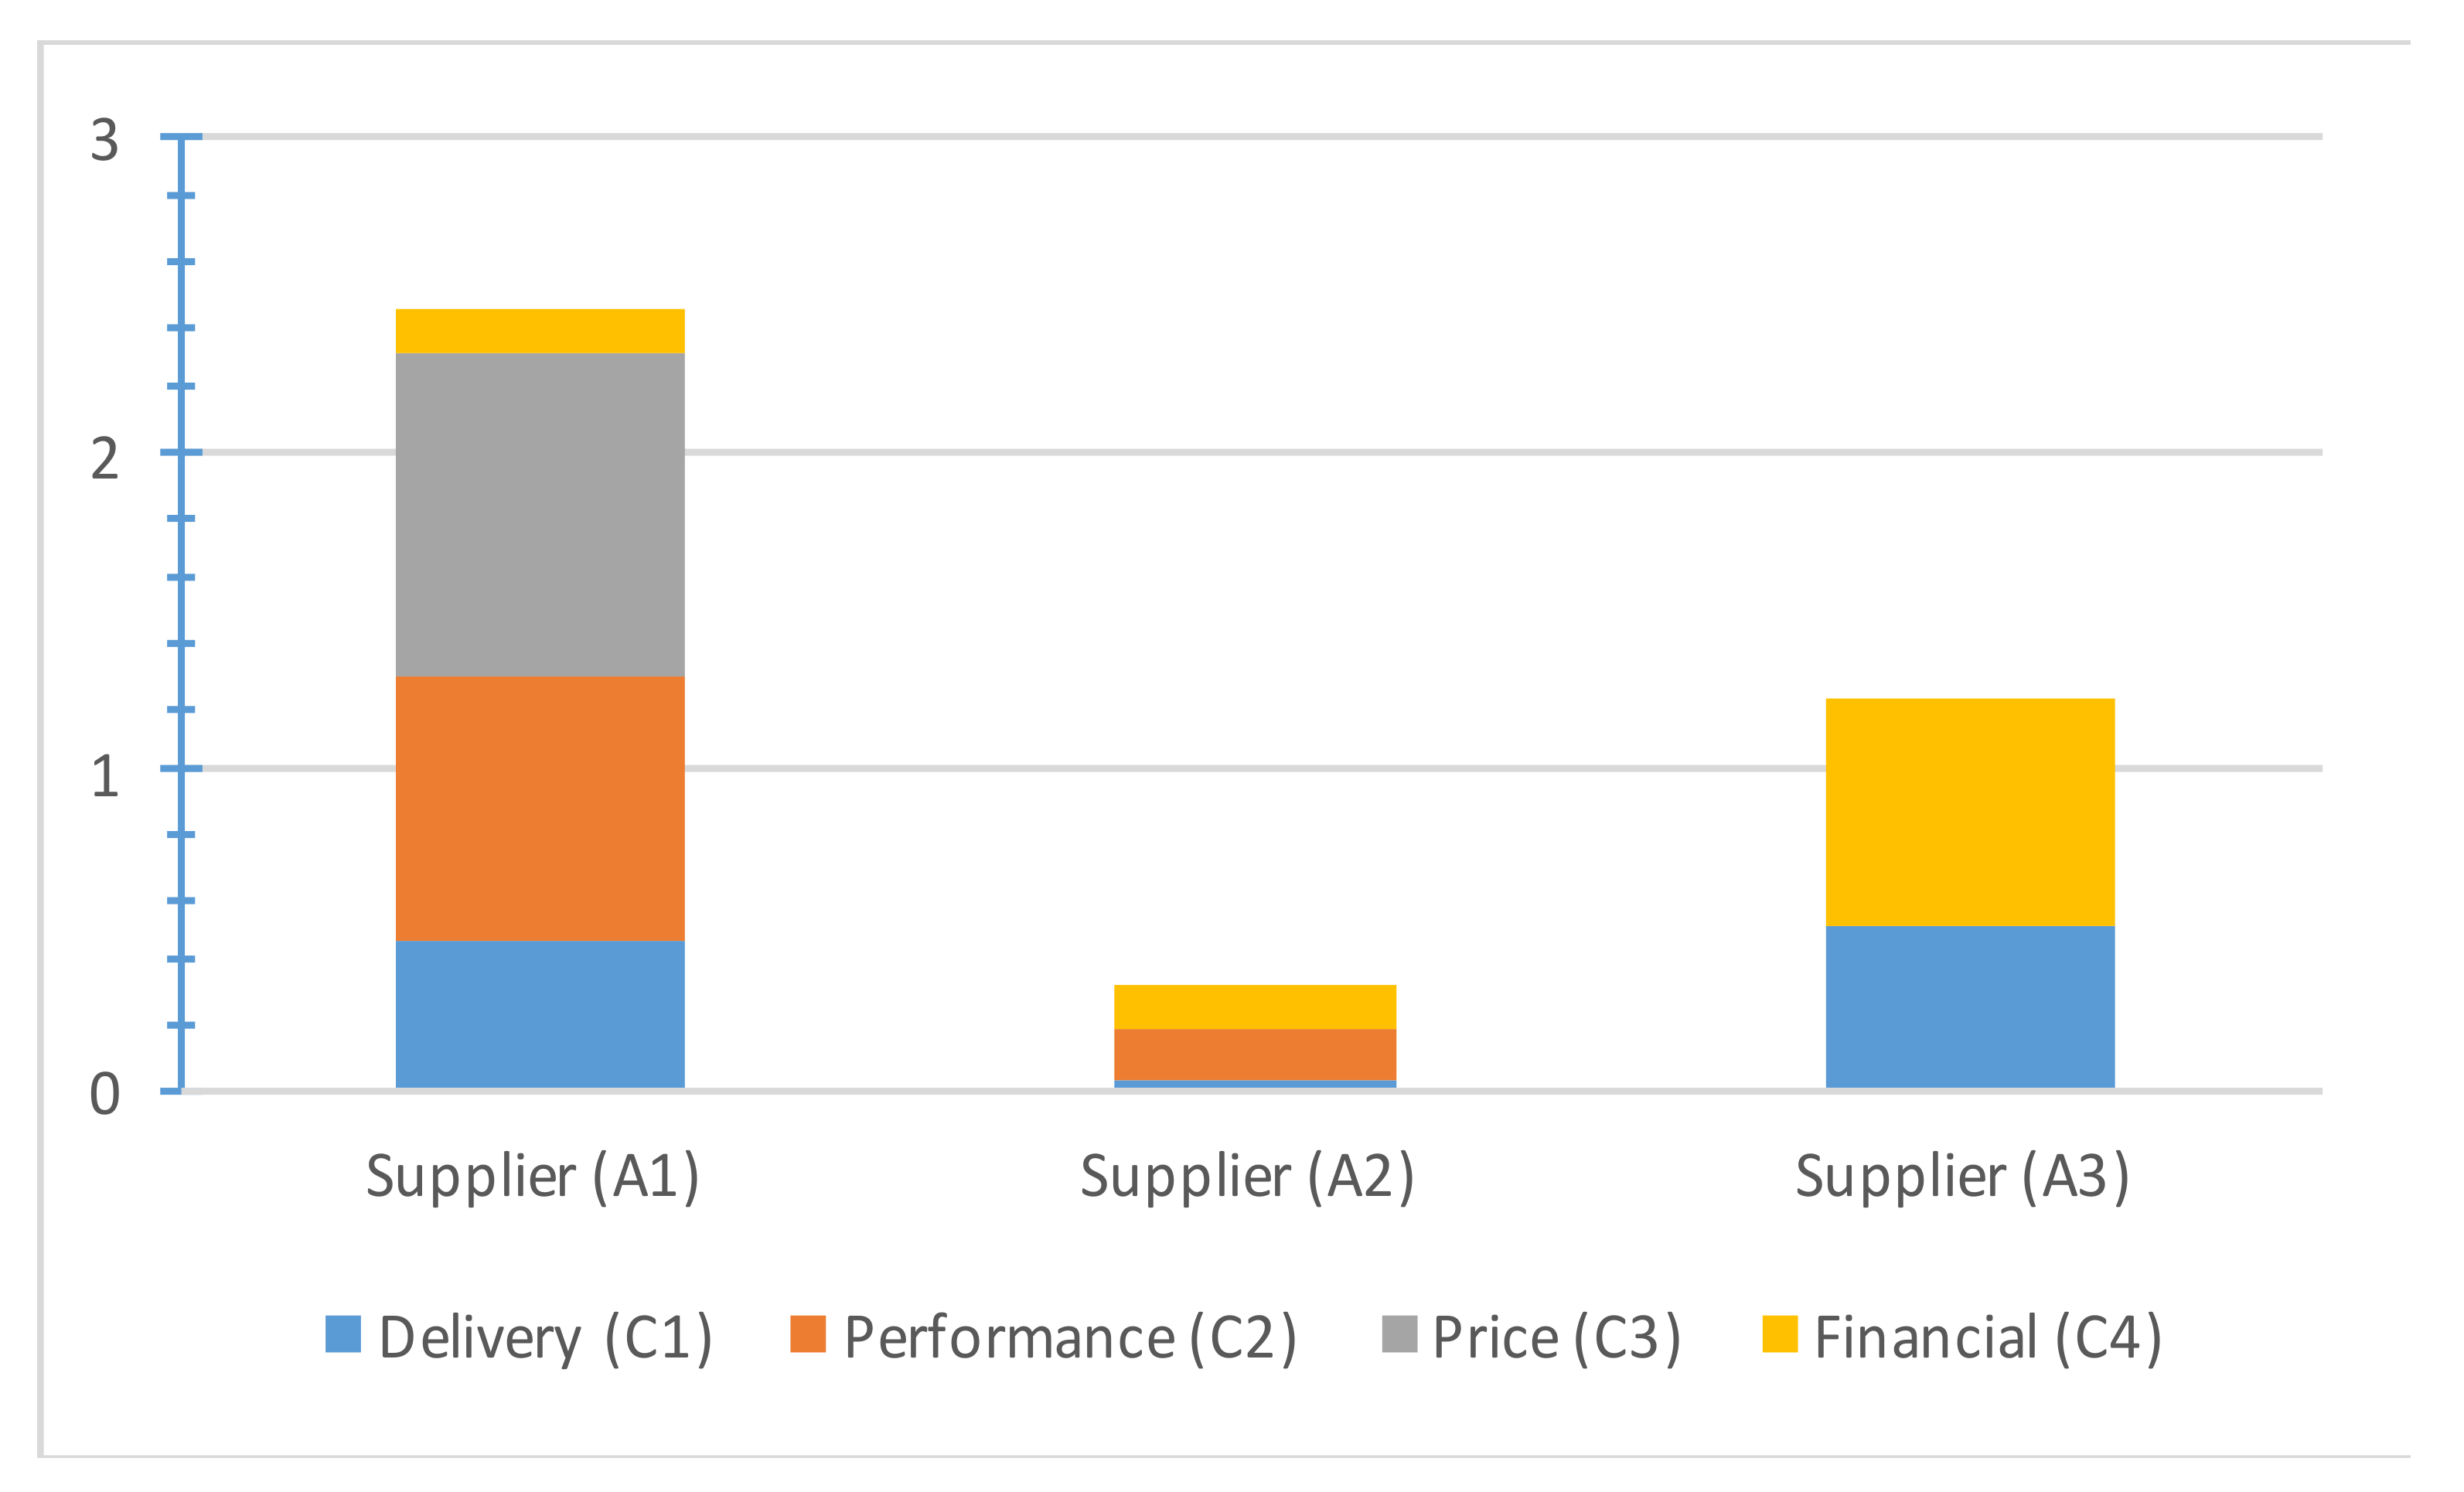
Figure 5 shows the sensitivity analysis graph in relation to the general goal, in which it is possible to evaluate suppliers in relation to each of the four criteria. It is clear to note that supplier has a higher priority weight in relation to the delivery and financial criteria, while supplier has a higher weight in relation to the performance and price criteria. Therefore, sensitivity analysis confirms as the best alternative supplier for the focal company.
Finally, we found that the developed computing system adequately supported all the calculation steps of the FEAHP method applied in the real process of supplier selection considering risks. It provided efficient decision problem hierarchy modeling, computed fuzzy extended analysis without failures and/or errors, and provided final priority weight rankings of all evaluated criteria, sub-criteria, and alternatives. The adoption of this computational system allowed automated decision-making support to choose the best supplier for the focal company in a rational, flexible, and agile way. By applying the FEAHP computational approach, the company’s experts have qualitatively perceived a one-off decrease in the effort and time normally required to select a priority supplier. This allowed us to hypothesize that the continued use of the new system by the studied company can promote the improvement of the overall supplier risk evaluation, the reduction of lead time and procurement costs for industrial materials and equipment, and an improved performance of the whole supply chain.
6. Conclusions, Limitations and Future Work
Supplier risks have attracted significant attention in the supply chain risk management literature. However, the literature on the problem of supplier selection risks is limited. In addition, there is insufficient research on the computational model for supplier selection considering risks and its feasibility of practical implementation in real operating and manufacturing environments. Therefore, this study proposes a new computational system based on the ‘Fuzzy Extended Analytic Hierarchy Process (FEAHP)’ method for the selection of suppliers considering risks. We seek to evaluate the opportunities and limitations of using the FEAHP method in the supplier selection considering the risks and analyze the support of the system developed through the real case of a Brazilian oil and natural gas company.
The computational approach based on FEAHP automates the selection of suppliers considering risks by determining a hierarchy of criteria, sub-criteria, and alternatives. First, the criteria and sub-criteria specific to the selection problem were identified by the focal company’s decision-makers (experts) using relevant literature as a starting point. Next, the experts performed a pair-wise comparison of the predefined requirements using a linguistically scaled questionnaire. This evaluation was then quantified by calculating the priority weights of criteria, sub-criteria, and alternatives using the FEAHP method. The best decision alternative is the one with the highest final score.
We applied the FEAHP computer system to support supplier selection considering risks of a Brazilian oil and natural gas company. The experts identified four criteria, nine sub-criteria, and three alternative suppliers as the most important in the company’s supplier selection process. After the general computation of the final priority weighs, we found that the supplier’s performance criterion is the most important one. This finding is aligned with previous literature in the field which also considers performance as a key criterion regarding supplier selection risks for most companies. The sub-criteria ‘low reliability of the supplier ’, ‘high supplier price ’, and ‘single supply ’ obtained the highest priority weights. In turn, the sub-criterion ‘single supply ’ presented unique importance for the company studied, distinguishing itself from the other sub-criteria typical of most companies. Supplier is the best supplier for the focal company as it obtained the highest priority weight (0.848), followed by alternative supplier (0.151). The sensitivity analysis of the general goal shows that the supplier has the highest priority weight in relation to the criteria performance and price , confirming it as the best alternative for the studied company.
The FEAHP computational approach rationally, flexibly, and agilely automated the supplier selection process, as qualitatively evidenced by the case study experts. From this, we hypothesized that using this system can provide helpful insights in choosing the best suppliers in an environment of risk and uncertainty, maximizing supply chain performance. This research has some limitations. Since the empirical analysis is based only on a case study of a Brazilian oil company, there are restrictions in generalizing the results, that is, the conclusions of the paper cannot be extended to other companies. In addition, the methodology for evaluating the main criteria, sub-criteria, and alternative suppliers is based on the experience of the company’s experts, so there may be noise and distortion in the respondents’ perception of the accuracy of the information provided.
Future research may examine a larger set of business samples, including various industry types or empirical research in other developing countries. In addition, risk and uncertainty criteria from various supply chain echelons as well as emerging social and environmental risk criteria may be added to the proposed model. Finally, further work can be done to analyze the economic efficiency of the FEAHP computational approach, and to compare or integrate it with alternative supplier selection methods based on MCDM, MP, and AI.
Author Contributions
Conceptualization, M.V.C.F., B.H. and F.G.M.F.; methodology, M.V.C.F. and F.G.M.F.; programming and software development, M.V.C.F.; data collection and analysis, M.V.C.F.; writing and revision, M.V.C.F., B.H. and F.G.M.F. All authors have read and agreed to the published version of the manuscript.
Funding
This research received no external funding.
Institutional Review Board Statement
This study did not require ethical review and approval according to the norms of the Graduate Program in Industrial Engineering at the Federal University of Bahia, Brazil.
Informed Consent Statement
Informed consent was obtained from all subjects involved in the study.
Data Availability Statement
The data presented in this study are available within the article.
Acknowledgments
We appreciate the valuable contributions of researchers from the Chair for Information Systems and Supply Chain Management, Department of Information Systems at the Münster School of Business and Economics, University of Münster, Germany.
Conflicts of Interest
The authors declare no conflict of interest.
References
- Yoon, J.; Talluri, S.; Yildiz, H.; Ho, W. Models for supplier selection and risk mitigation: A holistic approach. Int. J. Prod. Res. 2018, 56, 3636–3661. [Google Scholar] [CrossRef]
- Chan, F.T.S.; Kumar, N. Global supplier development considering risk factors using fuzzy extended AHP-based approach. Omega 2007, 35, 417–431. [Google Scholar] [CrossRef]
- Lima Junior, F.R.; Osiro, L.; Carpinetti, L.C.R. Multicriteria decision methods for supplier selection: A literature review on the state of the art. Gest. Prod. 2013, 20, 781–801. [Google Scholar] [CrossRef]
- Kahraman, C. Multi-criteria decision making methods and Fuzzy sets. In Fuzzy Multicriteria Decision Making: Theory and Applications with Recent Development, 1st ed.; Kahraman, C., Ed.; Springer US: Istanbul, Turkey, 2008; Volume 1, pp. 1–18. Available online: https://0-www-springer-com.brum.beds.ac.uk/gp/book/9780387768120 (accessed on 11 December 2020).
- Saaty, T.L. The Analytic Hierarchy Process; McGraw-Hill: New York, NY, USA, 1980. [Google Scholar]
- Yadav, V.; Sharma, M.K. Multi-criteria decision making for supplier selection using fuzzy AHP approach. Benchmarking Int. J. 2015, 22, 1158–1174. [Google Scholar] [CrossRef]
- Zadeh, L.A. Fuzzy sets. Inf. Control 1965, 8, 338–353. [Google Scholar] [CrossRef] [Green Version]
- Zapa, E.; Cogollo, J. Fuzzy-BSC Methodology for Decision Making in Indemnity Area of Insurance Companies. IEEE Latam Trans. 2018, 16, 2539–2546. [Google Scholar] [CrossRef]
- Chang, D.Y. Applications of the Extent Analysis Method on Fuzzy AHP. Eur. J. Oper. Res. 1996, 95, 649–655. [Google Scholar] [CrossRef]
- Sheffi, Y. Supply chain management under the threat of international terrorism. Int. J. Logist. Manag. 2001, 12, 1–11. [Google Scholar] [CrossRef]
- Jüttner, U.; Peck, H.; Christopher, M. Supply chain risk management: Outlining an agenda for future research. Int. J. Logist. Res. Appl. 2003, 6, 197–210. [Google Scholar] [CrossRef] [Green Version]
- Stecke, K.E.; Kumar, S. Sources of Supply Chain Disruptions, Factors That Breed Vulnerability, and Mitigating Strategies. J. Mark. Channels 2009, 16, 193–226. [Google Scholar] [CrossRef]
- Fahimnia, B.; Tang, C.S.; Davarzani, H.; Sarkis, J. Quantitative models for managing supply chain risks: A review. Eur. J. Oper. Res. 2015, 247, 1–15. [Google Scholar] [CrossRef]
- Tang, C.S. Perspectives in supply chain risk management. Int. J. Prod. Econ. 2006, 103, 451–488. [Google Scholar] [CrossRef]
- Peck, H. Reconciling supply chain vulnerability, risk and supply chain management. Int. J. Logist. Res. Appl. 2006, 9, 127–142. [Google Scholar] [CrossRef]
- Faisal, M.N.; Banwet, D.K.; Shankar, R. Quantification of risk mitigation environment of supply chains using graph theory and matrix methods. Eur. J. Ind. Eng. 2007, 1, 22–39. [Google Scholar] [CrossRef]
- Wagner, S.; Bode, C. An empirical examination of supply chain performance along several dimensions of risk. J. Bus. Logist. 2008, 29, 307. [Google Scholar] [CrossRef]
- Ho, W.; Zheng, T.; Yildiz, H.; Talluri, S. Supply chain risk management: A literature review. Int. J. Prod. Res. 2015, 53, 5031–5069. [Google Scholar] [CrossRef]
- Aqlan, F.; Lam, S.S. Supply chain optimization under risk and uncertainty: A case study for high-end server manufacturing. Comput. Ind. Eng. 2016, 93, 78–87. [Google Scholar] [CrossRef]
- Bugert, N.; Lasch, R. Supply chain disruption models: A critical review. Logist. Res. 2018, 11, 1–35. [Google Scholar] [CrossRef]
- Fan, Y.; Stevenson, M. A review of supply chain risk management: Definition, theory, and research agenda. Int. J. Phys. Distr. Logist. Manag. 2018, 48, 205–230. [Google Scholar] [CrossRef] [Green Version]
- Oliveira, J.B.; Jin, M.; Lima, R.S.; Kobza, J.E.; Montevechi, J.A.B. The role of simulation and optimization methods in supply chain risk management: Performance and review standpoints. Simul. Model. Pract. Theory 2019, 92, 17–44. [Google Scholar] [CrossRef]
- Smeltzer, L.R.; Siferd, S.P. Proactive Supply Management: The Management of Risk. Int. J. Purch. Mater. Manag. 1998, 34, 38–45. [Google Scholar] [CrossRef]
- Tomlin, B. On the Value of Mitigation and Contingency Strategies for Managing Supply Chain Disruption Risks. Manag. Sci. 2006, 52, 639–657. [Google Scholar] [CrossRef] [Green Version]
- Chopra, S.; Reinhardt, G.; Mohan, U. The Importance of Decoupling Recurrent and Disruption Risks in a Supply Chain. Nav. Res. Logist. 2007, 54, 544–555. [Google Scholar] [CrossRef] [Green Version]
- Talluri, S.; Narasimhan, R. Vendor Evaluation with Performance Variability: A Max–Min Approach. Eur. J. Oper. Res. 2003, 146, 543–552. [Google Scholar] [CrossRef]
- Talluri, S.; Narasimhan, R.; Nair, A. Vendor Performance with Supply Risk: A Chance-constrained DEA Approach. Int. J. Prod. Econ. 2006, 100, 212–222. [Google Scholar] [CrossRef]
- Fang, C.; Liao, X.; Xie, M. A Hybrid Risks-informed Approach for the Selection of Supplier Portfolio. Int. J. Prod. Res. 2016, 54, 2019–2034. [Google Scholar] [CrossRef]
- Er Kara, M.; Fırat, S.Ü.O. Supplier Risk Assessment Based on Best-Worst Method and K-Means Clustering: A Case Study. Sustainability 2018, 10, 1066. [Google Scholar] [CrossRef] [Green Version]
- Micheli, G.J.L.; Cagno, E.; Zorzini, M. Supply risk management vs supplier selection to manage the supply risk in the EPC supply chain. Manag. Res. News 2008, 31, 846–866. [Google Scholar] [CrossRef]
- Kumar, M.; Vrat, P.; Shankar, R. A Fuzzy Programming Approach for Vendor Selection Problem in a Supply Chain. Int. J. Prod. Econ. 2006, 101, 273–285. [Google Scholar] [CrossRef]
- Viswanadham, N.; Samvedi, A. Supplier Selection Based on Supply Chain Ecosystem, Performance and Risk Criteria. Int. J. Prod. Res. 2013, 51, 6484–6498. [Google Scholar] [CrossRef]
- Kull, T.J.; Talluri, S. A Supply Risk Reduction Model Using Integrated Multicriteria Decision Making. IEEE Trans. Eng. Manag. 2008, 55, 409–419. [Google Scholar] [CrossRef]
- Ravindran, A.R.; Bilsel, R.U.; Wadhwa, V.; Yang, T. Risk Adjusted Multicriteria Supplier Selection Models with Applications. Int. J. Prod. Res. 2010, 48, 405–424. [Google Scholar] [CrossRef]
- Ruiz-Torres, A.J.; Mahmoodi, F.; Zeng, A.Z. Supplier Selection Model with Contingency Planning for Supplier Failures. Comput. Ind. Eng. 2013, 66, 374–382. [Google Scholar] [CrossRef]
- Chaudhuri, A.; Mohanty, B.K.; Singh, K.N. Supply Chain Risk Assessment during New Product Development: A Group Decision Making Approach Using Numeric and Linguistic Data. Int. J. Prod. Res. 2013, 51, 2790–2804. [Google Scholar] [CrossRef]
- Lee, A.H.I. A fuzzy supplier selection model with the consideration of benefits, opportunities, costs and risks. Expert Syst. Appl. 2009, 36, 2879–2893. [Google Scholar] [CrossRef]
- Wu, D.D.; Olson, D. Enterprise Risk Management: A DEA VaR Approach in Vendor Selection. Int. J. Prod. Res. 2010, 48, 4919–4932. [Google Scholar] [CrossRef]
- Meena, P.; Sarmah, S.; Sarkar, A. Sourcing Decisions under Risks of Catastrophic Event Disruptions. Transp. Res. Part E Logist. Transp. Rev. 2011, 47, 1058–1074. [Google Scholar] [CrossRef]
- Sawik, T. Joint Supplier Selection and Scheduling of Customer Orders under Disruption Risks: Single vs. Dual Sourcing. Omega 2014, 43, 83–95. [Google Scholar] [CrossRef]
- Wu, Z.; Choi, T.Y.; Rungtusanatham, M.J. Supplier–supplier Relationships in Buyer–supplier–supplier Triads: Implications for Supplier Performance. J. Oper. Manag. 2010, 28, 115–123. [Google Scholar] [CrossRef]
- Chen, P.-S.; Wu, M.-T. A Modified Failure Mode and Effects Analysis Method for Supplier Selection Problems in the Supply Chain Risk Environment: A Case Study. Comput. Ind. Eng. 2013, 66, 634–642. [Google Scholar] [CrossRef]
- Jharkharia, S.; Shankar, R. Selection of logistics service provider: An analytic network process ANP approach. Omega Int. J. Manag. 2007, 35, 274–289. [Google Scholar] [CrossRef]
- Rao, C.; Xiao, X.; Goh, M.; Zheng, J.; Wen, J. Compound Mechanism Design of Supplier Selection Based on Multi-attribute Auction and Risk Management of Supply Chain. Comput. Ind. Eng. 2017, 105, 63–75. [Google Scholar] [CrossRef]
- Lockamy, A., III; McCormack, K. Analysing Risks in Supply Networks to Facilitate Outsourcing Decisions. Int. J. Prod. Res. 2010, 48, 593–611. [Google Scholar] [CrossRef] [Green Version]
- Moghaddam, K.S. Supplier Selection and Order Allocation in Closed-loop Supply Chain Systems Using Hybrid Monte Carlo Simulation and Goal Programming. Int. J. Prod. Res. 2015, 53, 6320–6338. [Google Scholar] [CrossRef]
- Jain, N.; Singh, A.R. Sustainable supplier selection under must-be criteria through Fuzzy inference system. J. Clean. Prod. 2020, 248, 119275. [Google Scholar] [CrossRef]
- Yazdani, M.; Chatterjee, P.; Pamucar, D.; Abad, M.D. A risk-based integrated decision-making model for green supplier selection: A case study of a construction company in Spain. Kybernetes 2019, 49, 1229–1252. [Google Scholar] [CrossRef]
- Zimmer, K.; Fröhling, M.; Breun, P.; Schultmann, F. Assessing social risks of global supply chains: A quantitative analytical approach and its application to supplier selection in the German automotive industry. J. Clean. Prod. 2017, 149, 96–109. [Google Scholar] [CrossRef]
- Chai, J.; Liu, J.N.K.; Ngai, E.W.T. Application of decision-making techniques in supplier selection: A systematic review of literature. Expert Syst. Appl. 2013, 40, 3872–3885. [Google Scholar] [CrossRef]
- Zimmer, K.; Fröhling, M.; Schultmann, F. Sustainable supplier management—A review of models supporting sustainable supplier selection, monitoring and development. Int. J. Prod. Res. 2016, 54, 1412–1442. [Google Scholar] [CrossRef]
- Konys, A. Green Supplier Selection Criteria: From a Literature Review to a Comprehensive Knowledge Base. Sustainability 2019, 11, 4208. [Google Scholar] [CrossRef] [Green Version]
- Chai, J.; Ngai, E.W.T. Decision-making techniques in supplier selection: Recent accomplishments and what lies ahead. Exp. Syst. Appl. 2020, 140, 112903. [Google Scholar] [CrossRef]
- Kafa, N.; Jaegler, A.; Sarkis, J. Harnessing Corporate Sustainability Decision-Making Complexity: A Field Study of Complementary Approaches. Sustainability 2020, 12, 10584. [Google Scholar] [CrossRef]
- Ahmed, F.; Kilic, K. Fuzzy Analytic Hierarchy Process: A performance analysis of various algorithms. Fuzzy Sets Syst. 2019, 362, 110–128. [Google Scholar] [CrossRef]
- Cerqueira, T.L.; Bertoni, F.C.; Pires, M.G. Instance Genetic Selection for Fuzzy Rule-based Systems Optimization to Opinion Classification. IEEE Latam Trans. 2020, 18, 1215–1221. [Google Scholar] [CrossRef]
- Chan, F.T.S.; Chan, H.K. An AHP model for selection of suppliers in the fast changing fashion market. Int. J. Adv. Manuf. Technol. 2010, 51, 1195–1207. [Google Scholar] [CrossRef]
- Kumar, J.; Roy, N. Analytic hierarchy process (AHP) for a power transmission industry to vendor selection decisions. Int. J. Comput. Appl. 2011, 12, 26–30. [Google Scholar] [CrossRef]
- Bruno, G.; Esposito, E.; Genovese, A.; Passaro, R. AHP-based approaches for supplier evaluation: Problems and perspectives. J. Purch. Supply Manag. 2012, 18, 159–172. [Google Scholar] [CrossRef]
- Yu, M.C.; Goh, M.; Lin, H.C. Fuzzy multi-objective vendor selection under lean procurement. Eur. J. Oper. Res. 2012, 219, 305–311. [Google Scholar] [CrossRef]
- Rezaei, J.; Ortt, R. Multi-criteria supplier segmentation using a fuzzy preference relations based AHP. Eur. J. Oper. Res. 2013, 225, 75–84. [Google Scholar] [CrossRef]
- Awasthi, A.; Govindan, K.; Gold, S. Multi-tier sustainable global supplier selection using a fuzzy AHP-VIKOR based approach. Int. J. Prod. Econ. 2018, 195, 106–117. [Google Scholar] [CrossRef] [Green Version]
- Van Laarhoven, P.; Pedrycz, W. A fuzzy extension of Saaty’s priority theory. Fuzzy Sets Syst. 1983, 11, 199–227. [Google Scholar] [CrossRef]
- Buckley, J.J. Fuzzy hierarchical analysis. Fuzzy Sets Syst. 1985, 17, 233–247. [Google Scholar] [CrossRef]
- Boender, C.; De Graan, J.; Lootsma, F. Multi-criteria decision analysis with fuzzy pairwise comparisons. Fuzzy Sets Syst. 1989, 29, 133–143. [Google Scholar] [CrossRef]
- Wang, Y.-M.; Luo, Y.; Hua, Z. On the extent analysis method for fuzzy AHP and its applications. Eur. J. Oper. Res. 2008, 186, 735–747. [Google Scholar] [CrossRef]
Figure 1.
Intersection between and .

Figure 2.
Architecture computational system proposed.
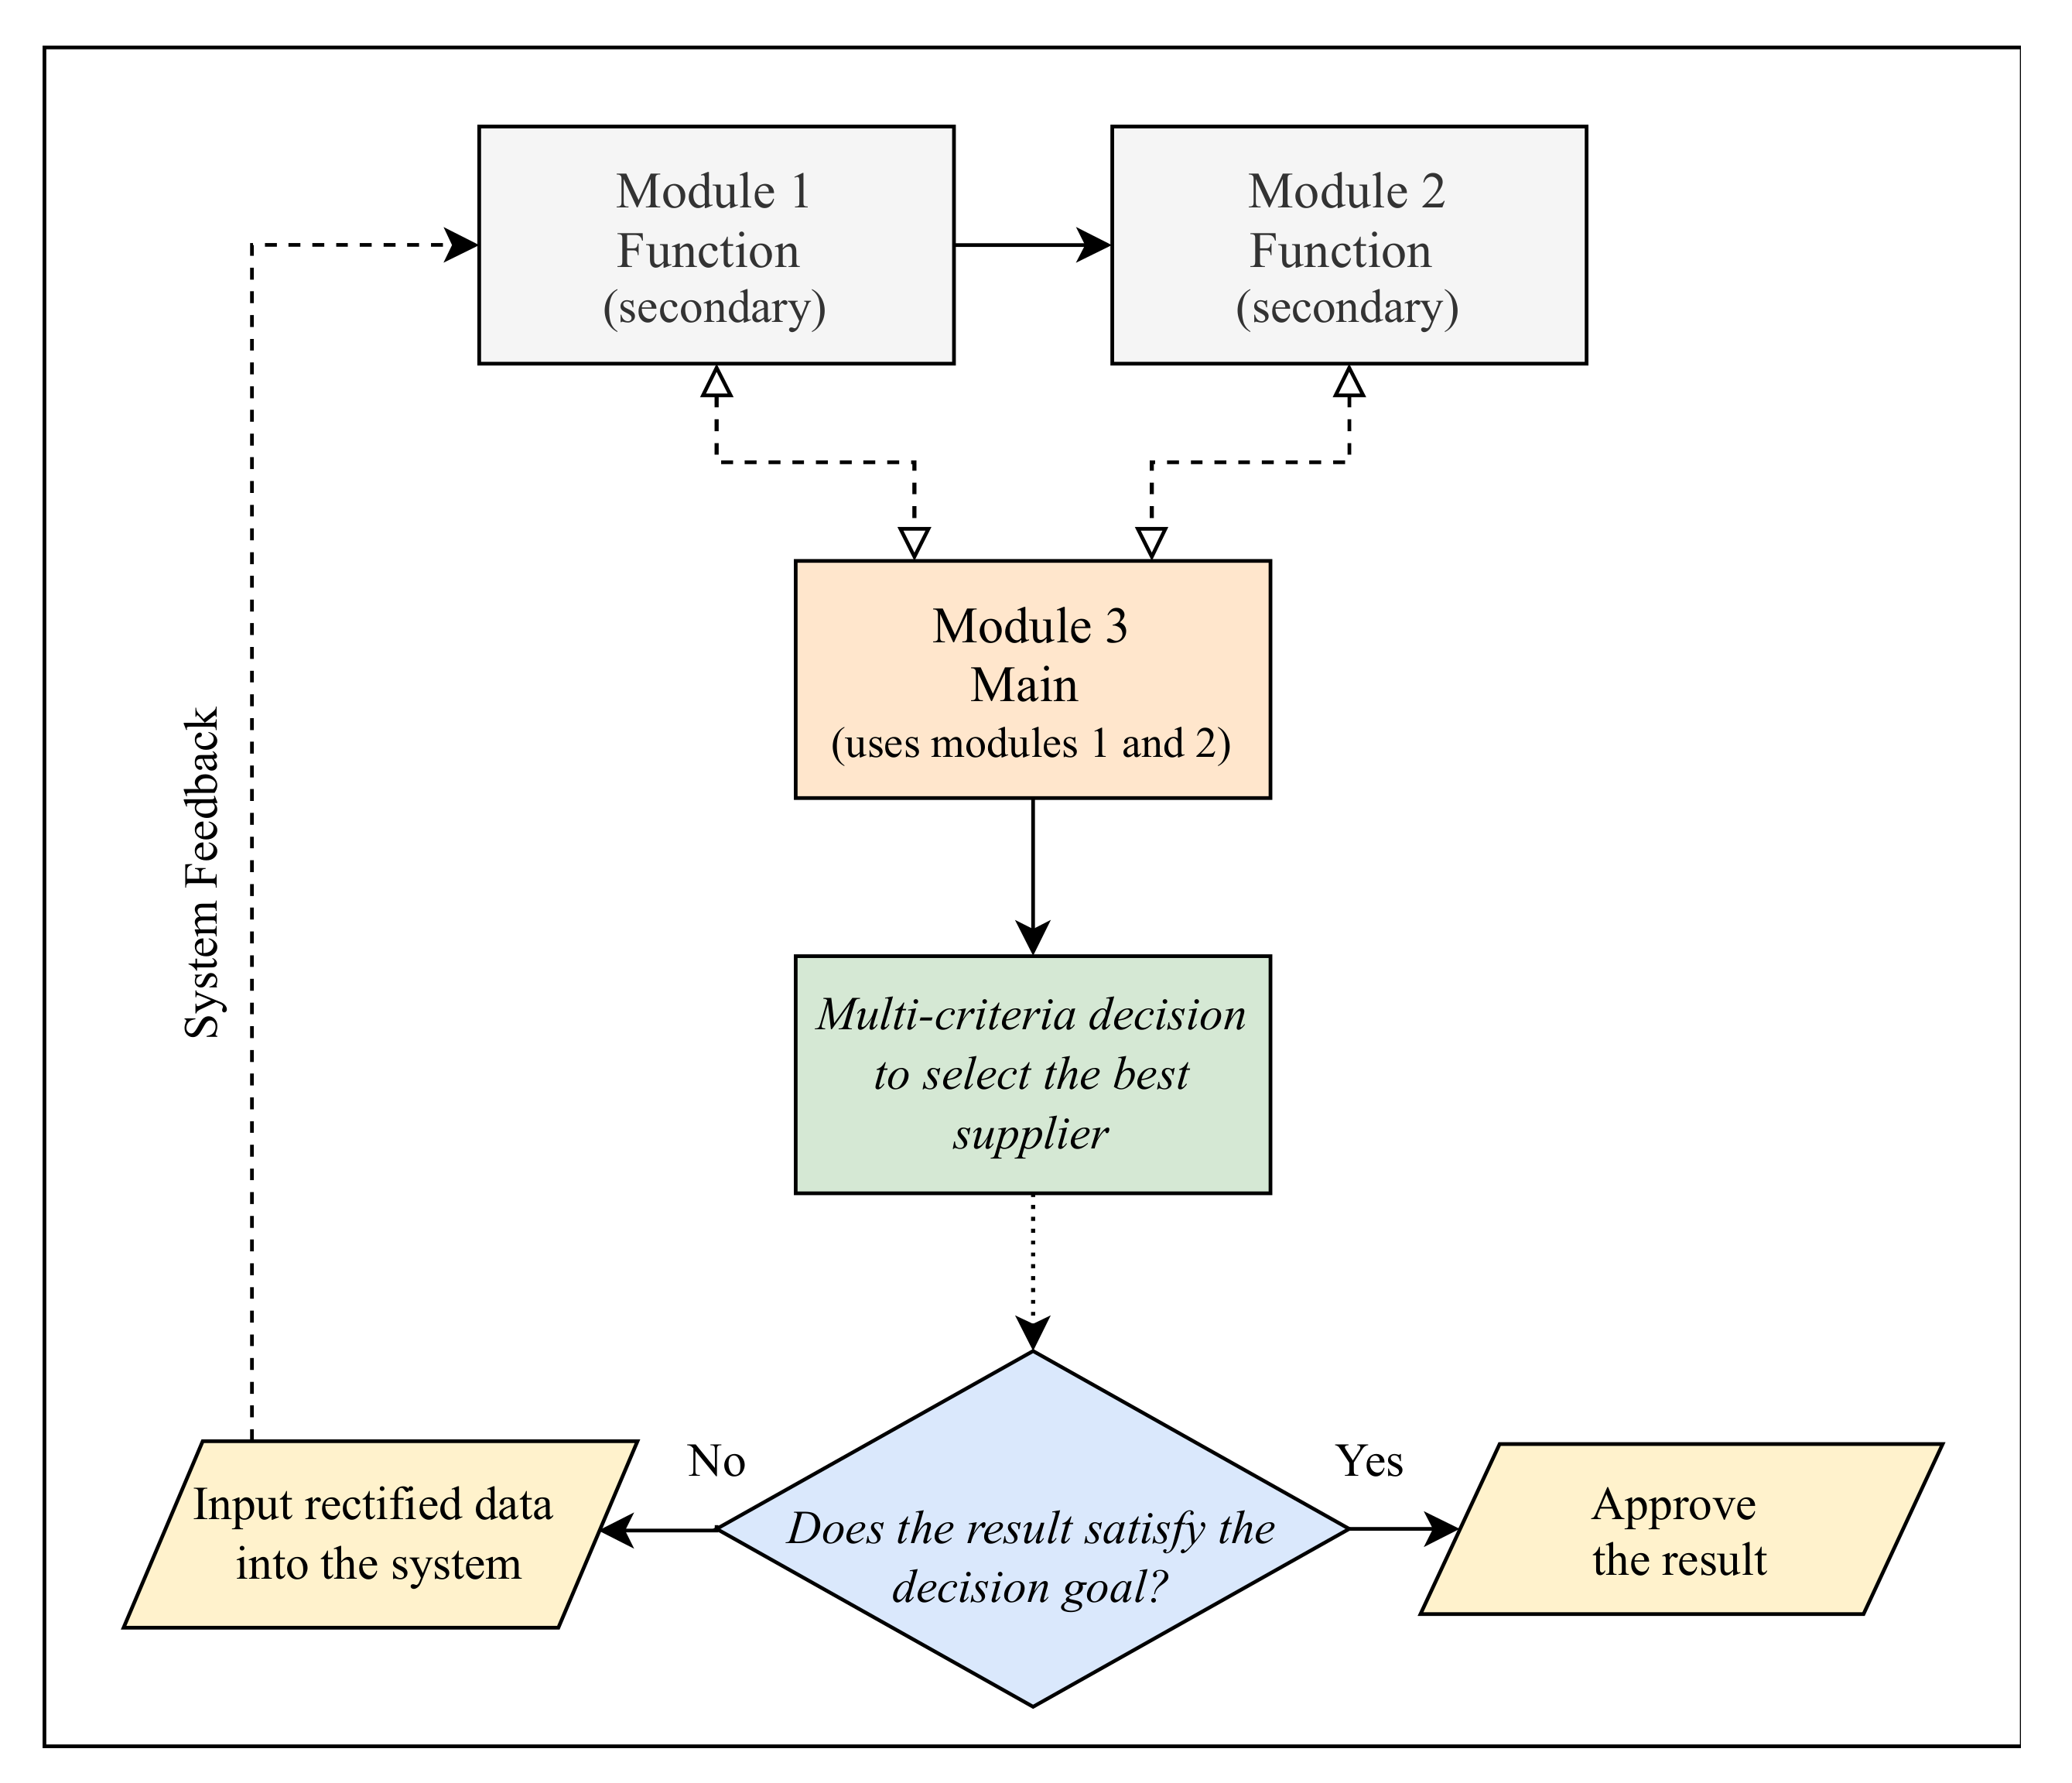
Figure 3.
Real problem hierarchy of supplier selection risk. The linguistic variables were used to make the pair-wise comparisons. These linguistic variables were then converted to triangular fuzzy numbers (TFN), as shown in Table 2. That is, for each numerical value of the pair-wise comparison matrices, three values were associated that correspond to the ‘lower’, ‘middle’ and ‘upper’ values.

Figure 4.
Final priority weights of suppliers in the computer system interface.

Figure 5.
Sensitivity analysis graph.


Table 1.
Articles on supplier selection risk.
| Risk Type | Risk Factor | Reference |
|---|---|---|
| 1. Quality | Poor quality | [26,27,28,29] |
| 2. Delivery | Delay in delivery | [26,27,28,29] |
| Low delivery speed | [30] | |
| 3. Performance | Uncertain capacity | [31,32] |
| Supplier failure | [33,34,35] | |
| Poor performance | [30] | |
| Unwillingness to cooperate and lack of supplier involvement | [30,36] | |
| Supply restriction, restriction between buyer-supplier and bad supplier profile | [37] | |
| Interruption of supply | [28,38,39,40] | |
| Poor supplier service | [41,42] | |
| Low supplier reliability | [1] | |
| Low manufacturing capacity, high defect rate, lack of warranty and after-sales service and lack of plans to deal with interruptions | [29] | |
| 4. Location | Dispersed geographical location | [2] |
| 5. Flexibility | Lack of/or low supplier flexibility | [29,43] |
| 6. Price | High supplier price | [29,30] |
| 7. Technology | Technological risks | [29,30,44] |
| 8. Financial | Financial risks | [30] |
| Supplier financial stress | [45] | |
| Bad financial condition | [29] | |
| 9. Economic | Economic risks | [44,46] |
| Economic sustainability risk | [47] | |
| 10. Environmental | Environmental risk | [44,47] |
| Environmental project defect, high emission of greenhouse gases, pollution, environmental non-compliance and natural wear | [48] | |
| 11. Social sustainability | Social risks | [44,49] |
| Social sustainability risk | [47] |
Table 2.
Linguistic variables with corresponding triangular fuzzy values.
| Linguistic Variables | Triangular Fuzzy Value Corresponding | Triangular Fuzzy Value Corresponding Reverse |
|---|---|---|
| Equal | (1, 1, 1) | (1, 1, 1) |
| Not very strong | (2, 3, 4) | (1/4, 1/3, 1/2) |
| Strong | (4, 5, 6) | (1/6, 1/5, 1/4) |
| Very strong | (6, 7, 8) | (1/8, 1/7, 1/6) |
| Extremely strong | (9, 9, 9) | (1/9, 1/9, 1/9) |
Table 3.
Fuzzy evaluation of the criteria in relation to the general goal.
| (1, 1, 1) | (1, 1, 1) | (6, 7, 8) | (4, 5, 6) | 0 | |
| (1, 1, 1) | (1, 1, 1) | (9, 9, 9) | (9, 9, 9) | 1 | |
| (1/8, 1/7, 1/6) | (1/9, 1/9, 1/9) | (1, 1, 1) | (1, 1, 1) | 0 | |
| (1/6, 1/5, 1/4) | (1/9, 1/9, 1/9) | (1, 1, 1) | (1, 1, 1) | 0 |
Table 4.
Fuzzy evaluation of the sub-criteria in relation to the criterion .
| (1, 1, 1) | (6, 7, 8) | (4, 5, 6) | 0.799 | |
| (1/8, 1/7, 1/6) | (1, 1, 1) | (9, 9, 9) | 0.2 | |
| (1/6, 1/5, 1/4) | (1/9, 1/9, 1/9) | (1, 1, 1) | 0 |
Table 5.
Fuzzy evaluation of the alternatives in relation to the sub-criterion .
| (1, 1, 1) | (2, 3, 4) | (4, 5, 6) | 0.536 | |
| (1/4, 1/3, 1/2) | (1, 1, 1) | (1/8, 1/7, 1/6) | 0 | |
| (1/6, 1/5, 1/4) | (6, 7, 8) | (1, 1, 1) | 0.463 |
Table 6.
Combination of priority weights: sub-criteria of the criterion .
| Weights | 0.799 | 0.2 | 0 | Alternatives Priority Weights |
|---|---|---|---|---|
| Alternatives | ||||
| 0.536 | 0.135 | 1 | 0.4552 | |
| 0 | 0.15 | 0 | 0.03 | |
| 0.463 | 0.713 | 0 | 0.5125 |
Table 7.
Summary combination of priority weighting: criteria of the general goal.
| Weights of the Criteria | 0 | 1 | 0 | 0 | Alternatives Priority Weights |
|---|---|---|---|---|---|
| Alternatives | |||||
| 0.4552 | 0.848 | 1 | 0.135 | 0.848 | |
| 0.03 | 0.151 | 0 | 0.15 | 0.151 | |
| 0.5125 | 0 | 0 | 0.713 | 0 |
Publisher’s Note: MDPI stays neutral with regard to jurisdictional claims in published maps and institutional affiliations. |
© 2021 by the authors. Licensee MDPI, Basel, Switzerland. This article is an open access article distributed under the terms and conditions of the Creative Commons Attribution (CC BY) license (http://creativecommons.org/licenses/by/4.0/).
Share and Cite
MDPI and ACS Style
Fagundes, M.V.C.; Hellingrath, B.; Freires, F.G.M. Supplier Selection Risk: A New Computer-Based Decision-Making System with Fuzzy Extended AHP. Logistics 2021, 5, 13. https://0-doi-org.brum.beds.ac.uk/10.3390/logistics5010013
AMA Style
Fagundes MVC, Hellingrath B, Freires FGM. Supplier Selection Risk: A New Computer-Based Decision-Making System with Fuzzy Extended AHP. Logistics. 2021; 5(1):13. https://0-doi-org.brum.beds.ac.uk/10.3390/logistics5010013
Chicago/Turabian StyleFagundes, Marcus V. C., Bernd Hellingrath, and Francisco G. M. Freires. 2021. "Supplier Selection Risk: A New Computer-Based Decision-Making System with Fuzzy Extended AHP" Logistics 5, no. 1: 13. https://0-doi-org.brum.beds.ac.uk/10.3390/logistics5010013