A New Logistic Model of Market Information Asymmetry Reduction in Poland

Department Finance and Banking, WSB University of Poznanul, Powstancow Wielkopolskich 5, 61-895 Poznan, Poland
Logistics 2021, 5(1), 5; https://0-doi-org.brum.beds.ac.uk/10.3390/logistics5010005
Submission received: 9 December 2020
/
Revised: 3 January 2021
/
Accepted: 5 January 2021
/
Published: 14 January 2021
Abstract
:The article presents the first theoretical and empirical estimation of the role of logistics in mitigating the effects of market information asymmetry in Poland. Following a review of international (Akerlof, Spencer, Stiglitz) and Polish literature (Gołembska, Gruszecki, Stradomski), a new logistic model of information asymmetry (LMAI) is presented. The article attempts an empirical verification of this model using the results of studies conducted in Polish firms in the period 2000–2018. The studies examined the efficiency and effectiveness of logistics management, with a particular focus on logistics infrastructure expenditure, balance-sheet inventories, and logistics costs. The computation of the LMAI indicator, based on averaged data provided by manufacturers, distributors and service firms, enabled the estimation of the impact of logistics management on reducing the effects of information asymmetry, and showed the differences of this impact in individual industries including the pharmaceutical, tourist, transport and food distribution industry.
1. Introduction
The importance of logistics in international business derives not only from its interdisciplinary nature, but also from the fact that it has the potential to contribute to a company’s success. What is more, a new concept known as “logistification” (Fabbe-Costes and Rouquet, 2019 [1]) has now emerged, which refers to the rapid development of logistics in all spheres of human economic and non-economic activity.
Yet in the twenty-first century, international business activity continues to be disrupted by information asymmetry in global supply chains. Various international authors and Polish writers (Gołembska 2008), have argued that logistics written into a corporate strategy may have a positive influence on reducing serious effects of market information asymmetry. Subsequently, this argument has been realized as a new logistics paradigm, and in 2015, Banaszyk and Gołembska [2] proposed a new model of the role of logistics in reducing the consequences of information asymmetry, which they called the logistic model of information asymmetry (LMAI).
To explain the concept, the following hypothesis is put forward:
Hypothesis 1 (H1).
Modern company logistics play a significant role in reducing market information asymmetry.
To verify this hypothesis, we formulated the following two research questions:
- Does logistification of the world economy have a role in limiting the scale of market information asymmetry?
- What elements of the logistics process in a firm singularly contribute to the reduction in the consequences of market information asymmetry?
This paper is divided into two parts. The first part presents a literature review considering the theory and nature of market information asymmetry in the context of the growing logistification of the world. The synthetic measure of information asymmetry proposed by the Polish scholar Kubiak [2] is presented, together with the first attempt to verify the validity of this indicator in nine major industries of the Polish economy.
In the second part, the article describes the role and significance of logistics in mitigating the consequences of market information asymmetry in modern-day companies. In order to quantify such influence, the theoretical formula for a logistics model of information asymmetry (LMAI) is proposed. This model is subsequently subjected to empirical verification, and the findings lead to the formulation of conclusions about the practical application of the model in business enterprises. The major parameters processed in the model include the value of capital investments in logistics infrastructure, the value of inventories in company assets, and the costs of logistics.
2. The Nature of Market Information Asymmetry: A Literature Review
Market information asymmetry occurs when a firm has knowledge about itself but this knowledge is not readily available to other firms. This results in an obvious knowledge imbalance between trading partners in the market. Information asymmetry may be perceived as a social phenomenon, but primarily it is an economic fact that is empirical and measurable by qualitative and quantitative methods. Whether objectively or subjectively seen, information asymmetry is a sequence of signals that are difficult to measure.
Consequently, the nature of this phenomenon lies in the fact that it concerns not only the difference in access to information between two firms, but also limitations resulting from understanding and processing the available information.
In the theory of economics, early methods for measuring inequality in the access to market information in the context of company management, began to emerge in the 1960s and 1970s. The term “information asymmetry” was introduced to the theory of economics by James Mirrlees [3], who in 1996 was awarded a Nobel prize for his studies on information asymmetry between private firms and the government. In one of the first information asymmetry models, Akerlof [4] reflects on “adverse selection” as a result of information asymmetry between firms. Here, he also claims that such market failure leads to uncertainty about the quality of transacted goods or services, which in turn results in the dominance of low-quality products. The author suggests there should be some government intervention in order to eliminate the risk of dishonest acts between better informed firms and their less informed transaction partners.
Spence [5] believed that firms themselves should mitigate the effects of information asymmetry by raising the quality of their products, providing guarantees for the goods and services offered, and manifestly signalling the high quality of their management personnel.
In his considerations, Joseph E. Stiglitz [6] came to the radical conclusion that it is not true that market competitiveness is a sufficient condition for rational human resource management, thus questioning one of the fundamental principles of the classical economy. He justified his view by arguing that information asymmetry raises the fixed cost of gaining information, which in turn limits the competitiveness of a firm in the market.
The works of these three authors combined laid the foundation for the general theory of markets under asymmetric information. In 2001, Akerlof, Spence and Stiglitz were jointly awarded the Nobel prize for justifying the thesis that deviations from rationality at the microeconomic level result in macroeconomic deviations. As a consequence, the whole economy of a given country achieves the point of balance below the effective utilisation of resources.
The first step in theoretical and empirical studies of market information asymmetry is to define the causes of such asymmetry. These can be divided into objective/external and subjective/internal. As stated before, the objective causes relate to both the differences in the access to information between market participants, and difficulties in the interpretation of information. The subjective/internal causes can be found in the psyche of managers, who in their pursuit of company profit maximization, act consciously or subconsciously to create such asymmetry. Internal reasons also include excessive self-confidence, the illusory truth effect, and the tendency to moral hazard.
Synthetically, the causes of market information asymmetry can be presented as Figure 1.
In Poland, theoretical and empirical studies of the causes and effects of market information asymmetry began in the 2000s. The authors of these studies, Gruszecki [7], Stradomski [8] and Noga [9], address the issue of imperfect information within the framework of business enterprise theory, and confront it with neoclassical theories. They agree that information asymmetry is a major factor hampering a firm’s performance. According to Gruszecki, modern theories of business enterprise take into account the cost of obtaining information, and acknowledge the asymmetric character of information procurement, which is due to both language differences and delays between the time that information becomes available and the time of decision making (e.g., investment decisions). Therefore, according to the author, the information asymmetry phenomenon should be considered in the broad context of business enterprise theory, and particularly, in the context of transaction cost, contract and agency theories. The transaction cost approach was developed, as we know, by Williamson [10], who pointed out that the differences in transaction costs, both ex ante and ex post, determine what a firm produces itself and what it sources from the marketplace. Here, we must clearly underline the fact that transaction costs can be significantly reduced relative to market levels through logistic management. In logistics, transaction costs are fundamentally important.
Transaction costs also lie at the foundation of both contract theory and agency theory. In contract theory, a corporation is just a collection (nexus) of contracts entered into by a firm in order to gain control over its resources. As Hart [11] points out, contracts must be intelligible not only to the contracting parties, but also to outsiders (e.g., courts) who may require certain knowledge about the specificity of the environment in which the parties operate.
Finally, according to Gruszecki (op. cit.) both the transaction cost concept and the contractual approach are truly developed further within the agency theory. Here, similar to transaction costs, information asymmetry occurs both ex ante and ex post. Agency theory describes the relationship between business principals, who act in their own interest, and agents representing their principals in carrying out contracts. This relationship gives rise to information asymmetry, as agents enjoy full access to information and can use it to their advantage. Thus, in a logistically managed firm, information asymmetry affects transaction costs both at the contract preparation stage (ex ante), and during the fulfilment of the contract (ex post).
The studies by the Polish authors outlined above concern the theory of the business enterprise; their findings need further research and empirical verification.
Kubiak [12] was among the first Polish authors to undertake empirical studies of market information asymmetry. Using the linear ordering method, he studied the impact of information asymmetry on the capital structure in major Polish industries in the period 2002–2008. It is worth noting that both the methodology and findings of the study have provided valuable inspiration for developing new research methods to investigate the role of logistics in mitigating the effects of market information asymmetry.
Briefly, the methodology used by Kubiak is a multidimensional comparative analysis involving a set of quantitative data (variables) processed according to predefined criteria in order to estimate information asymmetry due to various reasons and conditions. In this method, the synthetic measure of information asymmetry (SMAI) is computed based on the distance between an observed object and the model object. The model object is the maximum value of a given indicator in the entire period covered by the study, i.e., 2002–2008. The following formula is used:
where:
SMAI—the value of the synthetic measure of information asymmetry for the i-th object
Wj—weight assigned to the particular object
Xoj—model object–max (Xij), i.e., the maximum value of the j-th variable in the period 2002–2008
The study was based on the Main Office of Statistics (GUS) data and concerned major Polish industries. The results are as follows (Table 1):
These very interesting and valuable findings of the 2002–2008 study provide an initial but important overview of the scale of information asymmetry in the respective industries of the Polish economy. The highest and the lowest values of the SMAI indicator are especially notable. The pharmaceutical industry is one of the business sectors with the highest degree of information asymmetry, perhaps due to its very specialised nature which requires specialist knowledge, particularly in investment decision making. In turn, a high degree of information asymmetry in the services industry reflects the high share of intangibles in the balance sheets, such as intellectual property or patents. At the other extreme there are industries such as mining and quarrying, power generation, water purification and distribution, or waste management, which are characterised by a low degree of information asymmetry. These are traditional, long-term industries with a controlled flow of information that are subject to high levels of regulation. Their business is regulated by special legislation and concessions. In a way it can be said that the results with respect to the latter group of industries confirm Akerlof’s observation that in some cases governmental intervention can mitigate market information asymmetry.
At this point it seems appropriate to pose a question as to why the new phenomenon of logistification is so relevant to reducing the consequences of market information asymmetry. There are at least three explanations of this relationship:
- The flourishing logistics industry, where value offered to client strictly depends on operational excellence.
- The versatility and universality of logistics, which in turn poses strategic challenges for clients. In this respect, its particular role is attributed to the following [13]:
- Strategy of creative logistics: management of change, creating innovative methods of evaluating logistics effectiveness
- Strategy of pervading logistics: acquiring superior logistics competencies through information exchange
- Strategy of systemic logistics: implementing logistic audits, identification of profit centres and added value sources.
- Wide access to logistics training, not least because logistics has now become part of management science. A special feature of specialist logistics training is the ability to combine the personnel function of human resource management with the requirements of logistics management [14]. As studies conducted in Polish firms have shown, logisticians are characterized by high motivation in the administration of logistics tasks and creativity with respect to European requirements.
As mentioned before, in Poland the aim of research on the theory of market information asymmetry was to describe this phenomenon in the context of eliminating information imperfections and their impact on the condition of Polish firms.
3. The Role of Logistics in Reducing the Effects of Market Information Asymmetry—The Measuring Method
In view of the discussion above, we might consider the question of why it is that logistics can have a role in mitigating the effects of market information asymmetry?
In answering this question, we must first take note of the three fundamental reasons behind the increased role of logistics as the firm’s strategy in the modern global economy. These are [15]:
- Intensified internationalization of enterprises in the twenty-first century, with a special role attributed to transnational strategies for company development
- Dynamic increase of the number and quality of logistics services globally
- The steadily growing role of strategic alliances formed by logistics and transport firms.
With regard to point no. 1, the dynamic growth of international logistics stems from the interdisciplinary nature of globalized business (Table 2). Further, besides finance, technology, innovation and prices, logistics is a factor that determines the effectiveness of international operations. However, the necessary condition for including logistics in the firm’s strategy is the internationalization of business [16].
In other words, the internationalization of markets is the process of reducing the separation of markets for goods and services and the factors of production. Therefore, we can identify three forms of logistics internationalization, i.e., the management of international global chains, namely [17]:
- Internationalization of logistics processes, from simple operational tasks to logistics as company strategy
- Internationalization of markets for goods and services through global logistics services, including outsourcing and offshoring
- Internationalization of logistics management in firms and transnational corporations through implementing modern methods of strategic management.
Particularly noteworthy are the innovative technologies that support logistic processes, such as [18]:
- Artificial intelligence (AI)
- Augmented reality (AR)
- Self-driving vehicles (SDV)
- Robotics (RO)
The systematic development of international logistics markedly accelerates internationalization of firms, and consequently, the flows of factors of production in global supply chains. In the classic Bartlett and Ghoshal model [19], transnational strategies were formed when global integration increased along with local initiative. A typical example of such transnational strategy is the one pursued by the Ford Motor Company, where every logistics manager is responsible for global integration in the supply chains.
Further, the effectiveness of transnational strategies has been attributed to their basic components, which are [20]:
- Discriminating competencies, including logistics competencies
- Geographic reach of logistics operations
- Diversification of supply sources
- Synergy effect
Nowadays, the execution of transnational strategies requires logistics managers to control a number of performance criteria, such as processing time, after-sales service, or price. Therefore, it is now believed that firms compete amongst each other with entire supply chains, rather than prices or costs. Hence effective logistics management in a transnational corporation yields competitive advantage [21].
In Poland in the period 2004–2018, i.e., since the country’s accession to the European Union, Polish firms have adopted various forms of internationalization, from export to daughter companies (Figure 2).
As a result, by the end of 2018 over eighty percent of these enterprises had adopted various forms of internationalization. From 2000 to 2018, the structure of exports and imports saw a major diversification, both within the EU and in the Middle East, China, North and South America, Australia, Japan and Canada. At the same time, foreign capital participation in the capital structure of Polish firms steadily grew by an average of 28.5% per annum.
With regard to point no. 2, the phenomenon of service internationalization in the twenty-first century accompanied the contemporary wave of economic globalization, which also included the logistification of economies. The foundation of service provision is the construction or modernization of the infrastructure of logistics to ensure an uninterrupted flow of material and human resources, information, and finances along the service supply chain.
Internationalization as a new logistics paradigm in the service sector requires hybridization of services. It also needs to accommodate the attributes of logistics and those elements of the value chain that lay the foundation for competitive advantage [22].
According to Griffin and Pustay [23], the management of services within international logistics should be based on the following principles:
- Capacity planning (CP)
- Location planning (LP)
- Facilities design (FD)
- Operations scheduling (OS)
Scheduling provides the optimal arrangement because it factors in consumer preferences, time zones, jet lag, and aircraft utilization.
As studies [24] have shown, today a particular role is attributed to logistic service providers (LSP), with 73% of service givers and 92% of service takers stating that innovation in service provision markedly increases the effectiveness of logistics.
In Poland, logistics and transport services exhibit a steady growth trend, not least because of the significant increase in the number of transport firms between 2000 and 2018. It should be noted that, depending on industry, the cost of transport amounts to between 18% and 65% of overall logistic costs, and the haulage services provided by 34,378 Polish transport firms are at the forefront of the industry in the European Union. In this context, it is worth noting that the sales of logistic, transport and storage services is expected to continue to grow at a forecast rate of 2–3.6% per annum (Figure 3).
The high level of logistics services in Poland is due to two reasons.
Firstly, in order to deliver these services, firms establish logistics services chains that are characterized by the high participation of the client in the service delivery from sender to recipient. Participation of the client in the process of value creation satisfies the recommendations regarding customer-responsive supply chains, i.e., supply chains that adapt to client needs.
According to Peng and Meyer [25], the strength of market-responsive supply chains depends on such factors as:
- Agility
- Adaptability
- Alignment
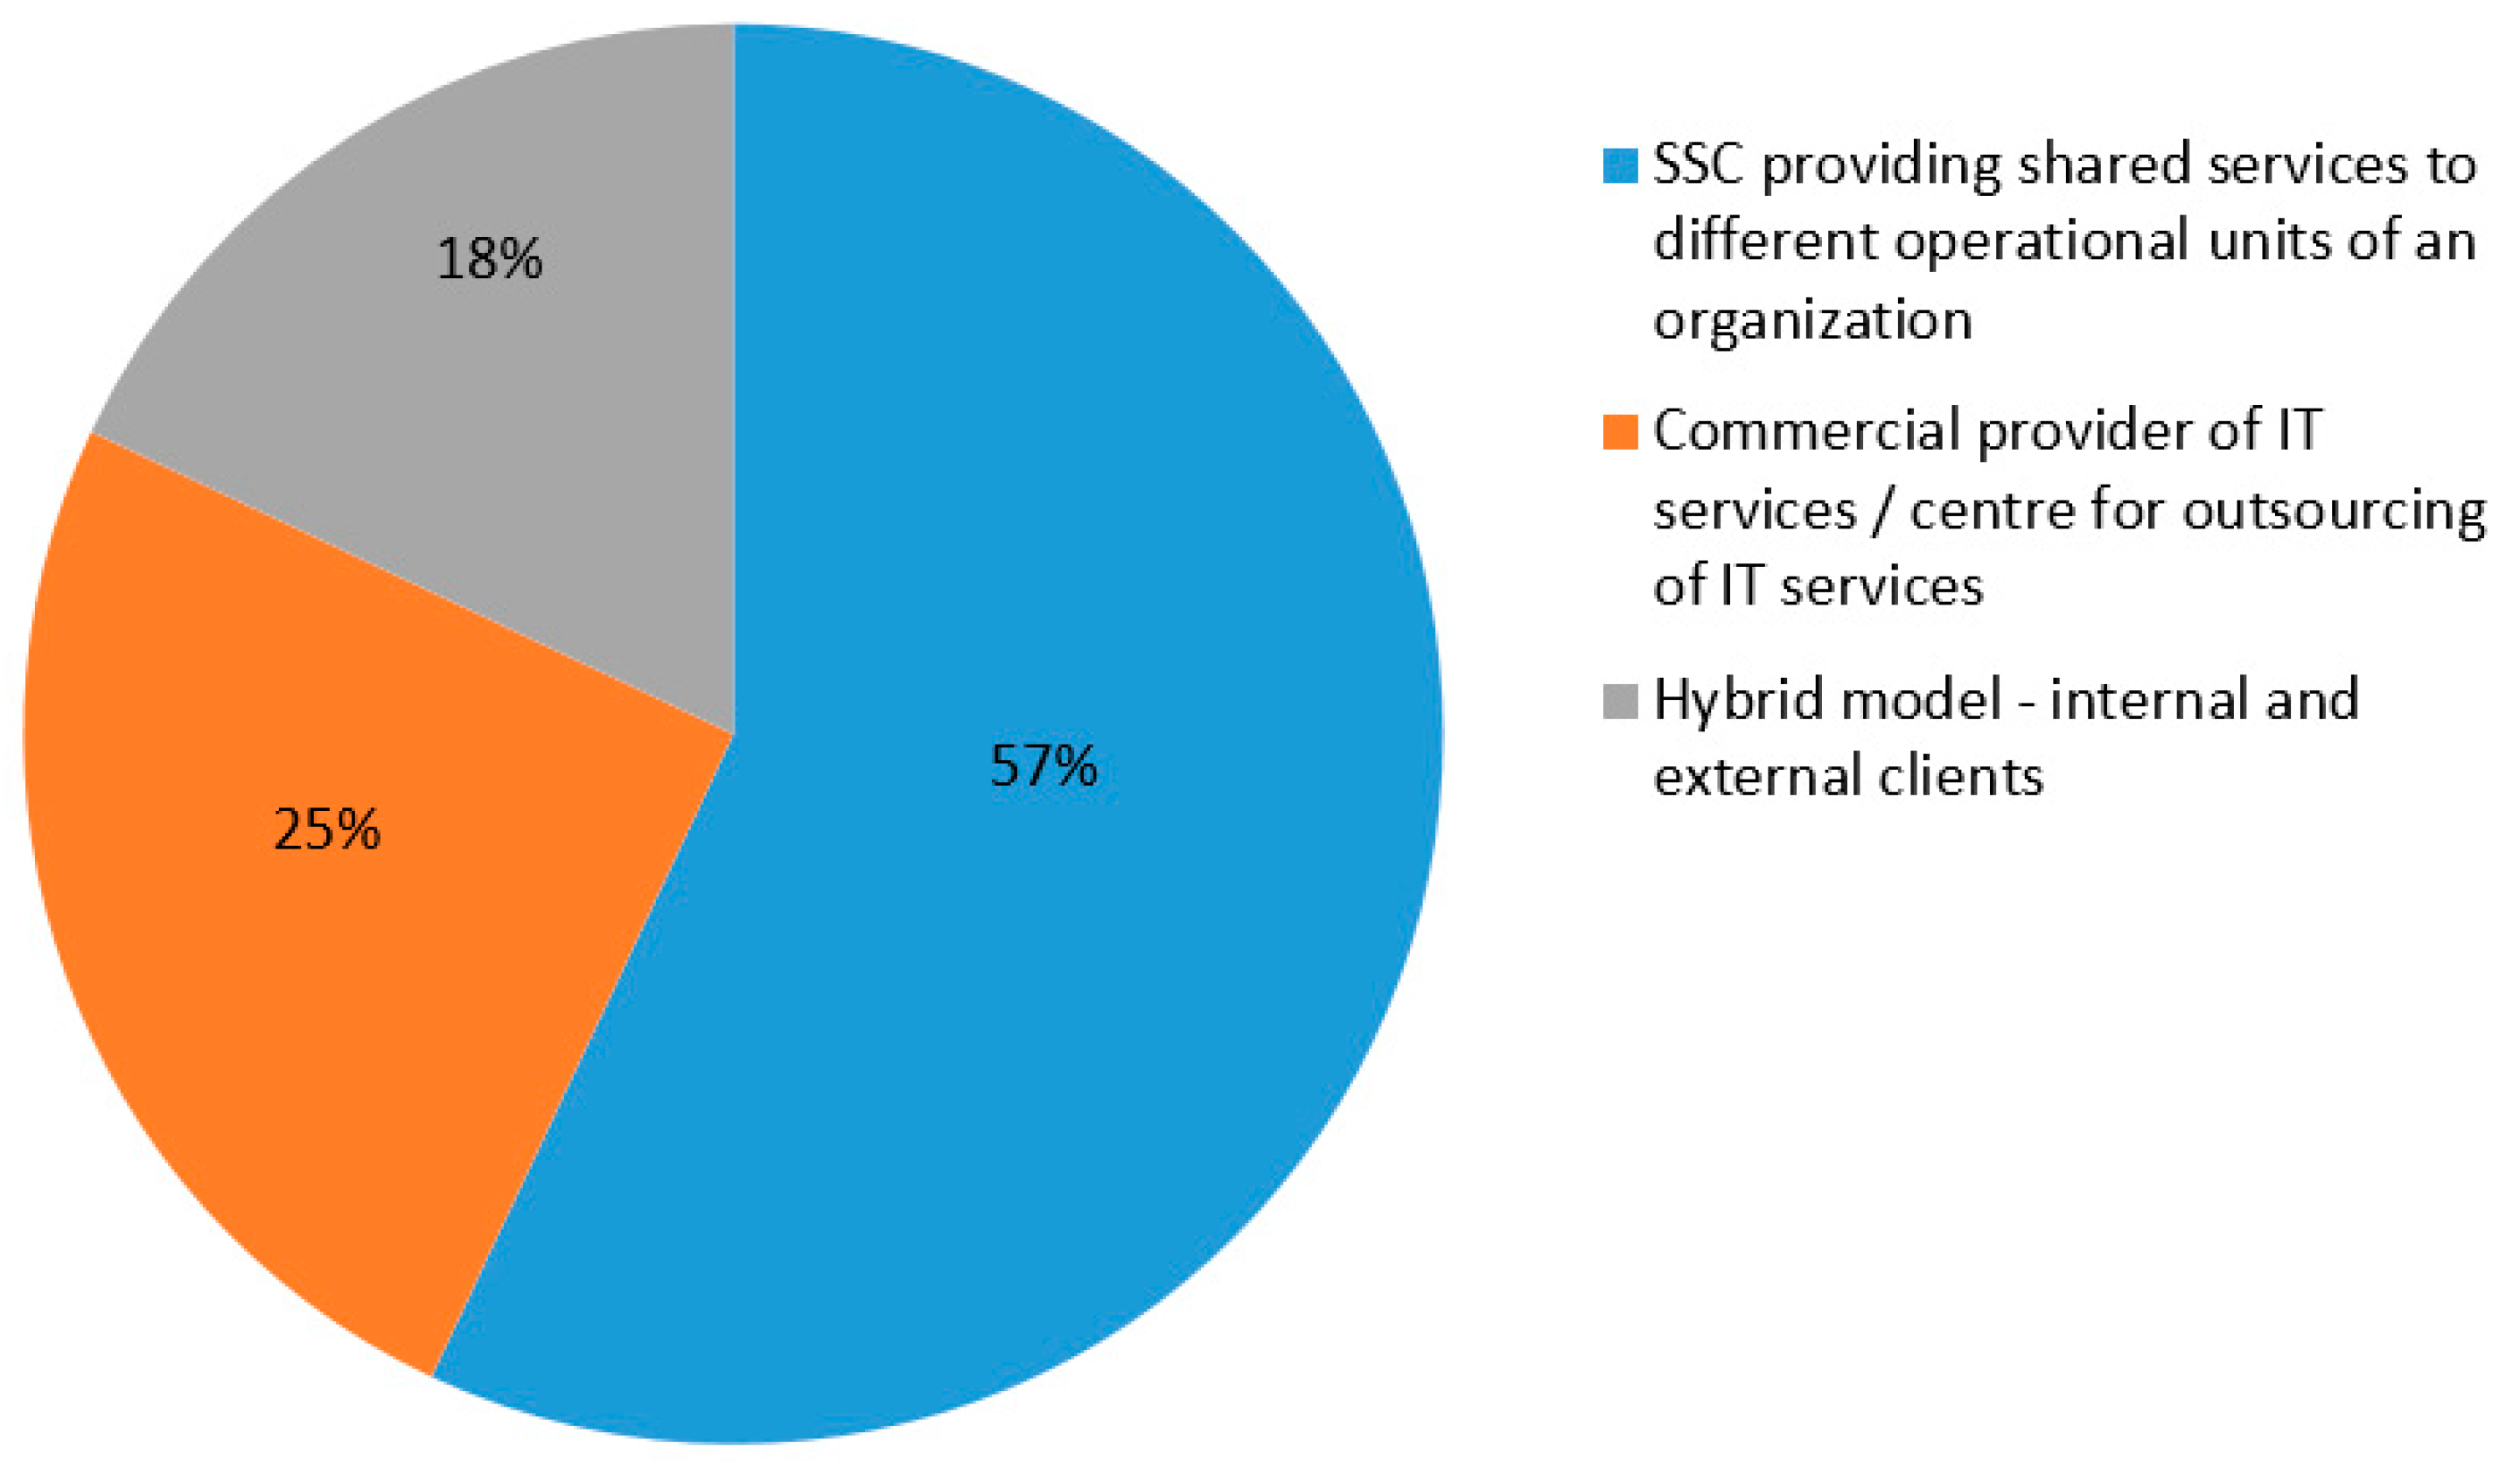
Secondly, Poland has seen the dynamic growth of shared services centres (SSC). There are currently 532 such service centres with participation of foreign capital, owned by 360 investors, and employing 150,000 workers [26].
Interestingly, employment in shared services centres has been steadily growing by 25% per annuum since 2008, and a further increase by 20% per annum is being forecast. The types of SSCs located in Poland are also of interest (Figure 4):
Shared services centres are of fundamental importance to Polish logistics, given that modern logistic processes, particularly in services, require state-of-the-art information technologies, which are available in such centres.
The major types of SSCs and their operational scope are presented in the Table 3 below:
Another phenomenon worth noting is the shortening of supply chains. According to Godsmark and Richards [27], the fast-growth of e-commerce contributes to the effectiveness of logistic processes. For example, Adidas plans to earn 4 billion euros from e-commerce in 2020, and John Lewis forecasts that in a few years their revenue from online business will surpass their high street sales [28].
With regard to point no. 3, globalization, logistification and internationalization of the world’s economy calls for the coordination of R&D across corporations, not to mention rationalization of production, distribution, finances or logistics. One of the major forms of functional or regional integration is strategic alliances. Without a doubt, services are among the fastest growing sectors of the economy, especially logistics services. Given the high cost of R&D in services, the best solution appears to be strategic alliances whereby the costs of launching a new service or technology, or gaining competitive advantage, are shared among the partners. Today, strategic alliances bring the following advantages [29]:
- Easier entry to the market, especially the transport market
- Equal sharing of profits among partners in the alliance
- Equal participation of partners in R&D aimed at developing new services
- Gaining competitive advantage in the market
- The synergy effect
While the aims of establishing a strategic alliance are usually clear, precisely phrased and agreed between partners, the management of an alliance comprising multiple partners can be difficult to negotiate, as most managers have a natural proclivity to leadership. The possible solutions are:
- An equitable share in the management of the alliance, based on the proportion of shares owned
- Appointing one partner as manager of the strategic alliance
- Delegating management functions to selected partners
The prominent role of the logistics services sector stems from the obvious fact that logistics firms provide services to other sectors of the economy, and as such are the first businesses to sense changes in the market. Precisely for that reason, logistics firms are seen as the barometer of an economy.
In response to the fast development of the logistics services sector, particularly after 2010, firms began to form strategic alliances, with the benefits being anticipated intuitively. To verify the advantages of strategic alliances empirically, the first studies in this area in Poland attempted to identify and even quantify the benefits of such structures. A purposeful selection of sample units was used to choose 28 businesses for the study from all over Poland including freight forwarders, logistics firms and transport operators. The businesses had to satisfy the following criteria [30]:
- International reach of operations
- Annual net sales over 50 million PLN
The study used the following methods and tools: a five-point Likert scale, database processing (Data Group Consulting), Microsoft Excel, the SPSS application. The findings were formulated on the basis of responses to the following questions [31]:
- What were the aims of the alliance?
- What was the origin of capital in the surveyed firms?
- What factors determined the success of alliances?
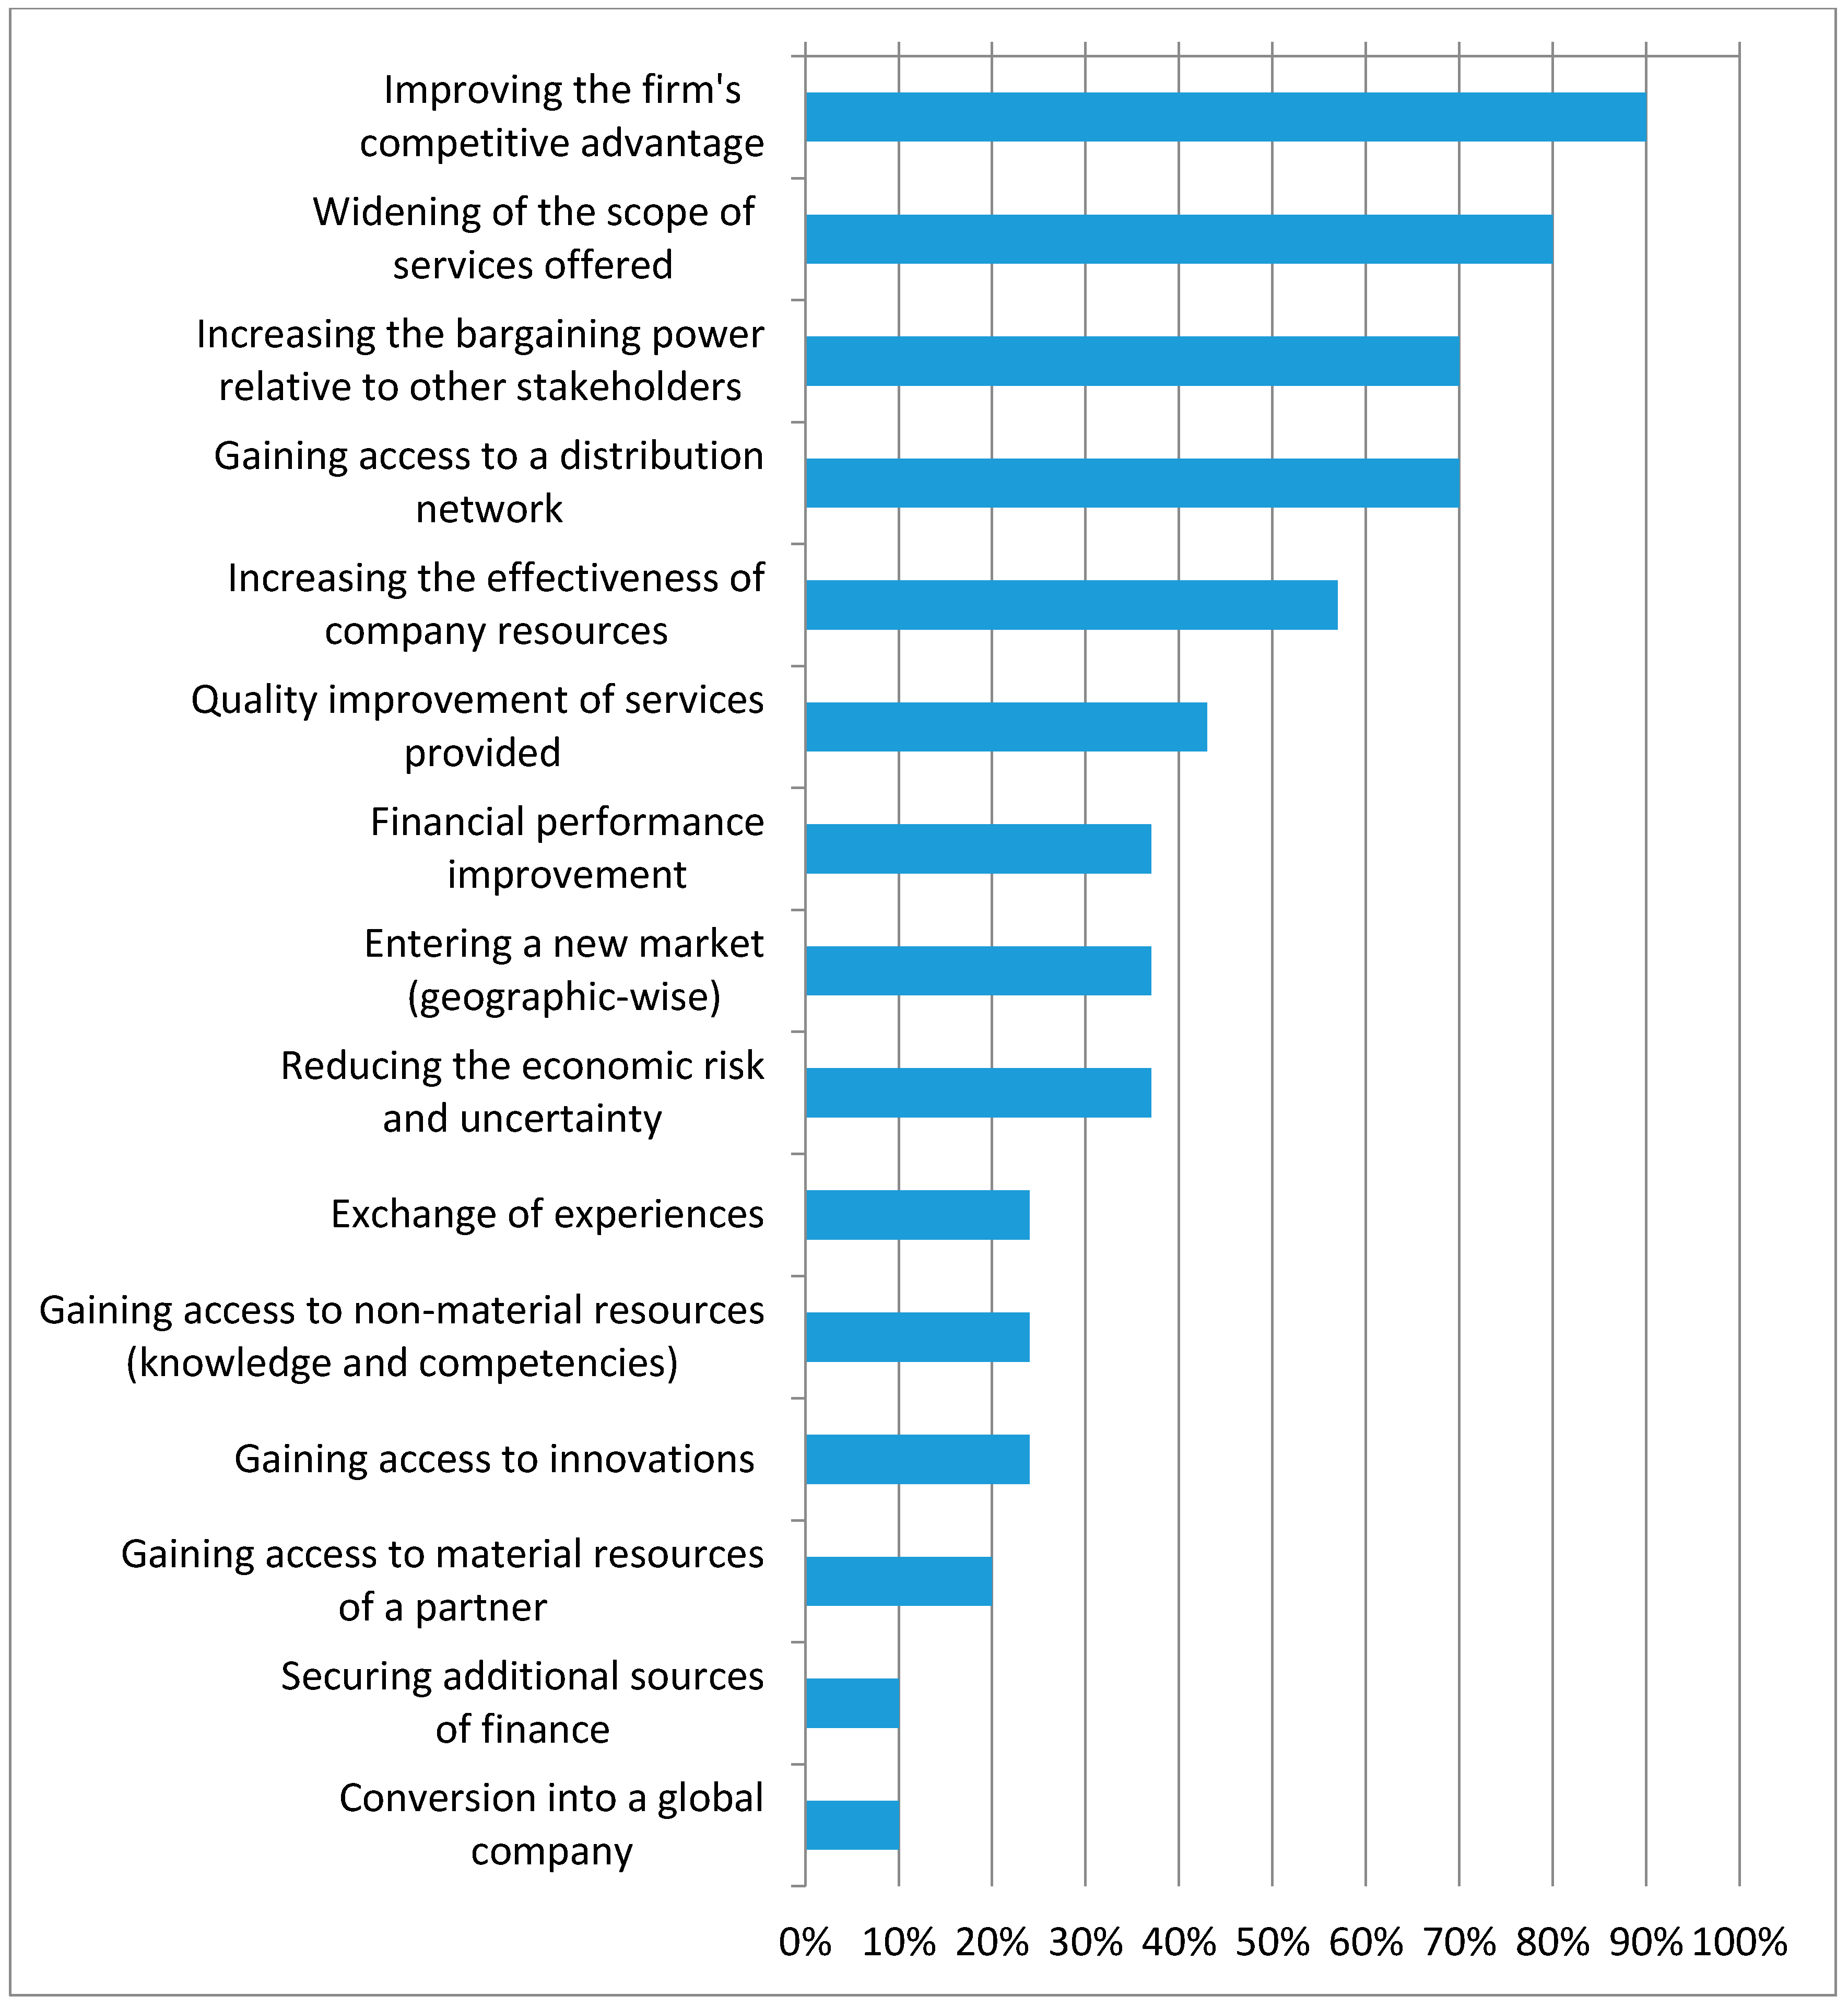
The study identified the following objectives of the strategic alliances (Figure 5):
As could be expected, and in line with global trends, the main purposes of forming alliances were to improve competitiveness and to widen the service offer.
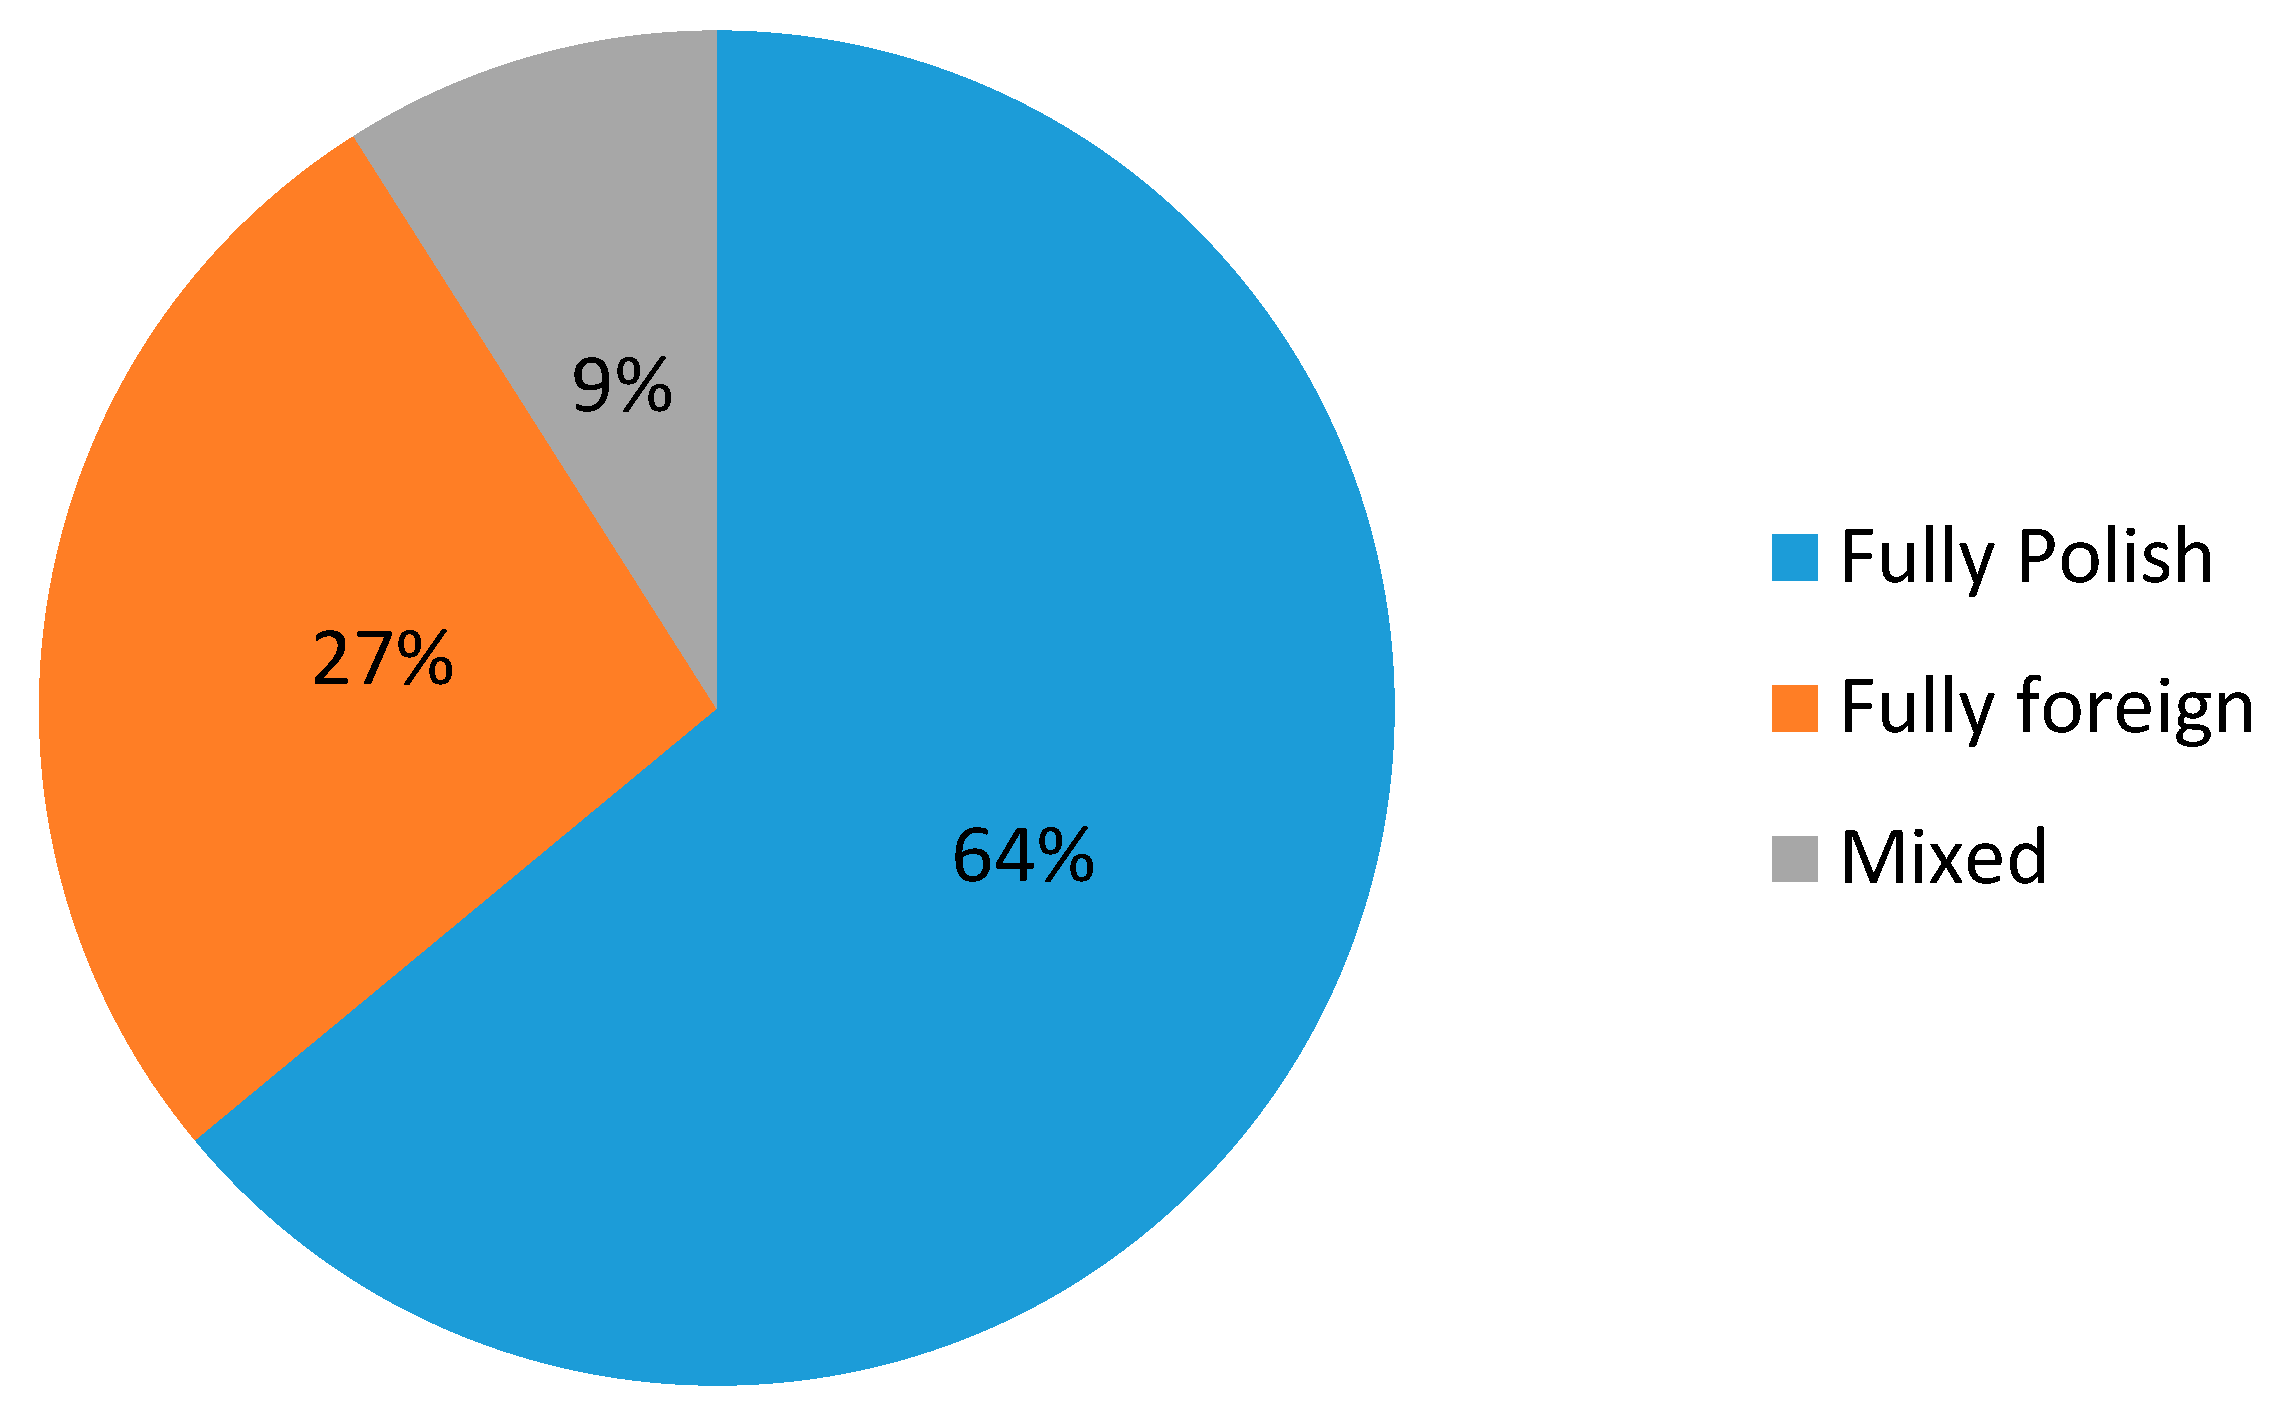
The structure of capital invested in firms participating in alliances is particularly interesting and this is presented in the diagram below.
It is worth noting the large share of Polish capital, which amounts to 64% (Figure 6).
The most important factors determining the success of strategic alliances formed in Poland are:
- Good communication within the alliance
- Selecting appropriate partners
- Ethical behaviour of partners in the alliance
- Fulfilment of set objectives
- Friendly, partner relations within the alliance
The above considerations on the nature of market information asymmetry and the role of logistics in reducing the consequences of that asymmetry lead to the issue of a method for measuring this relationship. Kubiak’s synthetic measure of information asymmetry (SMAI), presented in the introduction to this article, can serve as a starting point for designing a method to quantify the role of logistics in reducing the effects of market information asymmetry. Therefore, a first, original attempt was made to identify those elements of the logistics operations of a firm that have significant impact on reducing the effects of market information asymmetry. The work led to a theoretical construct, called the logistics model of information asymmetry (LMAI), which has the following form:
where:
LMAI—logistics model of information asymmetry
q1—the value of LMAI indicator for the i-th company
q0—model object–max {q} as reference
4. Assessment of the Logistics Influence on Information Asymmetry Effects: The Study Results
To verify the model presented above, for the first time in Poland, a practical assessment of the role of logistics in mitigating the effects of market information asymmetry was performed. The studies, which were conducted over a long period of time have led to the identification of the elements in the logistics system that have the most influence on company strategic management. Simultaneously, the elements of this system constitute the basic logistics backbone that determines the competitive advantage of firms in the Polish market. Elements of the logistics system, such as sales volumes, balance sheet assets value, inventories, investment in logistics infrastructure, and the cost of logistics and transport provide a basis for computing the impact of logistics on reducing the effects of market information asymmetry. The selection of the logistic system components for the processing in the model is subjective, and are a result of long-term studies of the practices of Polish business enterprises.
The computation process uses the average values of the variables characterising the logistic operations of firms functioning in sensitive industries in Poland. The firms have been divided into manufacturers, distributors and service providers.
The practical verification of the LMAI was performed on the basis of multiple studies [27] of Polish firms, covering periods both before and after Poland’s accession to the European Union (2000–2004 and 2005–2018, respectively, plus a projection until 2025). The studies investigated 255 business enterprises located in Wielkopolska, one of the best economically performing regions of Poland. The methods used in the surveys included a questionnaire, face-to-face interviews, analysis of statistical data published by the Main Office of Statistics (GUS), and the expert method (Table 4).
The first group comprises the metal industry, pharmaceutical industry and electronics manufacturers. The second group is composed of distributors: household electrical goods, clothing and foodstuffs trading companies. Service providers are represented by telecommunications, transport and tourism.
The first necessary step is to classify the indicators that describe the logistics activities in firms as stimulants or de-stimulants, and assign weights to these variables (Table 5).
In the next step, de-stimulants are transformed into stimulants. This transformation consists of replacing a de-stimulant value with the difference between the maximum value of a given variable in the sample and the value being transformed. This transformation is performed according to the following formula:
where D denotes the value of -th indicator constituting a de-stimulant for the i-th company. Because the variables are presented either in PLN or as percentages, they need to be standardised. This is done by transforming individual indicator values in such a way as to obtain new values with an average equal to 0, and the standard deviation equals 1. This is a classical statistical technique whereby variables belonging to different domains are expressed as a number of standard deviations from the average.
To this end the following transformation is used:
where:
—value of -th indicator for -th company,
—average value of -th indicator in the sample,
—standard deviation of -th indicator in the sample.
After being transformed according to the formula, the variables representing logistics activities in a company have the following values (Table 6).
Subsequently, the value of qi is computed for each of the investigated firms according to the following formula:
where:
—weight assigned to -th indicator
—value of -th indicator for -th company
—the maximum value of -th indicator in the sample
This parameter is a measure of the extent that the indicators for individual companies deviate from the maximum values in the sample. The qi values for individual industries are shown in Table 7.
The LMAI indicator is constructed from coefficients qi through their normalisation, i.e., the rescaling of their values to the range (0, 1) in the following way:
where:
—the earlier computed q indicator for i-th company
—the maximum value of indicator in the sample
The LMAI values computed as above for individual industries, expressed as percentages, are shown in Table 8.
We must explain that the zero value for the metal industry results directly from the last stage of the LMAI computation, i.e., the normalisation step.
As can be seen from the processing, the lowest percentage LMAI indicator of information asymmetry in the producers’ group is observed for the pharmaceutical industry, which can be explained by the fact that this industry uses costly state-of-the-art information technology.
In the distributor group, a moderately positive result in terms of information asymmetry is observed for food trading firms. Within the service providers, the lowest values of the LMAI indicators are observed in the tourism and telecommunications industries.
These findings, however, cannot be generalized beyond the present case, as they only provide a preview of the indisputably interesting and important phenomenon of information asymmetry in Poland.
5. Conclusions
Theoretical considerations and the results of empirical studies support the statement proposed in the hypothesis of this article, namely, modern logistics have a mitigating impact on the effects of market information asymmetry. There is also an obvious need for further research, and for the application of the presented LMAI model in business practice.
The studies reported in this article can be evaluated at three levels:
- Methodology: the choice and characteristics of the elements of logistics used in the LMAI model.
- The empirical layer: the processing of source data collected from Polish firms in the period 2004–2018.
- The future: propositions for follow-up research to investigate the role of logistics in reducing the effects of market information asymmetry.
- 1.
- The Methodological Layer
It should be noted that the methodology presented in this article constitutes the first, at least in Polish literature, attempt to quantify the relationship between logistics processes in a firm and their impact on reducing market information asymmetry. Therefore, with due caution the following conclusions can be formulated:
- The operation of transforming de-stimulants into stimulants is justified. This is a classical statistical procedure whereby variables belonging to different domains are expressed as a number of standard deviations from the average.
- It was deemed necessary to determine parameters qi, which are the measures showing how much individual indicators divert from maximum values in the sample.
- As a result, the LMAI indicator was computed from coefficients qi through their normalization, which enabled the expression of the impact of individual logistics processes on the level of market information asymmetry as percentages.
- 2.
- The Empirical Layer
As in the case of the methodology, the empirical discussion in this article presents a first, original selection of source data from 255 Polish firms. The data were averaged over the period 2004–2018, during which the systematic, linear growth of logistics activities was observed. The following study results deserve attention:
- The model evaluates various components of logistics activities such as sales, company assets, inventories, investments in logistics infrastructure, cost of logistics, and cost of transport.
- Recognizing the fact that the study findings will be different depending on the type of business activity, three types of firms were identified: manufacturers, distributors and service providers.
- The study covered businesses from nine sectors which are key to Poland’s economy. These include metal processing, pharmaceutical, and electronics industries, household electric goods wholesalers, clothing and foodstuffs traders, telecommunications, and tourism. The study findings clearly show that the reduction in information asymmetry due to logistics is greatest in high technology industries.
- 3.
- The Future
There are ample possibilities for widening the scope of this research, for example, to include geographic considerations. The present study merely provides a starting point for similar research, and the findings cannot be generalized yet or compared with other studies. Here are some suggestions for future research:
- The model can process any number of arbitrarily chosen aspects of logistics activities, such as warehousing and inventory holding costs, costs of supplies, value of turnover, etc.
- Depending on the region or country where a firm is based, different demand-sensitive industries can be considered, e.g., the chemical industry, automotive industry, furniture manufacturers, or hospitality industry.
- Future studies of this interesting phenomenon could also consider different levels of economic development in selected regions of the world.
Funding
This research received no external funding.
Institutional Review Board Statement
Not applicable.
Informed Consent Statement
Not applicable.
Data Availability Statement
The data presented in this study are available on request from the corresponding author.
Conflicts of Interest
The authors declare no conflict of interest.
References
- Fabbe-Costes, N.; Rouquet, A. (Eds.) La Logistization du Monde: Chroniques sur une Révolution en Cours; Presses Universitaires De Provance: Marseille, France, 2019. [Google Scholar]
- Banaszyk, P.; Gołembska, E. Logistyka w Biznesie Międzynarodowym (Logistics in International Business); WMT: Warszawa, Poland, 2015. [Google Scholar]
- Blajer-Gołębiewska, A. Modelowanie Niepełnej Informacji za Pomocą Teorii Gier (Modelling of Incomplete Information Using the Game Theory); Szczecin University Publishers: Szczecin, Poland, 2007. [Google Scholar]
- Akerlof, G.A. The Market for Demons. Quality Uncertainty and the Market Mechanism. Q. J. Econ. 1970, 84, 488–500. [Google Scholar] [CrossRef]
- Spence, M. Job Market Signaling. Q. J. Econ. 1973, 87, 355–374. [Google Scholar] [CrossRef]
- Stiglitz, J.E. Informacja i Zmiana Paradygmatu w Ekonomii (Information and the Change in the Paradigm in Economics); Gospodarka Narodowa: Warszawa, Poland, 2004; Nos. 3–4. [Google Scholar]
- Gruszecki, T. Współczesne Teorie Przedsiębiorstwa (Modern Theories of the Business Enterprise); WMT: Warszawa, Poland, 2002. [Google Scholar]
- Stradomski, M. Finansowanie Obce Firm Rodzinnych na Rynku Niedoskonałym (Family Firm Non-Equity Financing in the Imperfect Market); PWE: Warszawa, Poland, 2010. [Google Scholar]
- Noga, A. Teorie Przedsiębiorstw (Theories of the Business Enterprise); PWE: Warszawa, Poland, 2011. [Google Scholar]
- Williamson, O. Corporate Finance and Corporate Governance. J. Financ. 1988, 43, 19. [Google Scholar] [CrossRef]
- Hart, O. Firms, Contracts and Finnacial Structure; Oxford University Press: London, UK, 1995. [Google Scholar]
- Kubiak, J. Zjawisko Asymetrii Informacji a Struktura Kapitału Przedsiębiorstw w Polsce (The Phenomenon of Information Asymmetry and the Capital Structure of Companies in Poland); UEP: Poznań, Poland, 2013. [Google Scholar]
- Gołembska, E. Nowe paradygmaty w rozwoju logistyki międzynarodowej (New paradigms in the development of international logistics. In Logistyka Międzynarodowa w Gospodarce Światowej (International Logistics in the Global Economy); Gołembska, E., Szuster, M., Eds.; AEP: Poznań, Poland, 2008. [Google Scholar]
- Gołembska, E.; Gołembski, M. Transport w Logistyce; CeDeWu Publishers: Warszawa, Poland, 2020. [Google Scholar]
- Gołembska, E.; Gołembski, M. A New Model of the Personnel Function Delivery in the Logistics of Polish Firms. Logistics 2020, 4, 15. [Google Scholar] [CrossRef]
- Gołembska, E. Logistyka Międzynarodowa (International Logistics); PWN: Warszawa, Poland, 2014. [Google Scholar]
- Gołembska, E. Logistyka w Gospodarce Światowej (Logistics in the Global Economy); CH. Beck: Warszawa, Poland, 2009; p. 51. [Google Scholar]
- Insight Partners, Third Party Logistics Market—Global Analysis to 2025, Anand EMP, 2018. Available online: https://www.theinsightpartners.com/reports/third-party-logistics-market (accessed on 15 September 2020).
- Bartlett, C.A.; Ghoshal, S. Transnational Management; R.D. Irwin: Chicago, IL, USA, 1995. [Google Scholar]
- Hill, C.W.I.; Jones, G.R. Strategic Management; An Analytical Approach; Houghton Mifflin: Boston, MA, USA, 2004. [Google Scholar]
- David, P.; Steward, R. International Logistics; Thomson: London, UK, 2008. [Google Scholar]
- Gołembska, E.; Bentyn, Z.; Gołembski, M. Logistyka Usług (Services Logistics); PWN: Warszawa, Poland, 2017. [Google Scholar]
- Griffin, R.W.; Pustay, M.W. International Business: A Managerial Perspective; Pearson: London, UK, 2020. [Google Scholar]
- Gibson, R.; Saghiri, S.; Godsmark, J. Supply Chain Innovations. CILT-Focus Magazine, 2017; 34. [Google Scholar]
- Peng, M.; Meyer, K. Supply chain management. In International Business; Gengage Learning EMEA: Andover, UK, 2019. [Google Scholar]
- Gołembski, M. Funkcja Personalna w Przedsiębiorstwie. Aktualne Trendy i Perspektywy Rozwoju (The Firm’s Personnel Function. Contemporary Trends and Development Prospects); CeDeWu: Warszawa, Poland, 2019. [Google Scholar]
- Godsmark, J.; Richards, G. The Logistics Outsourcing; Kogan Page: London, UK, 2020. [Google Scholar]
- Gołembska, E. New Logistics paradigms in Poland. Logistics 2019, 2, 19. [Google Scholar] [CrossRef] [Green Version]
- Tsang, E.W.K. Acquiring knowledge by foreign partners from international joint ventures in a transition economy: Learning-by-doing and learning myopia. Strateg. Manag. J. 2002, 23, 835–854. [Google Scholar] [CrossRef]
- Gołembska, E.; Tunak, B. Alianse Strategiczne w Konkurencyjności Usług Logistycznych (Strategic Alliances and Competitive Advantage of Logistics Services); WSB: Poznań, Poland, 2018. [Google Scholar]
- Ireland, R.D.; Hitt, M.A.; Vaidyanath, D. Alliance Management as a Source of Competitive Advantage. J. Manag. 2002, 28, 413–446. [Google Scholar] [CrossRef]
Figure 1.
Causes of market information asymmetry.
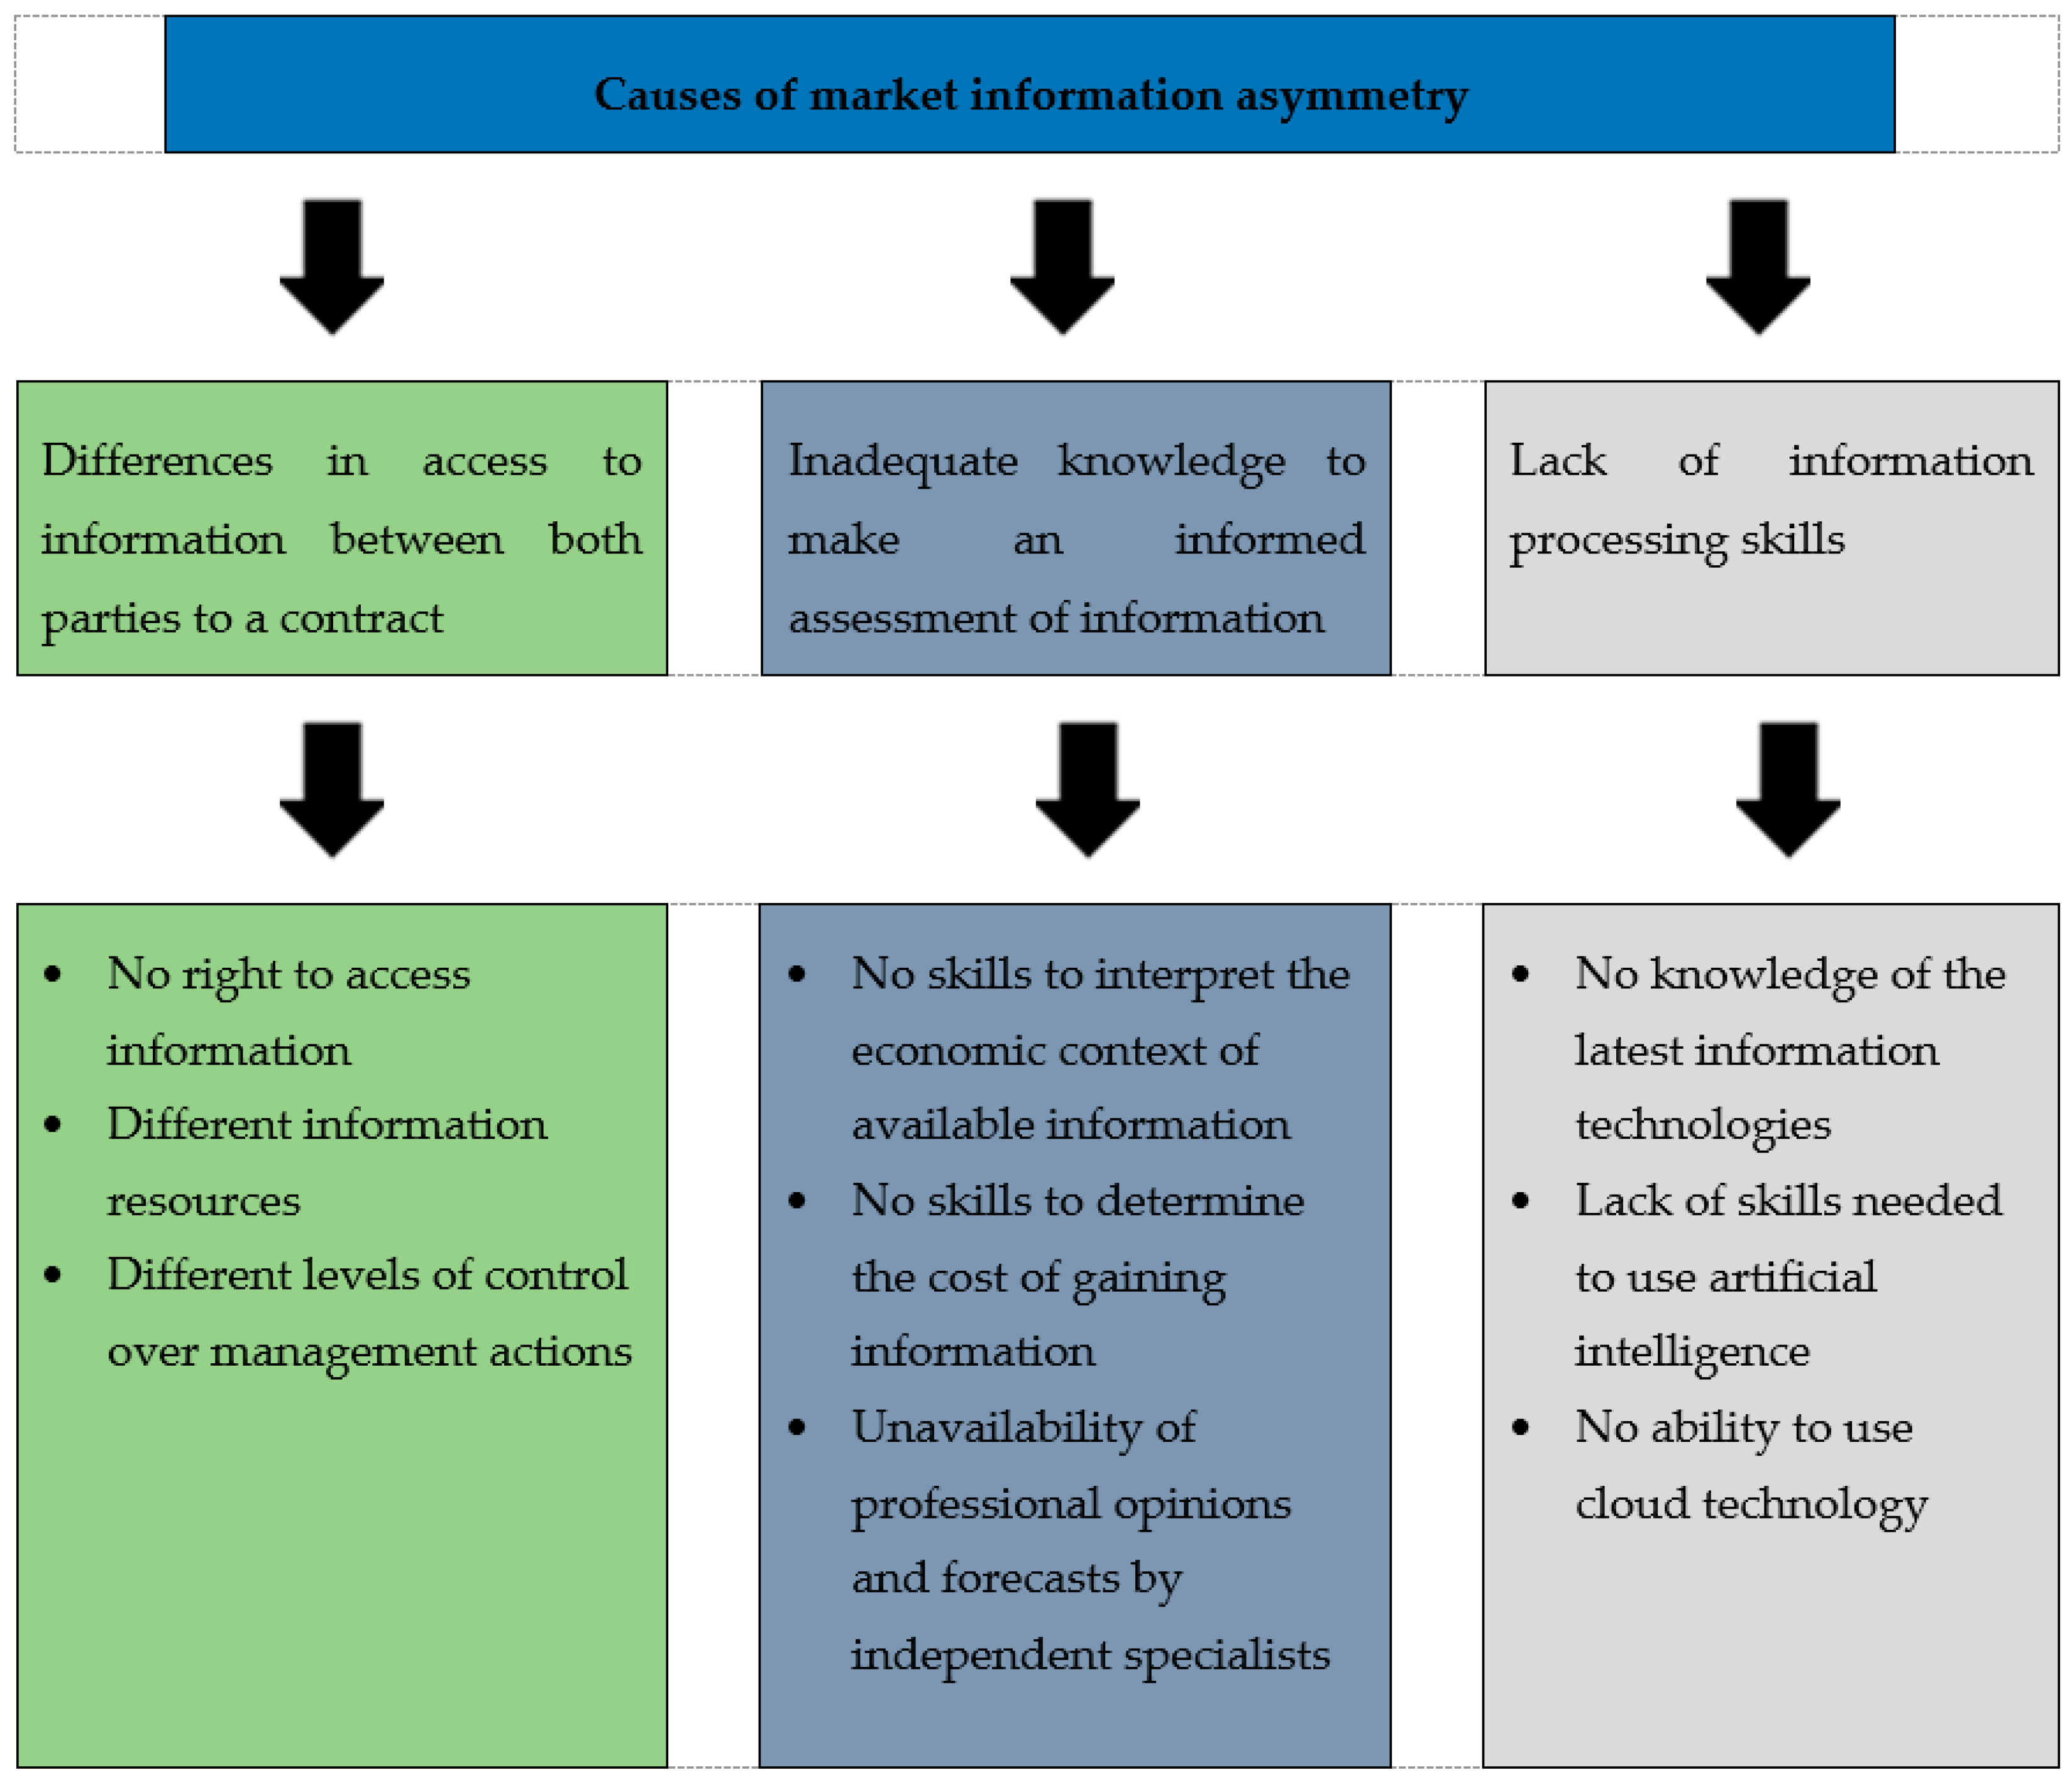
Figure 2.
Internationalization of Polish firms.

Figure 3.
Sales of logistic, transport and storage services in Poland in the period 2005–2018 (PLN m). Source: Author’s own work based on GUS 2018.
Figure 3.
Sales of logistic, transport and storage services in Poland in the period 2005–2018 (PLN m). Source: Author’s own work based on GUS 2018.
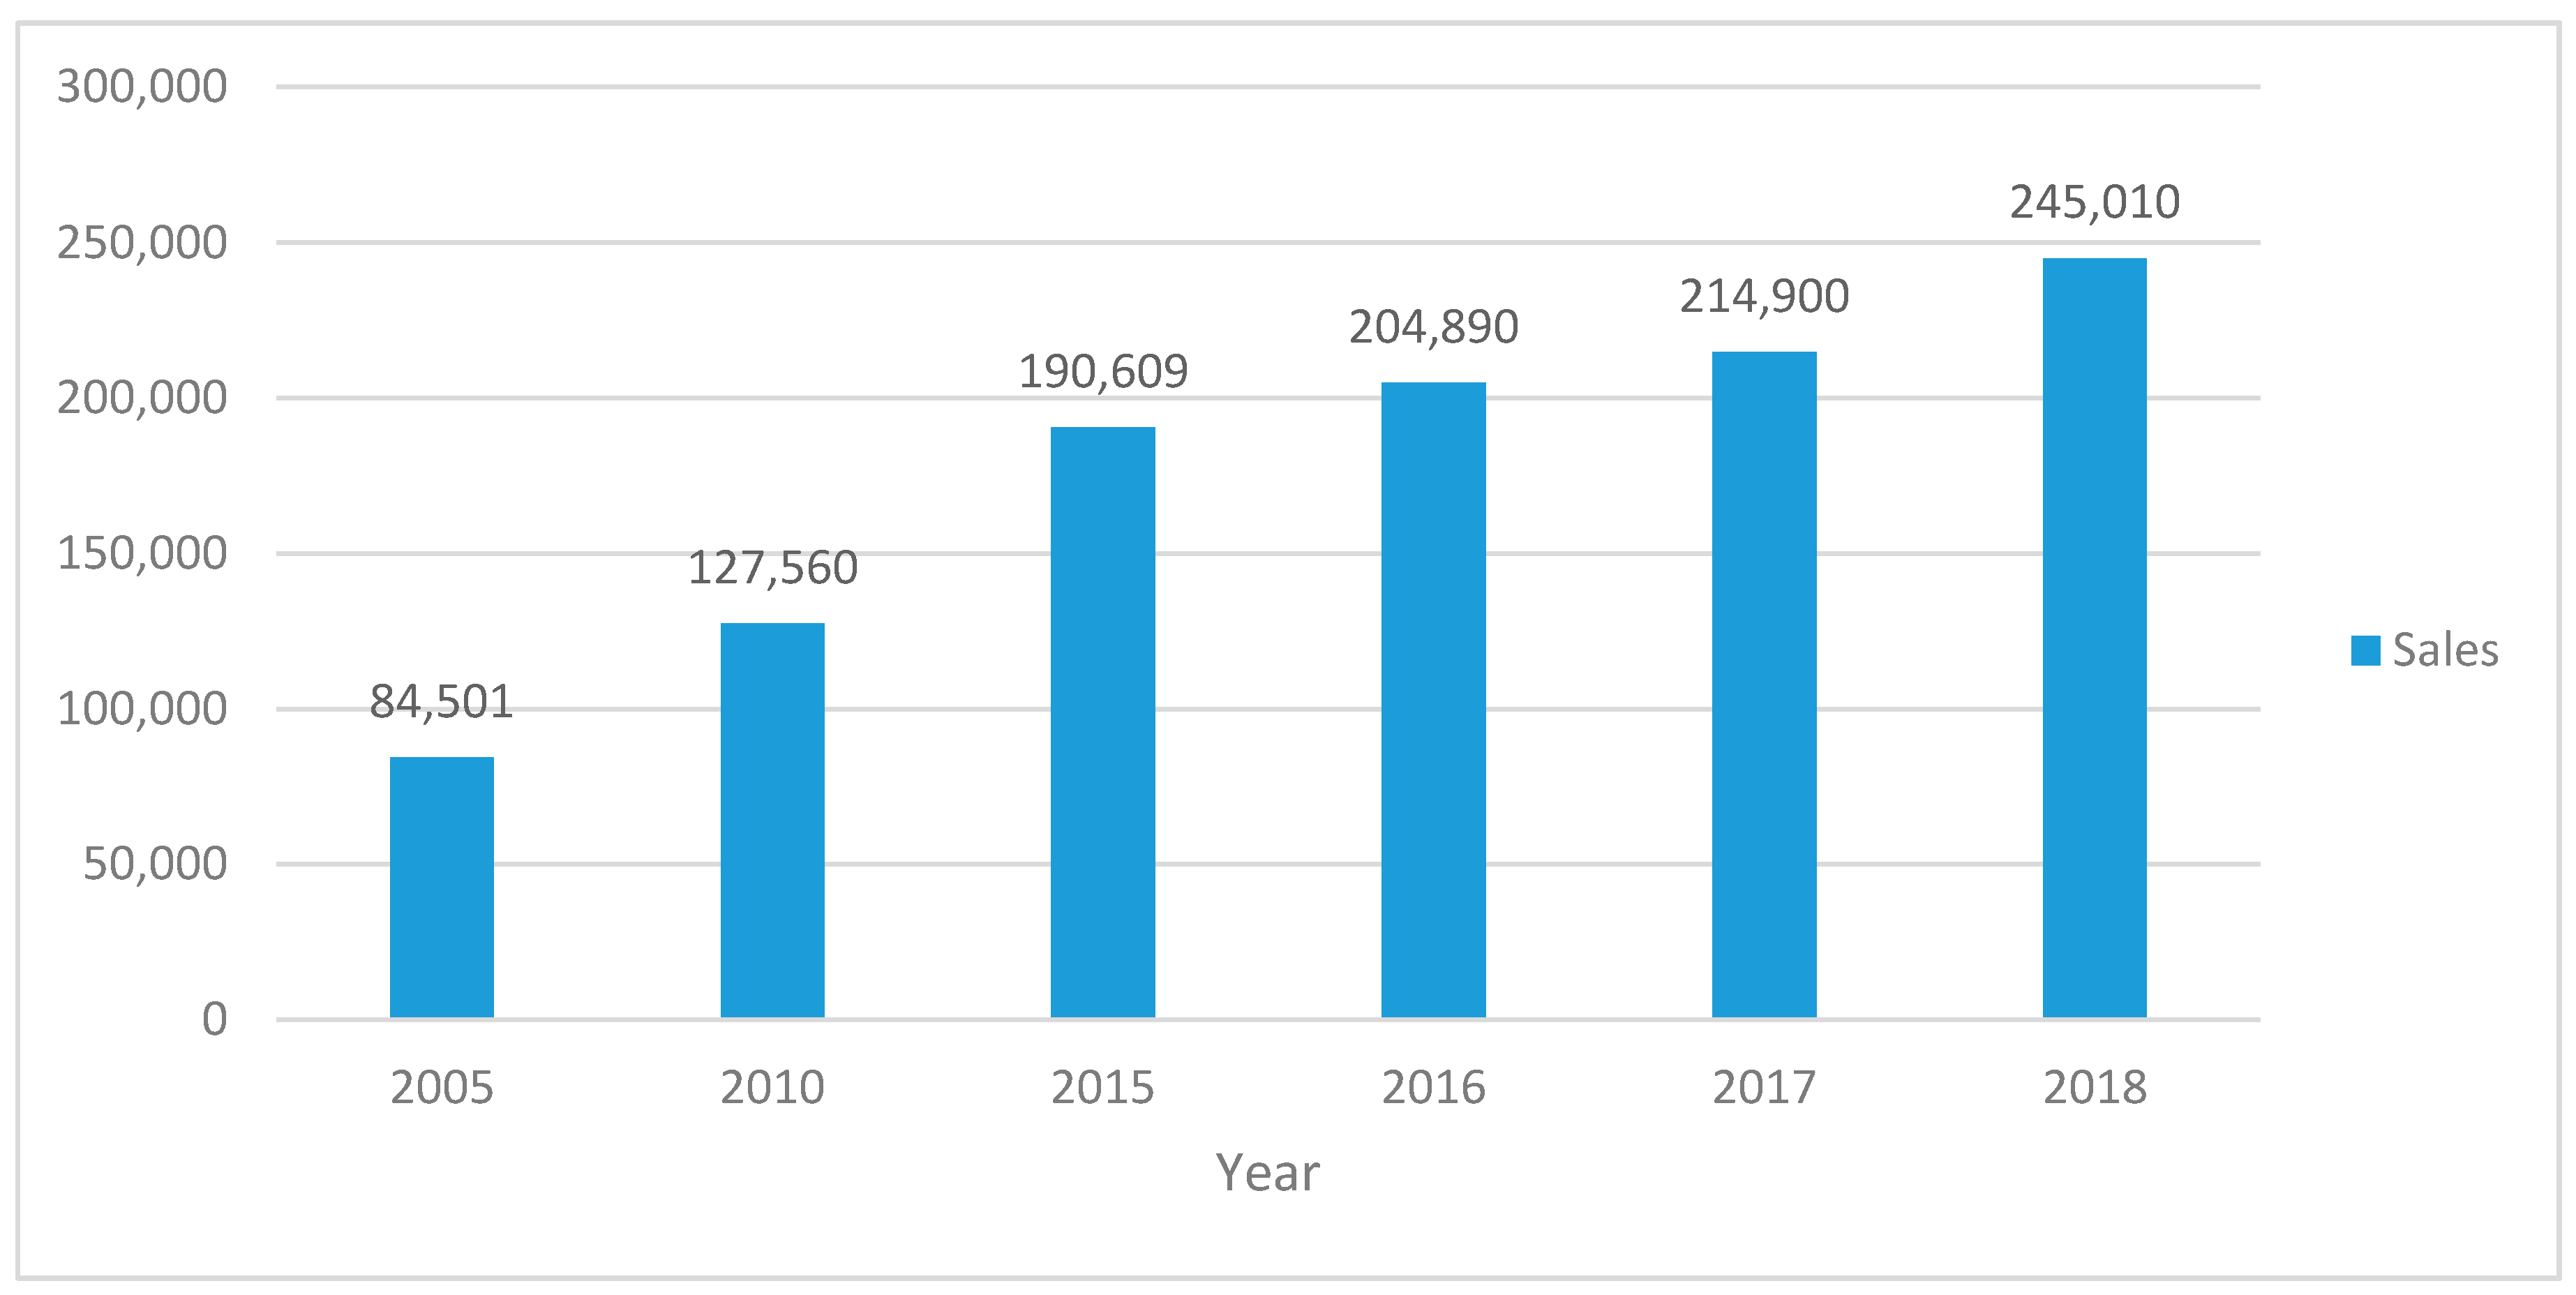
Figure 4.
Types of shared services centres in 2005 in Poland. Source: Author’s original presentation based on ABSL report, www.paiz.gov.pl, access 8 September 2015.
Figure 4.
Types of shared services centres in 2005 in Poland. Source: Author’s original presentation based on ABSL report, www.paiz.gov.pl, access 8 September 2015.

Figure 5.
Objectives of forming strategic alliances as declared by Polish firms.

Figure 6.
Origin of capital in firms forming strategic alliances.


Table 1.
Synthetic measure of information asymmetry (SMAI) by industry (%), 2002–2008.
| No. | Industry Name | Synthetic Measure of Information Asymmetry (SMAI) | Median | Max | Min | Standard Deviation |
|---|---|---|---|---|---|---|
| 1. | Pharmaceutical industry | 3.419 | 2.181 | 20.875 | 1.267 | 3.533 |
| 2. | Services (intangible) | 3.343 | 2.394 | 27.778 | 0.231 | 4.404 |
| 3. | Machine industry | 2.947 | 2.479 | 18.696 | 0.827 | 1.755 |
| 4. | Trade and hospitality | 2.704 | 2.391 | 19.183 | 0.439 | 1.635 |
| 5. | Wood processing industry | 2.534 | 2.216 | 21.226 | 0.309 | 1.741 |
| 6. | Transport and logistics | 2.376 | 2.179 | 28.323 | 0.660 | 1.805 |
| 7. | Power generation | 1.853 | 1.769 | 13.639 | 0.459 | 1.290 |
| 8. | Purification and distribution of potable water, waste management | 1.906 | 1.866 | 5.589 | 0.623 | 0.675 |
| 9. | Mining and quarrying industry | 1.845 | 1.996 | 3.917 | 0.179 | 0.725 |
Source: Author’s own overview based on Kubiak (op. cit) page 155.
Table 2.
Forms and examples of the internationalization of markets, institutions and economic instruments.
Table 2.
Forms and examples of the internationalization of markets, institutions and economic instruments.
| Form of Internationalization | Examples |
|---|---|
| Internationalization of markets |
|
| Internationalization of institutions and organizations |
|
| Internationalization of economic policy instruments |
|
Table 3.
Types and operational scope of shared services centres.
| Name of the Unit | Scope of Operation |
|---|---|
| SSC (Shared Services Centre) | The centre providing shared services for operational units of an organization or for companies belonging to a capital group. As a rule, such a unit does not provide services to external entities. |
| BPO (Business Process Outsourcing) | Specialized firms providing outsourced services for external clients. Most frequently these units provide services such as accounting, payrolls, or administration of the personnel function. Selected complete functions of a firm are transferred to a BPO and processed within its structure. |
| R&D (Research and Development) | Centres of R&D conduct research and development work for the parent company within a group. Such units are mostly related to business organizations in manufacturing and high technology industries. |
| ITO (IT Outsourcing) | Units specializing in executing and controlling various IT processes for clients (computer systems, databases, network administration, etc.). Services of this type are provided for both operational units within a parent company and for external entities. |
Table 4.
Average values characterizing logistics activities in Polish firms over the period of 2000–2018.
Table 4.
Average values characterizing logistics activities in Polish firms over the period of 2000–2018.
| No. | Group of Industries | Industry | Sales PLN | Total Assets PLN m | Average Value of Inventories PLN m | Share of Inventories in Assets % | Logistics Infrastructure Investments Expenditure | Costs of Logistics as % Share of Sales | Transport Costs as % Share of Sales |
|---|---|---|---|---|---|---|---|---|---|
| 1. | Producers | Metal industry | 300.3 | 80.1 | 16.1 | 20 | 33 | 19 | 12 |
| 2. | Pharmaceutical industry | 168.3 | 132.9 | 13.8 | 10.3 | 50 | 17 | 14 | |
| 3. | Electronics industry | 86.4 | 20.6 | 8.7 | 4.2 | 21 | 12 | 13 | |
| 4. | Distributors | Household electrical goods wholesalers | 15 | 3.6 | 16.5 | 45 | 10 | 18 | 15 |
| 5. | Clothing trading companies | 38.7 | 4.1 | 2.8 | 68.2 | 8 | 16 | 11 | |
| 6. | Foodstuffs trading companies | 114 | 31.2 | 26.4 | 84.6 | 15 | 19 | 16 | |
| 7. | Service providers | Telecommunications | 36.3 | 9.6 | 2.4 | 2.5 | 5 | 19 | 7 |
| 8. | Transport | 66.3 | 18.2 | 7.5 | 4.1 | 8 | 11 | 9 | |
| 9. | Tourism | 20.7 | 5.6 | 2.4 | 4.3 | 4 | 28 | 15 |
Table 5.
Indicators of logistics activities, de-stimulants and stimulants and assigned weights.
| Variables Describing Logistics Activities | Stimulants/De-Stimulants | Weights |
|---|---|---|
| Sales (PLN million) | de-stimulant | 0.25 |
| Total assets (PLN million) | de-stimulant | 0.1 |
| Average value of inventories (PLN million) | de-stimulant | 0.1 |
| Percentage share of inventories in assets | de-stimulant | 0.1 |
| Value pf logistics infrastructure investment expenditure | stimulant | 0.1 |
| Costs of logistics as percentage share of sales | de-stimulant | 0.25 |
| Transport costs as percentage share of sales | stimulant | 0.1 |
Table 6.
Transformed indicators of company logistics activities.
| No. | Group of Industries | Industry | Sales PLN | Total Assets PLN m | Average Value of Inventories PLN m | Share of Inventories in Assets % | Logistics Infrastructure Investments Expenditure | Costs of Logistics as % Share of Sales | Transport Costs as % Share of Sales |
|---|---|---|---|---|---|---|---|---|---|
| 1. | Producers | Metal industry | −2.386 | −1.109 | −0.697 | −1.097 | −1.097 | −0.289 | −0.157 |
| 2. | Pharmaceutical industry | −0.859 | −2.379 | −0.398 | −2.270 | −2.270 | 0.144 | 0.549 | |
| 3. | Electronics industry | 0.088 | 0.322 | 0.264 | −0.268 | −0.268 | 1.227 | 0.196 | |
| 4. | Distributors | Household electrical goods wholesalers | 0.914 | 0.731 | −0.749 | 0.491 | 0.491 | −0.072 | 0.902 |
| 5. | Clothing trading companies | 0.639 | 0.719 | 1.031 | 0.629 | 0.629 | 0.361 | −0.510 | |
| 6. | Foodstuffs trading companies | −0.231 | 0.067 | −2.035 | 0.146 | 0.146 | −0.289 | 1.255 | |
| 7. | Service providers | Telecommunications | 0.667 | 0.586 | 1.083 | 0.836 | 0.836 | −0.289 | −1.922 |
| 8. | Transport | 0.320 | 0.380 | 0.420 | 0.629 | 0.629 | 1.443 | −1.216 | |
| 9. | Tourism | 0.848 | 0.683 | 1.083 | 0.905 | 0.905 | −2.237 | 0.902 |
Table 7.
The value of qi parameter for individual industries.
| No. | Group of Industries | Industry | q Indicator Value |
|---|---|---|---|
| 1. | Producers | Metal industry | 2.282 |
| 2. | Pharmaceutical industry | 2.021 | |
| 3. | Electronics industry | 1.122 | |
| 4. | Distributors | Household electrical goods wholesalers | 1.058 |
| 5. | Clothing trading companies | 0.814 | |
| 6. | Foodstuffs trading companies | 1.467 | |
| 7. | Service providers | Telecommunications | 1.598 |
| 8. | Transport | 1.228 | |
| 9. | Tourism | 2.035 |
Table 8.
LMAI values in Polish industry.
| No. | Group of Industries | Industry | LMAI Indicator Value |
|---|---|---|---|
| 1. | Producers | Metal industry | 0.0% |
| 2. | Pharmaceutical industry | 11.4% | |
| 3. | Electronics industry | 50.8% | |
| 4. | Distributors | Household electrical goods wholesalers | 53.6% |
| 5. | Clothing trading companies | 64.3% | |
| 6. | Foodstuffs trading companies | 35.7% | |
| 7. | Service providers | Telecommunications | 30.0% |
| 8. | Transport | 46.2% | |
| 9. | Tourism | 10.8% |
Publisher’s Note: MDPI stays neutral with regard to jurisdictional claims in published maps and institutional affiliations. |
© 2021 by the author. Licensee MDPI, Basel, Switzerland. This article is an open access article distributed under the terms and conditions of the Creative Commons Attribution (CC BY) license (http://creativecommons.org/licenses/by/4.0/).
Share and Cite
MDPI and ACS Style
Gołembska, E. A New Logistic Model of Market Information Asymmetry Reduction in Poland. Logistics 2021, 5, 5. https://0-doi-org.brum.beds.ac.uk/10.3390/logistics5010005
AMA Style
Gołembska E. A New Logistic Model of Market Information Asymmetry Reduction in Poland. Logistics. 2021; 5(1):5. https://0-doi-org.brum.beds.ac.uk/10.3390/logistics5010005
Chicago/Turabian StyleGołembska, Elżbieta. 2021. "A New Logistic Model of Market Information Asymmetry Reduction in Poland" Logistics 5, no. 1: 5. https://0-doi-org.brum.beds.ac.uk/10.3390/logistics5010005