
China–Pakistan Economic Corridor, Logistics Developments and Economic Growth in Pakistan

1
Department of Economics, National College of Business Administration & Economics, Lahore 54660, Pakistan
2
Department of Management Sciences, COMSATS University Islamabad, Sahiwal Campus, Sahiwal 57000, Pakistan
*
Author to whom correspondence should be addressed.
Logistics 2021, 5(2), 35; https://0-doi-org.brum.beds.ac.uk/10.3390/logistics5020035
Submission received: 17 April 2021
/
Revised: 25 May 2021
/
Accepted: 27 May 2021
/
Published: 7 June 2021
Abstract
:The study aims to analyze the impact of China–Pakistan Economic Corridor (CPEC) logistics-related developments on economic growth in Pakistan. The study defined a Cobb–Douglas type of research framework in which the country’s real income level relates to four factor inputs, e.g., employed labor force, logistics development, financial development, and energy consumption in an economy. The study utilized the time series data set for the period 1972–2018. To estimate the long run relationship and short run adjustment mechanism, the study used Johansen’s method of co-integration and error correction model. Estimated results showed that the country’s logistics developments have a significant positive impact on economic growth in both the long run and the short run. It implies that China–Pakistan collaborative efforts for logistics developments will have a strong positive impact on economic growth in Pakistan.
1. Introduction
China’s One Belt and One Road (B & R) Initiative is a giant project, under which the Chinese government intends to reconstruct the ancient ‘Silk Road’ in a contemporary mode in the vast area extending from China to Europe [1]. It aims to promote the economic prosperity of the countries along the Belt and Road through regional connectivity. A large number of infrastructure development projects such as highways, railways, pipelines, electric transmission networks, airports, and various other related matters are under construction in China, the Central Asian countries and in various parts of connected countries. In total, there are about sixty-five countries belonging to Europe, Africa, Asia, and Pacific areas who are involved in this project. Another important aspect of this B & R Initiative is the upgradation of the energy sector. China intends to perform not only the exploration and exploitation of energy resources areas, but also intends to set up new power plants, refineries, electric transmission stations, electric wire networks, and pipelines. It has six economic corridors that connect almost 65 countries of 4.4 billion people altogether. Once the transport corridors and energy projects are completed, China intends to set up the industrial zones and utilize the domestic supplies of labor and raw materials in these areas. China has established about 118 special zones in 50 countries, and in these 50 countries, 23 countries and 77 zones are within the B & R I’s geographical boundaries. Thus, the B & R initiative would be able to create a global market that has multiple employment and investment opportunities not only for China but also for other Central Asian economies across the belt.
The Chinese B & R initiatives have wide economic significance worldwide, and particularly for the Chinese economy, in terms of resource mobilization and resource security. The Chinese economy would gain in terms of easy and speedy access to the raw materials markets in African countries and oil and liquefied gas supplies from the oil-producing Arabian countries. Simultaneously, it will open up new markets for Chinese exports and diversify the potential market risk in view of increasing protectionist policies in the US market and the slow economic growth patterns in European economies. Moreover, it is also an important step towards the internationalization of the Chinese currency ‘the Yaun’, utilization of foreign currency reserves and excess production capacities, and the development of underdeveloped Western provinces in China [1]. On the other hand, the participating countries in Central Asia and the Southeast will benefit in terms of improved logistics via huge investments in infrastructure sector developments.
Like many others, Pakistan is also among the countries list where these revolutionary developments are in process under this B & R Initiatives program and the China–Pakistan Economic Corridor (CPEC) was initiated in the year 2013. The priority areas of CPEC developments include regional connectivity, diverse investment opportunities, economic cooperation, socioeconomic development, tourism development and security and stability of the southeast region. A large number of projects related to road, rail, air, telecom and Gwader port developments are undertaken and in near completion stages (see the list in Table 1). Under CPEC, there are 5 Highway development projects that will connect the China Khunjrab to Gwadar Port Pakistan thorough the western and eastern routes. CPEC investments benefits would not only limited to China and Pakistan’s logistics industry but will have positive impact on other neighboring countries such as Iran, Afghanistan, India, Central Asian Republic region. Recently, Iran and China both agreed to work on a 25-year Cooperation Program. Under this cooperation, China would invest about US$400 billion in the Iranian economy over the period of the next 25 years and would benefit from a smooth and low-priced huge supply of oil in exchange. It would also boost a variety of economic activities such as oil mining, industrial development, transportation infrastructure, agricultural collaborations, as well as cultural and tourism activities among both partner countries. Moreover, all these cooperation programs would also benefit the partner countries in terms of geopolitical context as well. These will further strengthen the ties between China, Pakistan, and Iran, especially in view of US sanctions on Iran, and would also build pressure on the Indian economy [2].
Literature has evidenced that regional cooperation and integration helps to accelerate economic growth, reduce poverty and economic disparities among the participating countries [3]. It is unfortunate that the regional integration among the South Asian countries is very limited, because of unfavorable geopolitical and economic conditions. As per the traditional trade theory, e.g., Ricardian and Heckscher–Ohlin trade models, South Asian economies have limited opportunities for intraregional trade as the countries have comparative advantages in similar products like cotton, textiles, and primary goods production [4]. Additionally, the geopolitical conditions, religion, and historical events, such as the India–Pakistan wars, the Kashmir issue, the Afghan war, China–India cross-border tensions, are not favorable for intraregional trade. Given these conditions, the underlying project of CPEC, which is a small part of the Chinese One Belt and One Road Initiative, aims to accelerate the process of economic growth by fostering the economic cooperation and deeper regional integration among the countries [3].
Logistics Industry of Pakistan
The Pakistan logistics industry comprises rail, road, air, and water transport infrastructure and related vehicles, communication sources, and storage facilities in the economy. The logistics industry (headed under the name of “Transportation, Storage and Communication” in the Pakistan Economic Survey and SBP Annual reports) is growing fast and its total contribution in GDP swelled up to 13.4 percent in the year 2016 started from 5 percent in year 1951 [5]. It employed approximately 3 million people per annum and its employment share is about 5.1 percent of the total employed labor force in the period 2013–2014 [5]. The road transport sector carries about 93 percent of passengers’ traffic and 96 percent of inland freight traffic, while the share of Pakistan Railways is limited to only 7 percent to 6 percent respectively in year 2013–14. This modal imbalance not only overburdening the road systems, but also creating traffic congestion, environmental pollutions, road damaging, etc. There are 46 airports including 12 international airports that provide commercial services for both passengers and cargo movements. The Pakistan International Airlines (PIA) carries about 87 percent of the passenger traffic, while Airblue and Shaheen capture the remaining part [6]. The inland total traffic by road and rail is estimated to be 614 billion passenger kilometers (BP-KM) and 381 billion ton-kilometers (BT-KM), respectively, in the year 2018. There are two fully functional ports in the country and almost 95% of exports and imports are supported by these Karachi Port Trust and Port Qasim Authorities.
The country’s logistics development and performance evaluation is necessary to improve at policy formulation level [7]. However, attempts to develop and measure the logistics performance index of a country and its impact on economic growth is a little. For example, Kuzu and Önder measured the logistics performance via turnover index of transportation and storage and relates it to economic growth [8]. While Hooi Lean, Huang and Hong [9] used the road, rail network, and waterway infrastructure as a proxy to country’s logistics development (performance) and linked it with economic growth. Limão and Venables [10] measured it via construction of an infrastructure performance index based on four indicators, namely, road length (length in kilometers), paved roads (length in kilometers) and railways (network length in kilometers), and the number of telephone connections (in numbers). Similarly, a number of studies have utilized the electricity generation, telecommunications, and access to roads and highways as an economic driver of economic growth in Pakistan utilizing a different set of variables in different time periods [11,12,13], but no attempt has been made to investigate the impact of the logistics industry as aggregate on the economy. The reason might be the unavailability of an indicator that may track the developments related to the logistics industry as a whole. In order to establish the long-run dynamic relationship of logistics development to economic growth, one needs to develop the long-horizon time series indicator that may also give the insights over time for the country. Therefore, the study revealed that there is a dire need to develop an index to evaluate the logistics developments over time based on a set of selected variables whose data set is available for a longer time period.
Identifying this research gap and its economic significance, the study has the following two main objectives. First, the current study attempts to develop a long-horizon logistics development index for Pakistan economy using a unique combination of various infrastructural and logistics variables for the period 1970–2016. Second, the study examines the long run and short run relationship between logistics development and economic growth in Pakistan. Third, the study would help in analyzing the impact of CPEC logistics-related developments on economic growth in Pakistan.
2. Theoretical Framework
Economic integration moves well when rising intraregional trade is supported by logistics, i.e., improved infrastructure, stronger connectivity networks, and improved trade facilitation measures [14]. Quality logistics improve exports for the countries shifting structure from agriculture to the industrial specialization. Similarly, improvement in logistics has the core objective of regional development in terms of improvement in transportation and communication which ultimately minimizes the cost and improves the production operations [15].
Logistics as a factor of economic growth in developing economies is undeniable [16]. The logistics sector adds to economic growth by following ways. First, infrastructure investments in the development of roads, rail, airports, warehousing, and postal and telecom services increase the employment opportunities and boost the aggregate demand. Second, improvement in logistics infrastructure provides spatial accessibility, as it speeds up the travel, reduces travel time, and saves fuel costs for both passengers and freight [17,18]. The time savings yield economic gains in terms of fast access to distant markets and inputs both work to stimulate local production [19]. Easy transportation means would also help in lowering the firms’ inventories [20]. Additionally, public infrastructure investment has a significant spatial spillover effects both in case of cost savings and productivity gains for private enterprises [21,22]. Infrastructure investments result in lowering the firms’ inventories as well [20]. Third, reductions in transportation and trading cost further accelerate the industrial cluster and agglomeration impacts in the industry and increases the labor productivity. Improvement in logistics has the core objective of regional development in terms of improvement in transportation and communication which ultimately minimizes the cost and improves the production operations [15]. Last, the country’s better infrastructure also attracts foreign investors [23], as well as increasing the return on investment [24].
A developed logistics sector increases the competitiveness and finally improves trade. It is observed as the engine of growth in European trade powerhouses and developing countries such as Vietnam and Indonesia [25]. Karayun, Ibrahim Aydin, and Guimez states that improved logistics would facilitate the safe and timely delivery of goods, which ultimately would improve trade across countries [26]. Reducing supply chain trade barriers improves the efficiency of movement of goods and increases trade and GDP. Kumagai et al., estimated that impact of trade facilitation would increase up to $2.6 trillion globally [27]. Marti, Puertas, and Gracia also confirmed that trade flows improve where logistics performance has been improved especially in case of South America, Africa and Eastern Europe [28]. Keeping in view the aforementioned benefits, the development of logistics corridors (initially) and economic corridors (later stages) remained among the topmost priority areas in developing economies.
Literature evidenced that regional cooperation and integration help to accelerate economic growth, reducing poverty and economic disparities among the participating countries [3]. It is unfortunate that the regional integration among the South Asian countries is very limited, because of unfavorable geopolitical and economic conditions. As per the traditional trade theory, e.g., Ricardian and Heckscher–Ohlin trade models, South Asian economies have limited opportunities for intraregional trade as the countries have comparative advantages in similar products like cotton, textiles, and primary goods production [4]. Moreover, the geopolitical conditions, religion, and historical events, such as the India–Pakistan wars, the Kashmir issue, the Afghan war, China–India cross-border tensions, are not favorable for intraregional trade. However, the underlying project of CPEC aims to curtail these barriers and accelerate the process of economic growth by fostering the economic cooperation and deeper regional integration among the countries and opening trade opportunities to European and other countries of the world [3].
3. Model, Data, and Research Methodology
A large number of studies have used the production function approach, in which infrastructure stocks, e.g., road, rail, energy, and telecom indicators, entered as explanatory variables [29,30,31,32,33]. We followed the same approach and utilized the Cobb–Douglas type of production function that describes the relationship using the endogenous growth theory as follows:
where a country’s real income (Yt) is the function of employed labor units (Lt) and all other economic capital (Kt) that might fuel the economic activities. The capital stock is categorized into financial capital, logistics capital, and, most importantly, the energy capital that fuels all types of operations, e.g., manufacturing, consumption, and services sector in the economy; therefore, we have picked the financial development, logistics development, and energy consumption as drivers of economic growth in the analysis. Empirical evidence proved that financial development is an important determinant in efficient and effective mobilization of resources [34,35,36,37]. Similarly, the electricity consumption affects economic growth directly or as a complement to other factors of production in case of developing and developed economies [38,39,40,41,42]. Finally, logistics facilitate the movement of goods and services from production point to sale market and have market access, market integration, and spillover effects [43,44,45,46]. Following these, we have developed the model as follows:
where we have linked the country’s economic growth (Yt) with labor force (Lt), logistics development (Ldt), financial developments (FDt), and energy sector developments (ECt). By taking log transformation, we obtain the following econometrical models.
The study compiled the time series data set for the 1972–2015 period from published sources like the Handbook of Statistics on Pakistan Economy 2015 [5] and subsequent years’ data from the Annual Economic Surveys of Pakistan economy. Details are listed in Table 1.
The World Bank LPI index was developed on the basis of six important dimensions that the international freight forwarders consider to be important: First, the infrastructure to reach or leave the ports and airports; Second, border agencies at ports and airports; Third, competence of domestic logistics service providers; Fourth the timeliness of delivery; Fifth, tracking and tracing systems for imports and exports; and Sixth is the availability of international shipments when needed [47]. The study relates the well-developed logistics system with the good logistics performance of the economy. World Bank LPI score is calculated on the basis of surveyed responses on these dimensions collected from international freight forwards; however, we assessed the performance of these aspects from the available relevant physical inputs and output indicators. For example, to assess the infrastructure development performance, we have taken the available rail network (length in km) and high type road length (in km). The second dimension relates to the efficiency of border agencies at ports and airports, so we have proxied it by the total port operations exports and imports carried volumes (in tons).The third and fourth dimension relate to the competence of domestic logistics service providers, which we have assessed with the help of rail freight indicators such as number of locomotives (in numbers), total freight wagons (in numbers), and rail freight carried (in ton kilometers). Since 96% of total freight is carried through the trucking industry, we have captured the road freight industry activity by number of trucks delivery vans (numbers) on roads, and finally, the transport fuel consumed to run these vehicles. World Bank LPI’s fifth dimension relates to the availability of telecom infrastructure; therefore, we have taken a number of telecom indicators such as number of postal offices, number of phone connections, and number of public call offices, number of mobile connections in the analysis (see details on data variables and sources in Table 2). World Bank LPI sixth dimension is about the international shipment that depends upon the ports’ operations. For this, we have included the number of vessels, port operations in volume, and deadweight tons in the analysis.
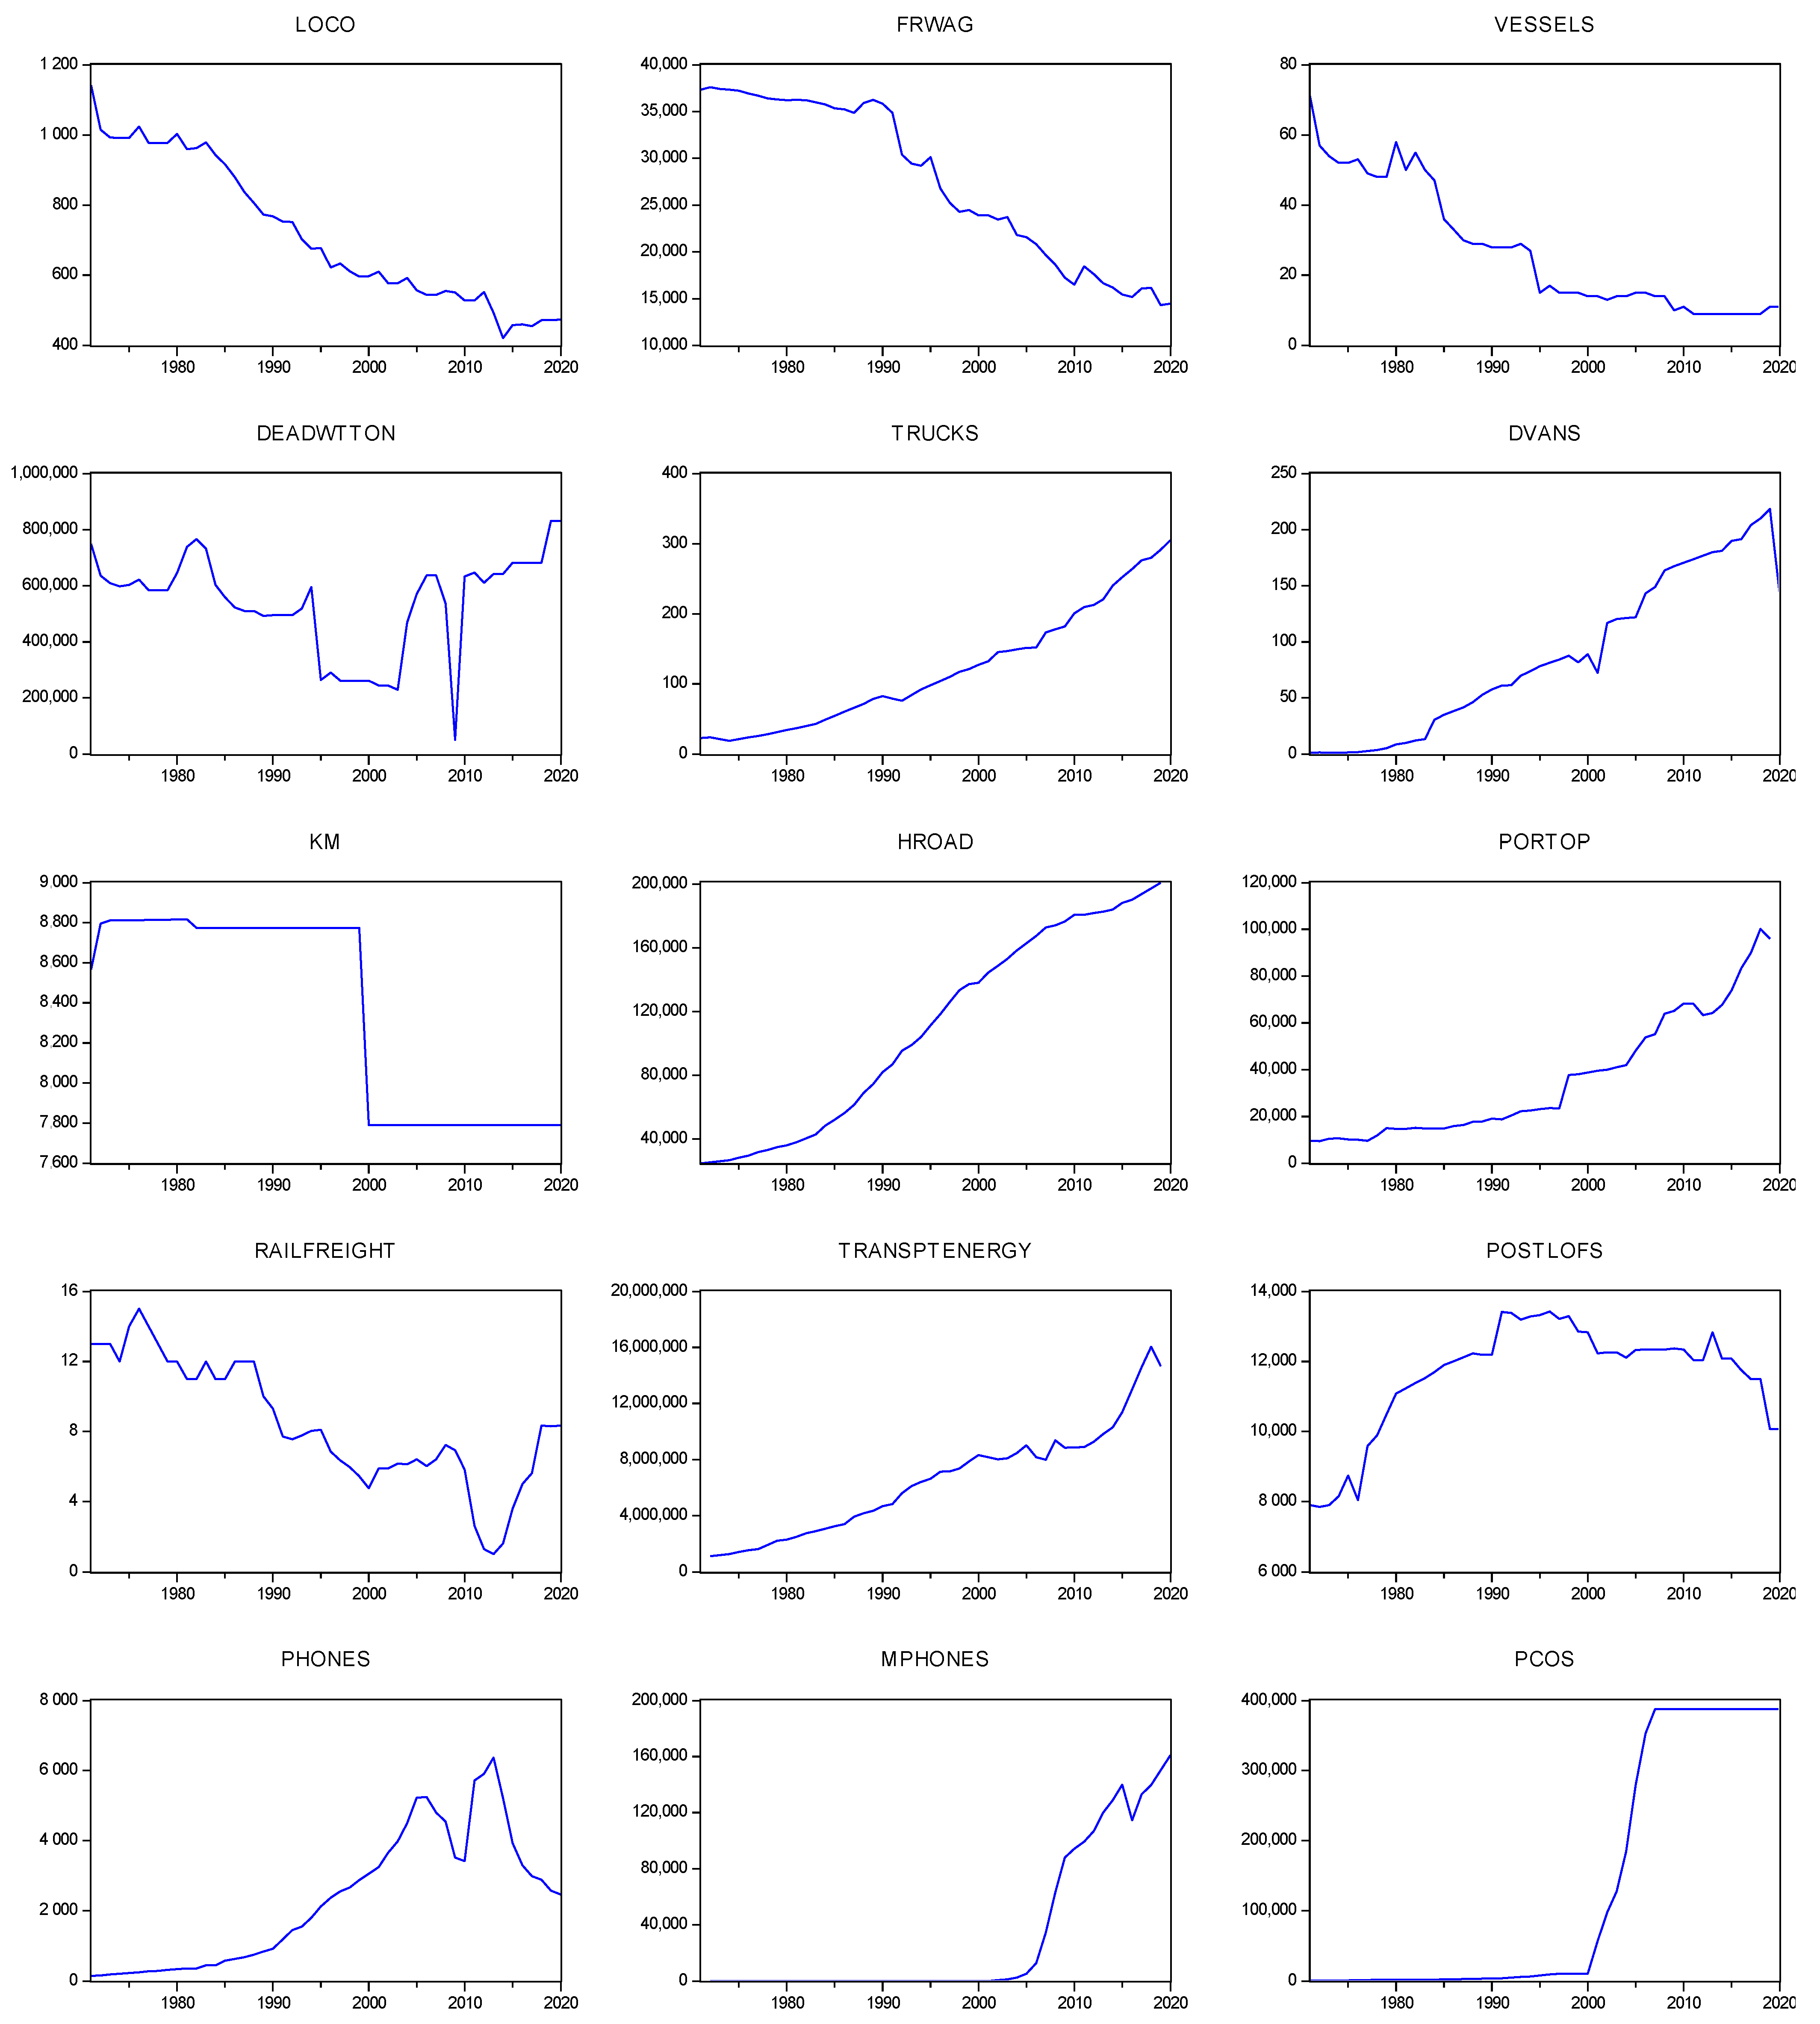
Figure 1 demonstrates that there is a mixed trend among different indicators of logistic development. For example, all indicators of road-based freight transport, such as road length (in km), road freight transport vehicles trucks (in numbers), and goods carrying delivery vans (in numbers), showed the rising trend during the entire period of 1971–2015. In contrast, the declining trend has been observed in case of rail freight transport indicators, such as locomotives (in numbers), freight wagons (in numbers), and associated rail freight carried (in tonnes), during the same period of time. Study revealed that road-based transport sector is contributing positively to the country’s logistics, while the rail sector is contributing to it negatively. Overall, the port operations showed a consistent rise; however, the number of vessels and deadweight tons showed the declining trend (as parts c, d, and e show in Figure 1). Since all these indicators play an important role in the logistic industry, adding all of them together into analysis is really worthwhile [48]. However, incorporating all these indicators in the regression analysis simultaneously poses an econometric problem, as they are interdependent on each other and if they are highly collinear in Table 3 [49]. In this case, principal component analysis is a modern technique that has been utilized to resolve these issues. Although a number of studies have used the PCA in index formation, especially in case of financial development index, telecommunication and infrastructure index development, so far no attempt has been made in terms of the logistics sector [50,51,52].
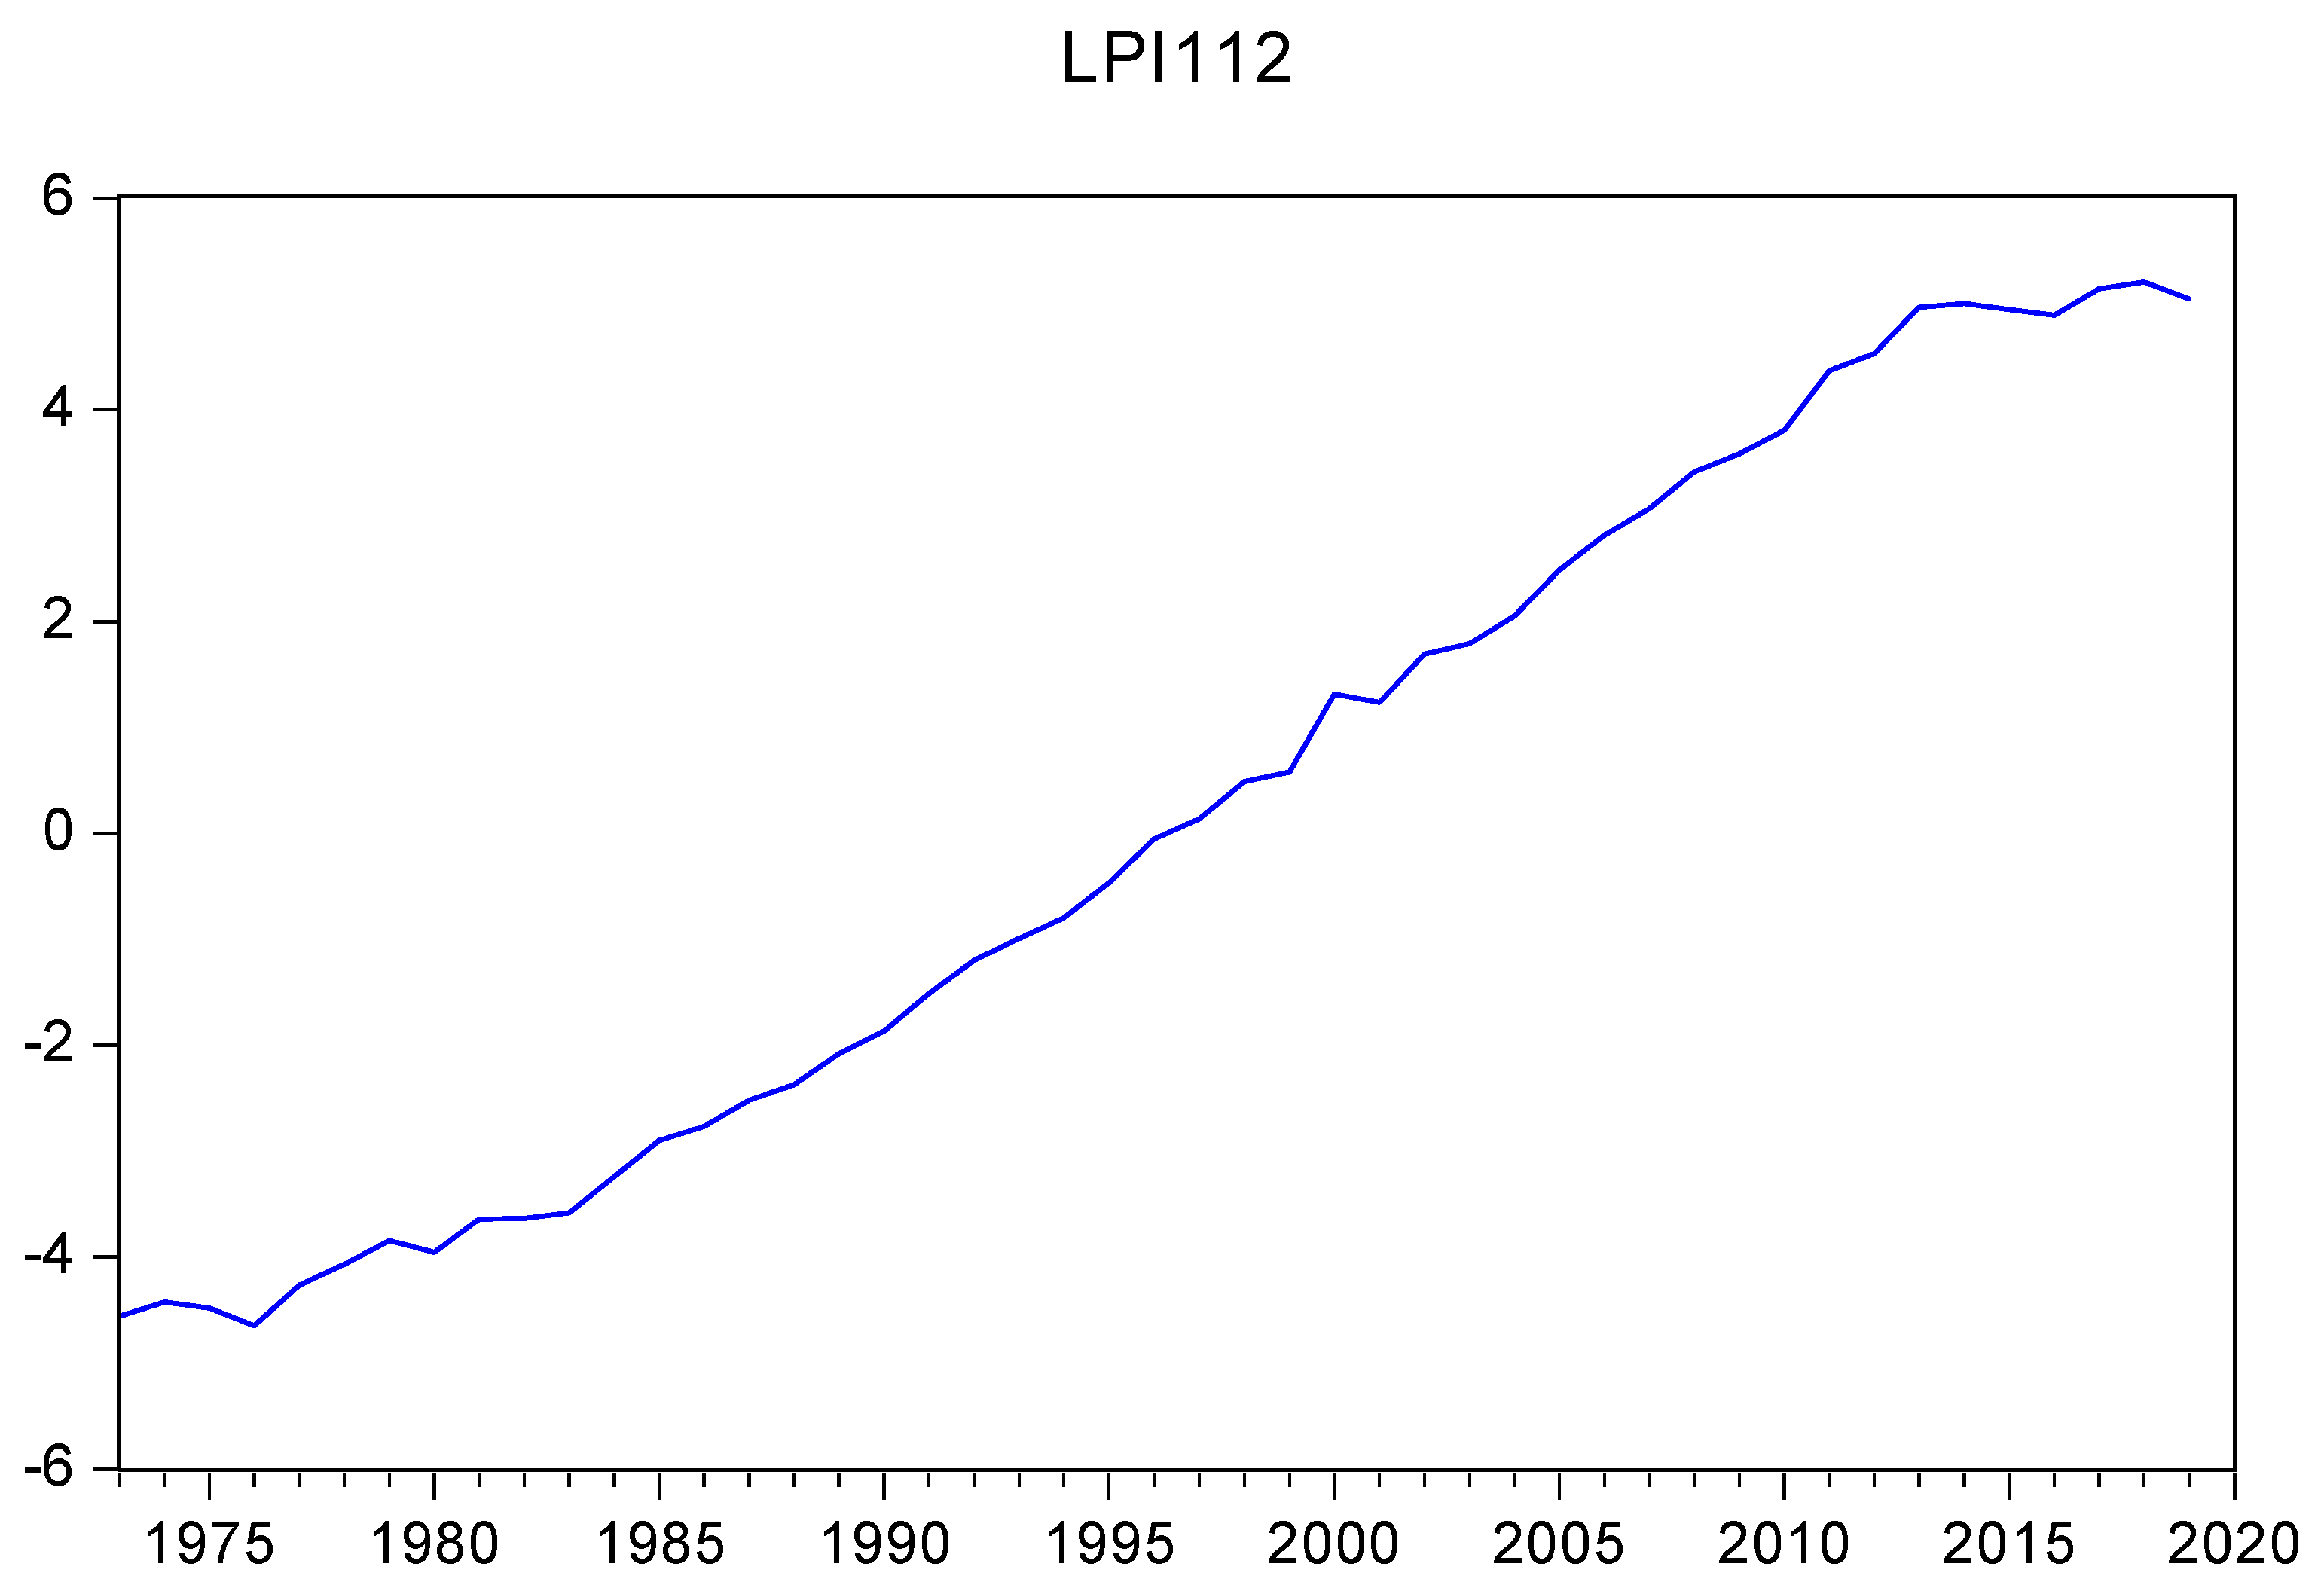
The study employed the PCA method to compute the logistics development index (Ldt) from these selected indicators whose data is available for the longer time period, i.e., 1972–2018. The principal component analyses have sorted fifteen orthogonal components from the selected indicators. The computed results show that the first component captures the larger part of (i.e., about 79%) of total variations in the selected indicators. Therefore, the study selected the first component and based on its factor loadings developed the logistics development index, as shown in the Figure 2.
To test the time series statistical properties of the data series, the study utilized the ADF unit root test as follows. Testing the unit root is an essential step to avoid the spurious regression in time series regression analysis. All variables are used in the logarithmic transformation except the logistic development index, as it is already a scale index. To estimate the long-run and short-run relationship between the underlying variables, the study employed the Johansen and Juselius (1990) method of co-integration based upon the investigation of statistical properties of the selected data series. If there is no cointegration among the underlying variables, then simple unrestricted vector autoregression (VAR) model will be utilized to examine the granger causation. On the other hand, if there is a cointegration relationship among the variables, the granger causality analysis based on the error correction model will be utilized. The estimated ECM will provide the adjustment mechanism of deviations from the long-run equilibrium path.
where Δ is the first difference operator and ectt−1 is the estimated error correction term for the lagged ear. The statistical significance of the lagged first difference explanatory variable indicates the short-run causal effect between the dependant variable and the explanatory variable. Furthermore, the long-run causal relationship is confirmed by the significance of the t-statistics of the lagged error-correction term.
4. Empirical Results and Discussion
Unit root test results in Table 4 show that all the series are integrated of order “1”, and they become stationary at first difference (see results in Table 4). The lag length of VAR selected is “1” based upon the Schwarz information criterion and Hannan–Quinn information criterion.
Both maximum eigen value and maximum likelihood trace test statistic value [53] confirm the existence of one co-integrating vector among the selected variables (see Table 5). Empirical results suggest that logistic development have a positive significant impact on economic growth during the selected period. The study estimates that a 1% increase in the logistics development index will yield about 0.4% increase in the country’s real GDP. Similarly, the 1% increase in energy consumption will induce about 0.17% increase in the real GDP. Labor force and financial sector developments also found to have q positive and significant (0.14% and 0.88%) impact on country’s real GDP (see results in Table 6).
The estimated long-run relationship is utilized to compute the error correction term that would be further utilized in the VECM that gives us the short-run impact of the explanatory variables, as well as the short-run dynamic adjustment towards the estimated long-run equilibrium path. Furthermore, we applied the ADF unit root test on the computed error correction term (ect) series and found that residuals are stationary at 1% level of significance (Prob. (ADF Value) = 0.0000). These results confirm the existence of a long-run relationship and its adjustments in the short run, as well.
The error correction model estimated results predict that about 30% of adjustment takes place in one year towards the long-run equilibrium path. The estimated long-run relationship also supports that enhanced logistic development have both long-run and short-run impacts on the country’s economic growth (Table 7). Study results confirm that CPEC infrastructure-related developments such as road length, rail track construction, and establishment of Gwader port will enhance the country’s logistic performance, and will improve the economic growth as suggested in Li et al. [18].
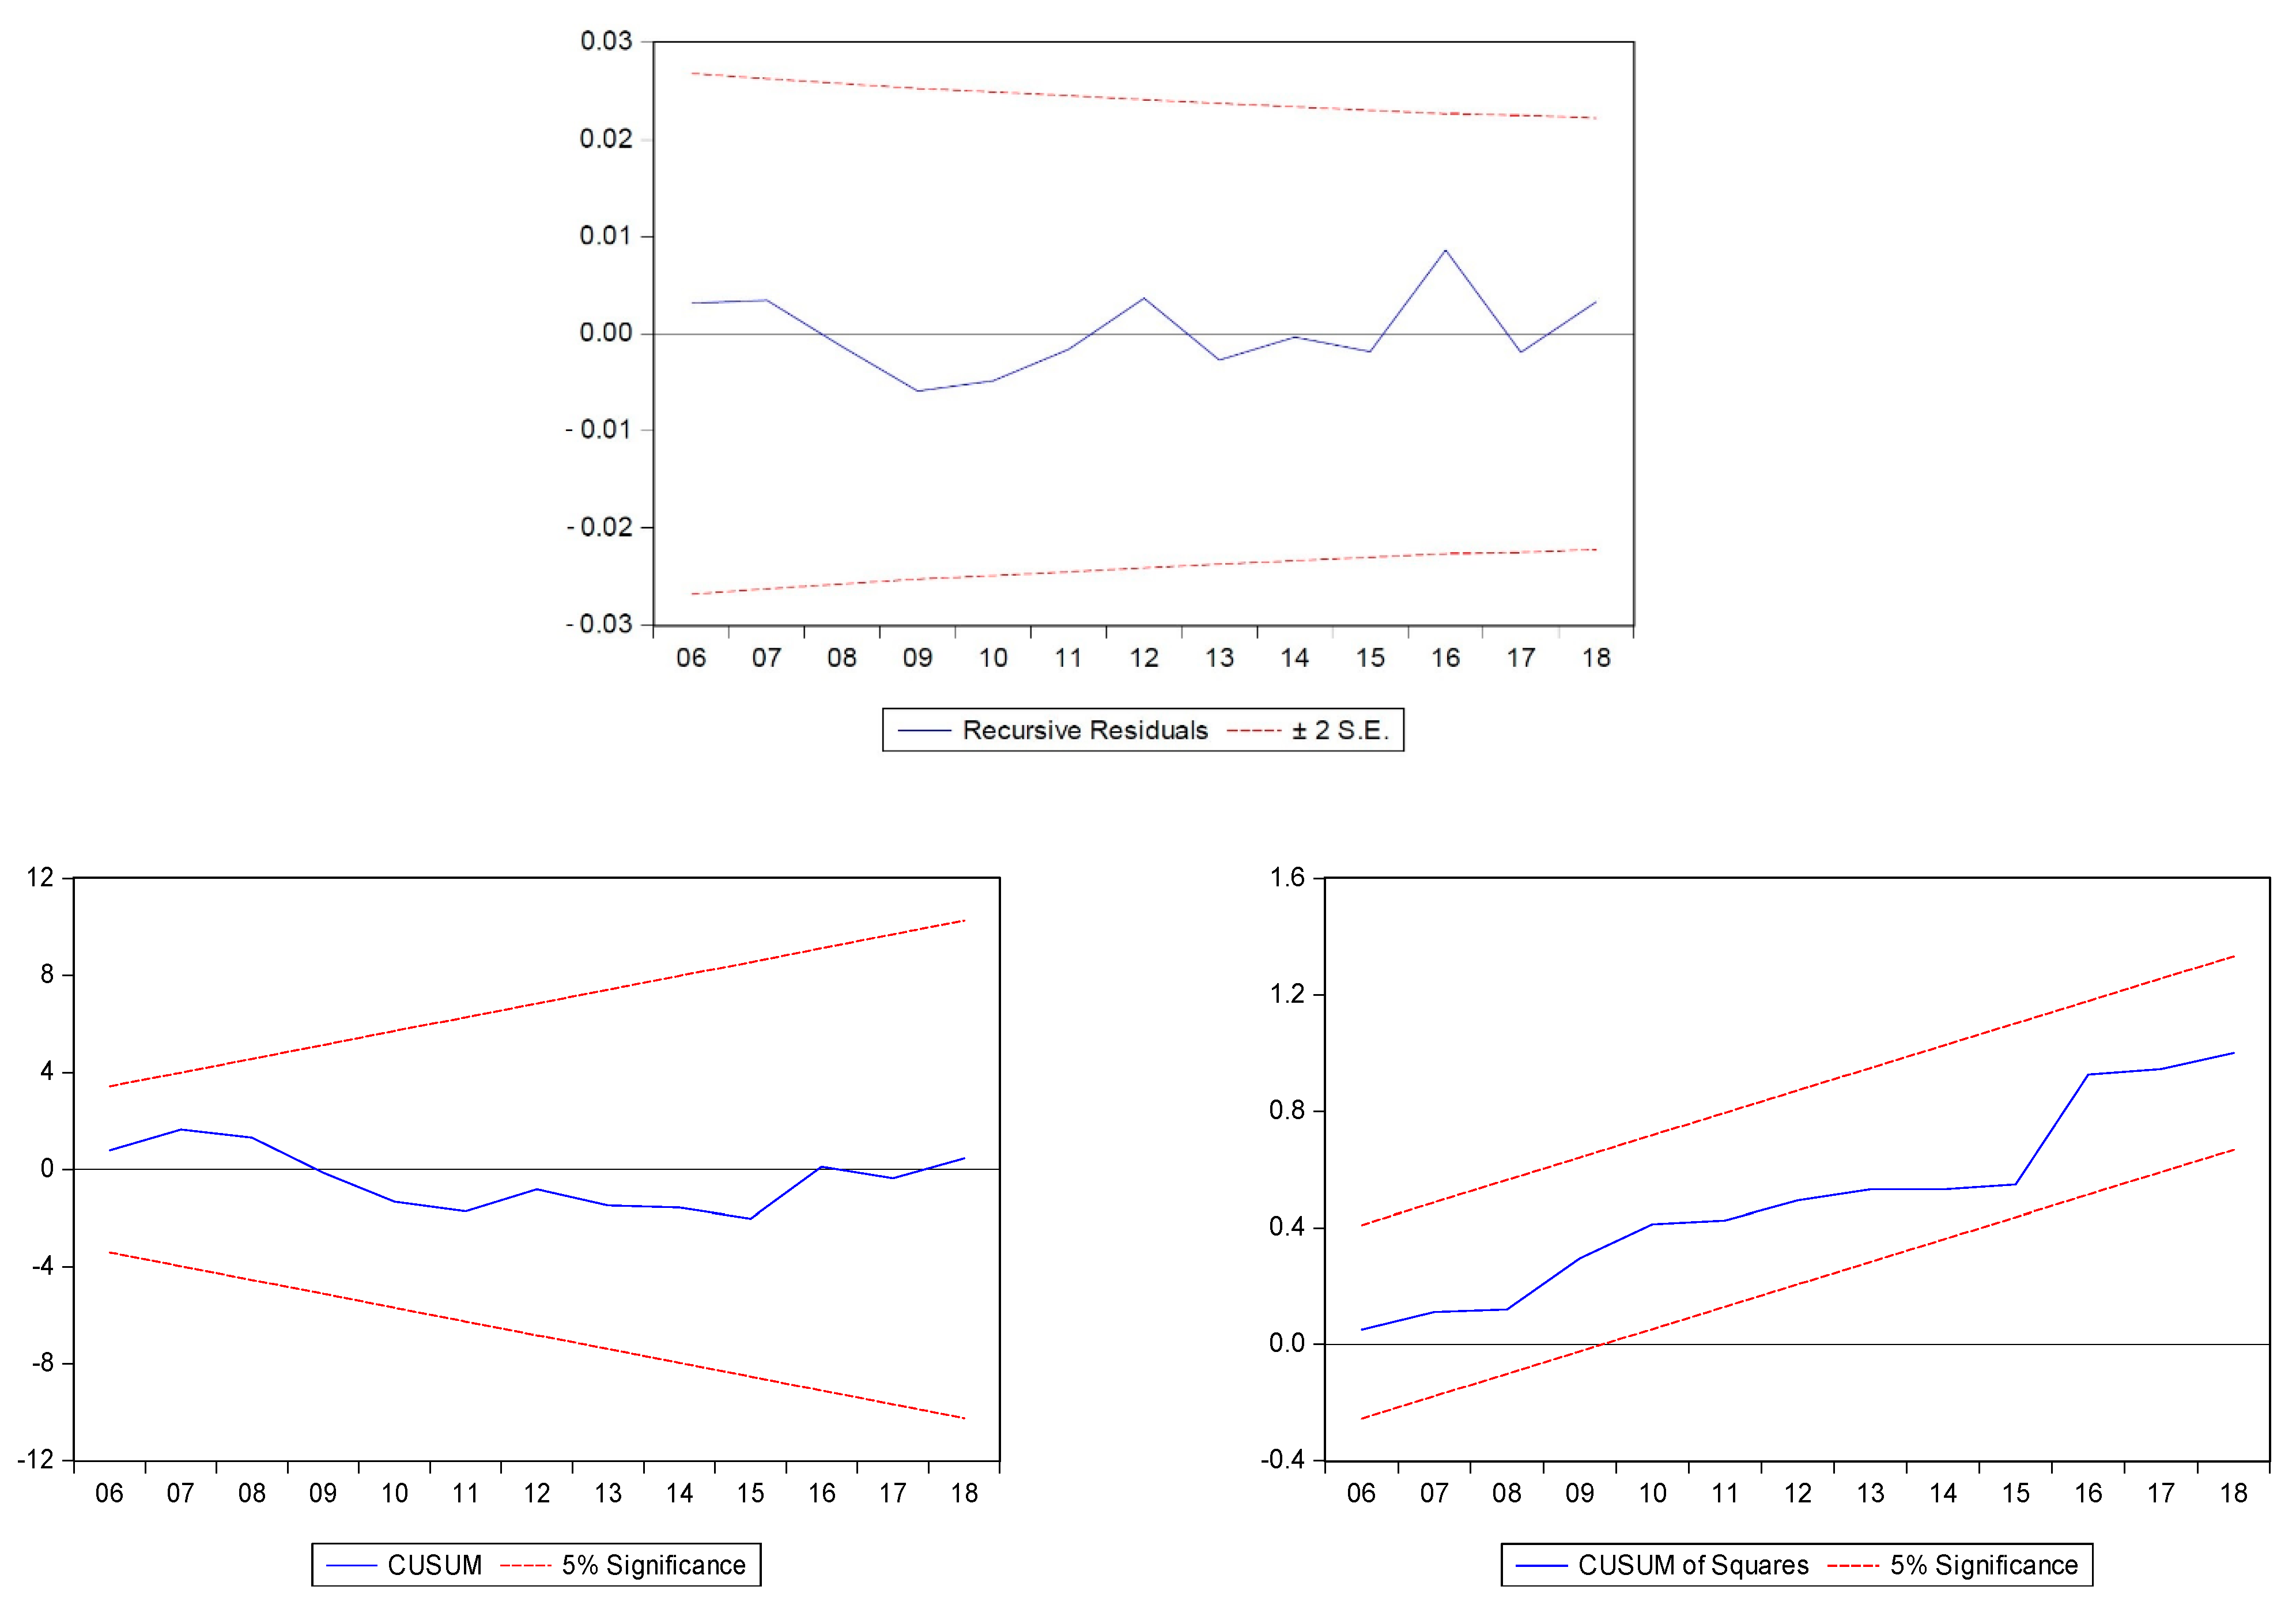
The residuals belonging to the error correction model are normally distributed and passed all diagnostic tests related to autocorrelation, functional misspecification, heteroscedasticity, multicollinearity, and so on. The model stability is shown by the graph of CUSUM, CUSUM of squares, and graph of recursive residuals (Figure 3).
5. Summary Findings and Conclusions
Study investigates the CPEC logistics-related developmental impact on country economic growth in Pakistan. The study defined a Cobb–Douglas type production function that relates the country’s production level to various input variables, such as employed labor force, financial developments, energy consumption, and logistic developments. The study aimed to estimate both long-run and short-run impact of input on the country’s real GDP.
To estimate the long-run relationship, the study needs the long-horizon time series data to complete the analysis. For this, the study attempts to measure the logistic development by utilizing various inputs and output-oriented logistic development and performance indicators for the period 1972–2018. Since all these indicators are highly collinear and cannot be taken altogether in the econometric analysis, we applied the principal component analysis (PCA) to develop a composite index that can capture the dynamics of all the relevant indicators. The computed LD index, along with other input variables, has been further utilized in the method of cointgration analysis to estimate the long-run and short-run impact on the country’s GDP level.
Estimated cointgration results support that one long-run relationship exists among the input variables and the country’s economic growth. Estimated long-run relationship shows that logistic development has a significant positive impact in boosting up the real GDP during the underlying period. Other input variables, such as employed labor force, financial development, and energy consumption, are also found to have a positive and significant impact on real GDP. Further, the study estimated the error correction model to estimate the short-run adjustment mechanism towards long-run equilibrium. The estimated error correction term coefficient value is found to be statistically significant and negative. This result implies that deviation adjustment towards the long-run path also takes place in the short run.
Study results confirm that CPEC infrastructure-related developments such as road construction, rail network expansion and construction and establishment and construction of Gwadar port will improve the logistics and enhance the country’s logistic performance. Study results also confirm that ICT indictors contribute positively to the country’s logistic development and economic growth. The CPEC project planned to lay down a fiber-optic cable covering an area of 820 km that will further improve the telecom and ICT industry of Pakistan. Thus, CPEC-planned telecom-related projects will also improve the country’s logistics development and economic growth.
Study analysis is limited as it focuses on the hardware structure of logistic industry developments and its impact on economic growth. Meanwhile, according to the World Bank, the performance of the logistic industry developments, i.e., how efficiently and effectively the logistics industry developments are utilized in productive activities is also an important determinant for economic growth. The present study is unable to include this aspect into the analysis because of the insufficient number of observations on LPI index to estimate the long-run relationship. However, future research may be extended in this direction utilizing the available LPI panel data set in cross-sectional panel studies. Furthermore, the study supports the view that logistics development is an important determinant of economic growth; however, this does not mean that it is the sole means of economic growth.
6. Policy Implications
Logistic indicator analysis revealed that the country’s transport system is facing imbalances in utilization of different modes of transport in Pakistan. For example, roads are overburdened, as approximately 96% of total passengers and freight are supported by road transport, while only 4–5 percent are supported by the Pakistan Railways. Pakistan Railways was an important segment in the logistic industry, as it was the most preferred and cheapest mode of transport in the country until the late 1970s. Afterwards, there was a continuous decline in service quality due to acute shortage of locomotives, freight wagons, outdated and old infrastructure, and cancellation of many routes. Consequently, the passengers and freight transport shifted towards road transport, especially the trucks. The main reason behind this dilemma that somehow infrastructure developments remained focused on road and road-based infrastructure and therefore, unavailability of sufficient development funds to Pakistan Railways. Acknowledging these policy gaps, CPEC aims to construct a new railway line from Peshawar to Torkhum, Quetta to Kotla, and then further extend this line to Gwader Port. This rail network expansion will connect these least developed areas to developed regions and bring employment, spillover, and connectivity-related positive impacts in these regions. Moreover, there are a number of projects related to upgradation, capacity enhancement, and reconstruction of existing ML1 and ML2 lines. Although improvement has been noticed in the last two years [16], the study recommends to further extend and speed up the efforts toward the accomplishment of the well-balanced transport model outlined in the CPEC. Trucks are a good means of transport because of easy access, pick and drop at final destination, time saving, flexible hours, and, more importantly, its cheaper rates, especially in Pakistan. However, there are a number of issues such as trucks overloading, environmental emissions, and road damage, etc., that the trucking industry in Pakistan is faced with nowadays. Therefore, thr government should also focus on environmental problems, green technology transfer, counselling, and strict compliance to rules and regulations to resolve these issues.
CPEC Gwadar port is one of the key projects that would add a capacity of 120 berths in the port infrastructure and will facilitate the trade traffic of about 45–65 million tons by the end of year 2030 and up to 300 million tons by the end of 2050 [54]. It is estimated that Gwadar port will be able to facilitate about 4% of global trade by the year 2020. Total Maritime trade will be expected to rise about 70% through Pakistan ports including Gwadar, Karachi, and Port Qasim Port. It will also strengthen the trade ties with other non-coastal countries.
The study results show that traded volume at ports contributes positively to the country’s logistic performance, and further accelerate the pace of development in the country. The rising port operations (traded volume) depict the growing logistic performance over the period 1972–2016, but it is unfortunate that other seaport indicators, such as number of vessels and deadweight tonnes are declined over the same period of time (see Figure 1). It implies that country’s port operations are relying on foreign logistic resources e.g., vessels and ships to transport the products to other nations. Therefore study recommends that with the construction of Gwadar ports, the Government should also focus on the creation, expansion and establishment of in-house capacities such as vessels, deadweight tonnes, port handlings, cargo and storage facilities, etc. Government should attract the public-private sector partnership in expanding these port operations.
Pakistan’s economy is experiencing regional inequalities and the main causal factor is the uneven distribution of transport infrastructure. Transport infrastructure conditions in the central Punjab are much better than in the Baluchistan and Sind Province. CPEC aims to develop the transport infrastructure throughout the country; therefore, the study revealed that CPEC would also help in reducing the regional inequalities and bring prosperity in the country.
At present, the country’s logistics are governed under four different ministries. For example, the Ministry of Communication is mainly responsible for roads and highways, and port operations are governed under Ministry of Ports and Shipping. While rail transport is regulated by the Ministry of Pakistan Railways, ICTs are under the Ministry of Information Technology and air transport is governed by the Ministry of Aviation in Pakistan. The study revealed that these five ministries behave like rivals to each other, while efficient logistics industry requires them to be complement to each other. Therefore, study recommends that these five industries should work together and complement each other in operations. This may be possible if these five ministries work in close cooperation and coordination with each other.
Author Contributions
Conceptualization, I.B. and Z.K.; methodology, Z.K.; software, I.B.; validation, Z.K., M.B.L., and I.B.; formal analysis, I.B.; investigation, Z.K.; resources, Z.K.; data curation, M.B.L.; writing—original draft preparation, I.B.; writing—review and editing, I.B.; visualization, Z.K and M.B.L.; supervision, I.B.; project administration, I.B.; funding acquisition, I.B. and Z.K. All authors have read and agreed to the published version of the manuscript.
Funding
The underlying research is funded under “Competitive Policy Research Grant 2017/2018 Grant by the Centre of Excellence (CPEC), at PIDE, Islamabad, Pakistan.
Institutional Review Board Statement
Not applicable.
Informed Consent Statement
Not applicable.
Data Availability Statement
Not applicable.
Conflicts of Interest
The authors declare no conflict of interest.
References
- Chaisse, J.; Matsushita, M. China’s “Belt and Road” Initiative: Mapping the World’s Normative and China’s ‘Belt And Road’ Initiative: Mapping the World Trade Normative and Strategic Implications. J. World Trade 2018, 52, 163–185. [Google Scholar]
- Zen Read China, Iran Sign 25-year Cooperation Accord. Haaretz 2021. Available online: https://www.haaretz.com/world-news/china-iran-to-sign-25-year-cooperation-accord-iranian-state-media-says-1.9659442 (accessed on 27 May 2021).
- Khan, M.K.; Sandano, I.A.; Pratt, C.B.; Farid, T. China’s Belt and Road Initiative: A global model for an evolving approach to sustainable regional development. Sustainability 2018, 10, 4234. [Google Scholar] [CrossRef] [Green Version]
- Rahman, S.H.; Khatri, S.; Brunner, H.P. Regional Integration And Economic Development in South Asia; Edward Elgar Publishing: Cheltenham, UK, 2012; pp. 1–399. [Google Scholar] [CrossRef]
- SBP Handbook of Statistics on Pakistan Economy 2015; Statistics Department, State Bank of Pakistan: Karachi, Pakistan, 2015.
- Economic Survey of Pakistan, Ministry of Finance; Government of Pakistan: Islamabad, Pakistan, 2015.
- Önsel Ekici, Ş.; Kabak, Ö.; Ülengin, F. Linking to compete: Logistics and global competitiveness interaction. Transp. Policy 2016, 48, 117–128. [Google Scholar] [CrossRef]
- Kuzu, S.; Önder, E. Research into the Long-Run Relationship between Logistics Development and Economic Growth in Turkey. J. Logist. Manag. 2014, 3, 11–16. [Google Scholar] [CrossRef]
- Hooi Lean, H.; Huang, W.; Hong, J. Logistics and economic development: Experience from China. Transp. Policy 2014, 32, 96–104. [Google Scholar] [CrossRef]
- Limão, N.; Venables, A.J. Infrastructure, Geographical Disadvantage, Transport Costs, and Trade. World Bank Econ. Rev. 2001, 15, 451–479. [Google Scholar] [CrossRef]
- Muhammad, I.; Javhria, N. Infrastructure and growth. Pak. Dev. Rev. 2011, 50, 355–364. [Google Scholar] [CrossRef]
- Tanveer, A.; Manan, N. Impact of infrastructure on economic growth of pakistan. J. Econ. Res. 2016, 2, 1–12. [Google Scholar] [CrossRef]
- Mohmand, Y.T.; Wang, A.; Saeed, A. The impact of transportation infrastructure on economic growth: Empirical evidence from Pakistan. Transp. Lett. 2017. [Google Scholar] [CrossRef]
- Arvis, J.; Mustra, M.; Panzer, J.; Ojala, L.; Naula, T. Connecting to Compete; World Bank: Washington, DC, USA, 2007; pp. 16–17. [Google Scholar]
- Arvis, J.-F.; Mustra, M.A.; Ojala, L.; Shepherd, B.; Saslavsky, D. Connecting to Compete 2012: Trade Logistics in the Global Economy—The Logistics Performance Index and Its Indicators; World Bank: Washington, DC, USA, 2012. [Google Scholar]
- Arvis, J.-F.; Saslavsky, D.; Ojala, L.; Shepherd, B.; Busch, C.; Raj, A. Connecting to Compete: Transport Logistics in the Global Economy. The Logistics Performance Index and Its Indicators; World Bank: Washington, DC, USA, 2014. [Google Scholar]
- Arvis, J.; Mustra, M.; Panzer, J.; Ojala, L.; Naula, T. Connecting to Compete: Trade Logistics in the Global Economy; World Bank: Washington, DC, USA, 2016; pp. 1–76. [Google Scholar]
- Li, K.X.; Jin, M.; Qi, G.; Shi, W.; Ng, A.K.Y.; Li, K.X.; Jin, M.; Qi, G.; Shi, W.; Ng, A.K.Y. Logistics as a driving force for development under the Belt and Road Initiative—the Chinese model for developing countries. Transp. Rev. 2017, 1647. [Google Scholar] [CrossRef]
- Ironmonger, D.; Norman, P. Improvements in Transport Infrastructure are designed to Increase Travel Speed: Comments on ‘The Myth of Travel Time Saving. Transp. Rev. 2008, 28, 694–698. [Google Scholar] [CrossRef]
- Gunasekera, K.; Anderson, W.; Lakshmanan, T.R. Highway-Induced Development: Evidence from Sri Lanka. World Dev. 2008. [Google Scholar] [CrossRef]
- Zhao, J.; Yu, Y.; Wang, X.; Kan, X. Economic impacts of accessibility gains: Case study of the Yangtze River Delta. Habitat Int. 2017. [Google Scholar] [CrossRef]
- Shirley, C.; Winston, C. Firm inventory behavior and the returns from highway infrastructure investments. J. Urban Econ. 2004, 55, 398–415. [Google Scholar] [CrossRef]
- Holtz-Eakin, D.; Schwartz, A.E. Spatial productivity spillovers from public infrastructure: Evidence from state highways. Int. Tax Public Financ. 1995. [Google Scholar] [CrossRef]
- Cohen, J.P.; Paul, C.J.M. Public Infrastructure Investment, Interstate Spatial Spillovers, and Manufacturing Costs. Rev. Econ. Stat. 2004, 86, 551–560. [Google Scholar] [CrossRef]
- Hailu, D.B.; Zenaselassie, M. An Empirical Investigation of Performance of Logistics and Economic Growth Nexus in Sub- Saharan Africa: Panel Data Approach. Int. J. Sci. Res. (IJSR) 2016, 5, 2015–2017. [Google Scholar] [CrossRef]
- Donaubauer, J.; Meyer, B.; Nunnenkamp, P. Aid, Infrastructure, and FDI: Assessing the Transmission Channel with a New Index of Infrastructure. World Dev. 2016. [Google Scholar] [CrossRef] [Green Version]
- Eloff, J.J.; Smirnov, O.A.; Lindquist, P.S. Transportation Infrastructure, Industrial Productivity, and Return on Investment. Transp. Res. Rec. J. Transp. Res. Board 2013, 2345, 109–116. [Google Scholar] [CrossRef]
- Hayaloglu, P. The Impact of Developments in the Logistics Sector on Economic Growth: The Case of OECD Countries. Int. J. Econ. Financ. Issues 2015, 5, 523–530. [Google Scholar]
- Karayun, I.; Ibrahim Aydin, H.; Gulmez, M. The Role of Logistics in Regional Development; Acad. Brâncuşi Publisher: Gorj, Romania, 2012; pp. 1844–7007. [Google Scholar]
- Kumagai, S.; Gokan, T.; Isono, I.; Keola, S.; Gokan, T.; Isono, I.; Balanced, T.; Development, R. Geographical Simulation Model for ERIA: Predicting the Long-run Effects of Infrastructure Development Projects in East Asia. In International Infrastructure Develoment in East Asia -Toards Balanced Regional Development and Integration; Kumar, N., Ed.; ERIA: Chiba, Japan, 2008; pp. 360–393. [Google Scholar]
- Martí, L.; Puertas, R.; García, L. Importance of the Logistics Performance Index in International Trade. Appl. Econ. 2014, 46. [Google Scholar] [CrossRef]
- Hong, J.; Chu, Z.; Wang, Q. Transport infrastructure and regional economic growth: Evidence from China. Transportation (Amst) 2011. [Google Scholar] [CrossRef]
- Rietveld, P. Infrastructure and regional development—A survey of multiregional economic models. Ann. Reg. Sci. 1989, 23, 255–274. [Google Scholar] [CrossRef]
- Fedderke, J.W.; Perkins, P.; Luiz, J.M. Infrastructural investment in long-run economic growth: South Africa 1875–2001. World Dev. 2006. [Google Scholar] [CrossRef]
- Sahoo, P.; Dash, R.K. Economic Growth in South Asia: Role of Infrastructure; Taylor and Francis Co.: Oxfordshire, UK, 2012; Volume 21, ISBN 0963819100. [Google Scholar]
- King, R.G.; Levine, R. Finance, entrepreneurship and growth. J. Monet. Econ. 1993. [Google Scholar] [CrossRef]
- King, R.G.; Levine, R. Finance and Growth: Schumpeter Might Be Right. Q. J. Econ. 1993. [Google Scholar] [CrossRef]
- Levine, R. Chapter 12 Finance and Growth: Theory and Evidence. In Handbook of Economic Growth; Elsevier: Amsterdam, The Netherlands, 2005. [Google Scholar]
- Ductor, L.; Grechyna, D. Financial development, real sector, and economic growth. Int. Rev. Econ. Financ. 2015, 37, 393–405. [Google Scholar] [CrossRef]
- Chen, S.T.; Kuo, H.I.; Chen, C.C. The relationship between GDP and electricity consumption in 10 Asian countries. Energy Policy 2007. [Google Scholar] [CrossRef]
- Ozturk, I. A literature survey on energy-growth nexus. Energy Policy 2010. [Google Scholar] [CrossRef]
- Hamdi, H.; Sbia, R.; Shahbaz, M. The nexus between electricity consumption and economic growth in Bahrain. Econ. Model. 2014. [Google Scholar] [CrossRef] [Green Version]
- Shahbaz, M.; Lean, H.H. The dynamics of electricity consumption and economic growth: A revisit study of their causality in Pakistan. Energy 2012. [Google Scholar] [CrossRef] [Green Version]
- Wolde-Rufael, Y. Electricity consumption and economic growth: A time series experience for 17 African countries. Energy Policy 2006. [Google Scholar] [CrossRef]
- Czernich, N.; Falck, O.; Kretschmer, T.; Woessmann, L. Broadband Infrastructure and Economic Growth. Econ. J. 2011, 121, 505–532. [Google Scholar] [CrossRef]
- Chavula, H.K. Telecommunications development and economic growth in Africa. Inf. Technol. Dev. 2013, 19, 5–23. [Google Scholar] [CrossRef]
- Donaldson, D.; Hornbeck, R. Railroads and American economic growth: A “market access” approach. Q. J. Econ. 2016. [Google Scholar] [CrossRef] [Green Version]
- Ojala, L.; Celebi, D. The World Bank’s Logistics Performance Index (LPI) and drivers of logistics performance. Int. Transp. Forum 2015. Available online: https://www.semanticscholar.org/paper/The-World-Bank%27s-Logistics-Performance-Index-(LPI)-Ojala-%C3%87elebi/e9d3433e9e41914974e8f2f507ecbfcb962e0317 (accessed on 27 May 2021).
- Brooks, C. Introductory Econometrics for Finance, 2nd ed.; Cambridge University Press: Cambridge, UK, 2008; ISBN 9788578110796. [Google Scholar]
- Adu, G.; Marbuah, G.; Mensah, J.T. Financial development and economic growth in Ghana: Does the measure of financial development matter? Rev. Dev. Financ. 2013. [Google Scholar] [CrossRef] [Green Version]
- Adnan, N. Measurement of Financial Development: A Fresh Approach. In Proceedings of the International Conference on Islamic Economics and Finance, Doha, Qatar, 25–27 December 2011. [Google Scholar]
- Pradhan, R.P.; Arvin, M.B.; Hall, J.H. Economic growth, development of telecommunications infrastructure, and financial development in Asia, 1991–2012. Q. Rev. Econ. Financ. 2016. [Google Scholar] [CrossRef]
- Johansen, S.; Juselius, K. Maximum likelihood estimation and inference on cointegration—With applications to the demand for money. Oxf. Bull. Econ. Stat. 1990, 52, 169–210. [Google Scholar] [CrossRef]
- Centre of Excellence CPEC, PIDE Islamabad. Available online: https://cpec-centre.pk/ (accessed on 27 May 2021).
Figure 1.
Snapshots of various logistics-related indicators during the period 1971–2019.

Figure 2.
Logistic development index (Ldt) 1971–2019.

Figure 3.
Results of parameter stability tests.


Table 1.
Variables Description and Measurements.
| Variable Description | Measurement | Frequency |
|---|---|---|
| Logistics development index (Ldt) | Index | 1972–2019 |
| Real GDP (Yt) | Gross domestic product factor cost at constant prices 2005–06 (in Rs. million 000). | 1972–2019 |
| Labor force (LFt) | Number of employed persons (measured in thousands) | 1972–2018 |
| Financial development (FDt) | FDt is proxy by M2 to GDP ratio (in percentage) | 1972–2019 |
| Energy consumption (ECt) | In gigawatt hours | 1972–2019 |
Table 2.
Logistic Indicators and Data Sources.
| Sr No. | Components | Relevant Data Indicators |
|---|---|---|
| 1 | Ports infrastructure and services | No. of vessels; deadweight tons; ports cargo handling imports; ports cargo handling exports; |
| 2 | Transport infrastructure and services | High road length in km; rail network in km; Rail freight carried in tons; |
| 3 | Logistic automobiles indicators | No. of trucks on roads; No. of freight trains; No. of pick-ups and delivery vans on roads |
| 4 | Telecom services and infrastructure | No. of telephone lines; No. of PCOs; No of mobile phones. |
Data sources: Various issues of Pakistan Economic Survey 2019–2020; Handbook of Statistics on Pakistan Economy 2015 [5]; 50 Years of Pakistan Economy.
Table 3.
Correlation Coefficients of the Selected Indicator.
| 1 | 2 | 3 | 4 | 5 | 6 | 7 | 8 | 9 | 10 | 11 | 12 | 13 | 14 | 15 | |
|---|---|---|---|---|---|---|---|---|---|---|---|---|---|---|---|
| Locomotives(No) | 1.000 | ||||||||||||||
| Freight Wagons (No.) | 0.943 | 1.000 | |||||||||||||
| Vessels (No) | 0.974 | 0.891 | 1.000 | ||||||||||||
| Deadweight (tonnes) | 0.385 | 0.261 | 0.493 | 1.000 | |||||||||||
| Trucks (No.) | −0.945 | −0.967 | −0.899 | −0.180 | 1.000 | ||||||||||
| Delivery Vans(No) | −0.947 | −0.966 | −0.905 | −0.195 | 0.988 | 1.000 | |||||||||
| Rail Network (KM) | 0.792 | 0.878 | 0.736 | 0.145 | −0.867 | −0.860 | 1.000 | ||||||||
| High Type Road(KM) | −0.983 | −0.979 | −0.950 | −0.329 | 0.968 | 0.974 | −0.863 | 1.000 | |||||||
| Port Operations (Million tonnes ) | −0.888 | −0.965 | −0.825 | −0.115 | 0.973 | 0.969 | −0.898 | 0.941 | 1.000 | ||||||
| Rail Freight Carried (tonnes) | 0.934 | 0.908 | 0.895 | 0.271 | −0.921 | −0.903 | 0.753 | −0.930 | −0.860 | 1.000 | |||||
| Transport Energy Consumption | −0.983 | −0.948 | −0.961 | −0.395 | 0.931 | 0.936 | −0.812 | 0.982 | 0.885 | −0.937 | 1.000 | ||||
| Postal Offices(No.) | −0.696 | −0.527 | −0.741 | −0.419 | 0.547 | 0.568 | −0.300 | 0.630 | 0.436 | −0.663 | 0.713 | 1.000 | |||
| Phones Connections(No) | −0.912 | −0.947 | −0.864 | −0.177 | 0.934 | 0.938 | −0.891 | 0.952 | 0.923 | −0.906 | 0.929 | 0.490 | 1.000 | ||
| Mobile Phones (No.) | −0.604 | −0.732 | −0.530 | 0.189 | 0.810 | 0.784 | −0.650 | 0.661 | 0.834 | −0.658 | 0.581 | 0.167 | 0.668 | 1.000 | |
| Public Call Offices (No.) | −0.732 | −0.859 | −0.653 | 0.122 | 0.878 | 0.894 | −0.857 | 0.815 | 0.936 | −0.699 | 0.729 | 0.237 | 0.857 | 0.860 | 1.000 |
Where 1—Locomotives; 2—Freight Wagons; 3—Vessels; 4—Deadweight; 5—Trucks; 6—Delivery Vans; 7—Rail Network; 8—High Type Road; 9—Port Operations; 10−Rail Freight Carried; 11—Transport Energy Consumption; 12—Postal Offices; 13—Phones Connections; 14—Mobile Phones; 15—Public Call Office.
Table 4.
Unit Root Results.
| Variable Description | Model Specification | ADF Value Test at Level | ADF Test Value at 1st Difference | Decision |
|---|---|---|---|---|
| Logistics development index (Ldt) | Constant and linear trend | −2.293204 | −6.9725577 *** | I(1) |
| Real GDP (Yt) | Constant | −0.149887 | −5.200818 *** | I(1) |
| Labor force (Lt) | Constant and linear trend | −2.132960 | −6.708496 *** | I(1) |
| Financial development as proxy by M2 as % age of GDP (M2Yt) | Constant and linear trend | −2.694938 | −5.687197 *** | I(1) |
| Energy consumption (ECt) | Constant | −0.257518 | −5.203702 ** | I(1) |
Note: ***, **, denote rejection of null hypothesis at 1%, 5%, level of significance.
Table 5.
Co-Integration Test Results.
| Null Hypothesis | Trace Statistics | Maximum Eigen Statistic |
|---|---|---|
| None | 102.0039 ** | 52.62825 ** |
| At most 1 | 49.37564 ** | 26.22504 |
| At most 2 | 23.15060 | 12.50769 |
| At most 3 | 10.64291 | 10.50896 |
| At most 4 | 0.133950 | 0.133950 |
Note: ** states the null hypothesis rejection at 5 % level of significance.
Table 6.
Normalized Long-Run Coefficients.
| Dependent Variable | Constant | Independent Variables | |||
|---|---|---|---|---|---|
| LDt | LFt | FDt | ECt | ||
| LYt | 9.98373 | 0.05755 *** (5.73987) | 0.8992 *** (8.21122) | 0.018237 *** (9.50581) | 0.128587 *** (4.31429) |
*** Indicates level of significance at 1%.
Table 7.
Results of the Error Correction Model.
| Dependent Variable | Short Run Causality (χ2 Test) | Coefficient Error Correction Term | ||||
|---|---|---|---|---|---|---|
| LDt | LFt | FDt | ECt | c | ||
| D(LYt) | 0.023570 ** | 0.158417 | 0.003749 ** | 0.156789 ** | 0.020288 *** | −0.300213 *** |
| R2 = 0.65; Adjusted R2 = 0.58; Durbin–Watson = 1.88 | ||||||
*** Indicates significance of estimated coefficient at 1% level; ** indicates significance of estimated coefficient at 5% level.
Publisher’s Note: MDPI stays neutral with regard to jurisdictional claims in published maps and institutional affiliations. |
© 2021 by the authors. Licensee MDPI, Basel, Switzerland. This article is an open access article distributed under the terms and conditions of the Creative Commons Attribution (CC BY) license (https://creativecommons.org/licenses/by/4.0/).
Share and Cite
MDPI and ACS Style
Khadim, Z.; Batool, I.; Bilal Lodhi, M. China–Pakistan Economic Corridor, Logistics Developments and Economic Growth in Pakistan. Logistics 2021, 5, 35. https://0-doi-org.brum.beds.ac.uk/10.3390/logistics5020035
AMA Style
Khadim Z, Batool I, Bilal Lodhi M. China–Pakistan Economic Corridor, Logistics Developments and Economic Growth in Pakistan. Logistics. 2021; 5(2):35. https://0-doi-org.brum.beds.ac.uk/10.3390/logistics5020035
Chicago/Turabian StyleKhadim, Zunaira, Irem Batool, and Muhammad Bilal Lodhi. 2021. "China–Pakistan Economic Corridor, Logistics Developments and Economic Growth in Pakistan" Logistics 5, no. 2: 35. https://0-doi-org.brum.beds.ac.uk/10.3390/logistics5020035