
Joint Inventory Replenishment Planning of an E-Commerce Distribution System with Distribution Centers at Producers’ Locations

1
School of Management, Hunan University of Technology and Business, Changsha 410205, China
2
School of Public Administration, Hunan University of Finance and Economics, Changsha 410205, China
3
School of Public Administration, Xiangtan University, Xiangtan 411105, China
*
Author to whom correspondence should be addressed.
Logistics 2021, 5(3), 45; https://0-doi-org.brum.beds.ac.uk/10.3390/logistics5030045
Submission received: 17 May 2021
/
Revised: 11 June 2021
/
Accepted: 17 June 2021
/
Published: 1 July 2021
(This article belongs to the Section Last Mile, E-Commerce and Sales Logistics)
Abstract
:In this study, joint inventory replenishment planning of an Alibaba distribution system is investigated, which contributes to the circular economy concept. The distribution system includes suppliers, central distribution centers, and front distribution centers. The total replenishment cost of the distribution system can be reduced by setting up distribution centers at producers’ locations (PDCs), which also helps to reduce the wastages of commodities during the transportation and CO2 emission released by transportation. The joint replenishments of multiple products are constrained by a maximum joint replenishment quantity. Trans-shipments happen among different distribution centers. The considered problem seeks to find the replenishment quantities of products among stocks, which can minimize the total replenishment cost of the system, and is formulated as a novel mathematical model. The effectiveness of our proposed model is validated by computational experiments based on Alibaba’s data. The results indicate that PDCs and trans-shipments can bring about lower replenishment costs if a common service level of the system is given.
1. Introduction
Nowadays, e-commerce has become an important form of business in the world. To quickly respond to the demands of clients with smaller costs and a better degree of satisfaction, all e-commerce enterprises concentrate on effective inventory management of distribution systems.
At the same time, increasing environmental problems have brought up many sustainability concerns by governments and companies in recent years [1]. Novel approaches need to be developed for the management of systems, which can decrease negative environmental effects [2]. For example, it is possible to manage cost efficiency in a distribution system through well-designed inventory replenishment planning, which can decrease transportation among stocks in the distribution system and contribute to reducing carbon emission. In addition, reduced inventory trans-shipment will also help to decrease unnecessary material waste and loss during transportation.
Owing to the resource scarcity problem, many companies have been more conscious about environmental awareness and precautions taken [2]. Therefore, the circular economy (CE) has been widely mentioned, which aims to maximize the value of materials circulating within the economy as well as minimize material consumption [3]. CE includes materials’ production, distribution, consumption, reuse, collection, and recycle processes [4]. At present, the CE concept has been integrated into supply chain management to decrease inventory transportation and carbon emission in distribution, e.g., for an omni-channel supply network design [2].
As we know, Alibaba is one of the biggest e-commerce companies in the world, which attempts to strengthen its inventory management for preserving its dominant position and seek circular economy simultaneously. Therefore, a typical inventory replenishment planning problem (IRPP) that occurs in Alibaba’s distribution system is discussed. In this system, CDCs (central distribution centers), FDCs (front distribution centers), PDCs (distribution centers at producers’ locations), and suppliers are included. The suppliers manufacture products and transport them to the distribution centers. The CDCs distribute products to the FDCs. The clients are served only by the FDCs. PDCs are usually nearby to its suppliers, and receive products from suppliers and send them to CDCs and FDCs. The function of PDCs is to decrease transportation costs in replenishment planning, which will be discussed in the following section.
In this study, the IRPP refers to a single period. Alibaba often decides its replenishment planning, named ‘early product pushing down replenishment’ (EPPDR), before an annual activity such as the ‘double 11 promotion’. Alibaba first held this promotion in 2009 and its transaction volume was ¥498.2 billion in 2020. In order to cope with the massive demand during a single-period promotion, Alibaba uses EPPDR to respond to customer orders in time. In detail, all products are delivered to the stocks in the studied distribution system before promotion. Thus, the replenishment lead times are not considered. The following are some characteristics about the replenishment: the joint replenishment with multiple products and maximum replenishment quantity, and the horizontal trans-shipment among stocks.
In past studies, single-period inventory problems [5] and multi-period inventory problems [6,7] have been widely investigated. As mentioned before, EPPDR is adopted, which means that a single-period inventory problem is studied in this paper. In addition, many papers just studied the inventory replenishment problems with only one type of product [8,9,10], where both the inventory replenishment policy of every stock and the inventory distribution policy were addressed in two-echelon distribution systems without replenishment quantity constraints [11]. For a change, we consider a multi-product joint replenishment problem in a multiple-echelon distribution system with replenishment quantity constraints for all stocks.
Furthermore, joint replenishment for one stock has gained much attention over the past years [12]. In previous studies, ordering costs of multiple products were considered in joint replenishment [13], which can reduce the ordering costs of an inventory system [14,15]. Inventory systems with a group of retailers and a single warehouse [16,17] or with multiple suppliers, distributors, and buyers [18] were studied. Nevertheless, the replenishment quantity constraints and horizontal trans-shipments were not taken into account in these studies. A game-theoretical analysis of joint decisions on carbon emission reduction and inventory replenishment for key supply chain players was presented when facing effort-dependent demand, where just a retailer and a supplier were involved [19]. In addition, the lateral trans-shipments were already considered for stocks located in the same echelon [9,20,21,22]. However, only one product and no joint replenishment were considered in the inventory systems of these studies, which is different from our study.
Various inventory polices have been proposed for distribution systems in the literature, such as order-up-to policies [23], (R, Q) or (R, nQ) policies [24,25,26], (s, Q) [27], (s, S) policies [28], and so on. Different methods were adopted to optimize the above inventory polices in inventory systems, including analytical methods [29,30], simulation-based methods [31,32,33,34], and scenario-based methods [35].
In addition, the inventory replenishment planning of a distribution system of Alibaba was recently studied for a safety stock inventory policy [36] and a single promotion period [37]. However, in their studied distribution systems, the producers’ distribution centers (PDCs) were not considered, and horizontal inventory replenishments among stocks in the same echelon were not allowed. Furthermore, a multiple-period distribution system was studied in [36], but a single-period distribution system is investigated in this paper.
By carefully comparing it with the reference, to the best of our knowledge, the considered inventory replenishment problem is different from all previous studies in following aspects.
- The joint replenishment of products with distribution centers at the producers’ locations for a three-echelon distribution system is studied.
- Each replenishment is constrained by a maximum joint replenishment quantity.
- Horizontal and vertical replenishments of products are allowed for each stock.
These features are from the operation practice of e-commerce companies such as Alibaba, which makes the studied inventory replenishment problem much more challenging and complex. Thus, the contribution of this work is to propose an inventory replenishment model that simultaneous takes into account all the features, which can contribute to the circular economy concept significantly through efficient management of inventories. Thus, we can realize the decrease of both replenishment costs and CO2 emissions.
The structure of the study is set as below. Section 2 presents the problem description. Section 3 formulates the models and gives the corresponding analysis. Section 4 proposes computational experiments for testing the performances of the models. Section 5 concludes the paper and gives future directions.
2. Problem Description
A traditional distribution system for retailing transports commodities from the suppliers to the retailers, passing through the wholesalers, which can be explained in Figure 1. Large wastages of commodities may occur in the system because of multiple wholesalers.
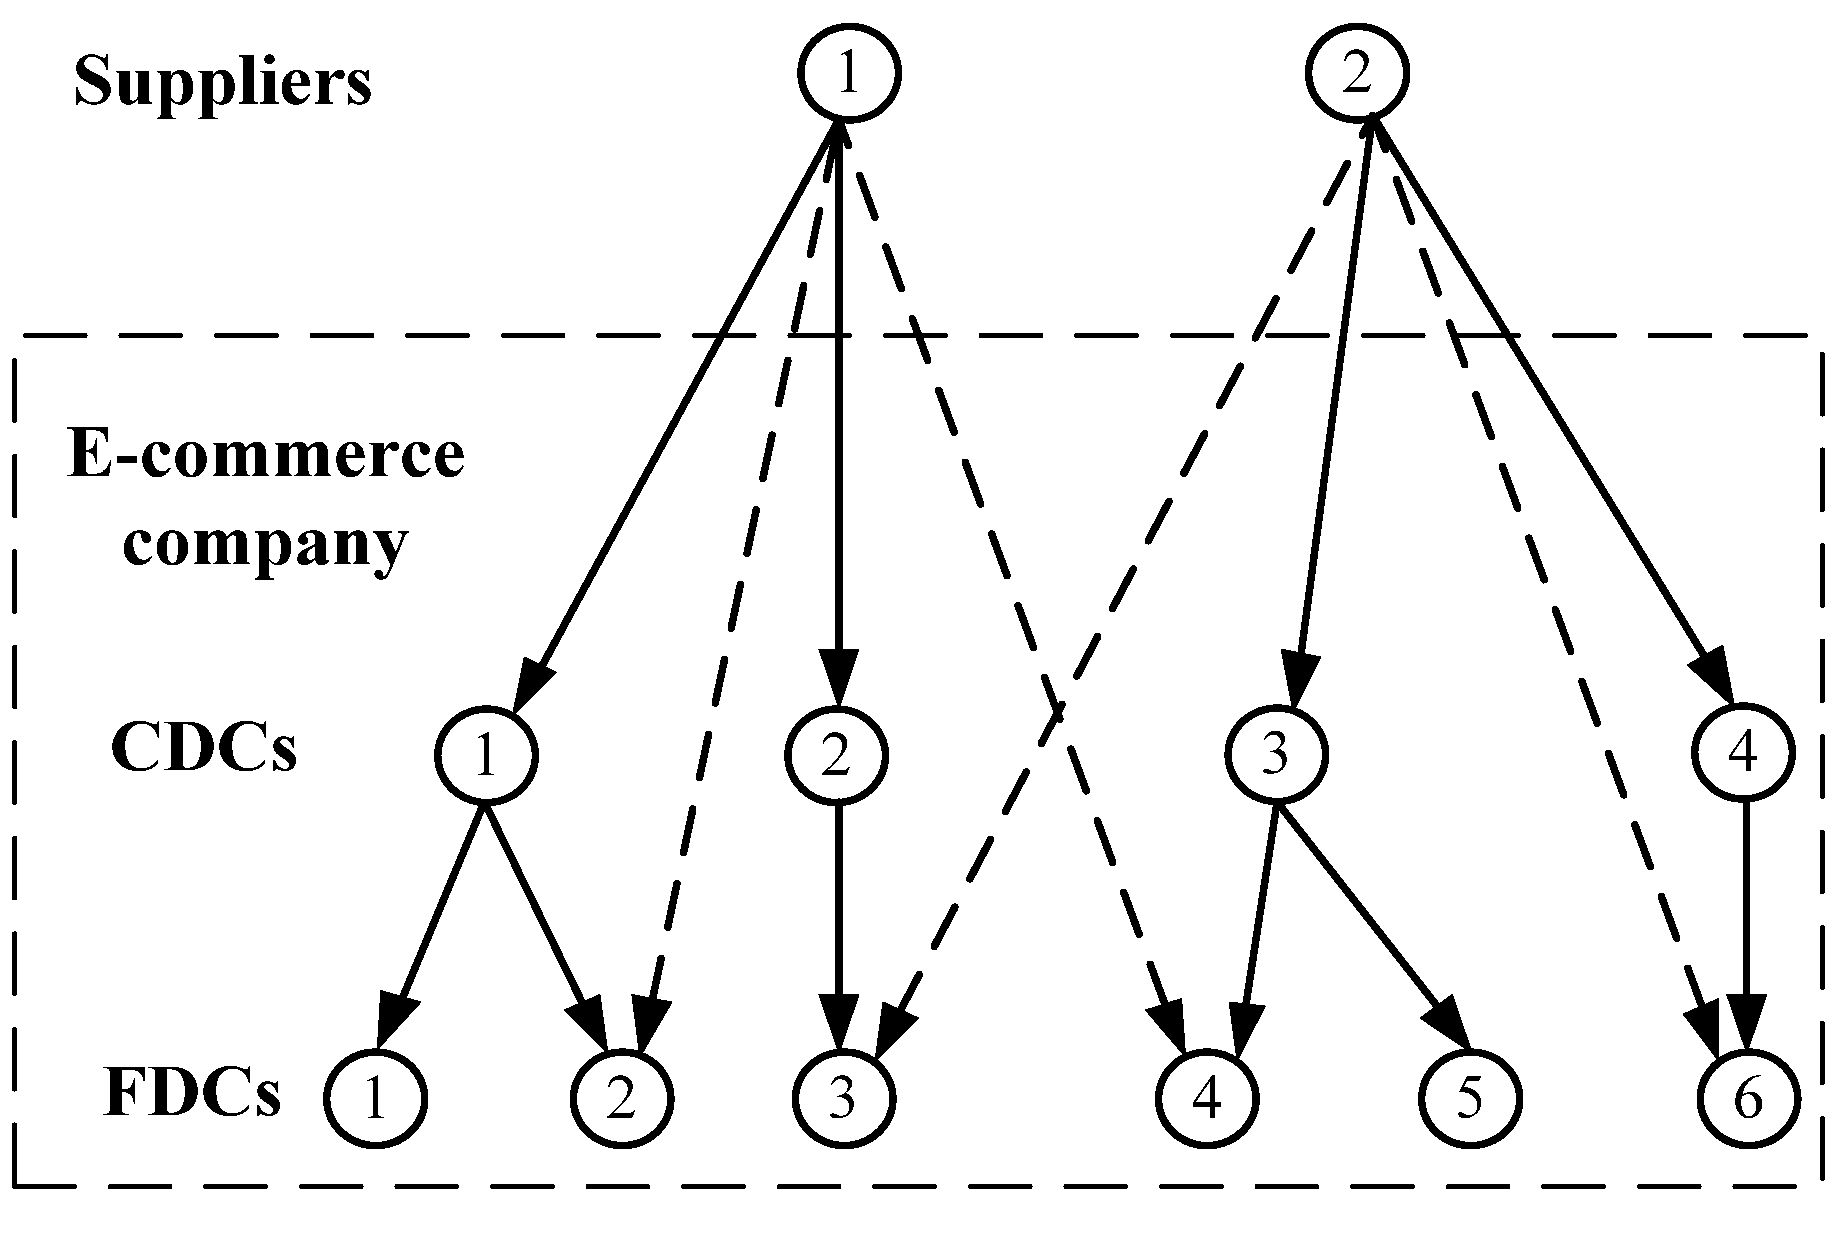
In recent years, e-commerce has been booming. In this paper, we consider a multiple-echelon distribution system operated by Alibaba, displayed in Figure 2. In the system, CDCs (central distribution centers), FDCs (front distribution centers), PDCs (distribution centers at producers’ locations), and suppliers are included. Fast moving products are transported among stocks. A normal distribution is supposed for the demand of each stock, where stationary demand is assumed. Note that this study can easily be applied to the situation wherein the demand of each stock is subject to other types of distributions such as uniform distribution or Poisson distribution. The dashed lines in Figure 2 denote the direct replenishment from suppliers to FDCs. As the suppliers are usually far away from FDCs, direct replenishment is operated with larger transportation costs and smaller replenishment quantities.
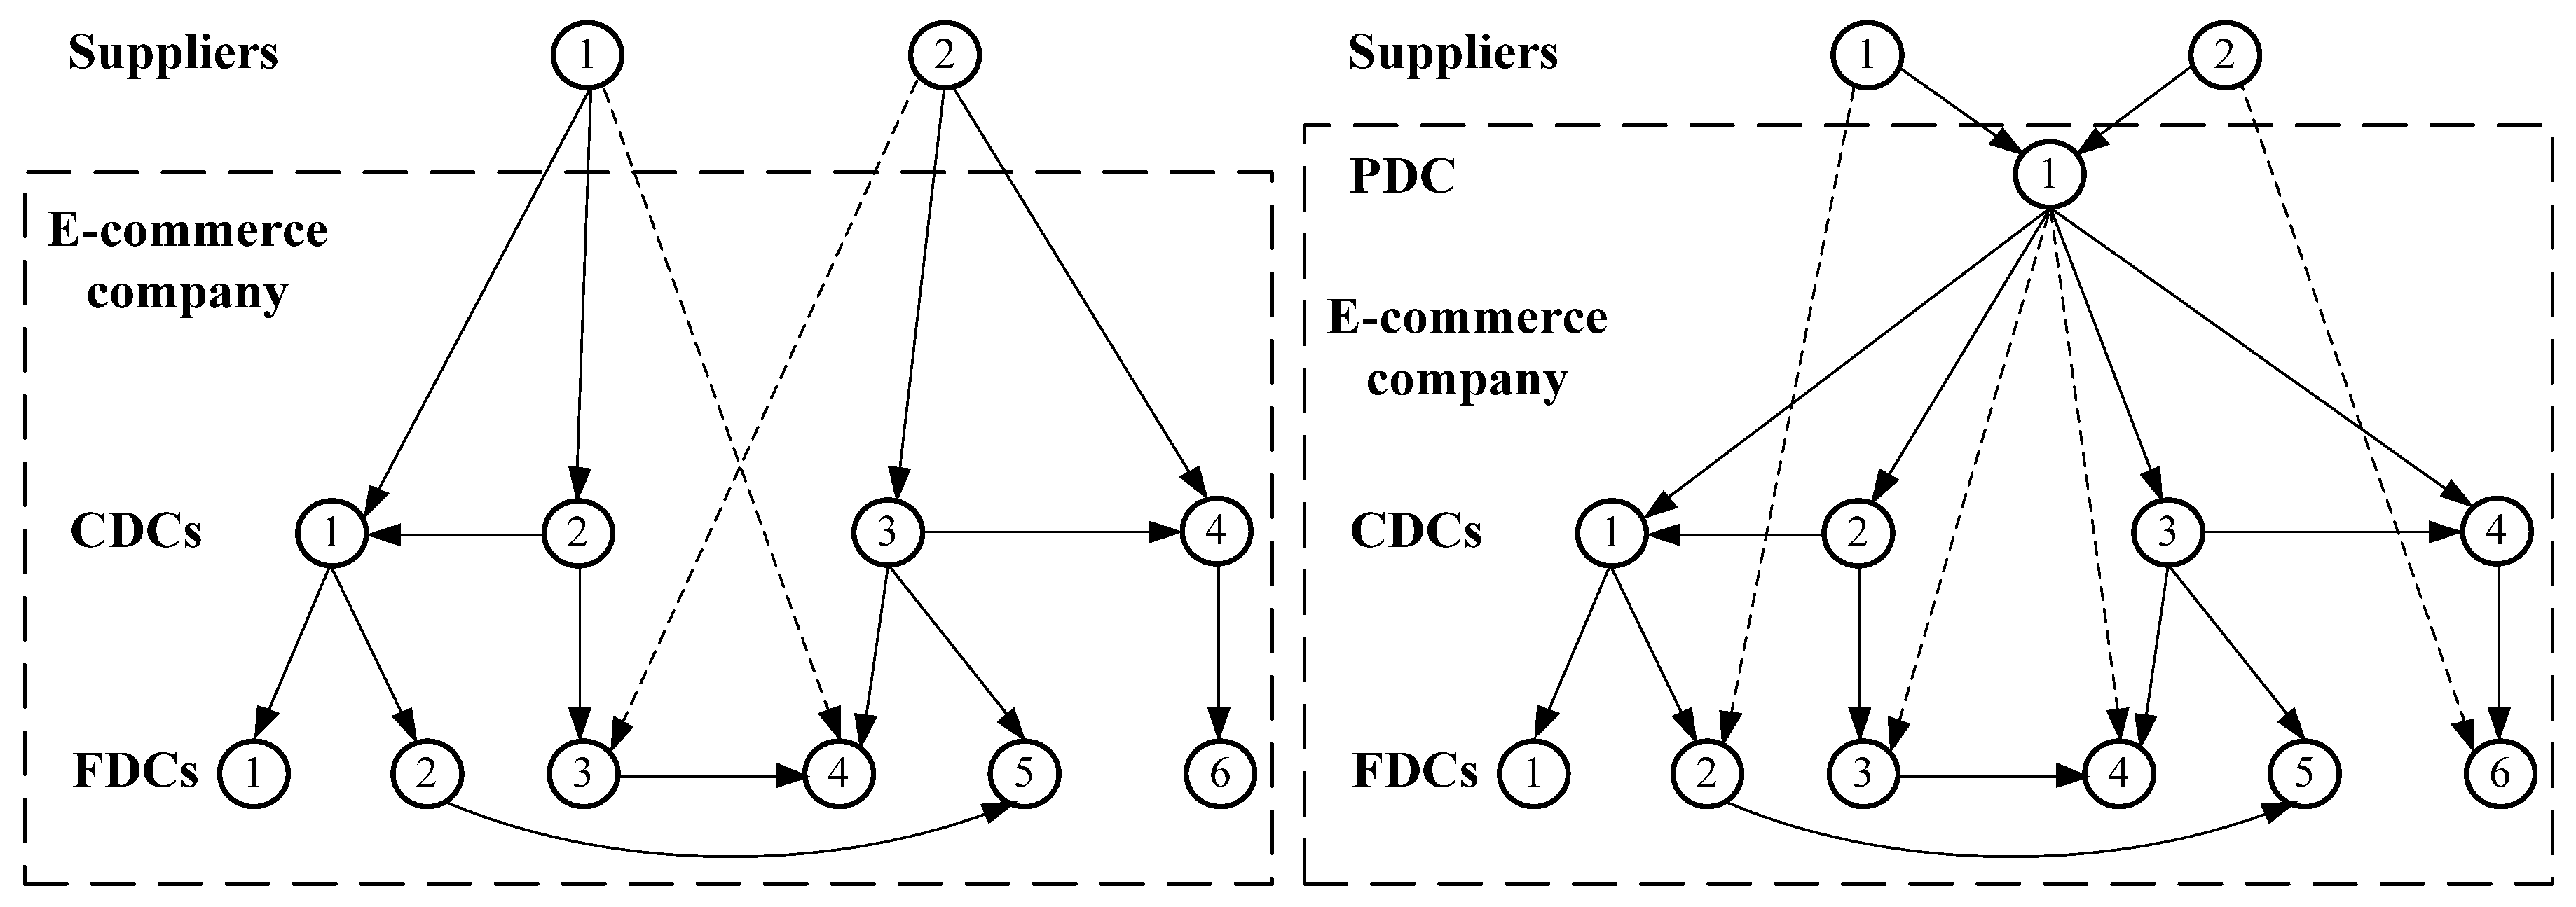
To further improve the replenishment planning, a producers’ distribution center (PDC) is added to the three-echelon distribution system by Alibaba, which can be illustrated in Figure 3. Initially, supplier 1 and 2 supplied the CDCs directly. PDC 1 (producers’ distribution center) was added, near to its suppliers, so that the suppliers can quickly send products to the PDC.
Although there are long distances between the PDC and CDCs 1–4, the PDC can continual replenish products to CDCs. Thus, the service level can be increased and the replenishment lead time can be decreased. Furthermore, the replenishment cost of the system can also be reduced, which will be discussed in Section 4. Here, the suppliers, the PDC, and the CDCs provide products to FDCs 1–6. Lost sales cases may occur in each FDC. In addition, vertical replenishment (CDC 1 to FDC 1) and the horizontal replenishment (FDC 2 to FDC 5) are allowed, but reverse replenishment from a stock in higher echelon to a stock in lower echelon is not permitted. The dashed lines in Figure 3 denote the direct replenishment from suppliers or PDC to FDCs.
In the distribution system, the e-commerce company carries out inventory replenishments to the stocks before its promotion activity in a short time, where multiple products may be replenished at the same time. Therefore, all replenishments can be executed without lead time. Each replenishment is constrained by a maximum joint replenishment quantity, which is different in diverse distribution channels. Furthermore, we assume that each stock first receives products from its predecessor and then sends products to its successor. Note that Alibaba does its replenishment planning on account of historical demand forecast and their errors for the consideration of lost sales in each stock [38].
Initially, there is a given on-hand inventory quantity of each product in each stock. The transportation costs and maximum joint replenishment quantity of the distribution system are also predefined. After that, the products are replenished among stocks in different echelons and trans-shipped between stocks in the same echelon. The goal of replenishment planning is to obtain a minimum total replenishment cost of the distribution system under the condition that the predefined service level is reached at each FDC.
Normally, e-commerce companies seek to achieve an overall same service level for each product at each FDC. Thus, this study can contribute to the CE concept by reducing inventory transportation among stocks and material loss during transportation, which is mainly in the production process and distribution process of the CE concept.
3. Models and Analysis
3.1. Models
Firstly, the notations used in the model for the studied distribution system are given in advance.
Indices
i,j: stock index, i,j = 1,…, N, N denotes the number of stocks
k: product index, k = 1,…, K, K denotes the number of products
Main Parameters
S: the number of suppliers, then let SS denote supplier’s set
P: the number of PDCs, then let PS denote PDC’s set
C: the number of CDCs, then let CS denote CDC’s set
F: the number of FDCs, then let FS denote FDC’s set
N: the number of stocks, N = S + P + C + F, then let NS denote stock’s set
: earlier on-hand inventory quantity of each product in each stock before replenishment, k = 1,…, K, i = 1,…, N
: demand forecast of each product in each stock
: standard deviation of demand forecast of each product in each stock
: real demand of each product in each stock, which obeys a normal distribution with mean and standard deviation
αt: target common service level of the inventory system,
: z-value associated with αt
: transportation/shipping cost of per unit product from stock i to stock j, where and the triangle inequality, , i, j, n = 1,…, N, but
: fixed set-up cost of per unit product from stock i to stock j
: volume of per unit product k
: maximum joint replenishment quantity of a replenishment between any two stocks (i,j = 1,…, N)
M: a large number, M > 0
Variables
: on-hand inventory of each product in each stock when replenishment is finished
: replenishment quantity of each product between any two stocks
: if the replenishment of products happens between any two stocks i and j, , otherwise
Next, we formulate the joint replenishment planning problem in Alibaba’s distribution system as a mathematical model SPJRPP.
Mixed-integer programming model SPJRPP:
Subject to:
The objective function (1) is to find the minimal total replenishment cost of the distribution system. Constraints (2) denote the relationship of inventory movement of each product in all stocks. The common service level α of the inventory system is guaranteed by constraint (3). Constraint (4) indicates that a supplier cannot provide the replenishment quantity of each product that is larger than its on-hand inventory of this product to its successors. Constraint (5) denotes that each product is not allowed to be transported among suppliers or from a stock in a higher echelon to a stock in a lower echelon. Constraint (6) indicates that the maximum joint replenishment quantity should be observed by each replenishment. Constraint (7) links up the two variables and . Constraint (8) implies that no replenishment happens between the same stocks. Constraint (9) presents the range of all variables.
By solving model SPJRPP, the total replenishment cost of the distribution system is minimized and an optimal inventory replenishment solution is generated. Thus, the unnecessary products’ transportation and material losses are avoidable. Then, CO2 emissions are also reduced. This will contribute to the distribution process of the CE concept.
Because of the maximum joint replenishment quantity constraints, the target common service level of the inventory system αt may not always be achieved. In order to always achieve αt, we can define the following parameter and the decision variable , and replace constraint (6) with constraint (10). If the sum of the required replenishment quantities of all products is larger than the maximum joint replenishment quantity, . Thus, all must be finished using external freight capacity, where a greater replenishment cost must be paid. Then, objective function (1) can be revised to Equation (11).
: shipping cost of per volume product from stock i to stock j by external freighters
: replenishment volume of product over the given maximum joint replenishment quantity between any two stocks i and j, which must be purchased from external freighters
3.2. Analysis
As we mentioned in Section 1, there are some features for our proposed model SPJRPP, such as the joint replenishment of multiple products, the maximum joint replenishment quantity, the horizontal inventory replenishments, and the distribution centers at producers’ locations (PDC). In order to prove the advantages of model SPJRPP, the following comparisons can be conducted based on the total cost of the distribution system.
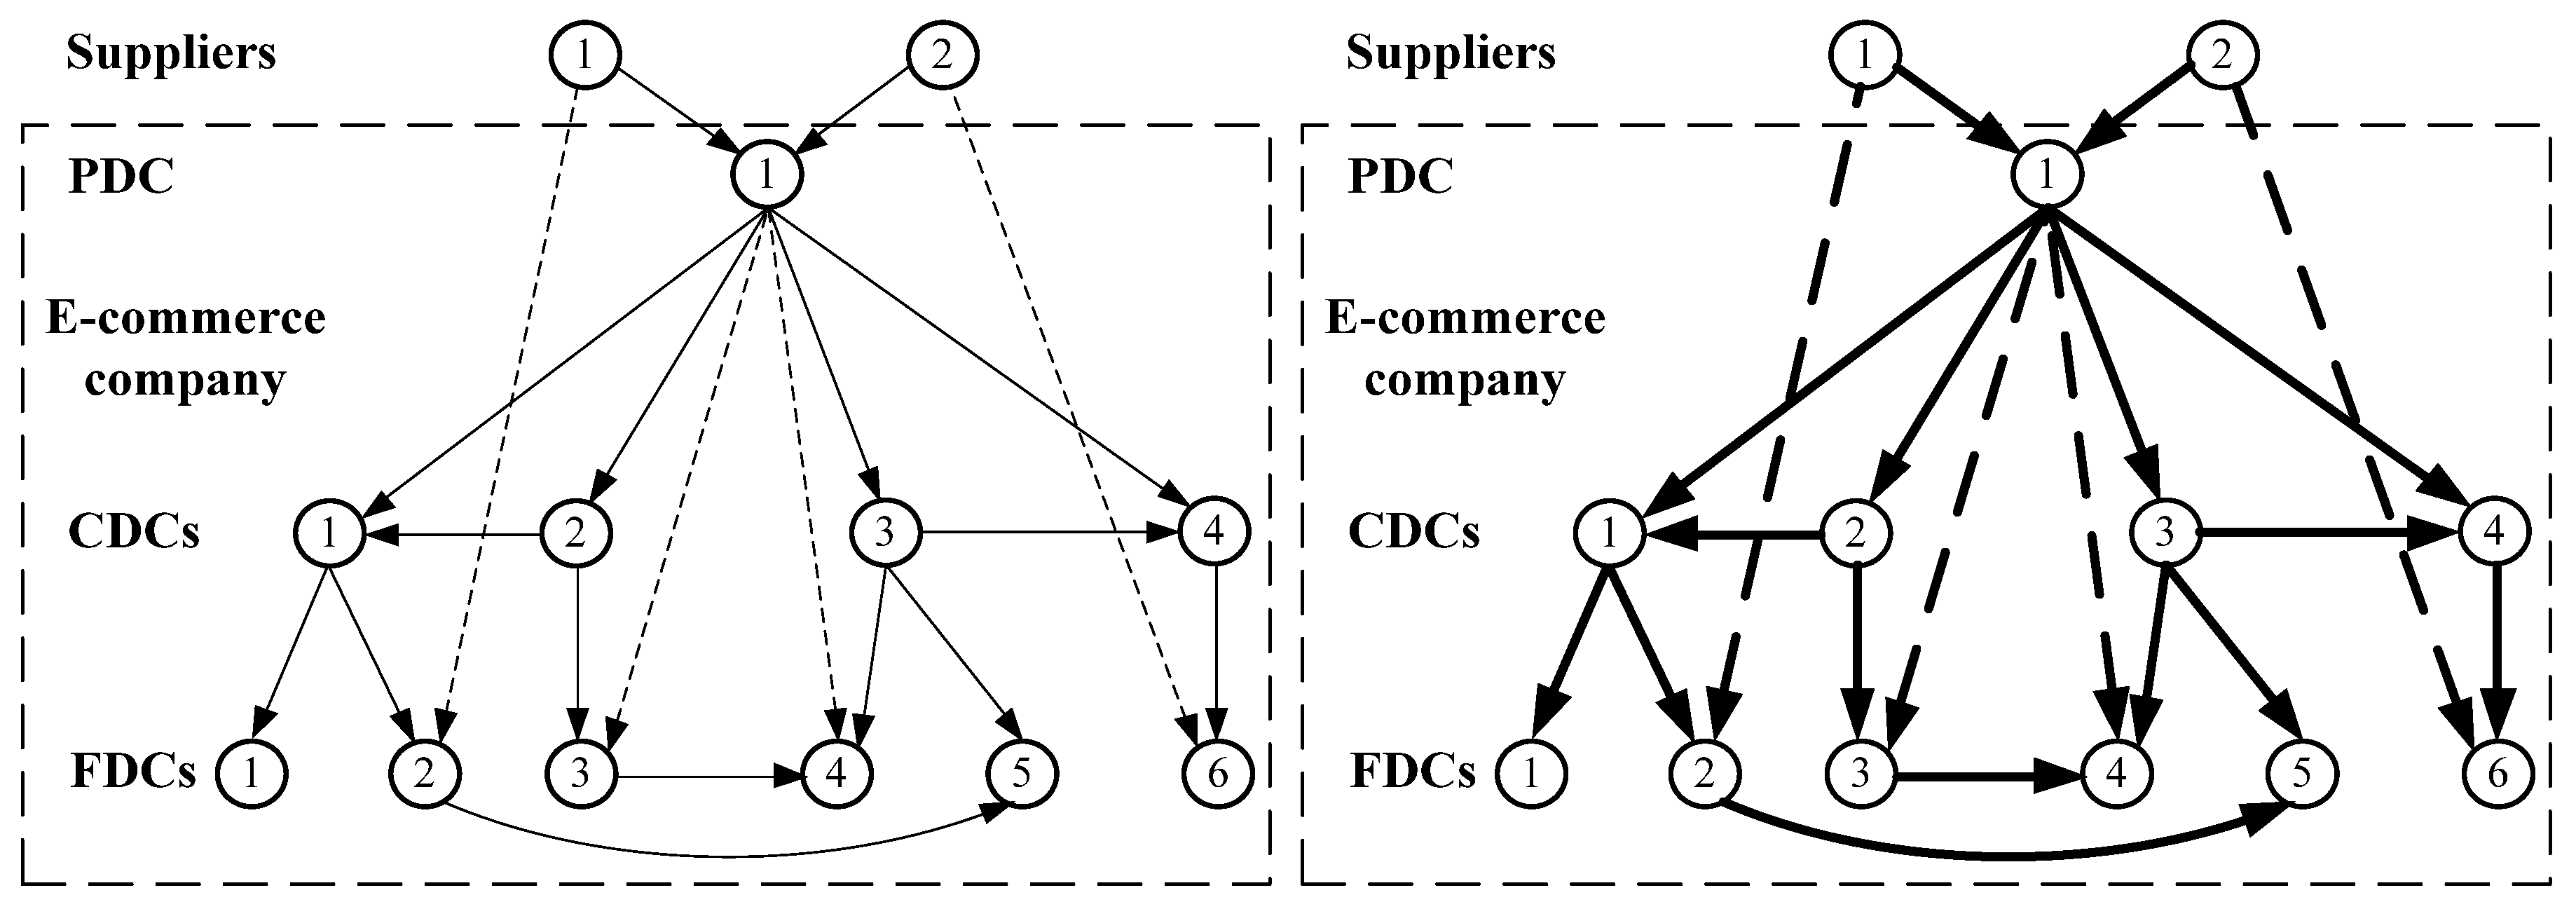
a. The distribution system without (left) and with (right) PDC, which is shown in Figure 4.
b. The distribution system without (left) and with (right) horizontal inventory replenishments, which is shown in Figure 5.
c. The distribution system with different maximum joint replenishment quantities, which is shown in Figure 6. The maximum joint replenishment quantities in the right system of Figure 6 (thick lines among stocks) are set as multiple times of those in the left system of Figure 6 (thin lines among stocks).
4. Results
To validate and evaluate the model SPJRPP, computational experiments will be carried out in the following. Using the data of Alibaba in [37], we generate three sets of examples, where each set has ten instances.
The inventory quantity of each product at each stock before replenishment is randomly generated, where the suppliers will hold sufficient inventories of all products. The transportation cost of any two stocks is calculated using Euclidean distance. Furthermore, both the maximum joint replenishment quantity and the demand information of all products in FDCs are set from Alibaba’s data.
To perform a sensitive analysis on the tested examples, the common service level αt is set to 92% (Case 1), 95% (Case 2), and 98% (Case 3). The corresponding is set to 1.41 (Case 1), 1.65 (Case 2), and 2.06 (Case 3), respectively. Furthermore, there are fifteen stocks that include four suppliers, one PDC, four CDCs, and six FDCs in the distribution system, where four products are replenished.
To solve the models in all examples, ILOG Cplex 12.9 is employed and run on a personal computer. As only a few seconds is required to solve a model, the solution method is not discussed in this paper. Table 1, Table 2, Table 3, Table 4, Table 5, Table 6, Table 7, Table 8 and Table 9 present all numerical results.
Table 1, Table 2 and Table 3 show the tested results of instance set 1 from Case 1 to Case 3. In these tables, CNP indicates the total replenishment cost of the system in the absence of PDC; CWP indicates the total replenishment cost of the system in the presence of PDC; and CRP denotes the cost decrease by introducing PDC, i.e., CRP = (CNP − CWP)/CNP.
Table 4, Table 5 and Table 6 show the tested results of instance set 2 from Case 1 to Case 3. CNH indicates the total replenishment cost of the system in the absence of horizontal replenishment; CWH indicates the total replenishment cost of the system in the presence of horizontal replenishment; and CRH denotes the cost decrease by introducing horizontal replenishment, i.e., CRH = (CNH − CWH)/CNH.
In addition, three scenarios (MR1, MR2, and MR3) are designed for making another sensitivity analysis, where the maximum joint replenishment quantities are changed in each scenario for every instance. In MR1, they are set according to Alibaba’s data. In MR2, they are set as two times those in MR1. In MR3, they are set as two times those in MR2. Table 7, Table 8 and Table 9 show the tested results of instance set 3 from Case 1 to Case 3. CRM denotes the cost decrease by comparing MR3 with MR1, i.e., CRM = (MR1 − MR3)/MR1.
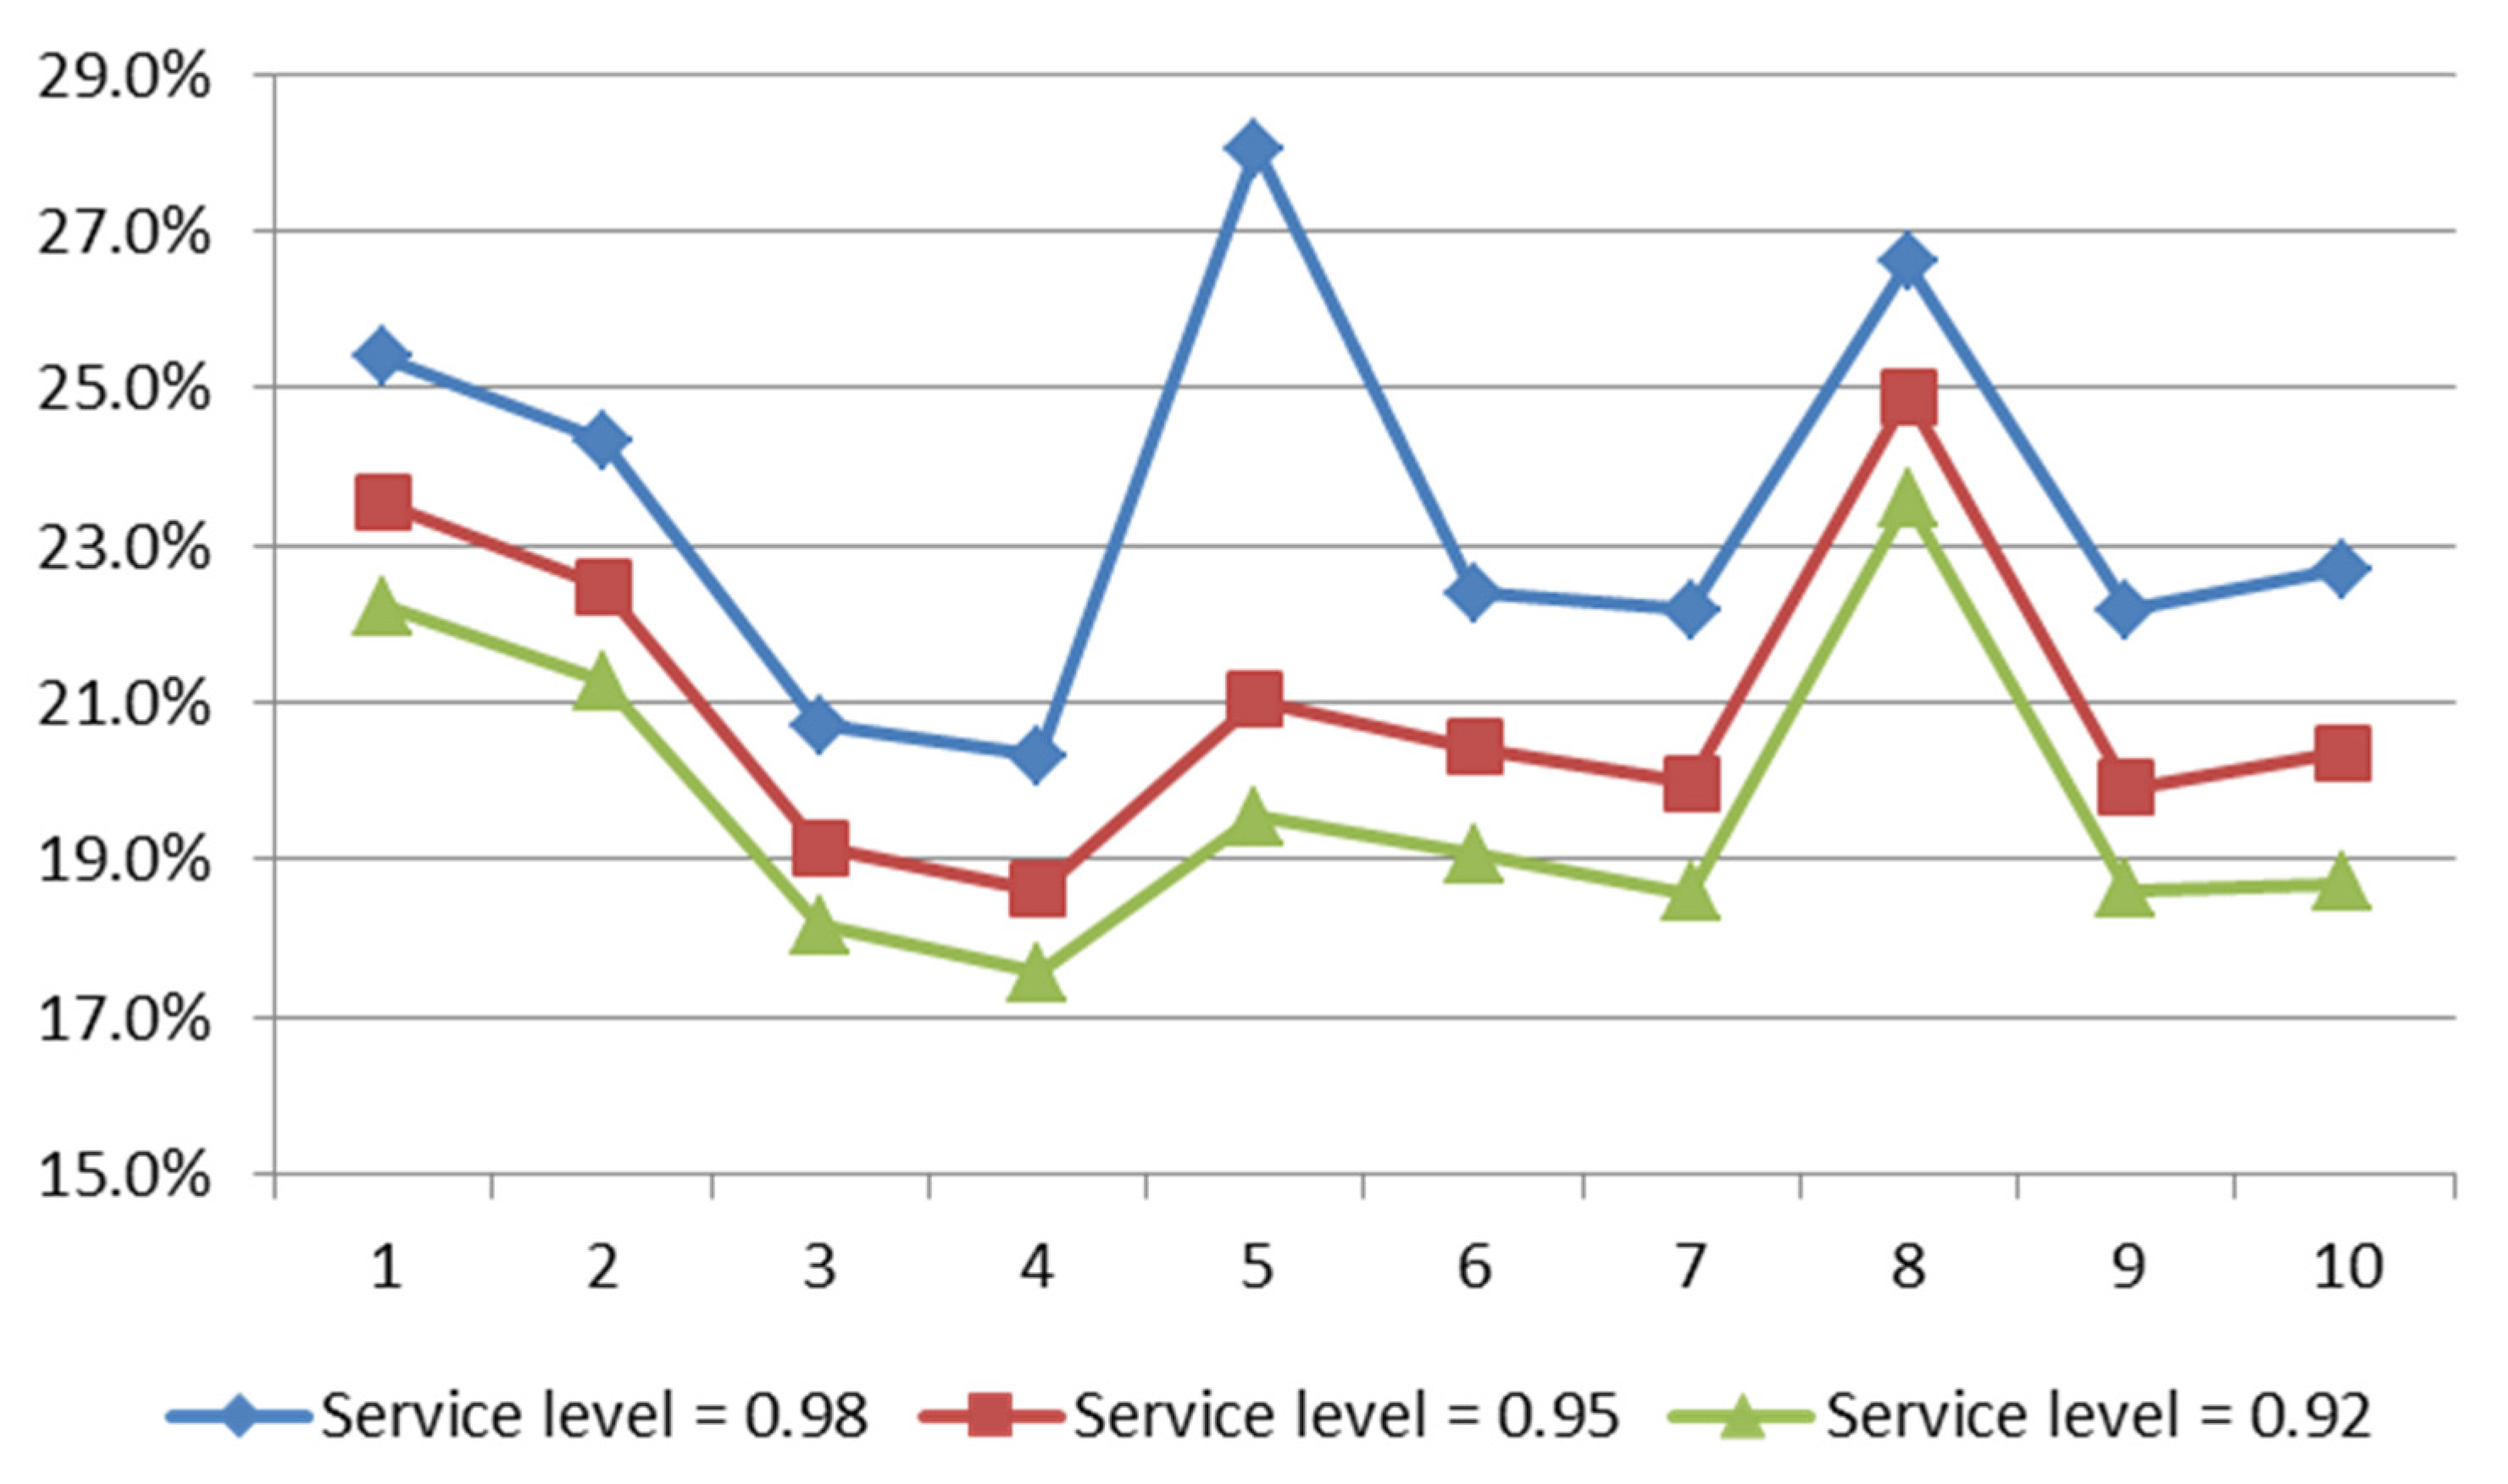
As shown in Table 1, Table 2 and Table 3, if a common service level of the distribution system is given, the total replenishment cost of the system is greatly decreased by introducing PDCs in all instances, where the cost decrease percentage in each instance is between 17.6% and 28%. This is the result of the consolidation of products in PDCs in as opposed to replenishing to CDCs or FDCs in small batches from suppliers. For the studied distribution system, Figure 7 reveals that the total replenishment cost reduction percentage is slightly increased along with the increase of the service level in each instance, which is slightly different in all instances.
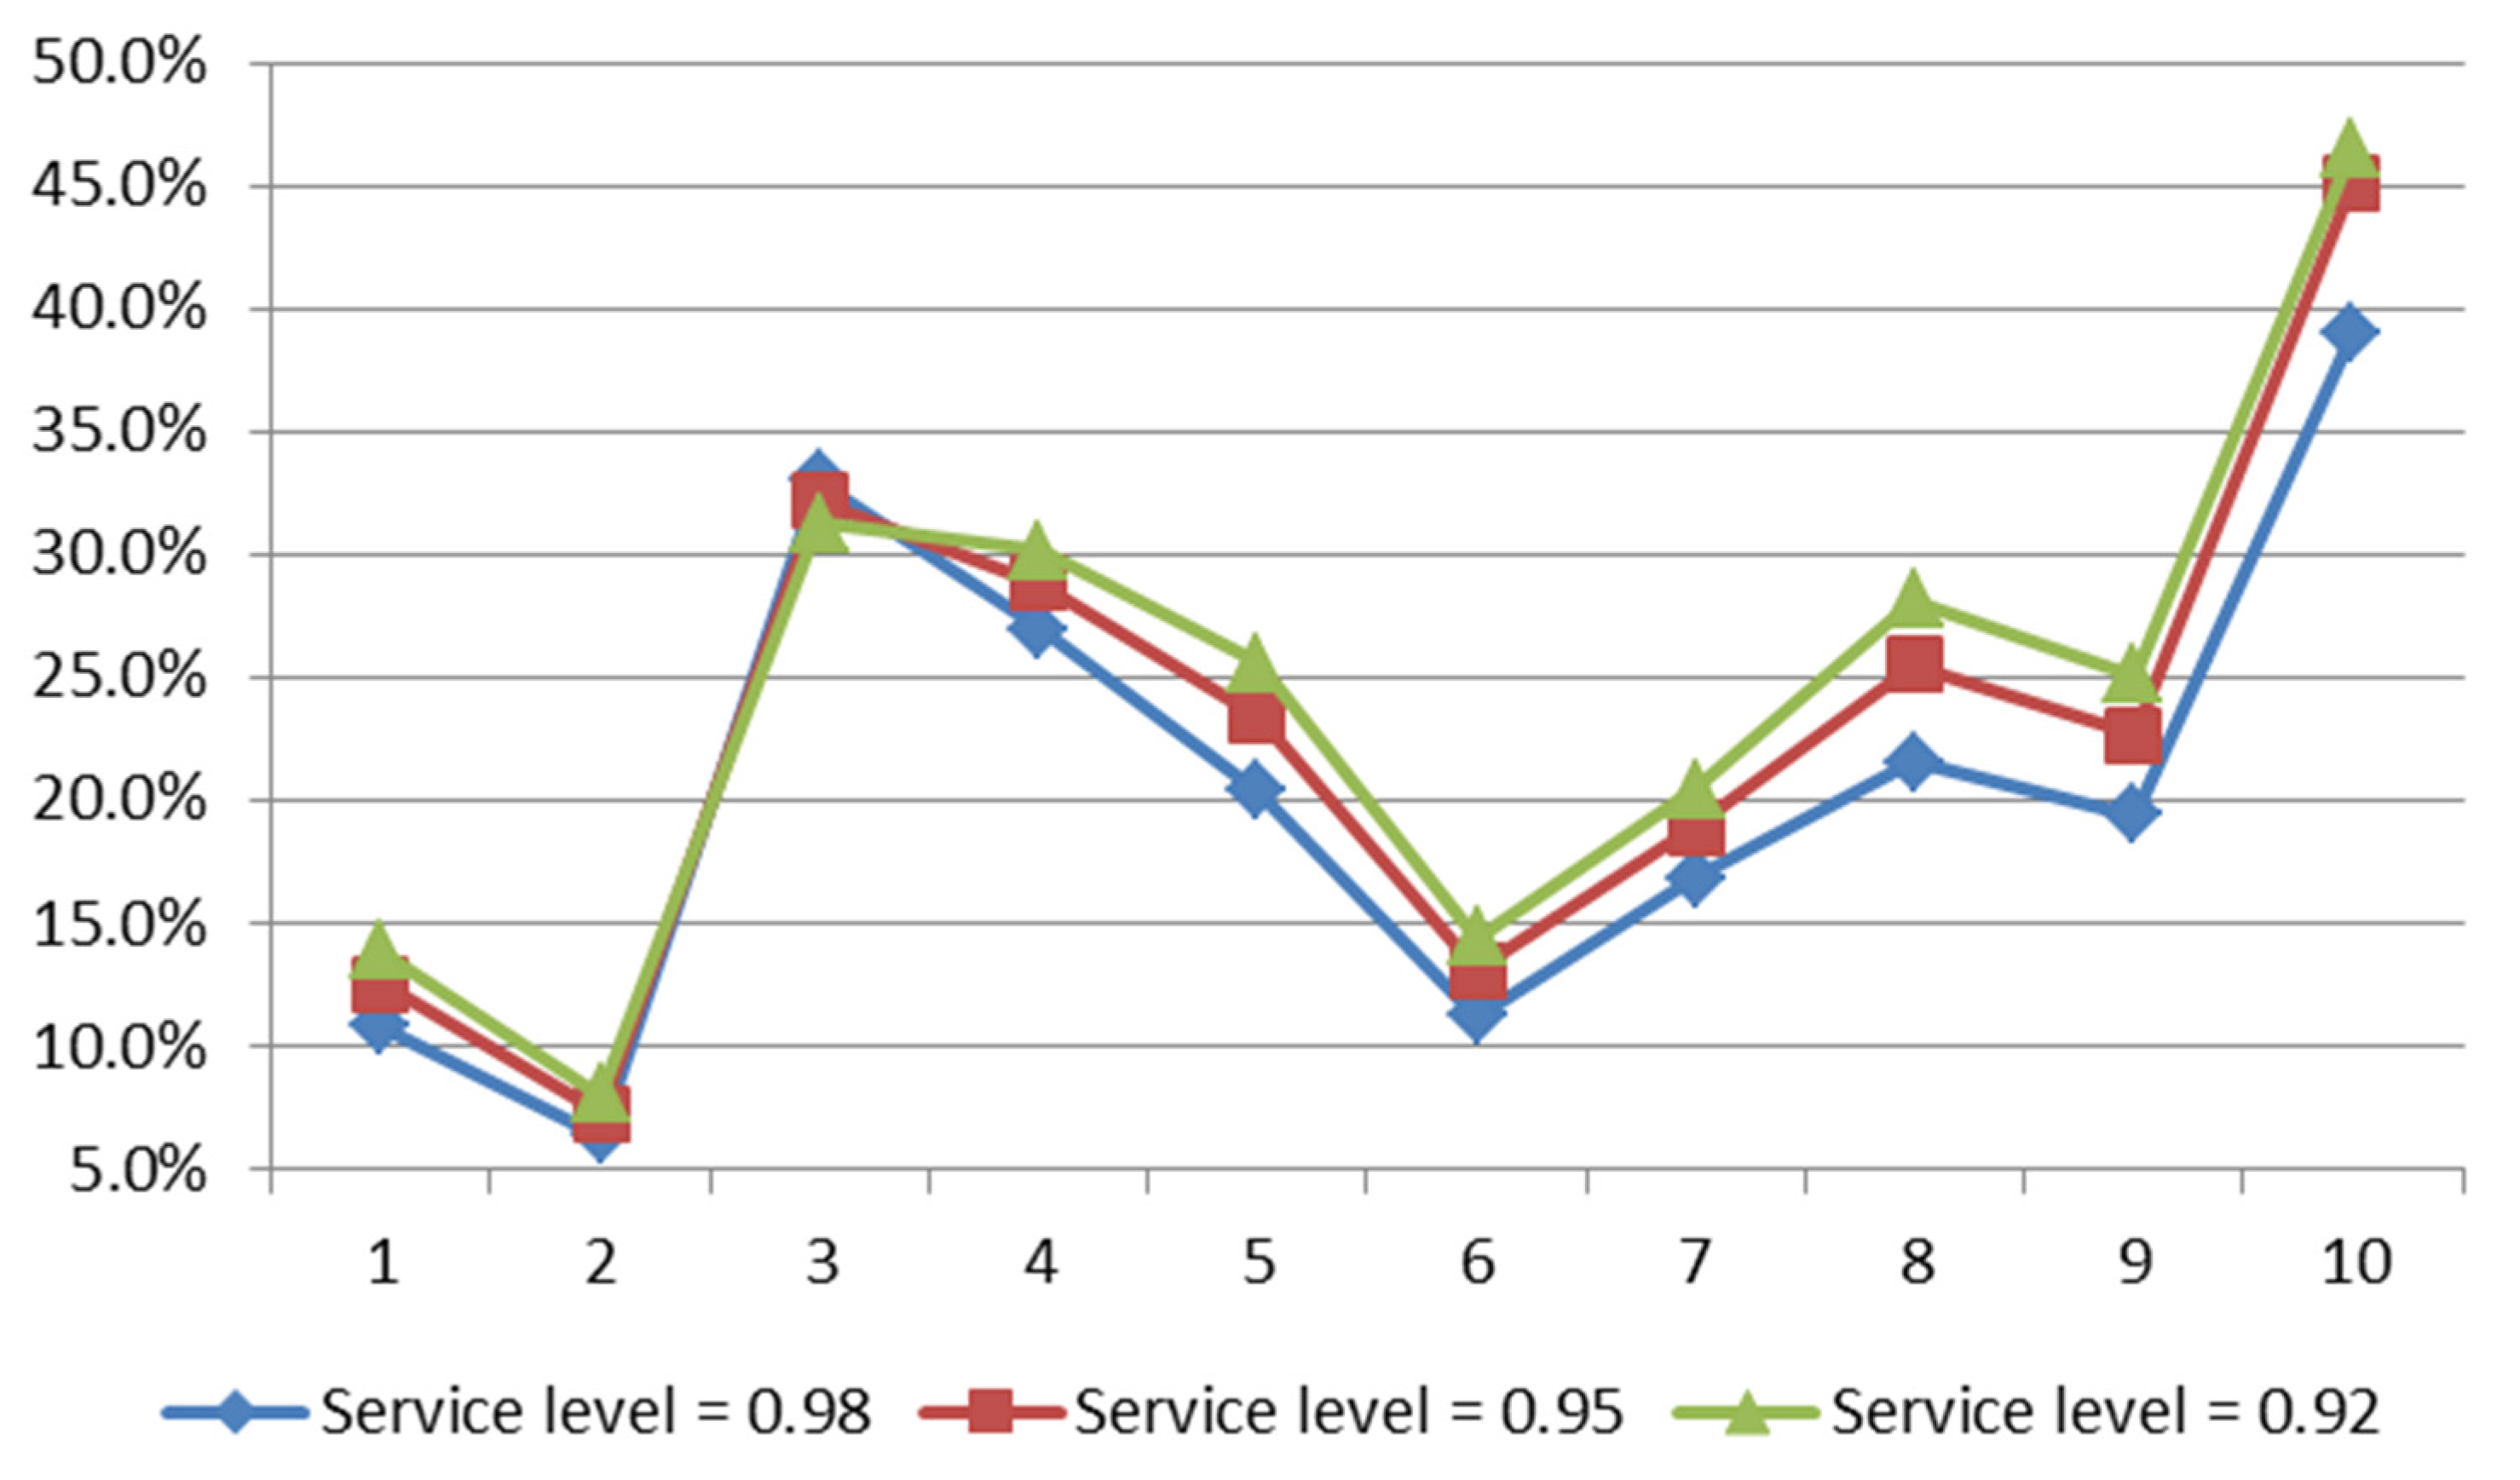
From Table 4, Table 5 and Table 6, if a common service level of the distribution system is given, the total replenishment cost of the system is greatly decreased by allowing horizontal replenishment for all instances, where the cost reduction percentage in each instance is between 6.4% and 46.5%. This is due to the horizontal replenishment among CDCs or PDCs, which can avoid some remote replenishment from PDCs or suppliers. For the studied distribution system, Figure 8 reveals that the total replenishment cost reduction percentage is slightly varied along with the variation of the service level in each instance, which is obviously different in all instances.
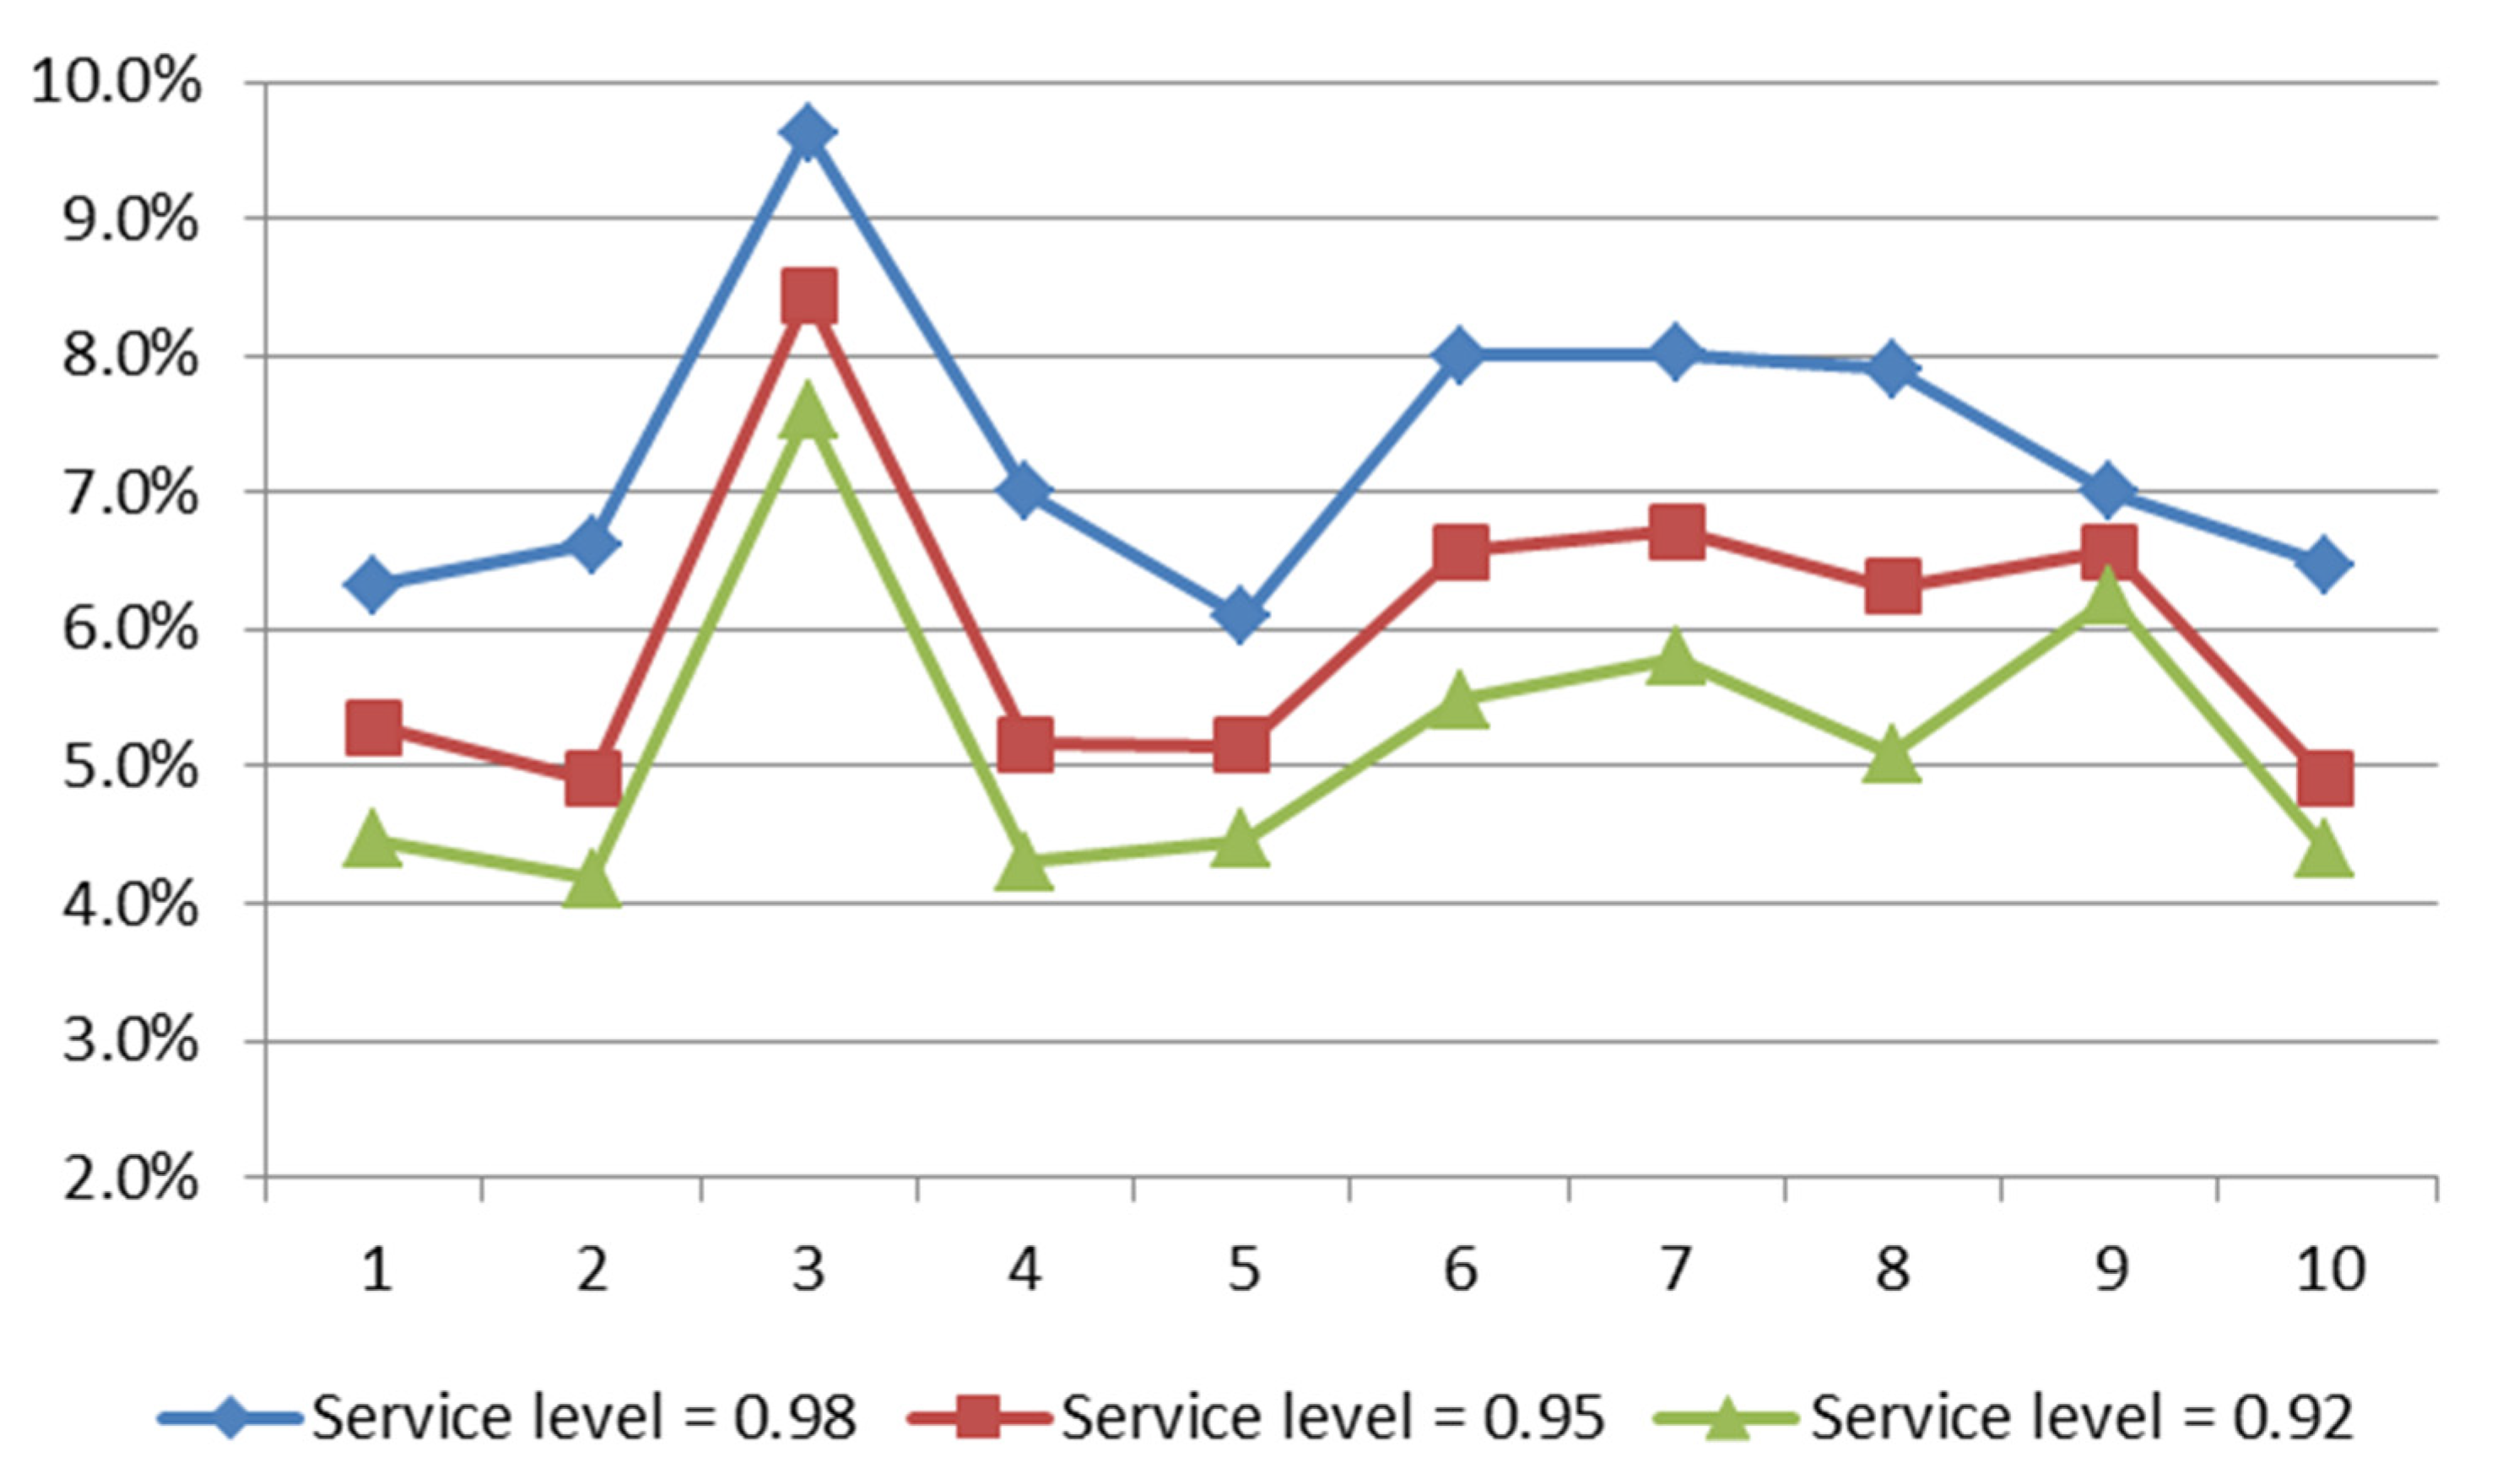
From Table 7, Table 8 and Table 9, if a common service level of the distribution system is given, the total replenishment cost of the system with larger maximum joint replenishment quantities is lower than that of the system with smaller maximum joint replenishment quantities for all instances, where the cost reduction percentage in each instance is between 4.2% and 8.4%. This is because greater quantities of products can be supplied to a stock in one replenishment. For the studied distribution system, Figure 9 reveals that the total replenishment cost reduction percentage is increased along with the increase of the service level in each instance, which is also different in all instances.
In recently years, new retailing has been widely explored in China, where the demand for fresh products such as fruit and vegetables is sharply increased. Therefore, e-commerce companies like Alibaba are continuously improving their distribution systems to better respond to customers’ demand. As we know, the places of origin of fresh products are usually far away from cities and located in less developed areas, where only limited transportation capacities are available. Thus, the findings of PDCs and the permit of horizontal replenishment can significantly decrease the total replenishment cost of the system. Besides economic effects, there are some social effects. For example, the setup of PDCs brings the need for human resources and infrastructure input, which can provide employment opportunities for local areas. Furthermore, the studied distribution system is also beneficial to realize the circular economy concept. Through effective replenishment planning, not only is the replenishment cost of the distribution system efficiently decreased, but also the unnecessary transportations are decreased, which helps to reduce CO2 emissions and the wastages of commodities.
5. Conclusions
In this paper, we consider joint inventory replenishment planning of Alibaba’s distribution system towards the circular economy with distribution centers at producers’ locations (PDCs). To address the problem, we formulate a mathematical model and test thirty instances based on data of Alibaba. The computational results show the validation of our model and the effectiveness of introducing PDCs and horizontal replenishment into the distribution system, which can reduce unnecessary products’ transportations and help move towards the CE concept. The limitation of this research is that stationary demands are considered for each stock.
In the future, our challenges are to study more complex distribution systems of Alibaba. For instance, a multi-period replenishment planning problem with non-stationary demands can be investigated. In addition, inventory replenishment planning with bi-objectives is worth studying, where both the common service level and the total replenishment cost of the distribution system must be optimized at the same time.
Author Contributions
Conceptualization, F.L.; methodology, B.D.; validation, B.D.; formal analysis, B.D.; investigation, F.L.; data curation, B.D.; writing—original draft preparation, B.D.; writing—review and editing, F.L. All authors have read and agreed to the published version of the manuscript.
Funding
This study is supported by the Scientific Research Foundation of Hunan Evaluation Committee of Social Science Results (Grant No.XSP21YBC477), the Scientific Research Foundation of Hunan Provincial Department (Grant No. 19C1053), the Youth Foundation of Social Science and Humanity of China Ministry of Education (Grant No. 19YJC630074), and the Innovation-Driven Foundation of Hunan University of Technology and Business (Grant No.2020QD02).
Institutional Review Board Statement
Not applicable.
Informed Consent Statement
Not applicable.
Data Availability Statement
Not applicable.
Acknowledgments
The authors would like to thank the editors for their hard work and the reviewers who dedicated their time for providing valuable and constructive comments.
Conflicts of Interest
The authors declare no conflict of interest.
References
- Geissdoerfer, M.; Savaget, P.; Bocken, N.M.P.; Hultink, E.J. The Circular Economy—A new ustainability paradigm? J. Clean. Prod. 2017, 143, 757–768. [Google Scholar] [CrossRef] [Green Version]
- İzmirli, D.; Ekren, B.Y.; Kumar, V.; Pongsakornrungsilp, S. Omni-Chanel Network Design towards Circular Economy under Inventory Share Policies. Sustainability 2021, 13, 2875. [Google Scholar] [CrossRef]
- Zink, T.; Geyer, R. Circular Economy Rebound. J. Ind. Ecol. 2017, 21, 593–602. [Google Scholar] [CrossRef]
- Blomsma, F.; Brennan, G. The Emergence of Circular Economy: A New Framing around Prolonging Resource Productivity. J. Ind. Ecol. 2017, 21, 603–614. [Google Scholar] [CrossRef]
- Khouja, M. The single-period (news-vendor) problem: Literature review and suggestions for future research. Omega Int. J. Manag. Sci. 1999, 27, 537–553. [Google Scholar] [CrossRef]
- Viswanathan, S. Periodic Review (s, S) Policies for Joint Replenishment Inventory Systems. Manag. Sci. 1997, 43, 1447–1454. [Google Scholar] [CrossRef]
- Aharon, B.; Boaz, G.; Shimrit, S. Robust multi-echelon multi-period inventory control. Eur. J. Oper. Res. 2009, 199, 922–935. [Google Scholar] [CrossRef]
- Veinott, A. On the optimality of (s, S) inventory policies: New conditions and a new proof. SIAM J. Appl. Math. 1966, 14, 1067–1083. [Google Scholar] [CrossRef]
- De Kok, T.; Grob, C.; Laumanns, M.; Minner, S.; Rambau, J.; Schade, K. A typology and literature review onstochastic multi-echelon inventory models. Eur. J. Oper. Res. 2018, 269, 955–983. [Google Scholar] [CrossRef] [Green Version]
- Lin, Y.H.; Leung, J.M.Y.; Zhang, L.M.; Gu, J.W. Single-item repairable inventory system with stochastic new and warranty demands. Transp. Res. Part E Logist. Transp. Rev. 2020, 142, 102035. [Google Scholar] [CrossRef]
- Van der Heijden, M.C.; Diks, E.B.; De Kok, A.G. Stock allocation in general multi-echelon distribution systems with (R, S) order-up-to-policies. Int. J. Prod. Econ. 1997, 49, 157–174. [Google Scholar] [CrossRef] [Green Version]
- Bastos, L.D.S.L.; Mendes, M.L.; Nunes, D.R.D.L.; Melo, A.C.S.; Carneiro, M.P. A systematic literature review on the joint replenishment problem solutions: 2006–2015. Prod. J. 2017, 27. [Google Scholar] [CrossRef] [Green Version]
- Khouja, M.; Goyal, S. A review of the joint replenishment problem literature: 1989–2005. Eur. J. Oper. Res. 2008, 186, 1–16. [Google Scholar] [CrossRef]
- Goyal, S.K.; Satir, A.T. Joint replenishment inventory control: Deterministic and stochastic models. Eur. J. Oper. Res. 1989, 38, 2–13. [Google Scholar] [CrossRef]
- Abouee-Mehrizi, H.; Berman, O.; Sharma, S. Optimal joint replenishment and transshipment policies in a multi-period inventory system with lost sales. Oper. Res. 2015, 63, 261–488. [Google Scholar] [CrossRef]
- Axsäter, S.; Zhang, W.F. A joint replenishment policy for multi-echelon inventory control. Int. J. Prod. Econ. 1999, 59, 243–250. [Google Scholar] [CrossRef]
- Wang, Q.; Axsäter, S. Fixed-interval joint-replenishment policies for distribution systems with multiple retailers and stochastic demand. Nav. Res. Logist. 2013, 60, 637–651. [Google Scholar] [CrossRef]
- Zhou, W.Q.; Chen, L.; Ge, H.M. A multi-product multi-echelon inventory control model with joint replenishment strategy. Appl. Math. Model. 2012, 37, 2039–2050. [Google Scholar] [CrossRef]
- Ji, S.; Zhao, D.; Peng, X. Joint Decisions on Emission Reduction and Inventory Replenishment with Overconfidence and Low-Carbon Preference. Sustainability 2018, 10, 1119. [Google Scholar]
- Kukreja, A.; Schmidt, C.P. A model for lumpy demand parts in a multi-location inventory system with transshipments. Comput. Oper. Res. 2005, 32, 2059–2075. [Google Scholar] [CrossRef]
- Yang, G.; Dekker, R.; Gabor, A.F.; Axsäter, S. Service parts inventory control with lateral transshipment and pipeline stock flexibility. Int. J. Prod. Econ. 2013, 142, 278–289. [Google Scholar] [CrossRef]
- Fattahi, M.; Mahootchi, M.; Moattar Husseini, S.M.; Keyvanshokooh, E.; Alborzi, F. Investigating replenishment policies for centralised and decentralised supply chains using stochastic programming approach. Int. J. Prod. Res. 2015, 53, 41–69. [Google Scholar] [CrossRef]
- Lagodimos, A.G.; Koukoumialos, S. Service performance of two-echelon supply chains under linear rationing. Int. J. Prod. Econ. 2008, 112, 869–884. [Google Scholar] [CrossRef]
- Axsäter, S. Approximate optimization of a two-level distribution inventory system. Int. J. Prod. Econ. 2003, 81, 545–553. [Google Scholar] [CrossRef]
- Al-Rifai, M.H.; Rossetti, M.D. An efficient heuristic optimization algorithm for a two-echelon (R, Q) inventory system. Int. J. Prod. Econ. 2007, 109, 195–213. [Google Scholar] [CrossRef]
- Berling, P.; Marklund, J. Multi-echelon inventory control: An adjusted normal demand model for implementation in practice. Int. J. Prod. Res. 2014, 52, 3331–3347. [Google Scholar] [CrossRef]
- Tanrikulu, M.M.; Şen, A.; Alp, O. A joint replenishment policy with individual control and constant size orders. Int. J. Prod. Res. 2010, 48, 4253–4271. [Google Scholar] [CrossRef]
- Chen, H.X.; Dai, B.; Li, Y.A.; Zhang, Y.D.; Wang, X.Q.; Deng, Y.M. Stock Allocation in a Two-Echelon Distribution System Controlled by (s, S) Policies. Int. J. Prod. Res. 2020. [Google Scholar] [CrossRef]
- Forsberg, R. Exact evaluation of (R, Q)-policies for two-level inventory systems with Poisson demand. Eur. J. Oper. Res. 1997, 96, 130–138. [Google Scholar] [CrossRef]
- Çapar, I. Joint shipment consolidation and inventory decisions in a two-stage distribution system. Comput. Ind. Eng. 2013, 66, 1025–1035. [Google Scholar] [CrossRef]
- Jalali, H.; Nieuwenhuyse, I.V. Simulation optimization in inventory replenishment: A classification. IIE Trans. 2015, 47, 1217–1235. [Google Scholar] [CrossRef]
- Tsai, S.C.; Chen, S.T. A simulation-based multi-objective optimization framework: A case study on inventory management. Omega 2017, 70, 148–159. [Google Scholar] [CrossRef]
- Noordhoek, M.; Dullaert, W.; Lai, D.S.W.; Leeuw, S.D. A simulation-optimization approach for a service-constrained multi-echelon distribution network. Transp. Res. Part E Logist. Transp. Rev. 2018, 114, 292–311. [Google Scholar] [CrossRef] [Green Version]
- Carvajal, J.; Castano, F.; Sarache, W.; Costa, Y. Heuristic approaches for a two-echelon constrained joint replenishment and delivery problem. Int. J. Prod. Econ. 2020, 220, 107420. [Google Scholar] [CrossRef]
- Nguyen, D.H.; Chen, H.X. Supplier selection and operation planning in biomass supply chains with supply uncertainty. Comput. Chem. Eng. 2018, 118, 103–117. [Google Scholar] [CrossRef]
- Dai, B.; Chen, H.X.; Li, Y.A.; Zhang, Y.D.; Wang, X.Q.; Deng, Y.M. Inventory replenishment planning in a distribution system with safety stock policy and minimum and maximum joint replenishment quantity constraints. In Proceedings of the International Conference on Industrial Engineering and Systems Management, Shanghai, China, 25–27 September 2019. [Google Scholar]
- Dai, B.; Chen, H.X.; Li, Y.A.; Zhang, Y.D.; Wang, X.Q.; Deng, Y.M. Inventory Replenishment Planning of a Distribution System with Storage Capacity Constraints and Multi-Channel Order Fulfilment. Omega Int. J. Manag. Sci. 2020. [Google Scholar] [CrossRef]
- Bijvank, M.; Vis, I.F. Lost-sales inventory theory: A review. Eur. J. Oper. Res. 2011, 215, 1–13. [Google Scholar] [CrossRef]
Figure 1.
A traditional distribution system for retailing.

Figure 2.
A three-echelon distribution system of Alibaba. CDC, central distribution center; FDC, front distribution center.
Figure 2.
A three-echelon distribution system of Alibaba. CDC, central distribution center; FDC, front distribution center.

Figure 3.
A multiple-echelon distribution system with producers’ distribution center (PDC) in Alibaba.
Figure 3.
A multiple-echelon distribution system with producers’ distribution center (PDC) in Alibaba.

Figure 4.
A distribution system without and with PDC.

Figure 5.
A distribution system without and with horizontal replenishments.

Figure 6.
A distribution system with different maximum joint replenishment quantities.

Figure 7.
Total replenishment cost reduction percentage of the system by adding PDCs.

Figure 8.
Total replenishment cost reduction percentage of the system by adding horizontal replenishment.
Figure 8.
Total replenishment cost reduction percentage of the system by adding horizontal replenishment.

Figure 9.
Total replenishment cost reduction percentage of the system by increasing the maximum joint replenishment quantities.
Figure 9.
Total replenishment cost reduction percentage of the system by increasing the maximum joint replenishment quantities.


Table 1.
Computational results of the first instances set in Case 1.
| Cost | 1 | 2 | 3 | 4 | 5 | 6 | 7 | 8 | 9 | 10 |
|---|---|---|---|---|---|---|---|---|---|---|
| CWP | 36,932.1 | 36,438.9 | 38,743.4 | 36,687 | 36,694.8 | 38,981.4 | 38,405.2 | 37,720.3 | 39,171.6 | 36,551.8 |
| CNP | 47,488.2 | 46,279.3 | 47,337.7 | 44,500.3 | 45,612.4 | 48,169 | 47,169.6 | 49,363.6 | 48,132.6 | 44,959.1 |
| CRP | 22.2% | 21.3% | 18.2% | 17.6% | 19.6% | 19.1% | 18.6% | 23.6% | 18.6% | 18.7% |
Table 2.
Computational results of the first instances set in Case 2.
| Cost | 1 | 2 | 3 | 4 | 5 | 6 | 7 | 8 | 9 | 10 |
|---|---|---|---|---|---|---|---|---|---|---|
| CWP | 40,171.2 | 39,868 | 41,947.5 | 40,177.8 | 39,944.6 | 42,756.5 | 42,120.1 | 41,385.9 | 42,933.6 | 40,458.6 |
| CNP | 52,539.5 | 51,436.3 | 51,884.2 | 49,376.5 | 50,592 | 53,740.9 | 52,634.3 | 55,105.8 | 53,614.9 | 50,808.2 |
| CRP | 23.5% | 22.5% | 19.2% | 18.6% | 21% | 20.4% | 20% | 24.9% | 19.9% | 20.4% |
Table 3.
Computational results of the first instances set in Case 3.
| Cost | 1 | 2 | 3 | 4 | 5 | 6 | 7 | 8 | 9 | 10 |
|---|---|---|---|---|---|---|---|---|---|---|
| CWP | 46,143 | 46,255.7 | 48,003.3 | 46,669.3 | 42,999.3 | 49,850.3 | 48,983.6 | 48,274.1 | 50,156.5 | 47,779.5 |
| CNP | 61,841.9 | 61,126.8 | 60,545.1 | 58,576.4 | 59,750.3 | 64,237.2 | 62,942.1 | 65,762 | 64,448.9 | 61,811.9 |
| CRP | 25.4% | 24.3% | 20.7% | 20.3% | 28% | 22.4% | 22.2% | 26.6% | 22.2% | 22.7% |
Table 4.
Computational results of the second instances set in Case 1.
| Cost | 1 | 2 | 3 | 4 | 5 | 6 | 7 | 8 | 9 | 10 |
|---|---|---|---|---|---|---|---|---|---|---|
| CWH | 16,693.5 | 20,031.4 | 6824.78 | 5929 | 12,192.4 | 17,757.1 | 12,449.3 | 8698.53 | 12,497.5 | 3816.82 |
| CNH | 19,380.2 | 21,781.6 | 9928.04 | 8492.26 | 16,383.1 | 20,753.5 | 15,644.3 | 12,099.8 | 16,682.9 | 7135.07 |
| CRH | 13.9% | 8% | 31.3% | 30.2% | 25.6% | 14.4% | 20.4% | 28.1% | 25.1% | 46.5% |
Table 5.
Computational results of the second instances set in Case 2.
| Cost | 1 | 2 | 3 | 4 | 5 | 6 | 7 | 8 | 9 | 10 |
|---|---|---|---|---|---|---|---|---|---|---|
| CWH | 18,465.2 | 22,007.6 | 7222.13 | 6636.09 | 13,622.1 | 19,720.1 | 13,876.2 | 9931.27 | 14,125.2 | 4397.65 |
| CNH | 21,119.6 | 23,742.4 | 10,646.3 | 9322.92 | 17,788.7 | 22,697 | 17,110.5 | 13,337.3 | 18,270.5 | 8018.24 |
| CRH | 12.6% | 7.3% | 32.2% | 28.8% | 23.4% | 13.1% | 18.9% | 25.5% | 22.7% | 45.2% |
Table 6.
Computational results of the second instances set in Case 3.
| Cost | 1 | 2 | 3 | 4 | 5 | 6 | 7 | 8 | 9 | 10 |
|---|---|---|---|---|---|---|---|---|---|---|
| CWH | 21,504.6 | 25,420.5 | 7957.23 | 7865.67 | 16,074.5 | 23,095.5 | 16,320.2 | 12,119.2 | 16,913.7 | 5818 |
| CNH | 24,118.3 | 27,157.6 | 11,879.3 | 10,766.3 | 20,190.3 | 26,021 | 19,625.1 | 15,454.3 | 20,986.8 | 9542.25 |
| CRH | 10.8% | 6.4% | 33% | 26.9% | 20.4% | 11.2% | 16.8% | 21.6% | 19.4% | 39% |
Table 7.
Computational results of the third instances set in Case 1.
| Cost | 1 | 2 | 3 | 4 | 5 | 6 | 7 | 8 | 9 | 10 |
|---|---|---|---|---|---|---|---|---|---|---|
| MR1 | 36,421.6 | 35,687.7 | 37,834.3 | 35,792.5 | 36,111.8 | 37,972.8 | 37,521.1 | 36,871 | 38,592.4 | 35,933.4 |
| MR2 | 35,294.6 | 34,505.8 | 35,504.4 | 34,595.3 | 34,662.5 | 36,114.6 | 35,738.5 | 35,438.4 | 36,866.6 | 34,859.5 |
| MR3 | 34,796 | 34,198.4 | 34,961.8 | 34,252 | 34,502.2 | 35,891.8 | 35,347.4 | 34,995.1 | 36,183.1 | 34,358 |
| CRM | 4.5% | 4.2% | 7.6% | 4.3% | 4.5% | 5.5% | 5.8% | 5.1% | 6.2% | 4.4% |
Table 8.
Computational results of the third instances set in Case 2.
| Cost | 1 | 2 | 3 | 4 | 5 | 6 | 7 | 8 | 9 | 10 |
|---|---|---|---|---|---|---|---|---|---|---|
| MR1 | 39,639.7 | 38,911.5 | 41,035.3 | 39,091.4 | 39,298.9 | 41,742.1 | 41,207.7 | 40,534.7 | 42,306.3 | 39,603.5 |
| MR2 | 38,141.6 | 37,344.7 | 38,381.7 | 37,419.7 | 37,632.2 | 39,304.4 | 38,976.3 | 38,603.5 | 40,408.6 | 38,196 |
| MR3 | 37,543.8 | 37,003.1 | 37,568.1 | 37,074.2 | 37,273.7 | 39,000.3 | 38,439.7 | 37,975.1 | 39,525.8 | 37,658.7 |
| CRM | 5.3% | 4.9% | 8.4% | 5.2% | 5.2% | 6.6% | 6.7% | 6.3% | 6.6% | 4.9% |
Table 9.
Computational results of the third instances set in Case 3.
| Cost | 1 | 2 | 3 | 4 | 5 | 6 | 7 | 8 | 9 | 10 |
|---|---|---|---|---|---|---|---|---|---|---|
| MR1 | 45,165.2 | 44,773.4 | 46,510 | 45,052.3 | 44,849.2 | 48,209.7 | 47,556.2 | 46,844.2 | 48,729.4 | 46,280.2 |
| MR2 | 43,365.9 | 42,222.7 | 43,325.6 | 42,247.3 | 42,793 | 44,798.1 | 44,526.5 | 44,045.7 | 46,486.9 | 43,935.5 |
| MR3 | 42,308.9 | 41,811.2 | 42,033 | 41,896.8 | 42,119.2 | 44,353.2 | 43,745.4 | 43,142.1 | 45,314.7 | 43,287.9 |
| CRM | 6.3% | 6.6% | 9.6% | 7% | 6.1% | 8% | 8% | 7.9% | 7% | 6.5% |
Publisher’s Note: MDPI stays neutral with regard to jurisdictional claims in published maps and institutional affiliations. |
© 2021 by the authors. Licensee MDPI, Basel, Switzerland. This article is an open access article distributed under the terms and conditions of the Creative Commons Attribution (CC BY) license (https://creativecommons.org/licenses/by/4.0/).
Share and Cite
MDPI and ACS Style
Dai, B.; Li, F. Joint Inventory Replenishment Planning of an E-Commerce Distribution System with Distribution Centers at Producers’ Locations. Logistics 2021, 5, 45. https://0-doi-org.brum.beds.ac.uk/10.3390/logistics5030045
AMA Style
Dai B, Li F. Joint Inventory Replenishment Planning of an E-Commerce Distribution System with Distribution Centers at Producers’ Locations. Logistics. 2021; 5(3):45. https://0-doi-org.brum.beds.ac.uk/10.3390/logistics5030045
Chicago/Turabian StyleDai, Bo, and Fenfen Li. 2021. "Joint Inventory Replenishment Planning of an E-Commerce Distribution System with Distribution Centers at Producers’ Locations" Logistics 5, no. 3: 45. https://0-doi-org.brum.beds.ac.uk/10.3390/logistics5030045