
Paving the Path towards Efficient Construction Logistics by Revealing the Current Practice and Issues


Department of Science and Technology, Linköping University, 581 83 Linköping, Sweden
*
Author to whom correspondence should be addressed.
Logistics 2021, 5(3), 53; https://0-doi-org.brum.beds.ac.uk/10.3390/logistics5030053
Submission received: 17 June 2021
/
Revised: 30 July 2021
/
Accepted: 3 August 2021
/
Published: 6 August 2021
(This article belongs to the Special Issue Advancing Construction Logistics: Unlocking the Potential for Construction Productivity)
Abstract
:Multiple deliveries and long turnaround times on construction sites harm the environment and disturb on-site productivity and safety. The purpose of this paper is to investigate the transport patterns of construction material deliveries, including turnaround times. In order to investigate the number of transports and turnaround times, transport data for 13 Swedish construction sites, which were collected with the help of booking systems, were used. By comparing data from the cases, several patterns were observed: (i) very few projects receive deliveries at weekends, (ii) almost all projects receive 50% of their daily deliveries before 09:00, (iii) long goods, standard euro pallets and lightweight goods (less than 500 kg) are the most common deliveries, (iv) trucks and delivery vans are the most common vehicles used and (v) goods to be handled by crane and lightweight goods generate the longest turnaround time/delivery. This is one of the rare studies revealing current practice and issues associated with material deliveries, which is a necessary first step to increase efficiency of construction logistics. This study shows that it is possible to influence these issues, as some projects performed better than others regarding turnaround times and transport.
1. Introduction
Construction accounts for 13% of gross domestic product (GDP) globally, and employs 7% of the world’s working population [1], while suffering from low productivity growth rates and being harmful to the environment. According to Pearce and Ahn [2], the construction industry is responsible for 40% of the energy use and one third of greenhouse gas emissions (GHG) worldwide. When it comes to productivity and environmental sustainability in the construction industry, a vast majority of previous studies present the contractor’s perspective [3]. However, in a construction project, 50–70% of resources are used for purchasing services and materials from suppliers and subcontractors [4]. According to a recent study, the cost of materials represents 30–40% of the overall construction costs, and in general, a construction site receives 2–10 deliveries or 8–10 tonnes of material daily [5].
On construction sites, workers spend 15% of their time moving equipment and materials to assembly areas [6], and transportation by hand represents 43% of the logistics cost [7]. The lack of proper logistics management, i.e., poor management of materials, equipment and tools, leads to deficiencies in productivity through low value-adding times [8]. Furthermore, in Sweden, construction-related transport constitutes 22% of all freight transport in urban areas [9]. Previous studies report transport as a major contributor of the GHG emissions for construction projects [10,11], and on average, construction transport accounts for 2.4–5.5% of CO2 emissions from construction [12]. Furthermore, Sezer and Fredriksson [13] have shown that the transport part of the emissions from a construction project is about 10% of the total emissions from the production. Thus, the ineffective management of construction deliveries can increase both the costs and the environmental harm of construction projects [14].
The management of deliveries are part of construction logistics, which focus both on coordinating the fragmented sourcing of materials and resources and their transport to/from the construction site, and coordinating materials and resources within the construction site itself [15]. Although, during the delivery, i.e., arrival and unloading/loading of trucks, these two foci need to be coordinated, which is often considered a secondary issue, leading to productivity losses, both for the construction project and for the suppliers and transporters [16]. Bad coordination of deliveries in the construction industry is a result of neglecting logistics management [9], which depends on the planning of construction works. However, planning differs significantly in the construction industry compared to other industries, for instance planning of bulk transport occurs daily in the construction industry [17]. Furthermore, insufficient planning of construction works by main contractors makes it difficult to improve transport efficiency among suppliers and transporters [18,19]. Clearly, there is a great potential for reducing the number of transports through improved construction logistics management [20]. However, in order to better plan and coordinate construction transports, construction transport patterns need to be investigated and existing problems need to be revealed.
Transport patterns of construction projects have been neglected by previous studies, except in two rare studies [5,21]. Based on observations and interviews in a single case study, Ying et al. [21] investigated contributors to construction logistics inefficiencies as well as truck movement patterns, including 20% of the arrivals occurring before 08:00, slightly more than half of the arrivals occurring either between 08:00 and 10:00 or 12:00 and 14:00 and 87% of the vehicles used for unloading materials or equipment at the site. In a more recent study based on four cases, Guerlain et al. [5] reported several patterns of construction-related urban freight transport, including supply chain validity being temporary, organization mode being a single-drop trip, delivery scheduling being highly used, long stop durations (around 45 min) and with 12.5 to 50 deliveries per week. They concluded that distribution of goods to and from construction sites is not comparable to other urban supply chains. Although useful, these studies are based on single or few cases. Considering that construction transport patterns are expected to vary widely because they are subject to several sources, including site managers and their planning, there is clearly a research gap, requiring a study investigating several projects. Therefore, based on secondary data regarding the deliveries to and from 13 construction projects, this paper sets out to analyse the transport patterns of construction material deliveries, including turnaround times. The scope of this paper is limited to deliveries, which involves the arrival of construction transport vehicles and their unloading/loading on-site, i.e., the turnaround of trucks.
The paper is divided into six sections. Section 2 introduces the previous studies derived from logistics research, elaborating upon the state of construction transport and turnaround times. Section 3 explains the research process and discusses the choices for data collection and analysis. The results, including the analysis of 13 projects, their transport patterns, packages, types of vehicles and turnaround times, are presented in Section 4. These results are discussed in relation to previous studies, and recommendations are provided for future studies in Section 5, followed by conclusions in Section 6.
2. Review of Previous Studies
The construction supply chain consists of three major flows: material, equipment and labour [22]. These flows are delivered by many types of suppliers: material suppliers, equipment suppliers, subcontractors and specialists [23], as well as different types of service providers. The waste flow should not be ignored. Kurdve et al. [24] show that the waste transports for a project can amount to several per week, depending on how the waste collection is organised. The responsibility for planning and coordinating the supply chain and construction site resides with the main contractor [25]. Hence, the main contractor faces the challenge of managing a network of multiple deliveries of different materials, products and resources to the construction site [20].
Transport planning in construction is intrinsically linked to the planning of the construction project’s productivity rates. Transport arrives with materials to be unloaded, or to pick up waste or earth and rock masses, in which case they need to be loaded. In order to avoid too much material accumulating on-site, over the last few decades, the construction industry has started to implement the just-in-time (JIT) system [20]. However, for materials to arrive JIT, the planning of the construction supply chain needs to be coordinated with the planning of the construction activity [19], otherwise there is a risk of delays and thus non-value-adding waiting time for crew [4], which reduces the efficiency of construction logistics.
What exactly is delivered, and in what quantities, depends on the type of construction project (housing, hospitals, infrastructure, renovation, etc.) as well as what phase the project has reached. Though, it is important to note that the materials follow the same patterns between projects, which are dependent on the construction phases [20]. Early phases of construction projects involve bulk transports due to earth and rock masses that need to be removed or added, whereas later in the project, smaller deliveries consisting of pallets and packages are more common [17]. One important aspect determining the efficiency of construction logistics is the planning of deliveries, i.e., offsite logistics, and the handling of unloading or loading, i.e., onsite logistics [16]. The efficiency of this process is manifested in the turnaround time.
Turnaround times are defined by Carboni and Dalla Chiara [26] as the time from when the vehicle arrives at the gate until it drives out of the gate again, i.e., the time spent by the vehicle and its driver at the construction site for loading and unloading operations. The issue of turnaround times is not novel in other industries, such as aircraft and airport planning (e.g., Wu and Caves [27]), vessel and port planning (e.g., Johnson and Styhre [28]) and trucks and terminal planning (e.g., Carboni and Dalla Chiara [26], Phan and Kim [29]). However, only two identified studies have noticed the turnaround times in construction. Guerlain et al. [5] have examined four projects to estimate turnaround times as between 34 min and one hour on average per transport. During this time, on average, the trucks waited between 18 and 36 min for unloading to commence, i.e., this was a total waste of time for the transporter/supplier. In a qualitative case study, Ying et al. [21] identified that the reason behind the problems of long turnaround times in construction is the lack of understanding of their impact. This lack of understanding is an important reason for conducting this study, because the reason behind the interest in turnaround times in other industries is its influence on productivity and sustainability [26,27,28]. The aim is to keep turnaround times as short as possible because, during loading/unloading the truck at the site, one or more people from the crew, often in combination with some type of equipment, must attend, which is non-value-adding time [4]. Furthermore, the longer the turnaround time, i.e., the longer the vehicle is at the site, the higher the risk that there will be yet another vehicle on-site, leading to congestion [29], which increases safety risks and delays.
Even though each project requires a unique setup of materials and resources, there are still several similarities between materials from an unloading and loading perspective, due to the standardisation of load carriers (pallets, packages, waste bins) [20], or standardised vehicles for bulk or concrete [17]. To unload and load trucks efficiently, the right handling equipment must be available and there needs to be a free unloading/loading area. Therefore, organised unloading zones are important [30] to minimise the waste of labour time for material tracking and handling [31]. Palletised goods can be handled using a forklift or a truck with an onboard crane. Packages, on the other hand, require no machinery at all but need to be carried to a weather-proof place. However, we need to acknowledge that in construction, there are also unwieldy materials, such as frames, that need to be unloaded with the help of cranes. Though, relating to the earlier mentioned lack of studies of turnaround times in construction, this is also true for the unloading or loading times of different materials.
Previous research within other industries has shown that, as long as there are standardised load carriers or standardised vehicles, the most important factor affecting turnaround times is the coordination between the arrival of the vehicle and the available resources for unloading/loading [29], i.e., planning. Additionally, the lack of a goods reception function at the site could impede the flow of goods, which has a negative impact on inventory management [32]. Furthermore, according to Bäckstrand and Fredriksson [16], suppliers and transporters often lack information about delivery and transport conditions (e.g., turning circles, type of machinery needed to unload, exact addresses of the gate and phone numbers of the freight or goods receiver). This reduces the efficiency of construction logistics by increasing turnaround times and the risk of extra delivery trips being required. This also applies for earth and rock materials, where the loading and unloading of vehicles is highly dependent on the availability of excavators. Here, there is great potential to improve the efficiency of the construction logistics and reduce costs by rationalising these onsite logistical processes [17].
Lack of coordination is another factor harming the efficiency of construction logistics, and it can be explained by the short-sightedness of logistics planning in construction [19]. For instance, the planning of bulk transport in construction is carried out daily [17]. It is not only regarding bulk transport that there is a lack of planning, but this is also true for other types of materials [19]. Lack of planning of deliveries harms the efficiency of construction logistics in other ways as well. First of all, Josephson and Saukkoriipi [4] reported that Swedish construction workers spend on average more than 50% of their time waiting and handling materials. Thunberg and Persson [33] also show that only 38% of all deliveries are on time, with the right materials of the right quality. For waste transport, the lack of planning leads to a need for larger storage spaces and lower fill rates during transport [24]. Other studies have shown that there is potential to reduce construction transport during the later phases of projects by as much as 60% through improved planning [34]. Another effect of lack of planning seen in other industries is vehicles waiting outside the gate to come in, or onsite congestion due to too many vehicles arriving at the same time in relation to the available unloading/loading resources [29]. In construction, the small inventory locations both on- and off-site, and the general aim of the industry to start with a full stock in the morning and end the day with an empty stock, creates peaks in transport demand and decreases the utilisation of vehicles [17]. This is also what Guerlain et al. [5] identified, where the time vehicles spend waiting for unloading to commence, on average, was between 18 and 36 min for each delivery. Another effect is low fill rates for each vehicle [25], which in turn increases the number of deliveries because the same amount of material still has to be delivered. This increases the total turnaround time for a project.
3. Method
In order to analyse delivery patterns and turnaround times, a quantitative approach based on secondary data was used. To collect data, we started with organisations where delivery data from various projects were stored digitally. Thus, in line with Lacoste and Johnsen [35], we have used ‘tacit knowledge’ gained through longitudinal immersion in the field [36] to guide the selection of illustrative cases in Sweden. This type of data can be found as part of construction logistics setups (CLSs), such as checkpoints [18,37] or construction consolidation centres (CCCs) [20,38]. These setups gather data with the help of booking calendars and/or sensors at the gates, which means these setups track the transport flow to and from sites. The data used in this paper were taken from booking calendars.
Data entered in calendars are based on contractors booking a time for their upcoming delivery. Companies also book the equipment required for unloading deliveries by registering the type of cargo and the load carrier. When the deliveries arrive, they are entered into the booking system, as is the truck’s departure when they leave. Poor data quality has been an issue during data collection and can have severe impacts [39]. Data quality can be measured by drawing upon several dimensions, including accessibility, completeness, ease of manipulation, whether it is error-free and interpretability [40]. When assessing data quality, it is important to separate task-independent and task-dependent assessments, where task-dependent assessments include knowledge about the application’s context [40]. When assessing data for construction logistics, it is important to be aware of the rules that have been set for booking. Booking calendars only contain material and machinery deliveries, and there is low adherence to the rules. Moreover, whole-day tasks, such as the transport of excavated materials or concrete, are often not booked as single deliveries, instead they are booked as full days. However, here, we had the opportunity to see the number of single entries in a day, but still, there is a risk that there will be flaws in the data recording the number of transports.
Construction projects are expected to vary widely. This means that their delivery patterns are expected to be influenced by a number of sources, including site managers and their planning. Since delivery patterns are expected to be influenced by project characteristics, a multiple case study approach was chosen for this research, involving the type, size and value of construction projects. The projects were also selected based on the available data regarding delivery weight, time, vehicle and unloading equipment. According to Dubois and Araujo [41], case studies are useful for “the detailed explanation as to why particular outcomes occur”, and they provide rich, empirical and contemporary descriptions derived from the investigation of a particular phenomenon [42,43]. Unlike single case studies, multiple cases enable comparison and show whether an emergent finding is repeated consistently in several cases, and multiple cases enable a broader explanation of research questions and theoretical elaboration, and generate a more robust, generalisable and testable theory [42].
For this reason, 13 cases were identified from Southern Sweden (see Table 1). These projects consisted of six new housing projects, two new offices, two large projects, including new offices and housing, and three hospital projects. The majority had design-build contracts, while three were partnering projects (E, F and G). In two of the projects (A and B), divided contracts were used, where the construction work was divided into subcontracts and assigned to different contractors. Construction methods did not vary much among the projects. In most of them, prefabricated frames, prefabricated double walls and prefabricated concrete floor slabs were used, while in Project N, a steel structure was used. In terms of challenges faced during the construction process, some of the projects (C, D, F, H and N) are located very close to the sea, which made the foundations very important to ensure that water will not be a problem during the use phase of the buildings. Additionally, Project D had a tight construction site due to its location. Project F was certified with the WELL Building Standard, which meant that extra measures were taken to improve indoor environmental quality. In Project H, solar panels were installed as well as other environmental measures related to waste and biogas use. Solar panels were also installed in Project N, together with a glass façade. Project B was the only passive house among the 13 projects. Project G was a very digitalised project, with records of the building process and materials being kept digitally and linked to the BIM model.
The data cover different percentages of the projects’ timelines and therefore investigate different phases. All projects’ data were gathered from the same company, coordinating the logistics for the projects. The standard booking rules for the company are planned bookings 5 days ahead of delivery and payment per pallet. Some projects also had onsite night-time handling included (projects A, B, E and G). One project, A, had night-time deliveries only. During the daytime, it was possible to deliver smaller packages to a container outside the site.
Considering the purpose of this paper—to investigate the transport patterns of construction material deliveries, including turnaround times—an exploratory approach was used for the data analysis. According to Yin [43], case studies are suitable for exploratory research where daily activities are being investigated over time. The data from the cases were compared to identify differences between the cases to reveal determinants. The determinants were: type of project, size of project (gross floor area and value), project phase, type of vehicle, timing of the transport, weight of delivery and whether deliveries were planned or unplanned.
In order to increase the reliability and validity of the findings, three meetings were held with the logistics consultant of the thirteen projects, where two representatives, business and quality managers attended. These meetings primarily helped us to make better sense of the secondary data and reduce the issues related to data quality. In the third meeting, results from the analysis were presented to the representatives and were confirmed by them.
4. Results
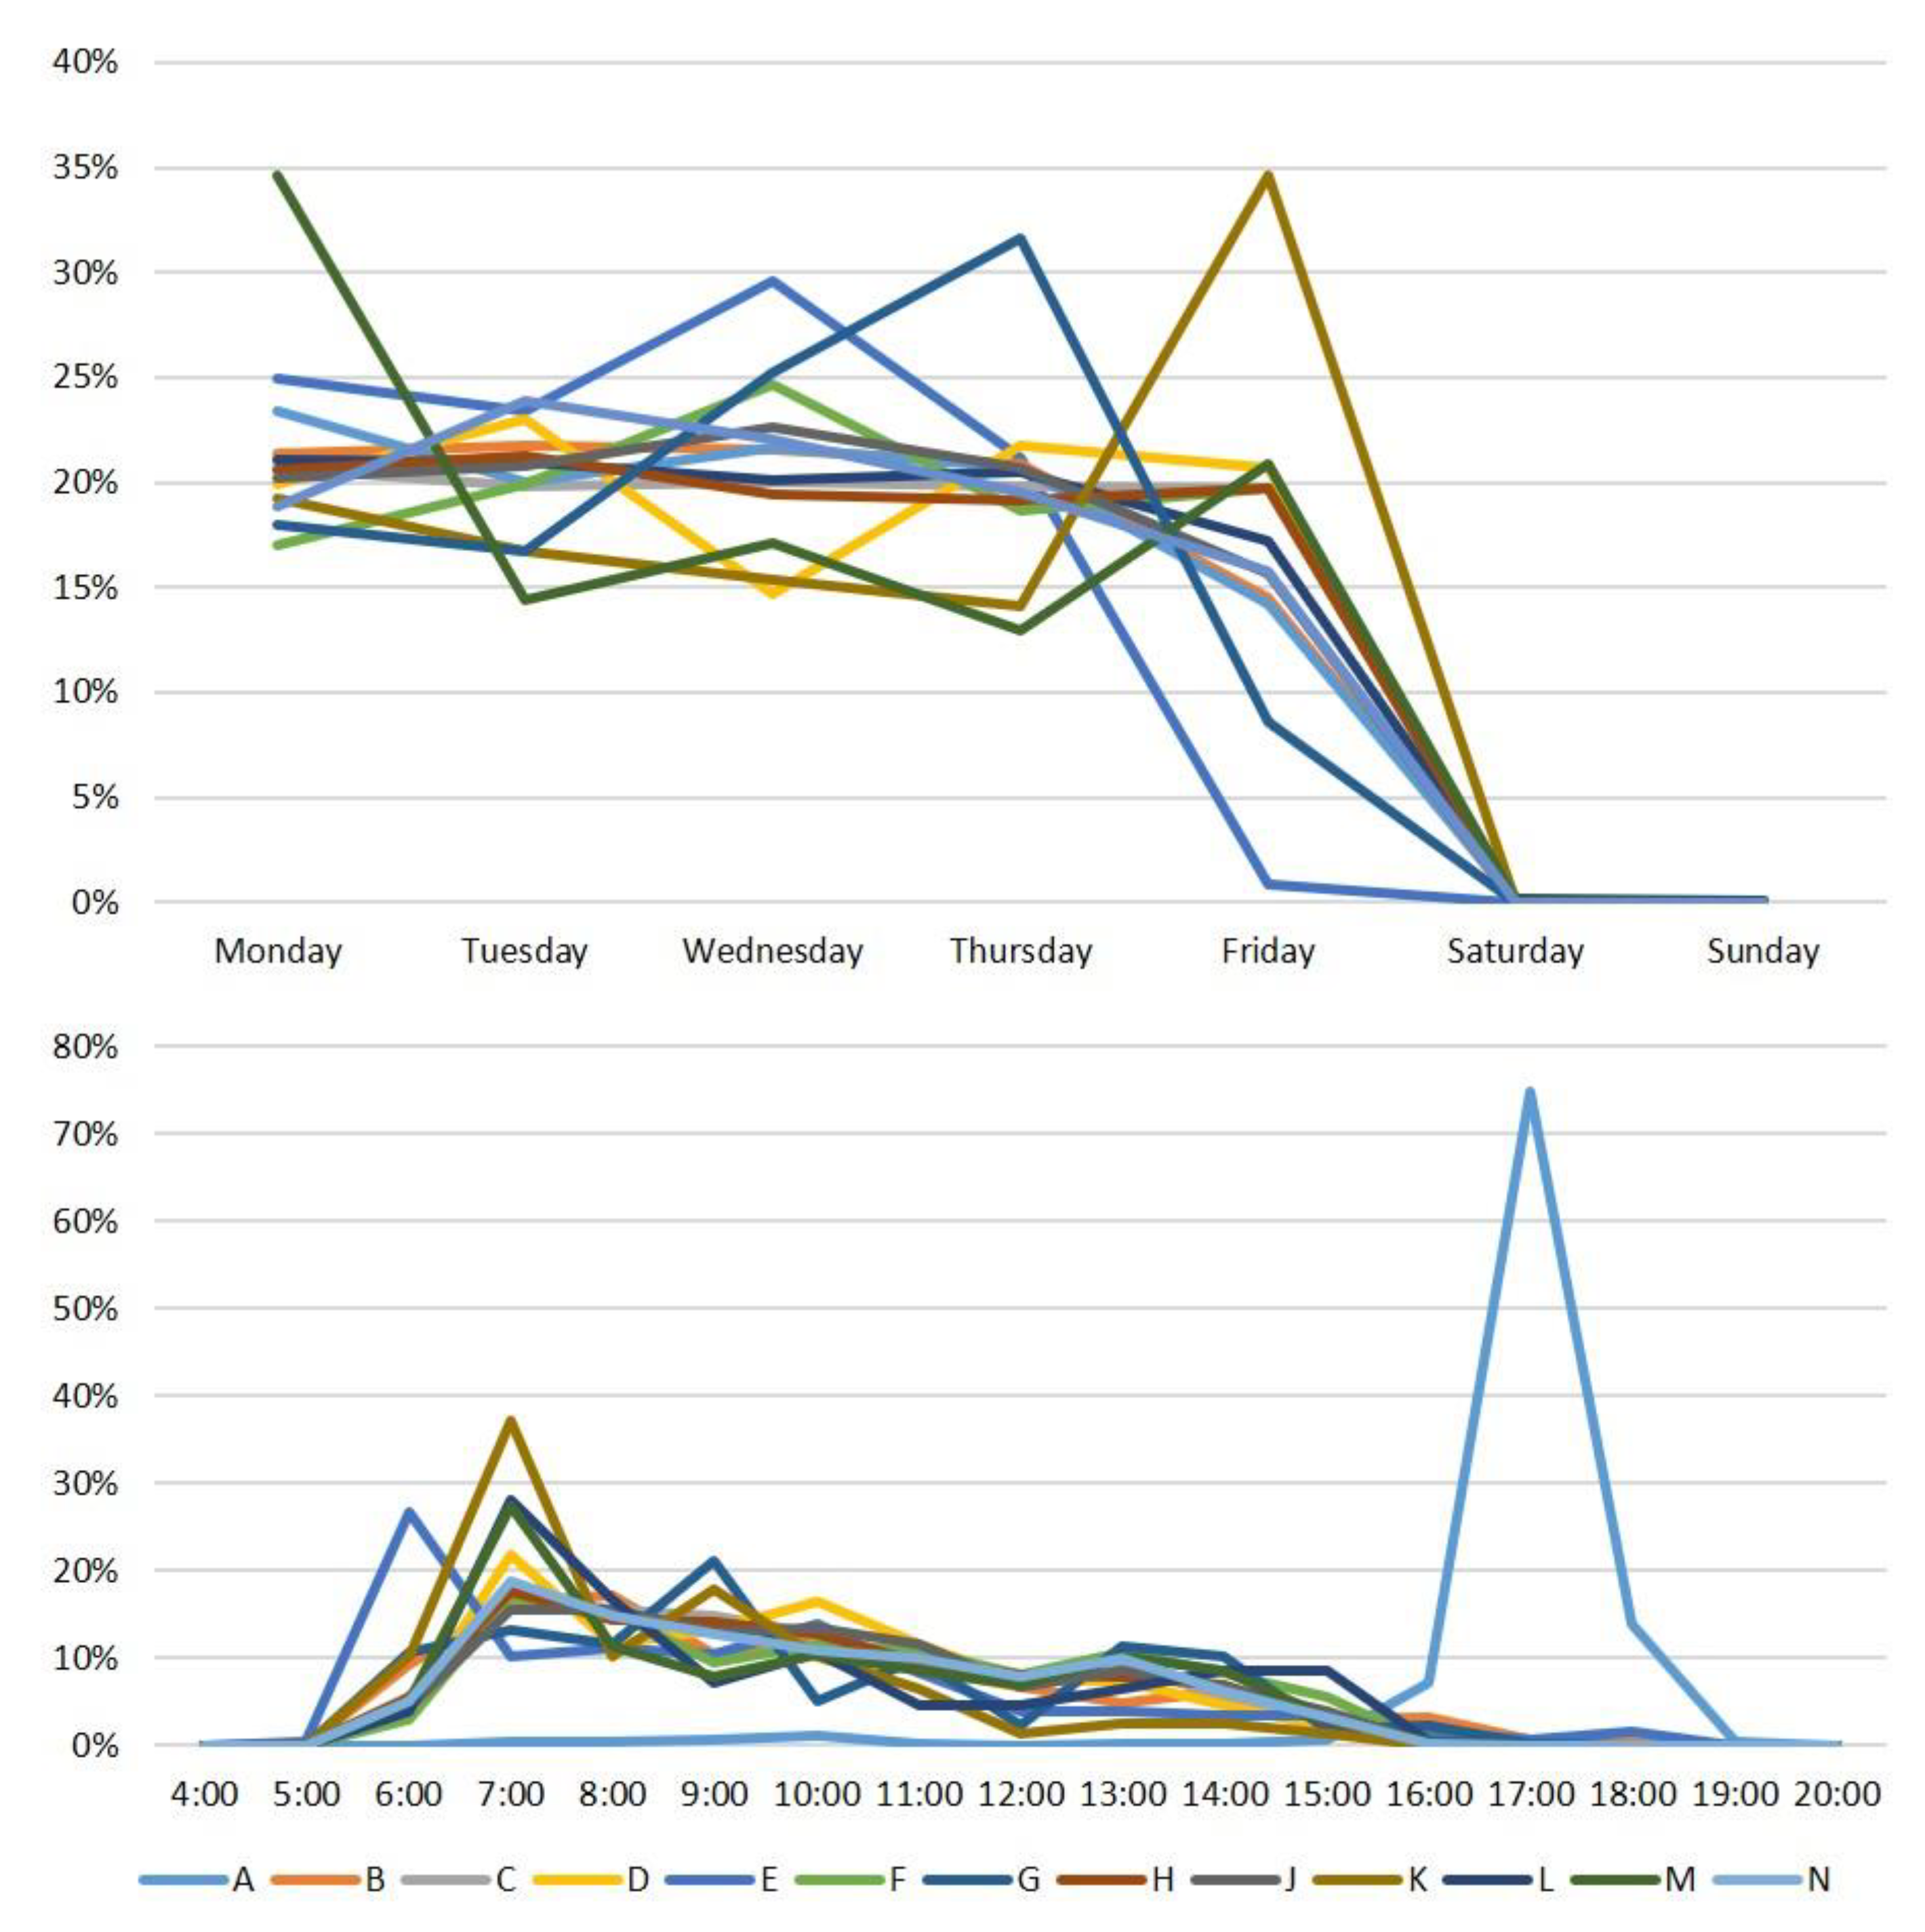
The delivery distribution patterns for projects across weekdays can be seen in Figure 1. Only three of the projects (E, G and M) received deliveries at weekends (a total of 28 transports). No pattern can be identified in terms of weekdays; however, compared to the other projects, A, L and K have peaks on different days of the week. In terms of the reasons for transports during weekdays, it was observed that delivery of a specific material was not associated with a specific day of the week, and material transports were distributed evenly throughout the week.
An analysis of the hourly distribution of deliveries shows that, in almost all projects, transports start arriving at 05:00, reaching a peak between 05:00 and 07:00 and then gradually reducing throughout the day. During those peak hours, the majority of transports are related to excavation works, followed by waste collection and concrete deliveries. Project A is an exception, with most of the deliveries taking place at 17:00 instead. Apart from Project A, all other projects have received 50% of their daily deliveries before 09:00, and 100% have arrived by 16:00.
4.1. Number of Deliveries
Delivery numbers for all projects are presented in Table 2. Since the data cover different percentages of the various projects’ timelines, the number of deliveries has been normalised to 100% (for example, Project A has 1158 transports for 44% of the project (between 53% and 97%), so for 100% of the Project A, there should be around 2632 transports in total). Based on the values of transport/m2, projects can be categorised into three groups: high (B, C, E and J), moderate (F, G, H, M and N) and low (A, D, K and L). Within these groups, no similarities can be observed between the projects (either in size or type of projects). The ranking of the projects based on transport/apartment is the same as for transport/m2, with C having the highest value (166.63) and K the lowest (4.05). Despite having very different numbers, projects C and K are both new housing projects with the same value and have similar timelines and gross floor areas. The rankings differ slightly when transport/value is used. The projects can be grouped as very high (C and J), high (B, E, H, N), low (D, F and G) and very low (A, K and L), with C still being the highest and K the lowest.
Different types of vehicles are used for deliveries in the 13 projects. On average, trucks are the most frequently used vehicle, accounting for 43% of the deliveries over all projects, followed by delivery vans, unknown (not reported), semi-trailer trucks and trucks plus trailer. Delivery vans are the most common vehicles used in projects A, B and L, trucks are most common in projects E, F, C, K, N and H, semi-trailers are most common in projects D and J, trucks plus trailer are most common for project M, while the unknown category is the most common for project G. In the majority of projects, i.e., all except M, E and G, the unknown category accounts for less than 5%. Trucks plus trailer are rarely or not at all used in projects A, B, E, C, G and F, while delivery vans are rarely used in projects K and G. A is the only project where trucks and semi-trailers are rarely used.
The type of delivery can influence the number of transports and turnaround times. Package data were only available for four of the projects (A, B, E and G). Long goods and standard euro pallets are the most common load carrier (29%), followed by packages via elevator (20%) and other (15%), while goods to be handled by crane are the least common (1%). Standard euro pallets are the most common package size in projects A and E, while long goods are the most common size in B. Packages over 1500 kg are not very common among the projects (1%), while lighter packages of less than 500 kg are the most common (58%). Unlike the other projects, 18% of the packages are over 1500 kg in Project B.
Five different types of vehicles are used in the projects for the delivery of packages. Trucks followed by delivery vans are the most common vehicles used for this (see Table 3). For the delivery of packages via elevator and standard euro pallet, delivery vans are most frequently used, while for all other package sizes, trucks are the most used vehicles. In terms of the weight of packages, the lightest and heaviest packages are delivered mostly by trucks, while the rest are mostly delivered by delivery vans.
4.2. Turnaround Times
Turnaround times for projects were normalised to 100%, as with the delivery numbers in Table 2. Based on turnaround time/m2, projects can be grouped as very high (C and E), high (B, M and J), low (G, N, H and F) and very low (A, K, D and L) (see Table 4). These groups are very similar to the previous groups identified on the basis of transports/m2. Ranking based on turnaround/apartment is same as turnaround/m2. When turnaround/value is used as the basis, the groups become very high (C), high (J, B, E, H and N), low (G, D, F, L and K) and very low (A). These groups are similar to the previous groups, with A being the lowest and C the highest. Turnaround time per vehicle specifies how long each vehicle spends on the construction site. Based on turnaround/vehicle, projects A, J and C have the shortest turnaround times per vehicle, while projects K, E and M have the longest.
Turnaround times can be associated with the types of vehicle. The total turnaround times for vehicles were 23,340 h for 7460 vehicles in the unknown category, 26,782 h for 16,370 delivery vans, 40,624 h for 25,111 trucks, 9423 h for 6769 semi-trailers and 3928 h for 3057 trucks plus trailer. Based on these values, average turnaround times per vehicle (hours/vehicle) were calculated as: unknown category (3.13), delivery van (1.64), truck (1.62), semi-trailer (1.39) and truck plus trailer (1.28). When the projects were analysed in detail, the type of vehicle leading to the longest turnaround time/vehicle are semi-trailers for A, G and K, and the unknown category for the rest of the projects. Trucks plus trailer had the shortest turnaround times for M, L, E and D, semi-trailers had the shortest time at J, the unknown category had the shortest time at K and trucks had the shortest time for the rest of the projects.
When turnaround times for different sizes and weights of load carriers were analysed, we found that, on average, standard euro pallets and packages under 500 kg led to the longest turnaround times, 119.75 and 258.75 h, respectively. Goods to be handled by crane generate the longest turnaround times per load carrier (0.16 h/load carrier), while long goods (0.07 h/load carrier) and packages via long elevator (0.05 h/load carrier) generate the shortest. Among the different weights, packages of less than 500 kg led to the longest turnaround time per package (0.12 h/load carrier), while load carriers weighing 1000–1500 kg and 1500–2000 kg led to the shortest turnaround time (0.03 h/package for both). Among projects, G and E have longer turnaround times/load carrier (0.15 and 0.12 h/load carrier, respectively) than projects A and B (0.10 and 0.05 h/load carrier, respectively).
4.3. Transport Patterns during Different Construction Phases
Typical construction phases are site preparation and excavation, ground works, framing, installation of services and interior work. In a construction project, these phases overlap with each other, making it difficult to associate a project’s completion percentage with a phase. In this study, the projects’ completion percentages were divided into four cycles: 0–25% of project completion refers to site preparation and excavation, and ground works, 26–50% refers to the remaining ground works as well as framing, 51–75% refers to the remaining framing works, installation of services and a small part of interior work, and 76–100% refers to the remaining installation of services and interior work.
During different cycles of projects, transports are used for carrying out different activities and delivering different types of materials (see Table 5). During the first cycle, 90% of the transports are due to excavation works, followed by concrete deliveries with only 5%. Concrete deliveries lead during the second cycle, accounting for 34% of all transports, followed by other deliveries (19%) and excavation works (12%). During the third cycle, concrete deliveries keep the lead with one fifth of the transports, while delivery of small packages accounts for 14%. More than half of the transports during the fourth cycle are for the delivery of small packages (69%), followed by waste collection (28%), which comprise 97% of the transports together.
Based on the data in Table 5, the following trends can be noted: (i) excavation works lead to a large proportion of transports at the beginning of projects and decrease significantly after the first cycle, (ii) transports related to waste collection increase from the second cycle of projects onwards, (iii) concrete is delivered mainly during the second and third cycles, (iv) transports related to small packages mainly take place during the fourth cycle and (v) transports related to support services (e.g., cleaning and food deliveries) are distributed in the first three cycles.
By only including projects which have complete data for at least one of these cycles, the average number of transports and turnaround per m2 for each cycle was calculated (see Table 6). On average, transports/m2 increases significantly between the first and second cycles, followed by a smaller increase between the second and third cycles. Since only one of the projects has data on the last cycle, it is difficult to make a general comparison; however, in Project C, it can be seen that there is an increase in transports/m2 between the third and fourth cycles. Project E follows a different pattern, with a decrease between the second and third cycles. Turnaround/m2 follows a different path, where there is a drop in turnaround/m2 between the second and third cycles. For Project E, turnaround/m2 drops by more than half between the second and third cycles, while there is an increase for Project N during the same cycles.
Use of different vehicles was analysed based on construction phases (see Table 7). Trucks plus trailer are used most commonly during the first and fourth cycles of a project but are used less during the second and third cycles. For trucks plus trailer, turnaround time is highest during the fourth cycle, followed by the second and third cycles. Delivery vans are used more often during the fourth cycle, where they also generate the highest turnaround time, and they are least used during the first cycle of projects. Trucks are used more commonly during the fourth cycle. Although trucks are not used as often during the second cycle, they generate a high turnaround time during this cycle. Semi-trailers seem to be used evenly throughout the projects’ lifecycles.
5. Discussion and Future Research
Investigating the delivery patterns of Swedish construction sites including turnaround times for different types of deliveries introduced several avenues for future research. Projects that employ a booking calendar can control when goods arrive. Thus, they can choose a time when there is less congestion in the city and hence a decreased risk of delays, but they also need to choose a time when the unloading/loading equipment is available and that suits the crews’ schedule. Even so, all projects but one had a peak delivery time between 07:00 and 09:00 on Mondays–Thursdays. This is similar to the findings of Ying et al. [21], who claim that peak hours for transports are between 09:00 and 10:00. Thus, the projects do not take advantage of the opportunity to control deliveries and decrease their impact on efficiency; instead, they act traditionally. Detailed data are required in order to understand how construction delivery patterns can be changed, i.e., we need to connect the purchasing system or BIM with the booking calendar. The problem concerning the lack of coordination of deliveries can be attacked from two different angles: (1) How does site management plan the deliveries and what type of information is given to the suppliers? (2) How do the suppliers use the information they are given to control the transports? The latter is an important question because most materials in construction are purchased with transport included. If we compare the study by Bäckstrand and Fredriksson [16] with these results, we can guess that suppliers are given very limited information and are thus not aware that opportunities exist to suggest other delivery times that would make it possible to avoid congestion, both in the city and on-site. The study by Gholami et al. [44] indicates that suppliers would be happy to utilise the day differently because this would save them time, such as in the case of Smart delivery containers enabling drop-off when convenient, although such a container is only suitable for packages (here we could see it was used on one project, Project A). There is great potential to improve the efficiency of construction logistics with such a solution, considering that packages which can be handled in elevators are also suitable for Smart container deliveries and make up on average 20% of the deliveries among the projects studied here. Further research is needed to provide a detailed understanding of how these easily achieved aspects of improved logistics efficiency through less handling of deliveries can be realised by construction transport companies.
In Table 2, it is seen that the number of transports ranged from 0.04/m2 in Project K to 1.99/m2 in Project C, with an average of 0.57/m2. The difference is large, and this raises further questions, including what explains these differences and whether it is possible to foresee what types of project are likely to need more transports. One common explanation from the construction industry itself is that each project is unique, and it is not possible to compare projects. It is argued that different types of projects have different types of material flows, as well as different needs for excavation, depending on what is being built, and therefore cannot be expected to show comparable delivery and transport patterns. However, this study questioned these arguments because both K and C are house-building projects. Thus, they should have similar prerequisites, which indicates that there is potential for identifying best-practice regarding logistics planning and creating learning examples.
When considering the turnaround times, we also see a variation between projects, vehicles and goods size. Delivery vans were expected to have the shortest turnaround times because they are the smallest and therefore carry the smallest load, but this is not the case. In some projects, they even had the longest turnaround times. A possible explanation for this is that many delivery vans are used by workers who are working on-site, and thus they are parked there for a long time. Therefore, in future research, we need to find a way to separate workers’ vans from delivery vans. Looking at the actual turnaround times between projects, we can see a range from 0.42 h in Project A to 2.79 h in Project K. Some of this difference may be explained through the earlier example of workers’ vans, but not all. There are great opportunities to work with reducing not only the number of transports but also the time spent on turnaround. Taking the example of Project E, which had 55,369 h of registered turnaround time, this equates to 31.5 full-time working years (1750 h of working time per year) wasted on simply receiving goods, and then we have not even included the full project length or the drivers’ time. Thus, there is great potential to increase the efficiency of construction logistics by improving delivery handling and planning, as suggested by Strandberg and Josephson [6].
Further research is needed to identify in detail which construction logistics measures can be applied to reduce turnaround times. Logically, there should be a correlation between weight and turnaround time. Fewer deliveries should increase the average weight because high weight indicates bundling, which means more goods to be handled in one unloading. However, if the relationship is not linear, then there is great potential in arranging fewer deliveries with more goods each time. Furthermore, is it possible to see shorter turnaround times for projects with a better spread of deliveries over the day? There are indications of this in the present study, because Project A, with the shortest turnaround times, was also the only project receiving night deliveries.
6. Conclusions
The purpose of this paper was to investigate the transport patterns of construction material deliveries, including turnaround times. Among the 13 studied projects, transports ranged from 0.04/m2 in Project K to 1.99/m2 in Project C, with an average of 0.57/m2, and the variation cannot be explained by project type. In terms of delivery pattern, we can see that 12 out of 13 projects receive the majority of their deliveries between 07:00 and 09:00 on Mondays–Thursdays. Thus, they are not utilising the potential of distributing deliveries across the day and the week to avoid congestion and improve the utilisation rate for crew and unloading equipment. We also conclude that trucks are the most frequently used vehicle, accounting for 43% of deliveries over all projects, and long goods and standard euro pallets are the most common load carrier (29%), followed by packages via elevator (20%). Thus, they are rather small-sized goods, with great potential for bundling if planning is improved. Finally, we conclude that turnaround times ranged between a minimum of 0.42 h per delivery in Project A and a maximum of 2.79 h per delivery in Project K. Seeing this difference, some of which can surely be explained by differences in project type, there is still great potential to increase logistics efficiency with better delivery handling and planning if all projects could even come close to the numbers achieved by Project A. Finally, goods to be handled by crane and lightweight goods generate the longest turnaround time/delivery. The latter is surprising and needs further research to be explained.
This study showed that the number of deliveries and turnaround times vary a lot among the 13 projects, and a large proportion of the deliveries happen between 07:00 and 09:00 on Mondays–Thursdays. Contractors and logistics providers can increase efficiency of construction logistics with better planning and coordination, which will allow (i) deliveries being distributed throughout the day and week, and (ii) bundling smaller packages. The project with night-time deliveries has one of the lowest transports/m2 and the shortest turnaround time, meaning that off-peak deliveries pursued by municipalities can be beneficial for both the municipalities by reducing congestion, and contractors and logistics providers by increasing their productivity.
While generalizing the findings of this study, it is worth to consider that this paper is based on 13 projects from Sweden. The type of project (e.g., housing or hospital) as well as the construction method used can determine the types of materials used in the project and how deliveries of different materials are distributed over a project’s completion percentage. Moreover, the type of contract used in the projects can limit opportunities to plan deliveries for contractors. Therefore, it is important to consider the type of project, the construction method used and the type of contract while applying the findings of this paper.
This study has several limitations, most of which can be traced to data quality, and details should be considered. The data did not include a complete timeline for any of the projects, thus the figures required normalisation. Furthermore, the data lacked enough detail to explain some of the patterns, and only includes 13 Swedish cases. Separating between different materials with a greater level of detail than we have been able to accomplish would be very useful. Comparing a larger set of projects would allow distinguishing between different types of projects at a greater level of detail. However, there is lack of such data in the construction industry and the available data have low quality due to the non-standardised methods of data gathering. There should be requirements to capture standardised transport arrival and departure times at the gate with the help of sensors or RFID tags, as well as using booking calendars to enable the traceability of materials, vehicles and unloading equipment. However, this study is one of the rare attempts at revealing current practice and issues associated with material deliveries, which is a necessary first step to increase the efficiency of construction logistics, as we cannot see that the type of project has a large impact on the delivery patterns. We conclude that there is potential to work with deliveries and turnaround times at a general level within the construction industry.
Author Contributions
Conceptualization, A.A.S. and A.F.; methodology, A.A.S. and A.F.; investigation, A.A.S. and A.F.; data curation, A.A.S.; writing—original draft preparation, A.A.S. and A.F.; writing—review and editing, A.A.S. and A.F.; visualization, A.A.S.; project administration, A.F.; funding acquisition, A.F. All authors have read and agreed to the published version of the manuscript.
Funding
This work was funded by the Vinnova, grant number 2018-04114.
Institutional Review Board Statement
Not applicable.
Informed Consent Statement
Not applicable.
Data Availability Statement
Restrictions apply to the availability of these data. Data were obtained from a construction logistics setup provider and are available from the authors with the permission of the construction logistics setup provider.
Conflicts of Interest
The authors declare no conflict of interest. The funders had no role in the design of the study; in the collection, analyses, or interpretation of data; in the writing of the manuscript, or in the decision to publish the results.
References
- Barbosa, F.; Woetzel, J.; Mischke, J. Reinventing Construction: A Route of Higher Productivity. 27 February 2017. Available online: https://www.mckinsey.com/~/media/McKinsey/Business%20Functions/Operations/Our%20Insights/Reinventing%20construction%20through%20a%20productivity%20revolution/MGI-Reinventing-Construction-Executive-summary.pdf (accessed on 5 June 2021).
- Pearce, A.R.; Ahn, Y.H. Sustainable Buildings and Infrastructure: Paths to the Future; Routledge: New York, NY, USA, 2017; ISBN 9781138672253. [Google Scholar]
- Chalker, M.; Loosemore, M. Trust and productivity in Australian construction projects: A subcontractor perspective. Eng. Constr. Archit. Manag. 2016, 23, 192–210. [Google Scholar] [CrossRef]
- Josephson, P.-E.; Saukkoriipi, L. Waste in Construction Projects: Call for a New Approach; Chalmers University of Technology: Gothenburg, Sweden, 2007. [Google Scholar]
- Guerlain, C.; Renault, S.; Ferrero, F. Understanding construction logistics in urban areas and lowering its environmental impact: A focus on construction consolidation centres. Sustainability 2019, 11, 6118. [Google Scholar] [CrossRef] [Green Version]
- Strandberg, J.; Josephson, P.-E. What do construction workers do? Direct observations in housing projects. In Proceedings of the 11th Joint CIB International Symposium Combining Forces, Advancing Facilities management and Construction through Innovation, Helsinki, Finland, 13–16 June 2005; pp. 184–193. [Google Scholar]
- Wegelius-Lehtonen, T. Performance measurement in construction logistics. Int. J. Product. Econ. 2001, 69, 107–116. [Google Scholar] [CrossRef]
- Almohsen, A.; Ruwanpura, J. Logistics management in the construction industry. In Proceedings of the International Council for research and Innovation in Building and construction (CIB), Sophie Antipolis, France, 26–28 October 2011; p. 10. [Google Scholar]
- Löfgren, P. Effektiva Byggtransporter. 2010. Available online: https://vpp.sbuf.se/Public/Documents/ProjectDocuments/4872cf5c-b4e9-494f-b83d-80f5febf80ad/FinalReport/SBUF%2012235%20Slutrapport%20Effektiva%20Byggtransporter.pdf (accessed on 5 June 2021).
- Akan, M.Ö.A.; Dhavale, D.G.; Sarkis, J. Greenhouse gas emissions in the construction industry: An analysis and evaluation of a concrete supply chain. J. Clean. Prod. 2017, 167, 1195–1207. [Google Scholar] [CrossRef]
- Ji, Y.; Li, K.; Liu, G.; Shrestha, A.; Jing, J. Comparing greenhouse gas emissions of precast in-situ and conventional construction methods. J. Clean. Prod. 2018, 173, 124–134. [Google Scholar] [CrossRef]
- Seo, M.-S.; Kim, T.; Hong, G.; Kim, H. On-site measurements of CO2 emissions during the construction phase of a building complex. Energies 2016, 9, 599. [Google Scholar] [CrossRef]
- Sezer, A.A.; Fredriksson, A. The transport footprint of Swedish construction sites. IOP Conf. Ser. Earth Environ. Sci. 2020, 588, 042001. [Google Scholar] [CrossRef]
- Sezer, A.A.; Fredriksson, A. Environmental impact of construction transport and the effects of building certification schemes. Resour. Conserv. Recy. 2021, 172, 105688. [Google Scholar] [CrossRef]
- Ghanem, M.; Hamzeh, F.; Seppänen, O.; Zankoul, E. A new perspective of construction logistics and production control: An exploratory study. In Proceedings of the 26th Annual Conference of the International Group for Lean Construction (IGLC), Chennai, India, 16–22 July 2018; pp. 992–1001. [Google Scholar]
- Bäckstrand, J.; Fredriksson, A. The role of supplier information availability for construction supply chain performance. Prod. Plan. Control. 2020, 1–12. [Google Scholar] [CrossRef]
- Woodcock, M. Construction logistics: Supply of bulk materials. In Supply Chain Management and Logistics in Construction: Delivering Tomorrow’s Built Environment; Lundesjö, G., Ed.; Kogan Page Publishers: London, UK, 2015; pp. 35–61. [Google Scholar]
- Sundquist, V.; Gadde, L.-E.; Hulthén, K. Reorganizing construction logistics for improved performance. Constr. Manag. Econ. 2018, 36, 49–65. [Google Scholar] [CrossRef]
- Thunberg, M.; Fredriksson, A. Bringing planning back into the picture: How can supply chain planning aid in dealing with supply chain-related problems in construction? Constr. Manag. Econ. 2018, 36, 425–442. [Google Scholar] [CrossRef]
- Lundesjo, G. Consolidation centres in construction logistics. In Supply Chain Management and Logistics in Construction: Delivering Yomorrow’s Built Environment; Lundesjö, G., Ed.; Kogan Page Publishers: London, UK, 2015; pp. 225–242. [Google Scholar]
- Ying, F.; Tookey, J.; Roberti, J. Addressing effective construction logistics through the lens of vehicle movements. Eng. Constr. Arch. Manag. 2014, 21, 261–275. [Google Scholar] [CrossRef] [Green Version]
- Thunberg, M. Developing a Framework for Supply Chain Planning in Construction; Linköping University Electronic Press: Linköping, Sweden, 2016. [Google Scholar]
- Proverbs, D.G.; Holt, G.D. Reducing construction costs: European best practice supply chain implications. Eur. J. Purch. Supply Manag. 2000, 6, 149–158. [Google Scholar] [CrossRef]
- Kurdve, M.; Kjellsdotter Ivert, L.; Fredriksson, A.; Bosch-Sijtsema, P. Improved circularity in Swedish construction and demolition industry through the use of sustainable supply chain management. In Proceedings of the EurOMA Sustainability Forum, Gothenburg, Sweden, 18–19 March 2019. [Google Scholar]
- Azambuja, M.; O’Brien, W.J. Construction supply chain modeling: Issues and perspectives. In Construction Supply Chain Management Handbook; O’Brien, W.J., Formoso, C.T., Vrijhoef, R., London, K.A., Eds.; CRC Press: Boca Raton, FL, USA, 2008. [Google Scholar]
- Carboni, A.; Dalla Chiara, B. Range of technical-economic competitiveness of rail-road combined transport. Eur. Transp. Res. Rev. 2018, 10, 1–17. [Google Scholar] [CrossRef]
- Wu, C.L.; Caves, R.E. Modelling and optimization of aircraft turnaround time at an airport. Transp. Plan. Technol. 2004, 27, 47–66. [Google Scholar] [CrossRef]
- Johnson, H.; Styhre, L. Increased energy efficiency in short sea shipping through decreased time in port. Transp. Res. Part. A Policy Pract. 2015, 71, 167–178. [Google Scholar] [CrossRef] [Green Version]
- Phan, M.-H.; Kim, K.H. Collaborative truck scheduling and appointments for trucking companies and container terminals. Transp. Res. B Meth. 2016, 86, 37–50. [Google Scholar] [CrossRef]
- Wegelius-Lehtonen, T.; Pahkala, S. Developing material delivery processes in cooperation: An application example of the construction industry. Int. J. Product. Econ. 1998, 56, 689–698. [Google Scholar] [CrossRef]
- Grau, D.; Caldas, C.H.; Haas, C.T.; Goodrum, P.M.; Gong, J. Assessing the impact of materials tracking technologies on construction craft productivity. Automat. Constr. 2009, 18, 903–911. [Google Scholar] [CrossRef]
- Thunberg, M.; Rudberg, M.; Gustavsson, T.K. Categorising on-site problems: A supply chain management perspective on construction projects. Constr. Innov. 2017, 17, 90–111. [Google Scholar] [CrossRef]
- Thunberg, M.; Persson, F. Using the SCOR model’s performance measurements to improve construction logistics. Prod. Plan. Control. 2014, 25, 1065–1078. [Google Scholar] [CrossRef]
- Bergman, F. Bygglogistikcenter i Norra Djurgårdsstaden: Delavstämning; Exploateringskontoret, Stockholms stad: Stockholm, Sweden, 2016. [Google Scholar]
- Lacoste, S.; Johnsen, R.E. Supplier–customer relationships: A case study of power dynamics. J. Purch. Supply Manag. 2015, 21, 229–240. [Google Scholar] [CrossRef]
- Wells, P.; Nieuwenhuis, P. Operationalizing deep structural sustainability in business: Longitudinal immersion as extensive engaged scholarship. Br. J. Manag. 2017, 28, 45–63. [Google Scholar] [CrossRef] [Green Version]
- Ekeskär, A.; Rudberg, M. Third-party logistics in construction: The case of a large hospital project. Constr. Manag. Econ. 2016, 34, 174–191. [Google Scholar] [CrossRef] [Green Version]
- Janné, M.; Fredriksson, A. Construction logistics governing guidelines in urban development projects. Constr. Innov. 2019, 19, 89–109. [Google Scholar] [CrossRef] [Green Version]
- Wang, R.Y.; Strong, D.M. Beyond accuracy: What data quality means to data consumers. J. Manag. Inf. Syst. 1996, 12, 5–33. [Google Scholar] [CrossRef]
- Pipino, L.L.; Lee, Y.W.; Wang, R.Y. Data quality assessment. Commun. ACM 2002, 45, 211–218. [Google Scholar] [CrossRef]
- Dubois, A.; Araujo, L. Case research in purchasing and supply management: Opportunities and challenges. J. Purch. Supply Manag. 2007, 13, 170–181. [Google Scholar] [CrossRef]
- Eisenhardt, K.M.; Graebner, M.E. Theory building from cases: Opportunities and challenges. Acad. Manag. J. 2007, 50, 25–32. [Google Scholar] [CrossRef]
- Yin, R.K. Case Study Research and Applications: Design and Methods; Sage Publications: Thousan Oaks, CA, USA, 2017. [Google Scholar]
- Gholami, Y.; Fredriksson, A.; Rudberg, M.; Simu, K. Decoupling the delivery process in a construction supply chain employing a smart delivery container. In Proceedings of the PLAN Konferensen, Linköping, Sweden, 23–24 October 2019. [Google Scholar]
Figure 1.
Weekdays and hourly distribution of transports.


Table 1.
Details of the 13 projects (* will not be officially certified but applying for silver certificate measures).
Table 1.
Details of the 13 projects (* will not be officially certified but applying for silver certificate measures).
| Project (n = 13) | Gross Area (m2) | Size | Type | Value (MSEK) | Length (Months) | Contract Type | Data Coverage (%) | Certification |
|---|---|---|---|---|---|---|---|---|
| A | 40,000 | NA | Hospital renovation | 1300 | 60 | Divided | 53–97 | None |
| B | 24,000 | NA | Hospital new | 700 | 48 | Divided | 13–67 | Silver |
| C | 4100 | 49 | Housing | 100 | 25 | Design-build | 46–100 | None |
| D | 5000 | 46 | Housing | 98 | 26 | Design-build | 44–92 | Silver |
| E | 35,500 | NA | Hospital new | 1500 | 52 | Partnering | 10–87 | Gold |
| F | 8400 | NA | New offices | 300 | 30 | Partnering | 1–41 | Gold |
| G | 14,000 | NA | Public building | 573 | 30 | Partnering | 23–70 | Silver |
| H | 12,000 | 126 | Housing | 200 | 26 | Design-build | 14–64 | Silver |
| J | 4840 | 48 | Housing | 100 | 22 | Design-build | 9–68 | Unknown |
| K | 4800 | 47 | Housing | 100 | 27 | Design-build | 11–52 | Unknown |
| L | 5700 | 73 | Housing | 175 | 27 | Design-build | 1–26 | Silver * |
| M | 11,000 | NA | New offices and housing | 36 | Design-build | 1–39 | Silver | |
| N | 13,000 | NA | New offices and housing | 350 | 25 | Design-build | 24–80 | Gold |
Table 2.
Number of transports for the 13 projects.
| Project (n = 13) | Transports | Normalised Transports | Normalised Transport/m2 | Normalised Transport/Apartment | Normalised Transport/Value |
|---|---|---|---|---|---|
| A | 1158 | 2632 | 0.066 | 0.89 | |
| B | 13,351 | 24,724 | 1.030 | 19.07 | |
| C | 4409 | 8165 | 1.991 | 166.63 | 44.09 |
| D | 396 | 825 | 0.165 | 17.93 | 4.04 |
| E | 22,776 | 29,579 | 0.833 | 15.18 | |
| F | 1050 | 2625 | 0.313 | 3.50 | |
| G | 3292 | 7004 | 0.500 | 5.75 | |
| H | 2232 | 4464 | 0.372 | 35.43 | 11.16 |
| J | 2836 | 4807 | 0.993 | 100.14 | 28.36 |
| K | 78 | 190 | 0.040 | 4.05 | 0.78 |
| L | 234 | 936 | 0.164 | 12.82 | 1.34 |
| M | 2275 | 5987 | 0.544 | ||
| N | 3198 | 5711 | 0.439 | 9.14 |
Table 3.
Types of vehicle used in delivering packages.
| Package Size/Type of Vehicle | Truck Plus Trailer | Delivery Van | Truck | Semi-Trailer | Unknown | |
|---|---|---|---|---|---|---|
| Other | 0–500 kg | 83 | 49 | 145 | 14 | 46 |
| 500–1000 kg | 14 | 6 | 17 | 6 | ||
| 1000–1500 kg | 3 | 1 | ||||
| Over 2000 kg | 3 | 2 | 1 | |||
| Total | 103 | 57 | 164 | 14 | 52 | |
| Package via elevator | 0–500 kg | 11 | 101 | 79 | 14 | 13 |
| 500–1000 kg | 11 | 65 | 25 | 12 | 44 | |
| 1000–1500 kg | 9 | 4 | 1 | |||
| 1500–2000 kg | 3 | 1 | ||||
| Over 2000 kg | 8 | 15 | 20 | 4 | ||
| Total | 30 | 193 | 129 | 31 | 57 | |
| Long goods | 0–500 kg | 38 | 48 | 155 | 25 | 39 |
| 500–1000 kg | 13 | 19 | 48 | 13 | 37 | |
| 1000–1500 kg | 6 | 5 | 6 | 6 | 1 | |
| 1500–2000 kg | 1 | 1 | ||||
| Over 2000 kg | 1 | 3 | 2 | |||
| Total | 59 | 76 | 211 | 44 | 77 | |
| Standard EUR | 0–500 kg | 44 | 416 | 347 | 28 | 54 |
| 500–1000 kg | 47 | 8 | 1 | 15 | ||
| 1000–1500 kg | 1 | 1 | 1 | |||
| 1500–2000 kg | 1 | |||||
| Total | 46 | 463 | 356 | 30 | 69 | |
| Goods to be handled with crane | 0–500 kg | 7 | 9 | |||
| 500–1000 kg | 4 | 6 | 3 | |||
| 1000–1500 kg | 1 | |||||
| Total | 0 | 11 | 16 | 3 | 0 | |
| Long package via elevator | 0–500 kg | 4 | 3 | 33 | 1 | 1 |
| 500–1000 kg | 11 | 10 | ||||
| 1000–1500 kg | 1 | |||||
| Total | 16 | 3 | 43 | 1 | 1 | |
| Total | 254 | 803 | 919 | 123 | 256 | |
Table 4.
Turnaround times for projects.
| Project (n = 13) | Turnaround Time (h) | Normalised Turnaround Time (h) | Normalised Turnaround Time (h/m2) | Normalised Turnaround Time (h/Apartment) | Normalised Turnaround Time (h/Value) | Normalised Turnaround (h/Vehicle) |
|---|---|---|---|---|---|---|
| A | 487 | 1107 | 0.03 | 0.85 | 0.42 | |
| B | 19,824 | 36,711 | 1.53 | 52.44 | 1.48 | |
| C | 5007 | 9272 | 2.26 | 189.23 | 92.72 | 1.14 |
| D | 660 | 1375 | 0.28 | 29.89 | 14.03 | 1.67 |
| E | 55,369 | 71,908 | 2.03 | 47.94 | 2.43 | |
| F | 1499 | 3748 | 0.45 | 12.49 | 1.43 | |
| G | 4610 | 9809 | 0.70 | 17.13 | 1.40 | |
| H | 3123 | 6246 | 0.52 | 49.57 | 31.23 | 1.40 |
| J | 3122 | 5292 | 1.09 | 110.24 | 52.92 | 1.10 |
| K | 218 | 532 | 0.11 | 11.31 | 5.32 | 2.79 |
| L | 413 | 1652 | 0.29 | 22.63 | 9.44 | 1.76 |
| M | 5450 | 14,342 | 1.30 | 2.40 | ||
| N | 4295 | 7670 | 0.59 | 21.91 | 1.34 |
Table 5.
Reasons for transports during different completion percentages of projects.
| Reasons | 0–25% | 26–50% | 51–75% | 76–100% |
|---|---|---|---|---|
| Waste | 0% | 6% | 11% | 28% |
| Concrete | 5% | 34% | 20% | 0% |
| Electricity | 0% | 2% | 10% | 0% |
| Paint and putty | 0% | 1% | 2% | 2% |
| Windows | 0% | 2% | 3% | 0% |
| Drywall | 0% | 2% | 6% | 0% |
| Interior | 0% | 0% | 3% | 1% |
| Insulation | 0% | 2% | 5% | 0% |
| Small packages | 2% | 0% | 14% | 69% |
| Excavation | 90% | 12% | 5% | 0% |
| Steel | 1% | 6% | 2% | 0% |
| Support Services | 2% | 6% | 5% | 0% |
| Ceiling/roof | 0% | 1% | 1% | 0% |
| HVAC | 0% | 7% | 11% | 0% |
| Other | 0% | 19% | 2% | 0% |
Table 6.
Transports and turnaround per m2 for the different completion percentages of the 13 projects.
Table 6.
Transports and turnaround per m2 for the different completion percentages of the 13 projects.
| Project (n = 13) | Transports/m2 | Turnaround/m2 | ||||||
|---|---|---|---|---|---|---|---|---|
| 0–25% | 26–50% | 51–75% | 76–100% | 0–25% | 26–50% | 51–75% | 76–100% | |
| A | 0.02 | 0.008 | ||||||
| B | 0.288 | 0.479 | ||||||
| C | 0.519 | 0.556 | 0.577 | 0.643 | ||||
| D | 0.065 | 0.010 | ||||||
| E | 0.298 | 0.202 | 0.790 | 0.302 | ||||
| F | 0.080 | 0.115 | ||||||
| G | 0.119 | 0.167 | ||||||
| H | 0.119 | 0.139 | ||||||
| J | 0.285 | 0.287 | ||||||
| K | 0.006 | 0.026 | ||||||
| L | 0.011 | 0.011 | ||||||
| M | 0.098 | 0.058 | ||||||
| N | 0.107 | 0.130 | 0.146 | 0.164 | ||||
| Average | 0.063 | 0.175 | 0.187 | 0.556 | 0.062 | 0.291 | 0.230 | 0.643 |
Table 7.
Transports and turnaround per m2 for different vehicles during different completion percentages.
Table 7.
Transports and turnaround per m2 for different vehicles during different completion percentages.
| Truck Plus Trailer | Delivery Van | Truck | Semi-Trailer | Unknown | |
|---|---|---|---|---|---|
| Transports/m2 | |||||
| 0–25% | 0.025 | 0.008 | 0.017 | 0.013 | 0.0002 |
| 26–50% | 0.011 | 0.052 | 0.066 | 0.029 | 0.0177 |
| 51–75% | 0.011 | 0.065 | 0.074 | 0.031 | 0.0068 |
| 76–100% | 0.023 | 0.169 | 0.298 | 0.059 | 0.0071 |
| Turnaround/m2 | |||||
| 0–25% | 0.013 | 0.013 | 0.011 | 0.023 | 0.0014 |
| 26–50% | 0.021 | 0.080 | 0.114 | 0.038 | 0.0377 |
| 51–75% | 0.015 | 0.095 | 0.066 | 0.040 | 0.0150 |
| 76–100% | 0.026 | 0.243 | 0.274 | 0.073 | 0.0283 |
Publisher’s Note: MDPI stays neutral with regard to jurisdictional claims in published maps and institutional affiliations. |
© 2021 by the authors. Licensee MDPI, Basel, Switzerland. This article is an open access article distributed under the terms and conditions of the Creative Commons Attribution (CC BY) license (https://creativecommons.org/licenses/by/4.0/).
Share and Cite
MDPI and ACS Style
Sezer, A.A.; Fredriksson, A. Paving the Path towards Efficient Construction Logistics by Revealing the Current Practice and Issues. Logistics 2021, 5, 53. https://0-doi-org.brum.beds.ac.uk/10.3390/logistics5030053
AMA Style
Sezer AA, Fredriksson A. Paving the Path towards Efficient Construction Logistics by Revealing the Current Practice and Issues. Logistics. 2021; 5(3):53. https://0-doi-org.brum.beds.ac.uk/10.3390/logistics5030053
Chicago/Turabian StyleSezer, Ahmet Anil, and Anna Fredriksson. 2021. "Paving the Path towards Efficient Construction Logistics by Revealing the Current Practice and Issues" Logistics 5, no. 3: 53. https://0-doi-org.brum.beds.ac.uk/10.3390/logistics5030053