
What Young E-Consumers Want? Forecasting Parcel Lockers Choice in Rome


1
Department of Political Science, Roma Tre University, Via Gabriello Chiabrera 199, 00145 Rome, Italy
2
Department of Logistics, Molde University College, P.O. Box 2110, 6402 Molde, Norway
*
Author to whom correspondence should be addressed.
Logistics 2021, 5(3), 57; https://0-doi-org.brum.beds.ac.uk/10.3390/logistics5030057
Submission received: 17 May 2021
/
Revised: 2 August 2021
/
Accepted: 5 August 2021
/
Published: 24 August 2021
(This article belongs to the Special Issue Information Systems and Technology of City Logistics and Urban Freight)
Abstract
:Surges in e-commerce sales represent a huge challenge for urban freight transport. Parcel lockers constitute a valid solution for addressing the challenges home deliveries imply. In fact, eliminating courier–consumer contact (also relevant for health-related issues, as made evident by the COVID-19 pandemic) and delivering in fewer predefined places might help coping mechanisms for missed deliveries substantially. Furthermore, this option enables consolidated shipping and reduced delivery trip costs. This paper analyses and compares consumer preferences for alternative collection strategies. It investigates home delivery vs. parcel locker use and forecasts their future market shares. This is performed based on both customer socio-economic variables and the attributes characterising these alternative logistic fulfilment strategies. The case study considered tests upon a stated preference survey deployed in the city of Rome. The investigation specifically targeted young people (i.e., population under 30 years) since they represent early adopters. Discrete choice models allow both quantifying the monetary value of parcel lockers attributes (i.e., willingness to pay measures) and estimating the potential demand for this innovative delivery scheme. Results show that distance and accessibility are the main choice determinants. Furthermore, there is an overall high propensity to adopt parcel lockers. This research can support policymakers when implementing such solutions.
1. Introduction
E-commerce is soaring worldwide. In fact, the share of e-commerce doubled total global retail sales in the period from 2015 to 2020 rising from 7.4% to 14.6% [1], and global online shoppers rose from 18% to 53%, with an annual turnover growth of 19.3% [2]. More online traffic and a shift to mobile shopping coupled with easy and convenient deliveries stimulated this exceptional growth [3].
The COVID-19 outbreak strengthened this global trend since new consumers, products, and retailers have embraced e-commerce due to health-related considerations although it still remains a minority practice [4]. Older people have started to shop online more thanks to its ease and convenience. This has happened while shopping online for food, groceries, personal hygiene products and sports equipment has drastically increased. At the same time Small Medium Enterprises (SMEs) are now starting to sell online by opening up shops on online marketplaces and by investing in their own websites, strengthening an already existing omnichannel trend. In fact, nowadays, stores operate as collection points for online purchases (i.e., click-and-collect), as drop-off point for returns, and as micro-fulfilment centers for faster, more cost-efficient, and greener product deliveries (so-called ship-from-store) [5].
Despite the potential, e-commerce represents a highly inefficient sector, which is due to the difficult management of last mile logistics in particular. In fact, nowadays, the rise of e-commerce sales imposes more cost to pure-players and multi-channel retailers as well as to their logistics providers.
The mismatch between what consumers are willing to pay due to new supply-driven trends and the cost of providing delivery service represents the main source of the low profitability [6]. In particular, an overstressed last mile delivery logistic model exacerbates these issues since it accounts for 28% of total delivery costs [7]. Furthermore, last mile logistics suffer from a lack of data and understanding and need a participatory approach accounting for stakeholder heterogeneity and an integrated modelling approach on the academic side [8]. Possible measures tackling last mile inefficiency must be combined properly because no solution alone can address last mile logistics problems [9].
Parcel lockers (PL) represent one of the solutions that might favor last mile delivery efficiency. In fact, PLs can play different roles in optimizing delivery fulfilment and return flows. With respect to delivery fulfilment, the use of PLs severs the binding time/location constraint where both the deliverer and the receiver need to be in the same place at the same time. By adopting PL within the freight distribution strategy, it allows the relief of this constraint, which often implies second or even third delivery round attempts. Furthermore, this also applies to reverse logistics, which play a major role in some specific segments such as clothing and apparel, representing a major segment of the e-commerce market. Both of these flows might represent a substantial cost for logistics service operators (e.g., personnel and fuel) as well as for society at large (e.g., pollution, congestion, and accidents).
This research aims to assess consumer preferences for PL compared to home deliveries (HD). It explores the impact that individual characteristics and PL-related ones might have on market demand. This, in fact, can be useful for policy planning and for logistics operators alike. Furthermore, this paper investigates the discount necessary to stimulate PL demand.
This paper focuses on the population segment below the age of 30 (i.e., “young” is defined people who are from 18 to 30 years old) due to three main reasons:
- Innovation-prone attitude characterizing this age segment [10].
- Significantly higher importance on the e-commerce market. It is predicted that this generation will dominate 40% of all consumer shopping in the US in just a couple of years [11].
- Focusing on a well-defined age segment minimizes the effort required to acquire a sufficient sample to provide statistically robust results.
The paper studies e-consumer behavior through stated preference (SP) acquired via a dedicated survey. Choice data are modelled using a multinomial logit model (MNL) to estimate marginal willingness to pay (MWTP) and market demand. Both elements are helpful in clarifying how PLs characteristics might influence the chosen delivery method.
The structure of the paper is as follows: Section 2 reports a focused, synthetic, and comprehensive literature review, while Section 3 discusses the methodological approach that was adopted, the case study, and the sampled data that were used. Results are discussed in Section 4, while Section 5 illustrates some policy implications of the results that were obtained, and Section 6 concludes the paper.
2. Literature Review
The literature review reported below aims to set the scene to position the contributions to the literature this paper provides. In particular, it will address PL diffusion, the economic impact of PLs, and e-consumer PL preferences.
This review does not consider environmental sustainability and considers it a minor issue with respect to the aim of this paper. Furthermore, a substantial component of environmental sustainability, especially the part linked to emissions, can be directly related to operational efficiency. In fact, using PLs allows for a higher drop-rate per stop made. This typically implies less kilometers driven per total amount of PLs delivered. Therefore, while primarily focusing on operational issues, this paper implicitly also deals with the environmental implications of e-commerce delivery.
PLs are typically unattended and located in residential areas, workplaces, or public utility places, such as shopping malls or railways stations [12]. Alternative PL definitions that appear in the literature are (1) automated delivery stations and (2) collect and delivery points or automated delivery points [13]. One should note that automation differentiates them from other delivery techniques.
Typical PLs function as follows: The online buyer selects the PL as delivery point and subsequently receives a confirmation email/text message with a QR code containing the corresponding number of the locker that they will need to use [14].
Recent research has identified PLs as one of the most tested schemes in European cities as proven by the steady growth of the Pl network all around Europe [12,15]. However, only 12% of global e-shoppers use PLs, and PL delivery is seldom the most preferred delivery method [16,17]. For instance, semi-structured interviews with companies working in the courier, express, and parcel sector conducted in Italy by [18] reveal that customers have not generally accepted PLs, while [19] suggest that PLs can provide an advantage only “if not being at home for a delivery creates a significant problem for consumers with collect and delivery points being their only alternative”.
Overall, PL networks are not uniformly distributed in Europe: Germany, Spain, Poland, and Finland present a widespread network, while, for example, the UK, Italy, and the Netherlands have a medium or small PL network [15]. For instance, in Germany, 90% of the population can reach a PL in less than 10 min, while in Italy, only 12% of the population has PL within a 500 m distance [15]. Furthermore, the research performed by Refs. [20,21,22] show the unequal spatial distribution of PLs and collection and delivery points between urban and rural areas.
Simulation-based and real delivery data studies assess the decision to invest PL networks, showing that PLs can provide economic benefits. Several papers compare HDs and PLs through simulations [23] or via real time data [24,25] and conclude that PL adoption implies cost reduction “due to the less travel to unload the whole orders to the locations where the PLs are installed” [24]. Recently, some studies quantified through PL simulations in order to consider economic impact and focusing on city typology (urban, suburban, developing cities) and logistics solutions [26,27,28]. Furthermore, another research stream assessed all of the costs associated with PLs in more detail, confirming the cost efficiency. In particular, they observed specific features of a PL network in more detail. For instance, several researchers have explored PL size [29,30] and redelivery attempts [31], others have carefully assessed optimal PLs numbers and locations [32], while others still consider elements such as the cost-effect of density, the delivery window, and the parcels per collection point drop [33]. Furthermore, they consider PL applications on different e-commerce sale models (i.e., C2B, C2B, B2C) [29]. Moreover, some of them adopted innovative methodologies such as agent-based models [30] and assessed PL cost–benefits in the long term [34].
However, some studies, through qualitative and quantitative methodologies, underline possible hardships in PL implementation. In particular, these hardships are discovered by focusing on the business model underlining a PL network and on the implementation process. In fact, a study conducted in Italy discovered that “introducing PLs is a long and expensive process of implementation of a network where costs are shared among the courier express parcel company, the retailer, and the owner of the locker box” [18]. In particular, a sufficiently high market share is needed to overcome the high investment costs [35]. Research conducted in Turkey that studied collection and delivery point failure cases put together the key success factors for the demand (consumer market characteristics, regulations, security issues, and the convenience of existing alternatives) and supply side (network structures, IT integration, and diverse value propositions). In particular, it underlined how such a solution “was not viable as a standalone service but needed to be complemented with traditional cargo delivery” or otherwise logistics providers “should diversify value proposition and providing different services to e-commerce consumers” [19].
All of these elements emphasize the importance of understanding which factors (PL attributes, behavioral and demographic factors) raise consumer willingness to collect goods via PLs. Therefore, there is a whole research stream that focuses on market acceptance and consumer preferences regarding CDPs. Methodologies used to investigate consumer delivery preferences vary a lot with respect to the research objective. Several research studies aiming to investigate specific and individual-related PL factors influencing the choice of PLs used questionnaire data combined with a descriptive analysis [14,36] or with simple basic econometric models [37], a focus-group methodology [38], and secondary data [39]. By contrast, research aiming to prove the importance of some factors linked to a specific e-commerce-related consumer behavior model (i.e., resource matching theory, innovation diffusion theory, perceived value theory, and transaction cost economics) that used a structural equation model or a hierarchical cluster analysis [40,41,42,43].
Overall, average e-consumers deem 24 h accessibility and proximity to home/work as the two most important PL related attributes [13,14,36,38]. Other relevant variables explaining agent willingness to use a PL are the price of delivery [13,36], traceability [13], location in parking areas [14], easy parking [38], and safety [39,44]. Psychological attributes such as perceived risks, perceived satisfaction, and technological readiness and individual/behavioral attributes such as age, the value of the parcel, and online shopping frequency seem to further explain PLs choice [37,40,41].
In conclusion, studies based on e-consumer PL preferences capable of producing synthetic indicators of PL impact (e.g., MWTP, market demand) are scarce although several e-commerce studies have already used proper methodology suitable to accomplish these targets (e.g., SPs methods, [45,46]). In fact, only [13] estimates via SP surveys the impact that PL attributes have on e-commerce fulfilment strategies, their potential market demand, and the MWTP for using a PL. However, this research does not consider the behavioural and demographic factors that influence market demand. Furthermore, although several studies focusing on the supply side quantified the economic impact of PLs by calculating the money saved through PL usage [28,33], no one has matched it with the demand side by considering consumer willingness to pay for PLs, assessing the PL attributes and taking behavioral and demographic factors account.
3. Methodology
This paper adopts a SP perspective to study consumer preferences when deciding whether or not to use PLs for e-commerce-related deliveries. SPs allow for the assessment of plausible scenarios that do not yet exist, thus overcoming the typical lack of data and providing valuable insights on consumer delivery preferences. Furthermore, an SP-based approach is well suited for the comparative evaluation of alternative policy options.
In practice, choice experiments allow respondents to choose from hypothetical e-commerce delivery options (i.e., HD and PL) characterized by different trade-offs among the attributes. Therefore, the interviewee is asked to select a delivery choice out of several alternatives in each choice task.
This paper uses discrete choice models (DCMs), a MNL model in particular, to estimate the underlying agent utility functions capable of predicting consumer choices between HD and PL and delves in consumer delivery choice for an a priori effect, adding socio-economic and behavioral information to agent utility function.
MWTP and market demand illustrate the impact of a single PL attribute in consumer delivery choices, offering a synthetic description of an e-consumer delivery choice. In particular, the research considered most impactful and significant MNL parameters, combined them with the most important individual specific parameters, and used them to simulate the choice probability of a given PL, thereby calculating its market demand (% PL users of total e-commerce users that are supposed to only use PL and HD). Furthermore, the paper estimates MWTP, calculated as the ratio between a given coefficient and the monetary one, to assess the incentives that couriers can provide to consumers.
The next sections discuss in the methodological phases, the survey structure (The SP part and the revealed preference part), the sample features, and the case study description.
3.1. Methodological Phases
The different phases are:
- Survey design (i.e., questionnaire creation explanation)
- Survey administration (i.e., questionnaire structure explanation)
- Data analysis (i.e., econometrical model explanation)
3.1.1. Survey Design
Choice task setting represents the first methodological challenge. The investigation of which attributes to use started by reading the following articles: [13,14,36,47]. After some critical discussions among the research team members and a consultation with some students at the University of Roma Tre who were under 30 years of age, we defined the set of attributes and levels to be used in the choice experiments. Below we report the attributes and levels characterizing PLs:
- Distance: 500, 1000, 1500 m from home/work.
- Accessibility: 24 h, 8 a.m.–18 p.m.
- Typology: automated, assisted.
- Environmental sustainability: environmental certification: yes, no.
- Location: stations (e.g., railway, bus, gas, etc.), shopping sites (e.g., supermarkets, shopping malls, etc.), service sites (e.g., school, gym, bank, post office, etc.).
- Monetary incentive: EUR 0, 1, 2 discount on sale price when PL is chosen.
In practice, the interviewee is asked to select a delivery choice out of three alternatives in each choice task: a generic HD (status quo scenario), and two PLs described on the basis of the previously mentioned attributes.
It is important to recall that both “Distance” and “Location” are coded effects. This implies that one can only estimate n-1 coefficients (where n is the number of levels), while the one associated to the benchmark level can be calculated by summing the n-1 coefficients and multiplying by -1. Taking “Distance” as an example, the model estimates the coefficients for 500 and 1500 m; by summing those two coefficients and multiplying by -1, one can calculate the coefficient for 1000 m. In particular, the acronym for the distances of 500 and 1500 are D500 and D1500, while LOC_TRA and LOC_GRO are the acronyms used for stations and shopping centres, representing the levels of the variable location.
An orthogonal design was used to develop a pilot for the specific choice scenarios presented to the interviewees. After acquiring the first wave of data and estimating a MNL model, the results were used to develop a D-efficient design as suggested by [48] for the second wave of interviews. The experimental design that was used foresaw thirty-six choice tasks. Due to time/attention constraints, we subdivided them into six blocks, with each one containing six choice tasks via a blocking procedure. We used NGENE software (http://www.choice-metrics.com/index.html (accessed on 4 August 2020)) to group the choice tasks within each block.
3.1.2. Survey Administration
In the second phase, the questionnaire was administered among Roma Tre University students under the supervision and coordination of Transport Research Lab (TRElab) personnel in 2019. The questionnaire comprised three parts. The first part investigated e-commerce-related behavior by acquiring RP data on delivery location, frequency, type of trip (i.e., trip chaining or dedicated trip), PL awareness, and PL use. The second focused on choice experiments by asking the respondent to choose the most preferred option out of the three available, namely PL1, PL2, and HD (see Table 1). The third explored the socio-economic data of each respondent.
3.1.3. Data Analysis
After acquiring and cleaning the data, they were processed via the statistical software R (https://www.rstudio.com/ (accessed on 5 August 2020)). We estimated a MNL [49] and used Pseudo R2 to evaluate the best fitting model.
Random utility theory represents the MNL theoretical base. Utility includes two components: one deterministic and one random, as reported below.
In this case, the three equations reported describe the agent utility function for each delivery alternative (HD, PL1, PL2).
Attributes described in Section 3.1.1 compose the deterministic part. The model specification also comprises socio-economic and behavioral attributes such as education level (graduated, not graduated), the presence of someone at home to collect the parcel (yes, no), previous PLs (yes, no), and collection point use (yes, no).
It is important to note that for two out of the three alternatives (e.g., PL2 and HD), we had one coefficient for the socio-economic variables since they were all dichotomous (e.g., the variable HP, composed of 2 levels, has two coefficients: and ).
PL attribute are:
- K—Constant.
- AC—Accessibility.
- AS—Assistance.
- GRC—Green Certification.
- D—Distance; INC-Incentive.
- LOC—Location.
The socio-economic and behavioral attributes are:
- LE—Level of Education.
- HP—Presence of someone at home to collect the parcel.
- UP—Previous use of PLs.
- UCP—Previous use of collection points.
PL1 is the reference alternative, therefore K, LE, UP, UCP, HP are set to 0.
β measures the marginal utility of each attribute variation.
The respondent chooses the alternative with the highest utility among those available. Given that utility includes both a deterministic component (V) and a stochastic one (), one can determine the probability of agent n choosing alternative i only after having make an assumption on the distribution of (see [50]).
In our case, by assuming is Gumbel distributed, we have a MNL where the choice probability can be calculated as follows:
Pn(i) represents the probability that the individual n chooses alternative i given a choice set including S alternatives, while and can be , or .
In our case, one can represent PL market demand as the sum of all the PL individual choice probabilities.
Given that we have three alternatives in each of our choice tasks, PL1, PL2, and HD, since we want to compare PL use with respect to HD, for simulation purposes, we assume that PL1 = PL2.
Therefore:
MWTP for attribute x is calculated as follows:
where p indicates the price attribute variable, and x represents any other attribute included in the utility function. For more information, see [51].
4. Results
This section comprises a case study description and a part detailing the econometric results. The first part of the section offers an overview of the current status of mobility in Rome while also describing sample characteristics focusing on the interviewers’ e-commerce-related habits. The second part illustrates and discusses the results from the MNL, reports the MWTP attributes, and forecasts market demand for various scenarios distinguished by different incentive-, distance-, and accessibility-levels as well as the consumer socio-economic/behavioural characteristics.
4.1. Case Study Description
Data collection took place in Rome, Italy. There are 2.8 million Romans living in a 1285 km2 area. The city is the six largest in Europe with a relatively low population density. Limited public transport availability has fostered a motorized vehicle-culture, making Rome a car-based city. In fact, private vehicle trips account for 65% of the total trips. These factors coupled with a substantial migration from the inner city, which is delimited by the 67 km-long ring road encircling it, towards smaller nearby towns explains the (1) high level of congestion (second in the world according to [52]; (2) particulate matter levels exceeding the WHO’ recommendations; and (3) the excessive number of accidents (e.g., accidents involving pedestrians are six times higher than those in London, Paris, and Berlin) [53].
The Sustainable Urban Mobility Plan (SUMP), approved in 2018, considers logistics to be a crucial pillar to overcome these problems and deems PLs as one of the possible medium-term key actions to undertake so as to achieve the much hoped for improvements the city is seeking to achieve.
The sample, collected in 2019, was made up of 330 people living or commuting daily to and from Rome, which was 51.5% and 49.5%men and women, respectively. More than 75% of the sample consisted of students, with a median age of 23. 5 years old. Only 5.5% had obtained a degree, and only 14.6% of the respondents were more the 30 years old. As mentioned in the introduction, the research focuses on a specific age segment of the population. Therefore, the final sample consisted of 282 respondents each answering 6 choice tasks, thus generating 5076 observations in total.
When it comes to the e-consumer habits in our sample, the median consumer purchases 1 item per month, with an expenditure of EUR 28.5, which mainly comprise, in descending order, clothes (mainly shoes, t-shirts, and sweaters), free time related objects (mainly books and videogames), and electronics (mainly audio/video equipment, telephony, and PC equipment). These data are in line with the results obtained by another e-commerce report [54].
Overall, the spread of the PL delivery mode is low. In Rome, data indicate low PL knowledge and usage of 22.1% and 8.2%, respectively. E-purchasers usually prefer home (81.5%) or work/study place (8.4%) as delivery points, especially if there is someone ready to receive a parcel at home (70.9% of the respondents). The most used travel mode to reach a PL is a car (51.7%) followed by foot (44.8%), and by metro (3.4%). Roman travel habits and the average distance travelled to reach a PL (almost 1 km) explain these data.
4.2. Econometric Results
We first discuss the MNL results and then examine the MWTP and market demand-related simulations.
Table 2 reports the MNL results.
Overall, the model fits the data fairly well, with a Pseudo R2 of 0.131. Incentive, Green certification, Accessibility, and Distance are statistically significant. As expected, the first three attributes have a positive impact on utility, while the latter have a negative effect. Furthermore, Assistance and Location are not statistically significant. The alternative-specific constant and the individual/behavioral characteristics associated to the alternative PL2 are, as one should expect, not significant, suggesting that people have the same sensitivity with respect to the two generic PL alternatives. In particular, looking at those variables affecting HD choice reveals that having someone at home to collect a parcel has a positive effect, while having experienced the use of PLs or collection points has a negative impact. The higher the level of education, the less likely that HD is chosen.
The next two sections provide a more in-depth discussion on the effect of these attributes on PL choice through MWTP and market demand analysis.
4.2.1. Marginal Willingness to Pay
Table 3 reports the MWTP point estimates and their relative confidence intervals (using the Krinsky and Robb method, for more details see [55]) for the statistically significant attributes and taking Incentive as the monetary coefficient. Distance plays the lyon part. In fact, consumers are willing to pay EUR 3.11 to reduce the PL distance from 1000 to 500 m. The same change, moving from 1500 to 1000 m, has a lower monetary value, reflecting the non-linear effect of this attribute. Moreover, people are willing to pay EUR 1.64 for a PL that is available h24/7 day, while only being willing to pay EUR 0.75 for a green certification.
4.2.2. Market Demand
This section investigates market demand through scenario simulations. The four scenarios, based on possible different PL configurations, are:
- Base scenario: PLs 1000 m from home/work, accessible during working hours. without a green certification (representing, on average, the actual situation).
- Scenario I: base scenario with 24 h accessibility.
- Scenario II: base scenario with 500 m distance.
- Scenario III: base scenario with 500 m distance and h24 accessibility.
The paper considers these scenarios within a varying incentive level as well as within a socio-economic and behavioral context, thus providing a thorough impact analysis.
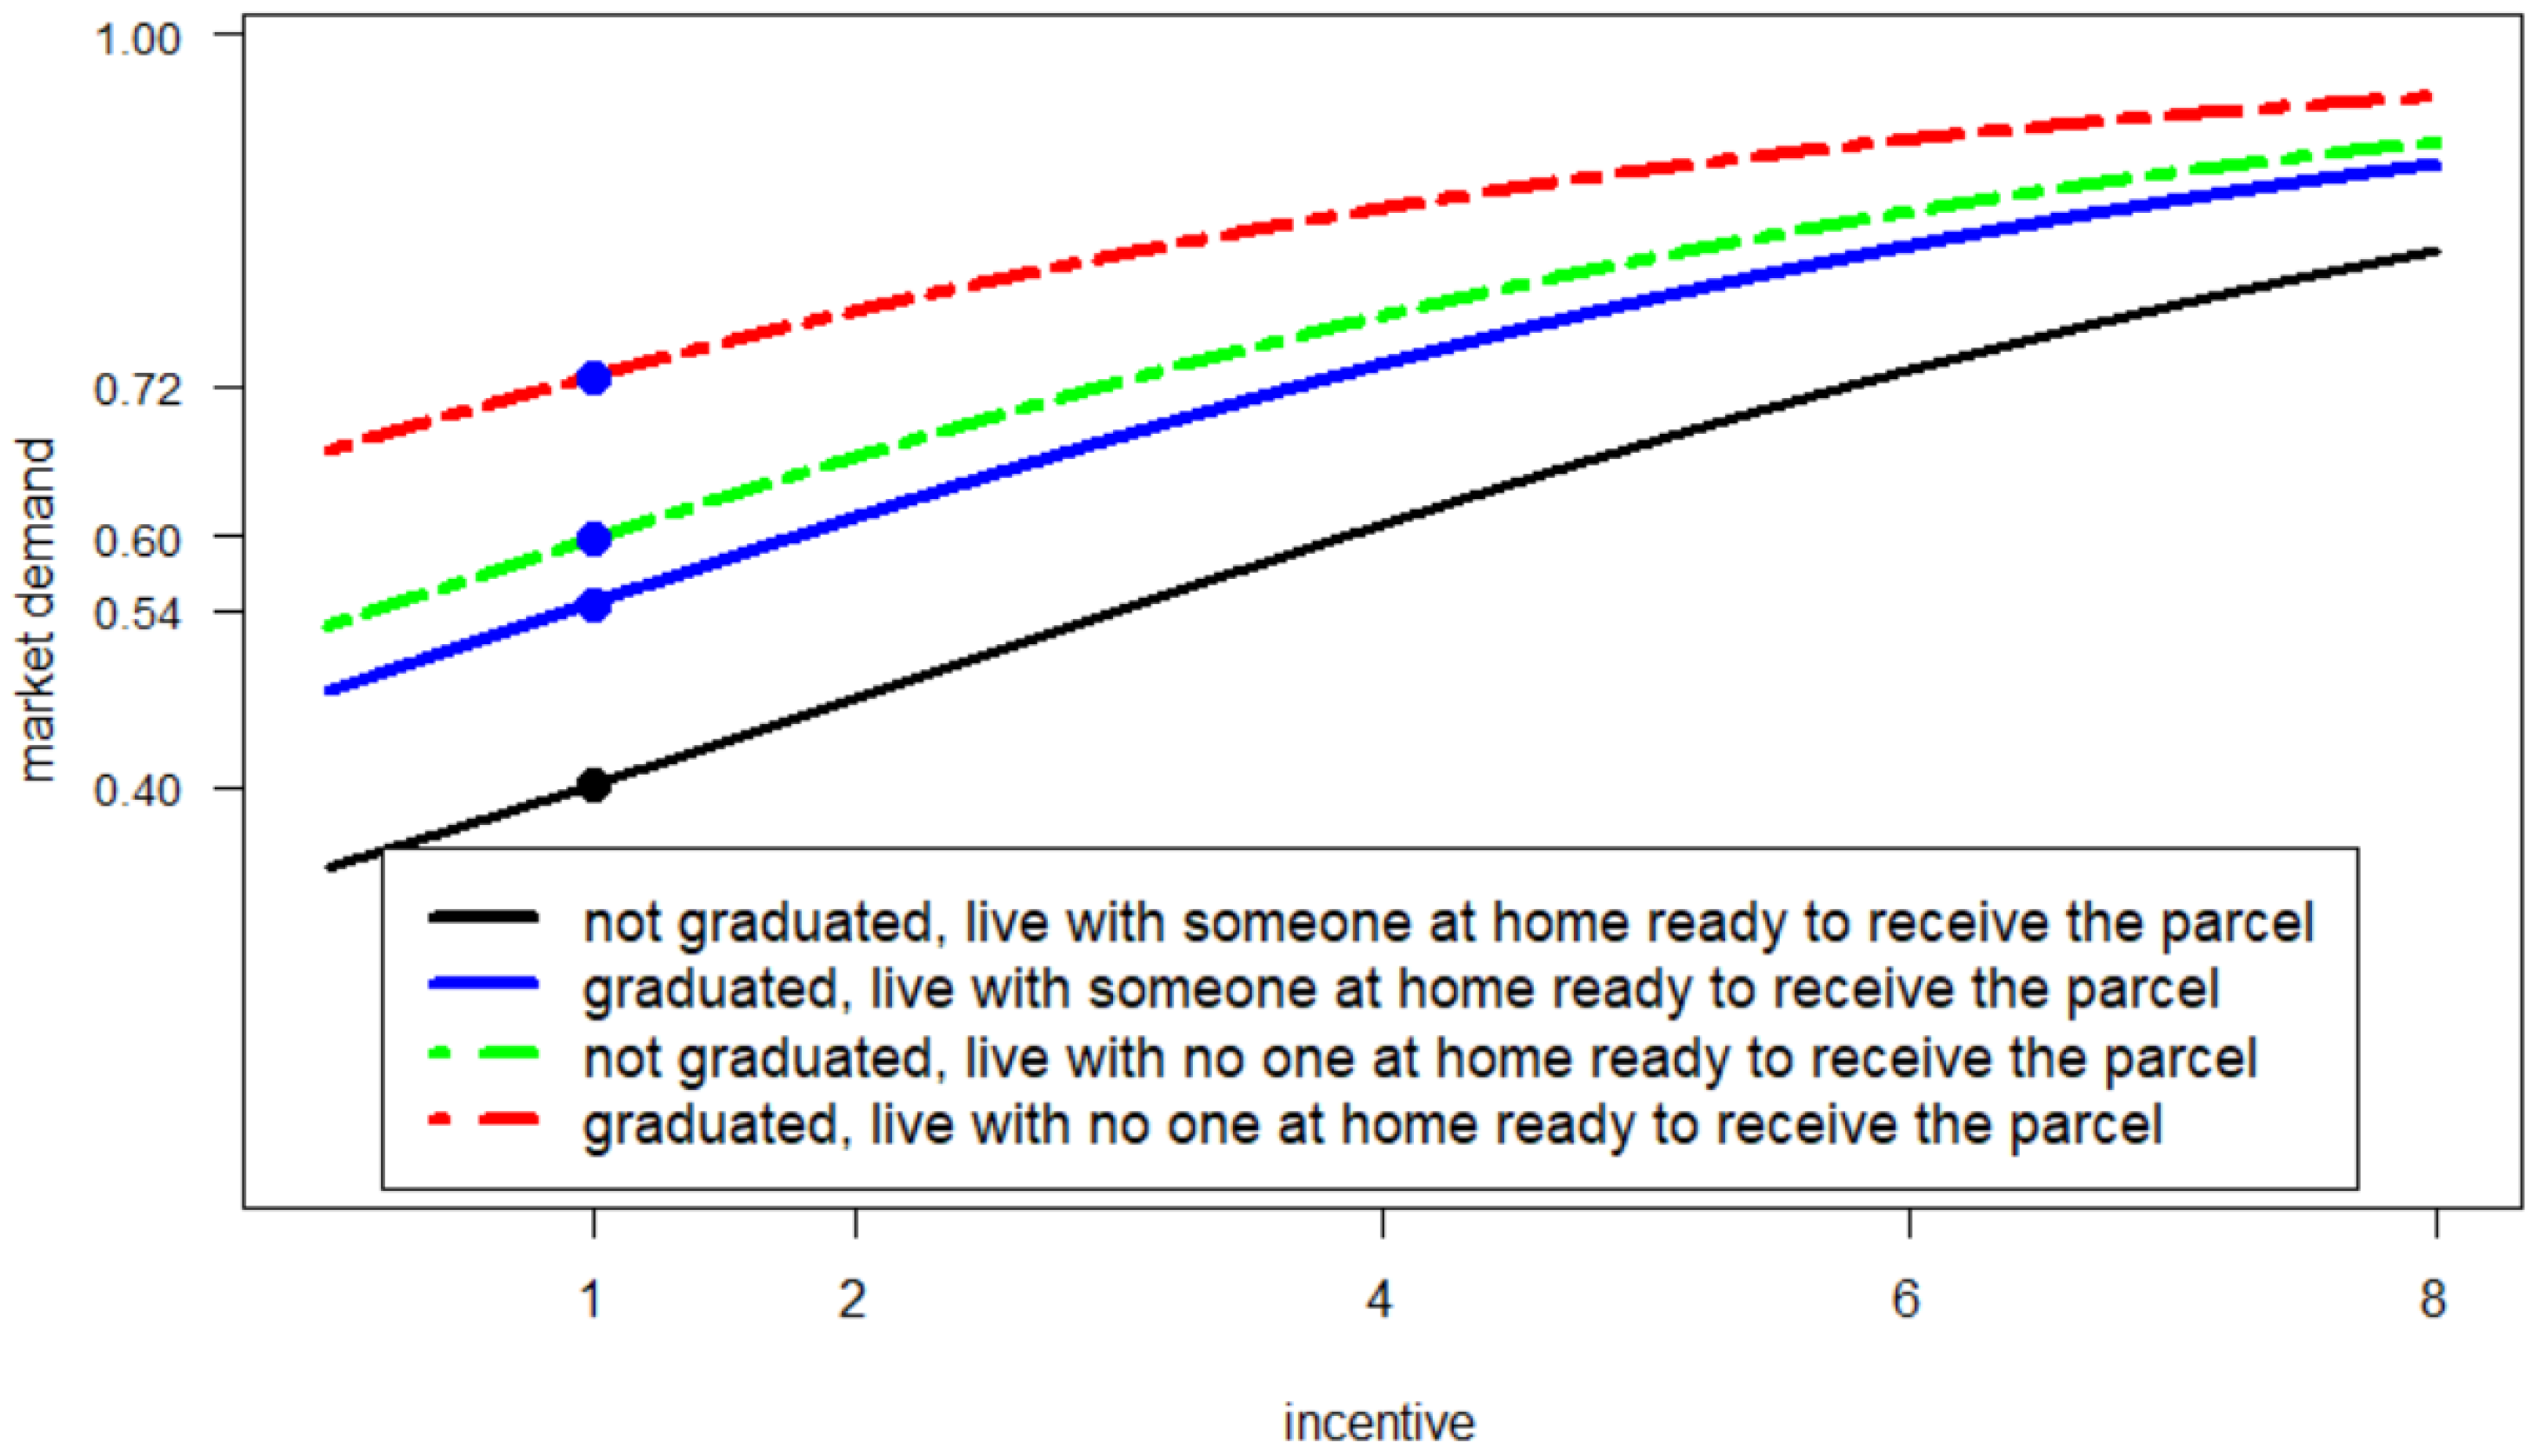
In particular, we considered the following situations: (1) not graduated with someone at home ready to receive parcel; (2) graduated with someone at home ready to receive parcel; (3) graduated no one at home ready to receive parcel; and (4) not graduated no one at home ready to receive parcel. Figure 1, Figure 2, Figure 3 and Figure 4 describe the percentage of PL users for each scenario depending on the incentive levels. Dots represent the theoretical market demand with an incentive of EUR 1, as applied by one of the most famous e-retailers in Italy.
The base scenario depicts an overall quite high market demand for PLs, which ranges from 72% to 40% when considering an incentive of EUR 1. Living with no one at home ready to receive the parcel represents a key condition for the high market demand independent of the education level (72% or 60%). However, even with someone at home, the demand is still relatively high at 54% and 40% for graduated and non-graduated participants, respectively.
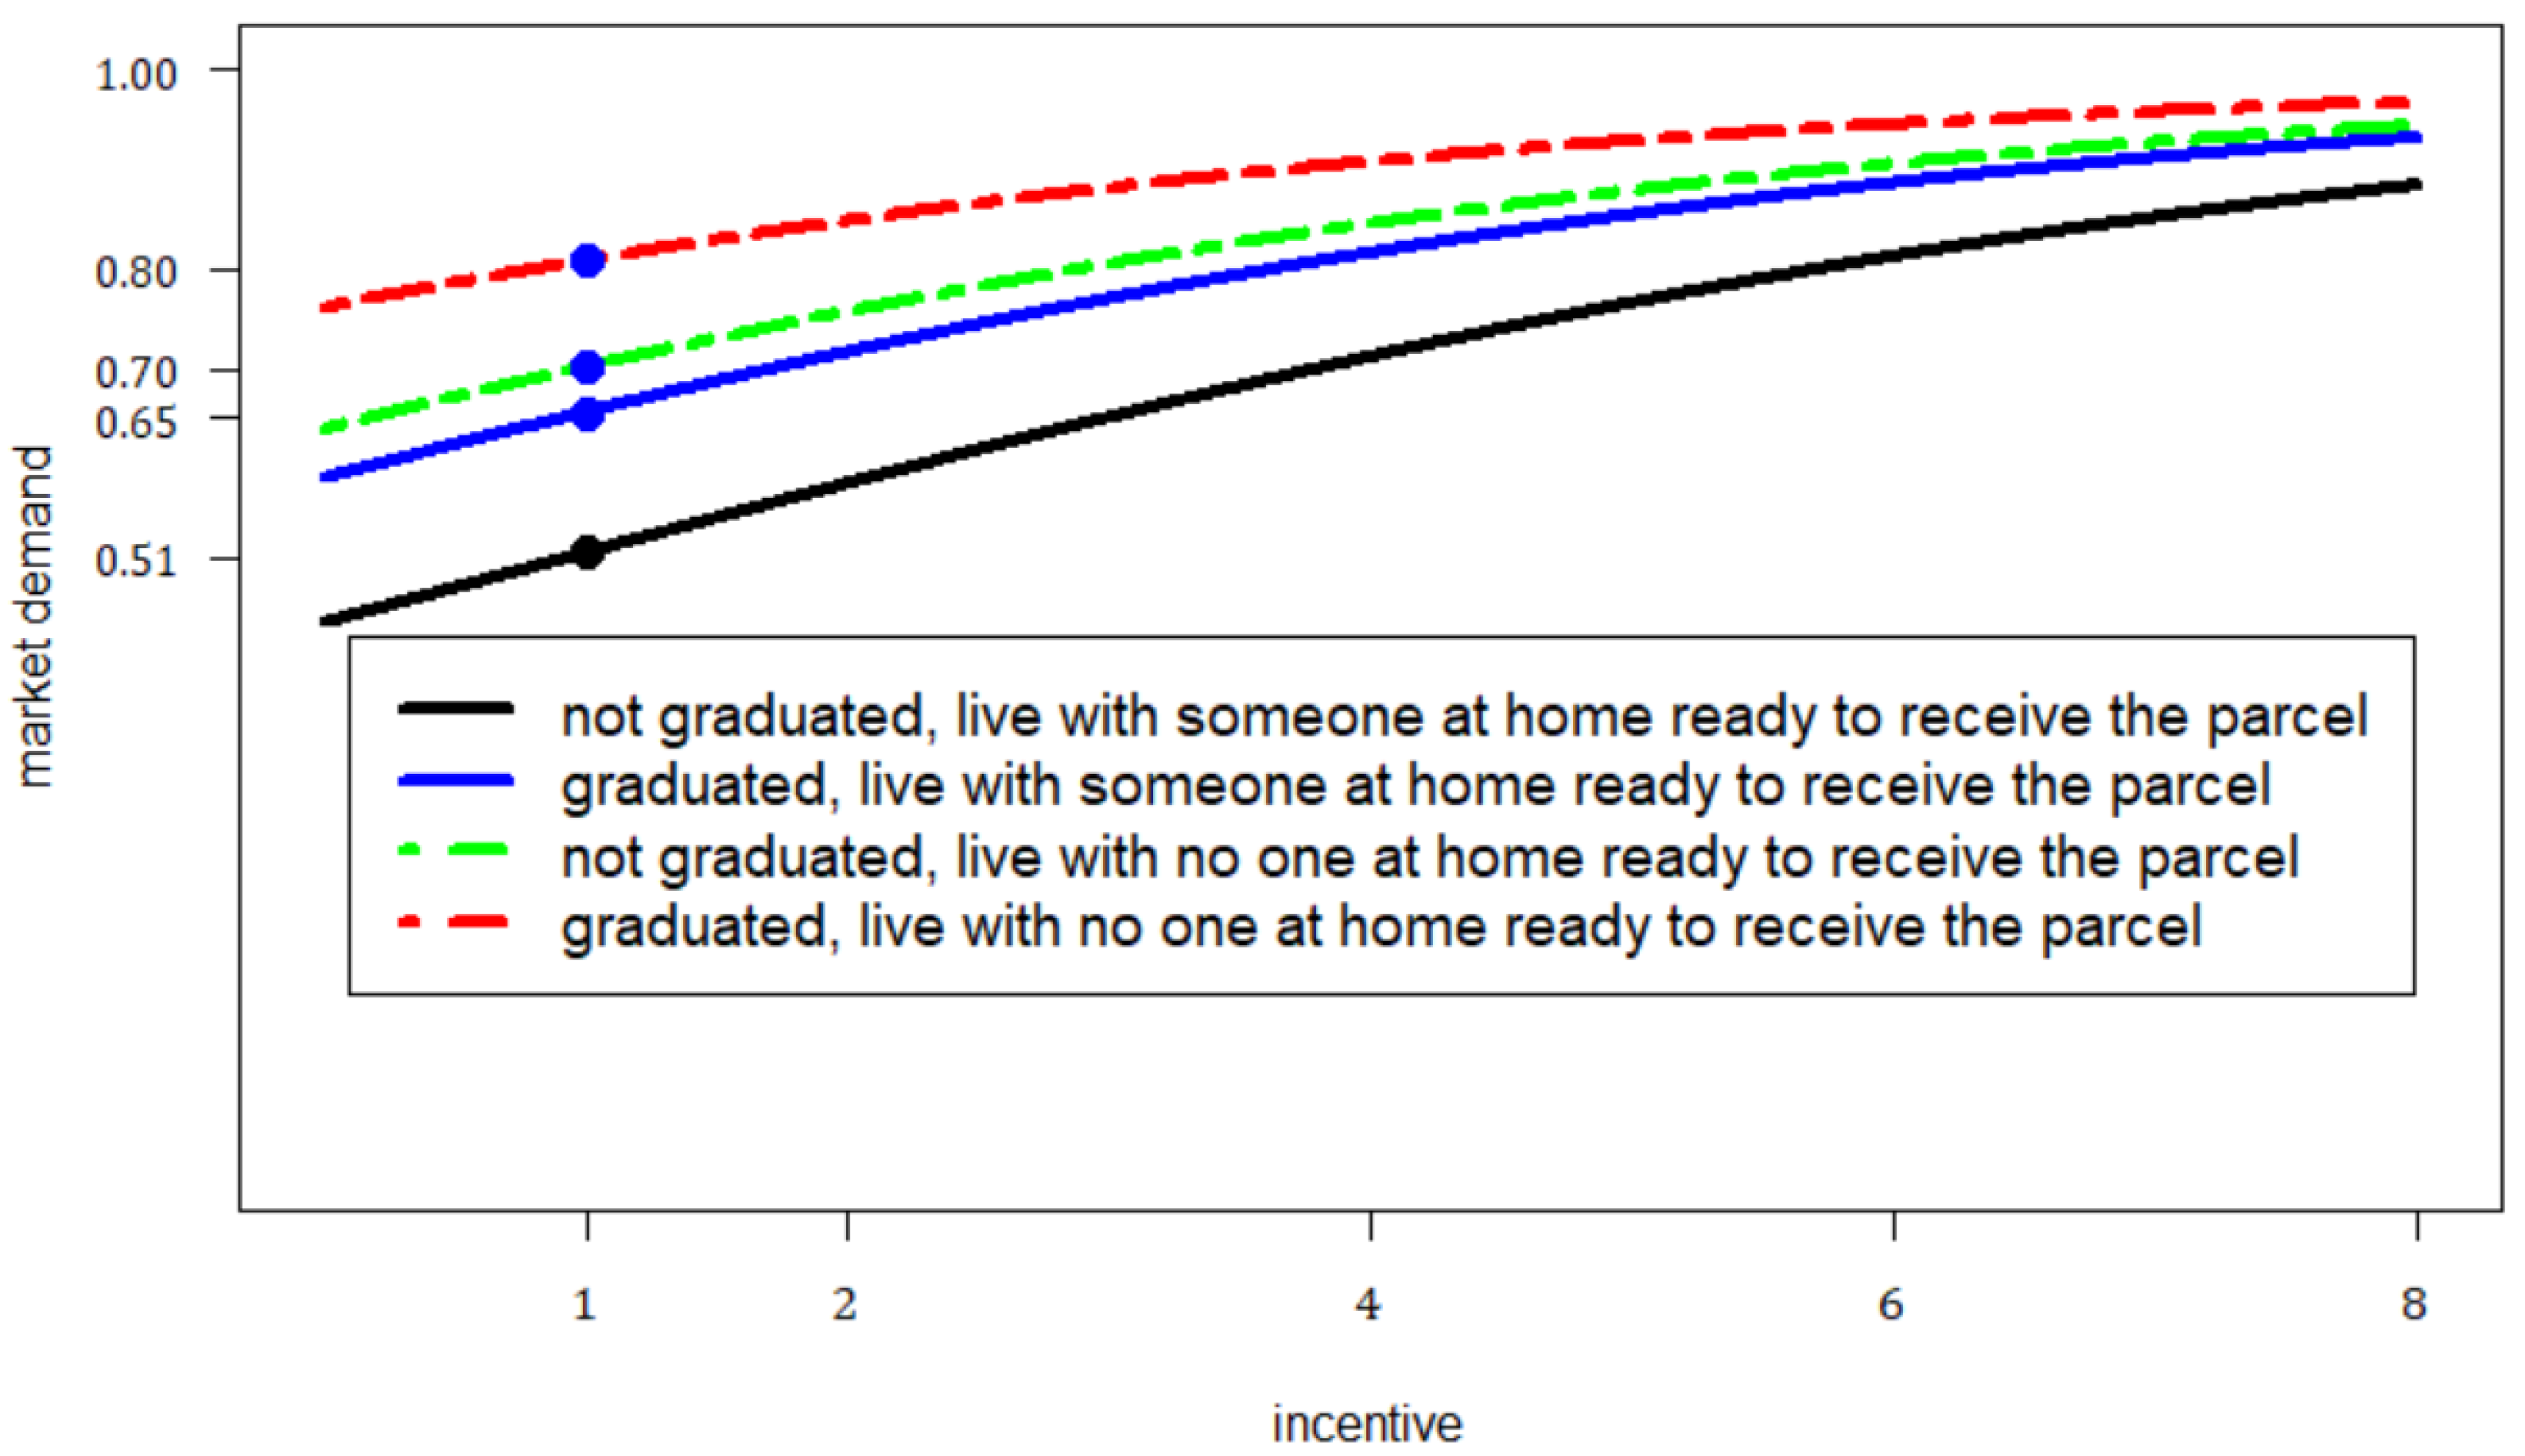
Scenario I depicts a new and overall high market demand for PLs, ranging from 80% to 51% when considering an incentive of EUR 1. Living with no one at home ready to receive the parcel represents a key condition for the high market demand independent of the education level (80% or 70%). However, even with someone at home, the demand is still quite high at 65% and 51% for graduated and non-graduated participants, respectively.
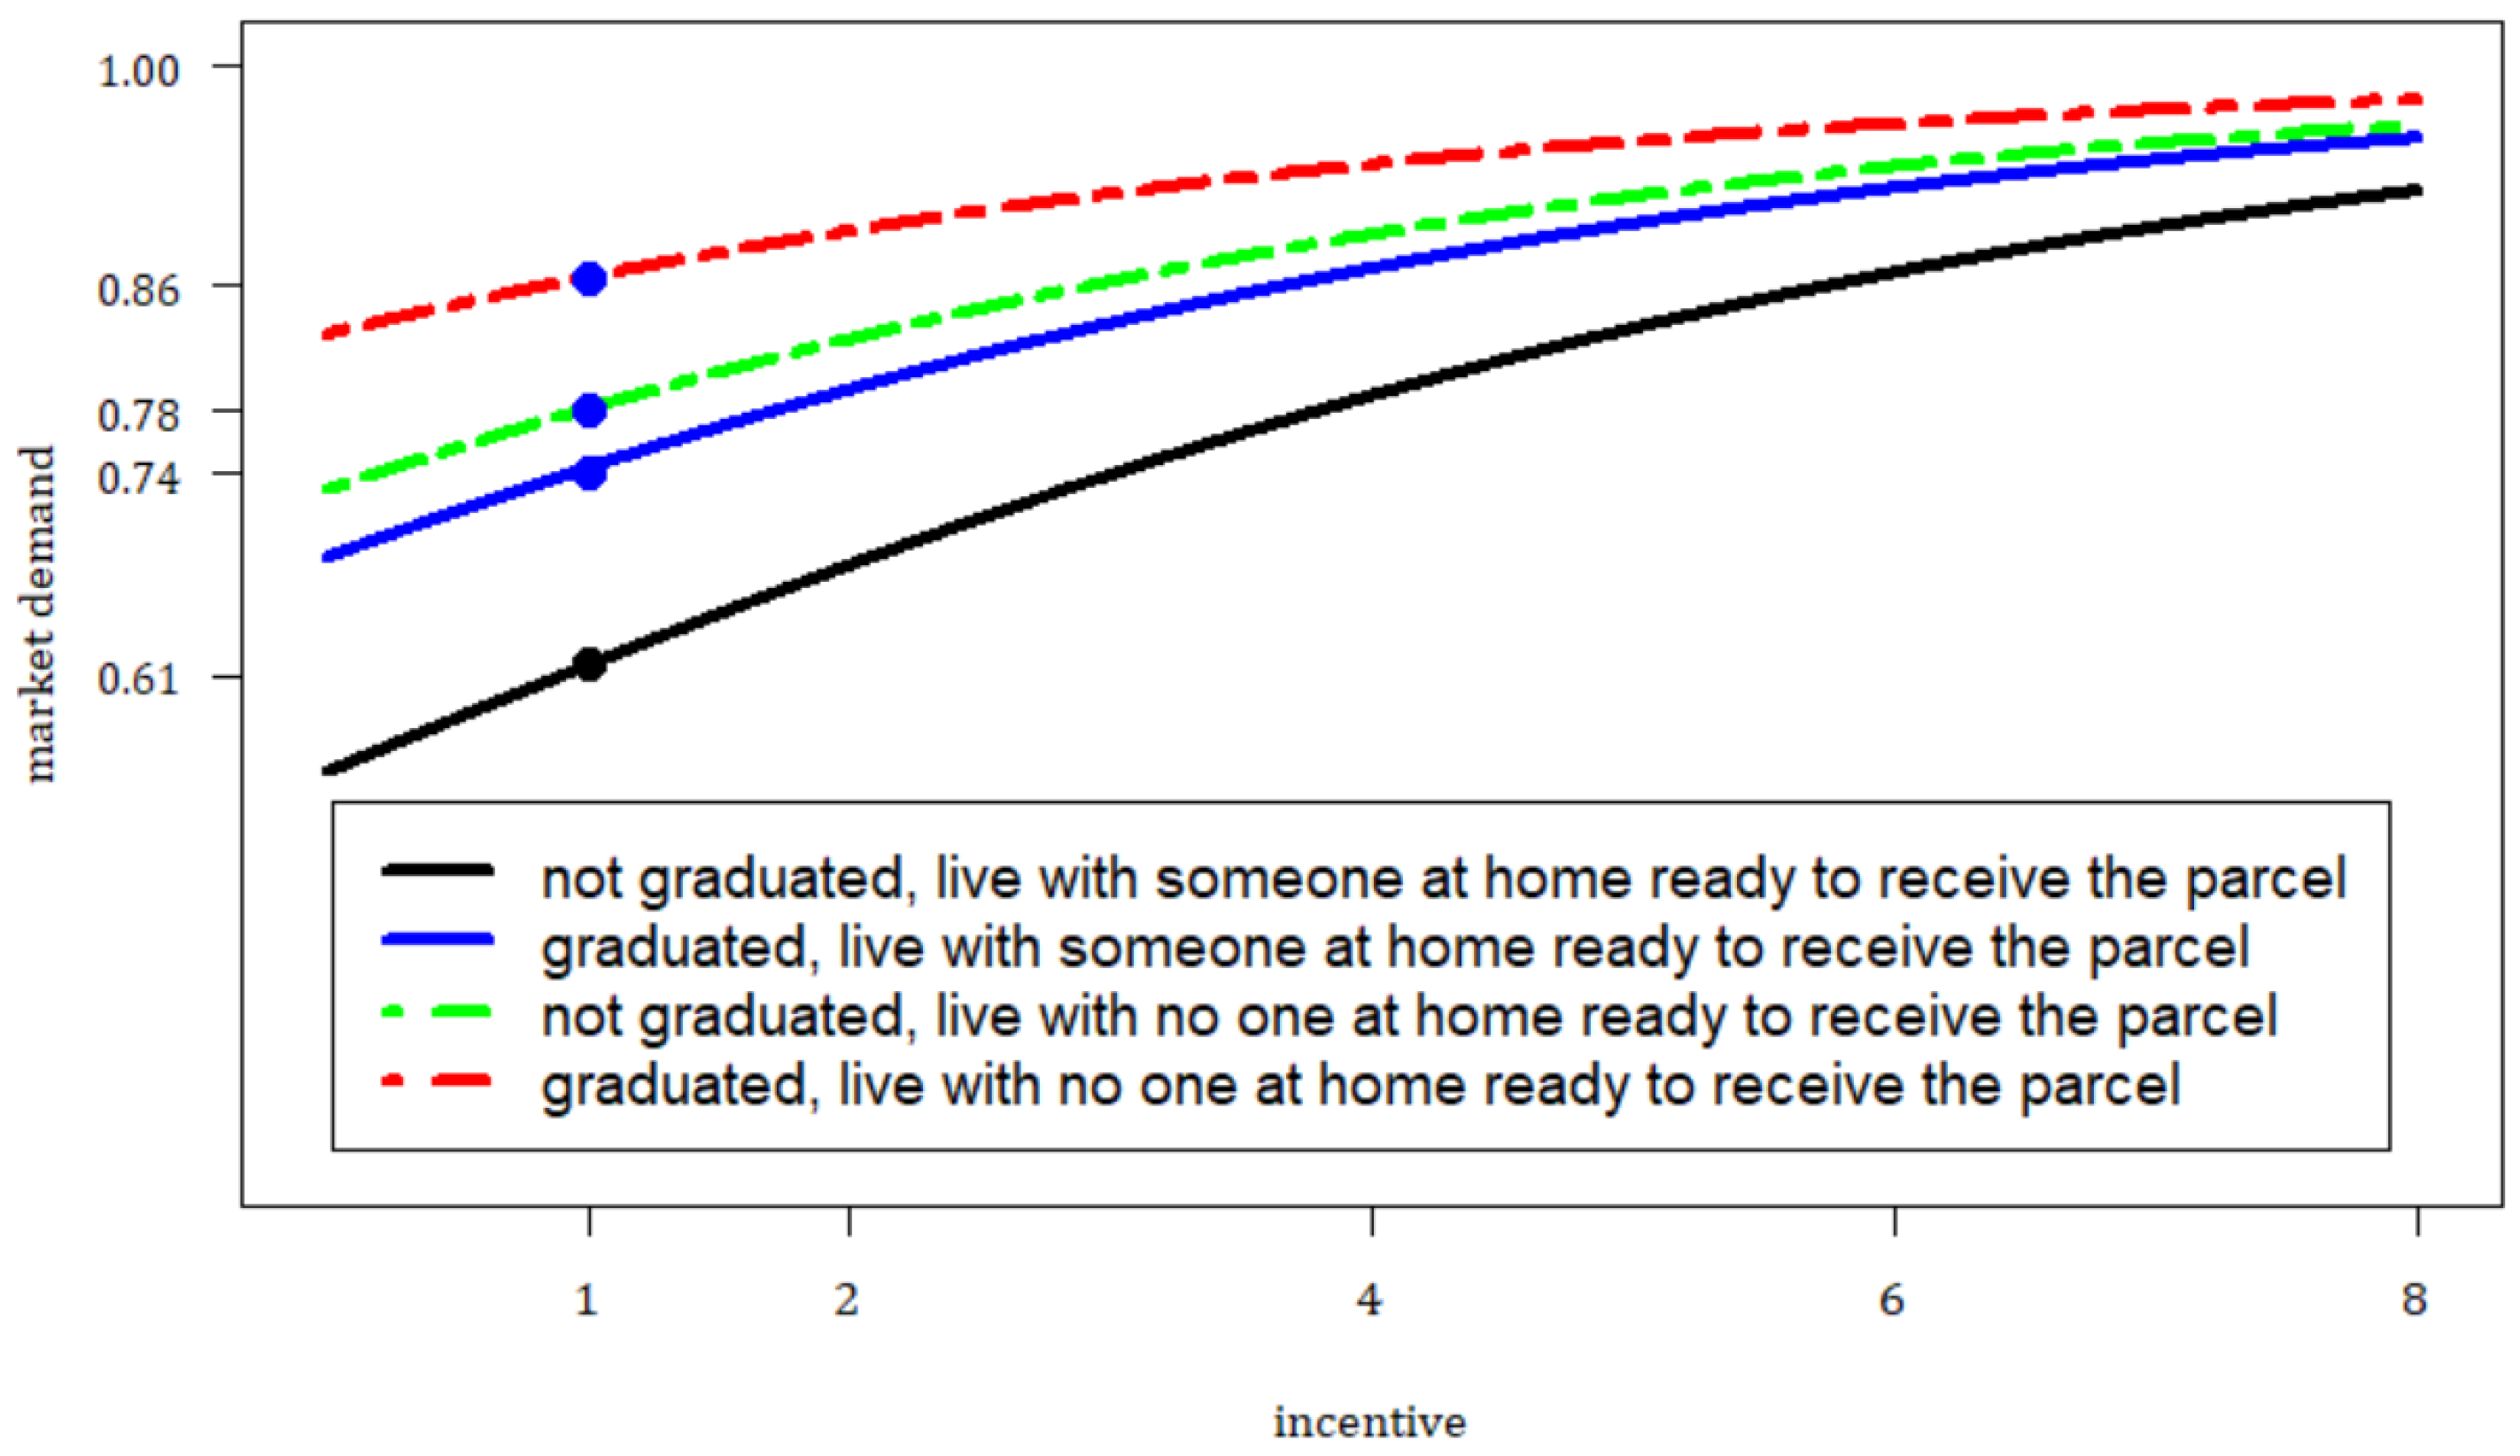
Scenario II depicts an overall higher market demand for PLs than the previous scenarios, ranging from 86% to 61% when considering an incentive of EUR 1. Living with no one at home ready to receive the parcel represents a key condition for the high market demand independent of the education level (86% or 78%). However, even with someone at home, the demand is still high at 74% and 61% for graduated and non-graduated participants, respectively.
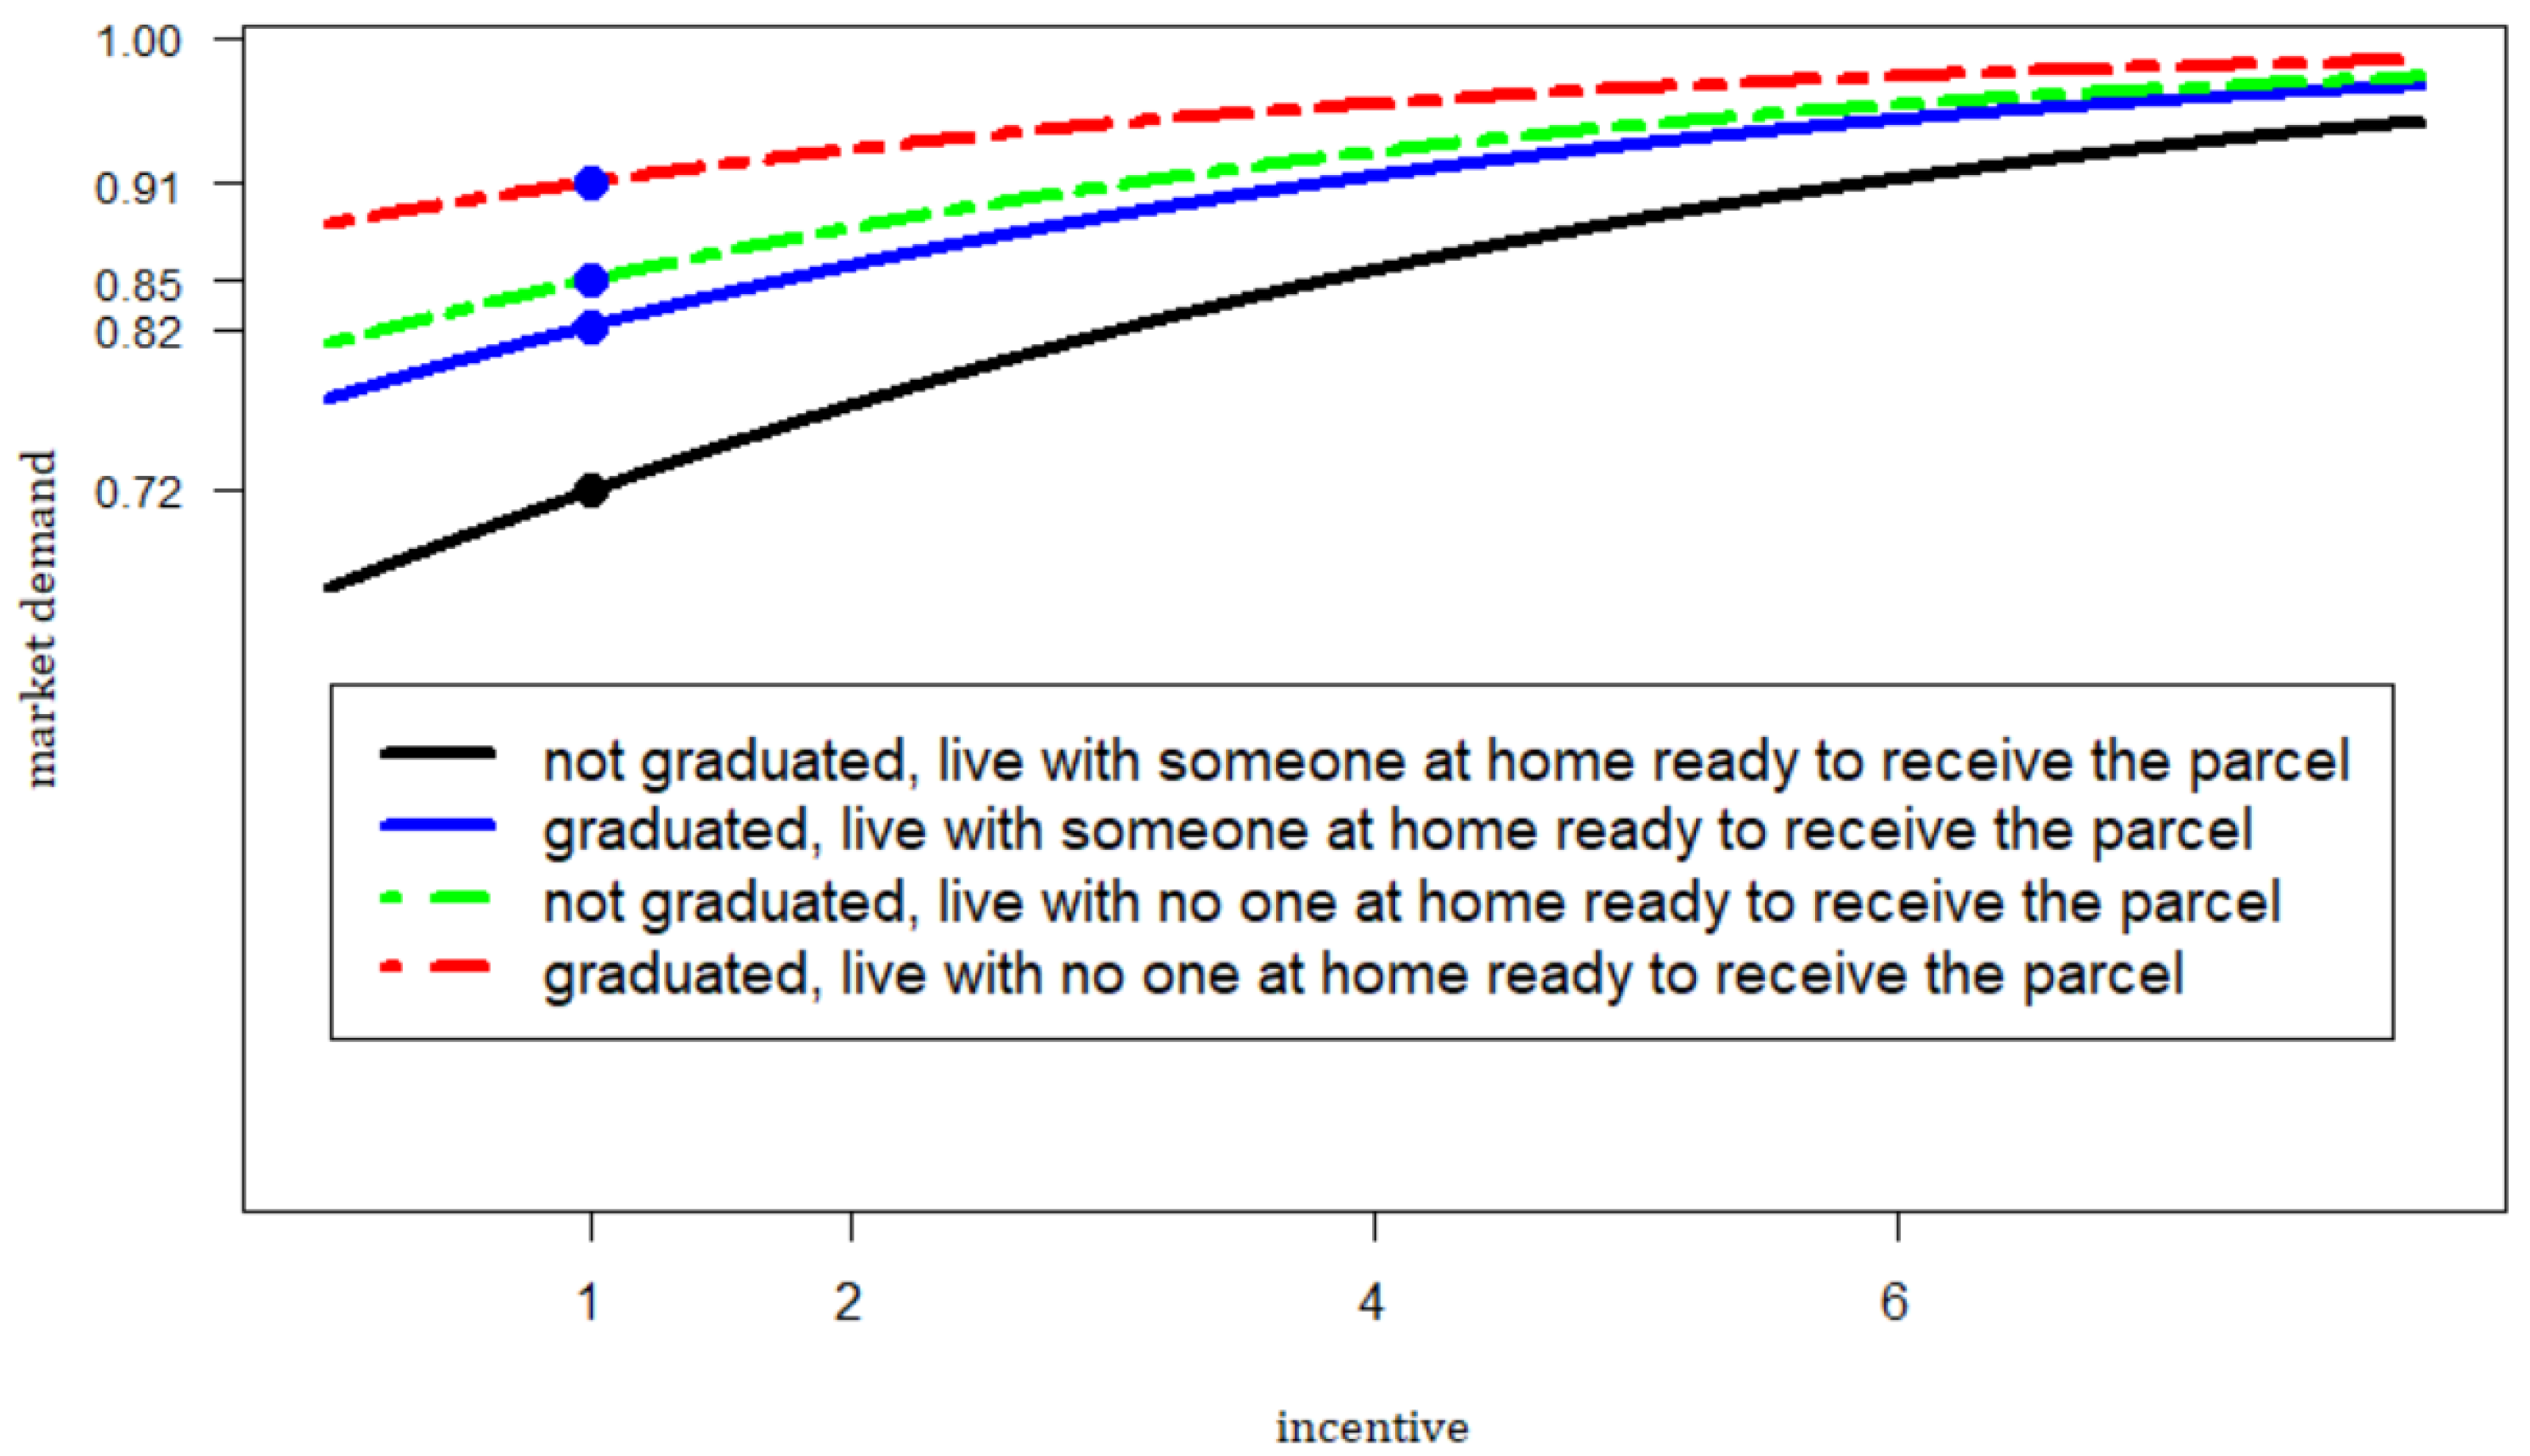
Scenario III depicts the highest market demand for PLs, ranging from 91% to 72% when considering an incentive of EUR 1. Living with no one at home ready to receive the parcel represents a key condition for the high market demand independent of the education level (91% or 85%). However, even with someone at home, the demand is still at high 82% and 72% for graduated and non-graduated participants, respectively.
Overall, the obtained results suggest an almost a priori interest in using PLs as the endpoint for e-commerce fulfillment. We also witnessed the importance of PL proximity (Scenario I and II) and how that factor is capable of boosting market demand. However, even with a PL 1000 m away from home/work, independent of its temporal accessibility (i.e., h24 or during working hours), we would still have a high demand. Higher educational levels have a positive impact on PL use, while having someone at home has a negative one.
5. Discussion and Policy Implication
This section illustrates some policy implications deriving from the obtained results. The discussion is articulated in two parts. The first part focuses on public sector implications, while the second part focuses on the private sector ones.
Results suggest a substantial PL demand for young e-consumers. In particular, capillarity, implying a high PL density (i.e., 4 PLs per km2), and h24 accessibility play a crucial role when developing a PL network to stimulate their demand.
A rough estimate of the number of PLs needed in Rome is worked out in what follows. Rome unfolds onto a 1285 km2 area. Supposing, and this is a heroic hypothesis, its shape is square, we would have a city that is approximately 36 × 36 km. Should we place a PL every 500 m from people’s home/work, assuming a homogeneous distribution of houses and workplaces with respect to the city surface, we would need a total of approximately 5140 PLs in Rome. Notwithstanding the strong and not-so-realistic assumptions made, just for the sake of providing a preliminary estimate, one could say that 5140 PLs are needed in Rome. A recently conducted investigation performed in mid-2020 considering the PL networks of the main e-tailers and logistics service providers (e.g., Amazon, DHL, Poste Italiane, etc.), reports a total number of 192 PL locations [15]. While conscious that the rough estimate provided needs to be substantially improved given the morphological characteristics of the city (e.g., green areas, historical buildings, peripheral/scarcely populated neighbourhoods, etc.), nevertheless, we can conclude that there is still a long way to go before we can reach the optimal PL density in the city that capable of producing the results that our modelling approach suggests. In fact, we could say that there are still 4948 PLs that have still to be put in place.
The results that we obtained are in line with other studies performed in Brazil [13] and Poland [14] and complement those reported in [23,30], who suggest optimal locations and PL sizes as key elements for a PL network.
Guaranteeing h24 accessibility is easier said than done since the majority of PLs are located in commercial establishments [56]. Metro and train stations could offer a quasi-optimal solution. However, bureaucracy could represent a significant barrier, especially when PLs are built in public spaces. Local administration plays a crucial role in adopting easy/quick procedures or directly investing in PLs, especially in the case of a neutral PL network (see [15,57]).
Overall, the results provided in this paper support the decision to include PLs as a medium-term key action to improve the logistics sector in the SUMP for the city of Rome [58].
Appropriate PL density considerations are also pertinent for the private sector. In fact, private operators could either aim at a high PL density (i.e., 1 every 500 m) or alternatively, position them not so densely (i.e., 1 every 1000 m); however, they should consider providing PL users with a discount rate of approximately EUR 3. This result is supported by [33], who estimate that the use of PLs instead of HDs in urban cities allows transport operators to save up to EUR 2.71. Furthermore, a high market demand could still be reached with an average PL distance of 1 km, targeting e-consumers not having someone at home to receive a parcel or who are already using similar delivery schemes (e.g., collection points).
Overall, high PL market demand caused by its wide network could provide benefits for the environment (e.g., less commercial vehicles, less pollution) as well as for almost all stakeholders: (1) delivery operators could reduce costs; (2) customers could collect parcels anytime; (3) e-retailers could exploit a cheaper delivery service; and (4) retailers could earn extra money due to new purchases made by PL users [47].
In particular, a widespread PL network could favor people’s green behavior, as suggested by student concerns about the environmental impact that freight transport produces [59], encouraging a travel mode shift from private cars to non-motorized modes of transport when picking-up their goods. In fact, PL users prefer to go by foot when the PLs are positioned within 500 m. In line with our results, [22] show that collection and delivery points that are 50% closer would lead to a 7% decrease in the probability of choosing cars and a 5 km decrease in vehicle kilometers travelled per trip.
Integrating PLs with other logistics solutions, such as cargo bike, night deliveries, and crowdshipping (e.g., parcel delivery from a PL located in the underground to another location via an underground passenger [60]) could help increase their density, as suggested by [28] and supported by our research. In fact, the combination of cargo bike and PLs in a well-diffused network would reduce the trade-off between operational costs and external costs.
6. Conclusions
This paper investigates e-consumer delivery choice, focusing on PL attributes in comparison to the status quo scenario (HD). In particular, the research performed in Rome assesses the potential PL market demand on the basis of the preferences of youngsters (defined as those under 30 years of age) using SP data.
Results show a positive attitude towards PLs, especially if they are characterized by a short distance (less than 500 m from home/work), h24 accessibility, and a small incentive (EUR 1), and these factors should represent PLs levels attributes. Moreover, specific individual characteristics affect the probability of choosing PLs. In particular, people who have graduated, who do no have someone at home to receive a parcel, or who already have experience using collection points are more prone to choosing PLs.
This research provides a useful tool for policymakers, potentially helping them to create informed decisions on PL implementation. In particular, it estimates the amount of PLs needed (4948) and their locations (e.g., metro and train stations) so as to satisfy a high market demand.
It also suggests several potential strategies for delivery operators:
- Implement a widespread PL network (one every 500 m).
- Implement a less-diffused PL network (one every 1000 m) offering an incentive of EUR 3.
- Targeting special groups of individuals (i.e., students, people who live alone, collections points users).
PL introduction in the city of Rome is in its early stages. The interest in various e-tailers and 3PL providers, have demonstrated, with respect to this solution capable of mitigating the negative impacts an e-commerce surge, the need for a scientifically robust yet practical method to plan and govern the likely diffusion of PLs in the eternal city. This is further confirmed by the sustainable urban mobility plan adopted in Rome that considers the adoption of a PLs-based strategy among one of the most important strategies to be implemented so as to promote the environmental sustainability of last mile deliveries. We are prone to thinking that the information acquired, the modelling approach proposed, and the econometric results obtained can fruitfully be exploited by local public authorities in developing consistent and well-structured PL deployment strategies. In fact, currently, the Logistic Living Lab of the city of Rome (www.trelab.it (accessed on 4 August 2020)) is working on a small scale pilot project aimed at studying, in a real life context, the strengths, weaknesses, opportunities, and threats pertaining to the deployment of both a PL-agnostic and PL-branded network so as to compare their relative costs and benefits under the triple P evaluation framework. It is worthwhile to note that the participatory planning approach that the city of Rome has adopted in all of the activities pertaining to the definition, adoption, and implementation of the sustainable urban mobility plan are perfectly aligned to the strategy this paper adopts.
Future research could target a representative sample, as we only focused on people below 30 years of age, and the assumptions made on Generation Z could potentially constrain the generalization of the results. Furthermore, we could use more sophisticated econometric models (e.g., mixed logit) in comparison to MNL and not accounting for heterogeneity. Furthermore, consumer preference data should be acquired together with mobility and delivery data so as to investigate the environmental impacts deriving from different PL adoption levels in a comparative fashion with respect to HD.
Author Contributions
Conceptualization, V.G. and E.M.; methodology, V.G. and E.M.; software, G.I. and V.G.; validation, V.G. and E.M.; formal analysis, V.G. and G.I.; investigation, G.I.; resources, V.G.; data curation, G.I.; writing—original draft preparation, G.I.; writing—review and editing, G.I., V.G. and E.M.; visualization, G.I.; supervision, V.G. and E.M.; project administration, V.G. and E.M. All authors have read and agreed to the published version of the manuscript.
Funding
This research received no external funding.
Institutional Review Board Statement
Not applicable.
Informed Consent Statement
Informed consent was obtained from all subjects involved in the study.
Data Availability Statement
Not applicable.
Conflicts of Interest
The authors declare no conflict of interest.
References
- Liscia, R. Netcomm Focus LOGISTICA & PACKAGING per l’ e -Commerce Il Ruolo Della Logistica Nell’e -Commerce. 2020. Available online: http://www.euromerci.it/siteimg/rivista/EMn5_Mag2017.pdf (accessed on 5 August 2021).
- RetailX. Global 2020 Ecommerce Report. November 2020. No. 6–8. Available online: https://retailx.net/global-2020-ecommerce-report/ (accessed on 2 June 2021).
- RetailX. THE 2020 RETAILX EUROPE GROWTH 3000. 2020. Available online: https://retailx.net/wp-content/reports/2020/RXGEU2020.pdf (accessed on 20 December 2020).
- Pernot, D. Internet Shopping for Everyday Consumer Goods: An Examination of the Purchasing and Travel Practices of Click and Pickup Outlet Customers. Res. Transp. Econ. 2021, 87, 100817. [Google Scholar] [CrossRef]
- Rai, H.B. Environmental Sustainability of the Last Mile in Omnichannel Retail; VUBPRESS: Brussel, Belgium, 2019. [Google Scholar]
- Allen, J.; Piecyk, M.; Piotrowska, M.; McLeod, F.; Cherrett, T.; Ghali, K.; Nguyen, T.; Bektas, T.; Bates, O.; Friday, A.; et al. Understanding the Impact of E-Commerce on Last-Mile Light Goods Vehicle Activity in Urban Areas: The Case of London. Transp. Res. Part D Transp. Environ. 2018, 61, 325–338. [Google Scholar] [CrossRef] [Green Version]
- Ranieri, L.; Digiesi, S.; Silvestri, B.; Roccotelli, M. A Review of Last Mile Logistics Innovations in an Externalities Cost Reduction Vision. Sustainability 2018, 10, 782. [Google Scholar] [CrossRef] [Green Version]
- Comi, A. A Modelling Framework to Forecast Urban Goods Flows. Res. Transp. Econ. 2020, 80, 100827. [Google Scholar] [CrossRef]
- Le Pira, M.; Marcucci, E.; Gatta, V.; Inturri, G.; Ignaccolo, M.; Pluchino, A. Integrating Discrete Choice Models and Agent-Based Models for Ex-Ante Evaluation of Stakeholder Policy Acceptability in Urban Freight Transport. Res. Transp. Econ. 2017, 64, 13–25. [Google Scholar] [CrossRef]
- Vieira, J.; Frade, R.; Ascenso, R.; Prates, I.; Martinho, F. Generation Z and Key-Factors on E-Commerce: A Study on the Portuguese Tourism Sector. Adm. Sci. 2020, 10, 103. [Google Scholar] [CrossRef]
- Optinmonster. Online Shopping Statistics You Need to Know in 2021. Available online: https://optinmonster.com/online-shopping-statistics (accessed on 7 June 2020).
- Cagliano, A.C.; Mangano, G.; Zenezini, G. Technological Trends in Last-Mile Contexts: A European Perspective Technological Trends in Last-Mile Contexts. In Proceedings of the 8th International Conference on Information Systems, Logistics and Supply Chain: Interconnected Supply Chains in an Era of Innovation, ILS 2020, Austin, TX, USA, 6 June 2020; pp. 356–364. [Google Scholar]
- Kelli, L.; Oliveira, D.; Morganti, E.; Dablanc, L.; Lúcia, R. Analysis of the Potential Demand of Automated Delivery Stations for E-Commerce Deliveries in Belo Horizonte, Brazil. Res. Transp. Econ. 2017, 65, 34–43. [Google Scholar]
- Iwan, S.; Kijewska, K.; Lemke, J. Analysis of Parcel Lockers’ Efficiency as the Last Mile Delivery Solution—The Results of the Research in Poland. Transp. Res. Procedia 2016, 12, 644–655. [Google Scholar] [CrossRef] [Green Version]
- AGCOM. Allegato B Alla Delibera n. 629/20/CONS Documento per La Consultazione Pubblica Sulle Misure per Incentivare l’utilizzo Degli Armadietti Automatici per La Consegna e La Raccolta Dei Pacchi. 2020. Available online: https://www.agcom.it/documents/10179/20765769/Allegato+14-12-2020+1607956363583/ce1cce68-7327-46dc-a2b1-c5f620a96e5c?version=1.0 (accessed on 1 December 2020).
- IPC. IPC Cross-Border e-Commerce Shopper Survey 2019. January 2020. No. 20. Available online: https://www.ipc.be/sector-data/e-commerce/cross-border-e-commerce-shopper-survey (accessed on 29 February 2020).
- Postnord. E-Commerce in Europe 2020. 2020. Available online: https://www.postnord.se/siteassets/pdf/rapporter/e-commerce-in-europe-2020.pdf (accessed on 29 February 2020).
- Zenezini, G.; Lagorio, A.; Pinto, R.; De Marco, A.; Golini, R. The Collection-And-Delivery Points Implementation Process from the Courier, Express and Parcel Operator’s Perspective. IFAC PapersOnLine 2018, 51, 594–599. [Google Scholar] [CrossRef]
- Altuntaş Vural, C.; Aktepe, Ç. Why Do Some Sustainable Urban Logistics Innovations Fail? The Case of Collection and Delivery Points. Res. Transp. Bus. Manag. 2021, 100690. [Google Scholar] [CrossRef]
- Morganti, E.; Dablanc, L.; Fortin, F. Final Deliveries for Online Shopping: The Deployment of Pickup Point Networks in Urban and Suburban Areas. Res. Transp. Bus. Manag. 2014, 11, 23–31. [Google Scholar] [CrossRef] [Green Version]
- Xiao, Z.; Wang, J.J.; Lenzer, J.; Sun, Y. Understanding the Diversity of Final Delivery Solutions for Online Retailing: A Case of Shenzhen, China. Transp. Res. Procedia 2017, 25, 985–998. [Google Scholar] [CrossRef]
- Liu, C.; Wang, Q.; Susilo, Y.O. Assessing the Impacts of Collection-Delivery Points to Individual’s Activity-Travel Patterns: A Greener Last Mile Alternative? Transp. Res. Part E Logist. Transp. Rev. 2019, 121, 84–99. [Google Scholar] [CrossRef]
- Giuffrida, M.; Mangiaracina, R.; Perego, A.; Tumino, A. Home Delivery vs Parcel Lockers: An Economic and Environmental Assessment. In Proceedings of the Summer School Francesco Turco, Naples, Italy, 13–15 September 2016; pp. 225–230. [Google Scholar]
- Refaningati, T.; Nahry; Tangkudung, E.S.W.; Kusuma, A. Analysis of Characteristics and Efficiency of Smart Locker System (Case Study: Jabodetabek). Evergreen 2020, 7, 111–117. [Google Scholar] [CrossRef]
- Bilik, J. Parcel Machines-Green Solution for Green Cities. In Proceedings of the 1st International Conference, Green Logistics for Greener Cities, Szczecin, Poland, 19–21 May 2014. [Google Scholar]
- McKinsey Company. An Integrated Perspective on the Future of Mobility, Part 2: Transforming Urban Delivery. September 2017. No. 48. Available online: https://www.mckinsey.com/~/media/McKinsey/Business%20Functions/Sustainability/Our%20Insights/Urban%20commercial%20transport%20and%20the%20future%20of%20mobility/An-integrated-perspective-on-the-future-of-mobility.pdf (accessed on 15 December 2020).
- World Economic Forum. The Future of the Last-Mile Ecosystem. Available online: http://www3.weforum.org/docs/WEF_Future_of_the_last_mile_ecosystem.pdf (accessed on 5 August 2020).
- Arnold, F.; Cardenas, I.; Sörensen, K.; Dewulf, W. Simulation of B2C E-Commerce Distribution in Antwerp Using Cargo Bikes and Delivery Points. Eur. Transp. Res. Rev. 2018, 10, 2. [Google Scholar] [CrossRef]
- Duin, V.; Arem, V.; Amstel, V.; Version, D.; Duin, V.; Arem, V.; Amstel, V. From Home Delivery to Parcel Lockers A Case Study in Amsterdam. Transp. Res. Procedia 2019, 46, 37–44. [Google Scholar] [CrossRef]
- Deutsch, Y.; Golany, B. A Parcel Locker Network as a Solution to the Logistics Last Mile Problem. Int. J. Prod. Res. 2018, 56, 251–261. [Google Scholar] [CrossRef]
- Alves, R.; da Lima, R.S.; de Sena, D.C.; de Pinho, A.F.; Holguín-Veras, J. Agent-Based Simulation Model for Evaluating Urban Freight Policy to e-Commerce. Sustainability 2019, 11, 4020. [Google Scholar] [CrossRef] [Green Version]
- Jiang, L.; Dhiaf, M.; Dong, J.; Liang, C.; Zhao, S. A Traveling Salesman Problem with Time Windows for the Last Mile Delivery in Online Shopping. Int. J. Prod. Res. 2020, 58, 5077–5088. [Google Scholar] [CrossRef]
- Gevaers, R.; Van de Voorde, E.; Vanelslander, T. Cost Modelling and Simulation of Last-Mile Characteristics in an Innovative B2C Supply Chain Environment with Implications on Urban Areas and Cities. Procedia Soc. Behav. Sci. 2014, 125, 398–411. [Google Scholar] [CrossRef] [Green Version]
- Pham, H.T.; Lee, H. Analyzing the Costs and Benefits of Installing Unmanned Parcel Lockers: Focusing on Residential Complexes in Korea. J. Int. Logist. Trade 2019, 17, 43–54. [Google Scholar] [CrossRef]
- Zurel, Ö.; Van Hoyweghen, L.; Braes, S.; Seghers, A. Parcel Lockers, an Answer to the Pressure on the Last Mile Delivery? New Bus. Regul. Strateg. Post. Sect. 2018, 299–312. [Google Scholar] [CrossRef]
- Moroz, M.; Polkowski, Z. The Last Mile Issue and Urban Logistics: Choosing Parcel Machines in the Context of the Ecological Attitudes of the Y Generation Consumers Purchasing Online. Transp. Res. Procedia 2016, 16, 378–393. [Google Scholar] [CrossRef] [Green Version]
- Xu, J.J.; Hong, L. Impact Factors of Choosing Willingness for Picking up Service. Res. J. Appl. Sci. Eng. Technol. 2013, 6, 2509–2513. [Google Scholar] [CrossRef]
- Kedia, A.; Kusumastuti, D.; Nicholson, A. Acceptability of Collection and Delivery Points from Consumers’ Perspective: A Qualitative Case Study of Christchurch City. Case Stud. Transp. Policy 2017, 5, 587–595. [Google Scholar] [CrossRef]
- Lagorio, A.; Pinto, R. The Parcel Locker Location Issues: An Overview of Factors Affecting Their Location. In Proceedings of the 8th International Conference on Information Systems, Logistics and Supply Chain: Interconnected Supply Chains in an Era of Innovation, ILS 2020, Austin, TX, USA, 6 June 2020; pp. 414–421. [Google Scholar]
- Zhou, M.; Zhao, L.; Kong, N.; Campy, K.S.; Xu, G.; Zhu, G.; Cao, X.; Wang, S. Understanding Consumers’ Behavior to Adopt Self-Service Parcel Services for Last-Mile Delivery. J. Retail. Consum. Serv. 2020, 52, 101911. [Google Scholar] [CrossRef]
- Chen, Y.; Yu, J.; Yang, S.; Wei, J. Consumer’s Intention to Use Self-Service Parcel Delivery Service in Online Retailing: An Empirical Study. Internet Res. 2018, 28, 500–519. [Google Scholar] [CrossRef]
- Yuen, K.F.; Wang, X.; Ng, L.T.W.; Wong, Y.D. An Investigation of Customers’ Intention to Use Self-Collection Services for Last-Mile Delivery. Transp. Policy 2018, 66, 1–8. [Google Scholar] [CrossRef]
- Yuen, K.F.; Wang, X.; Ma, F.; Wong, Y.D. The Determinants of Customers’ Intention to Use Smart Lockers for Last-Mile Deliveries. J. Retail. Consum. Serv. 2019, 49, 316–326. [Google Scholar] [CrossRef]
- Buldeo Rai, H.; Verlinde, S.; Macharis, C. Unlocking the Failed Delivery Problem? Opportunities and Challenges for Smart Locks from a Consumer Perspective. Res. Transp. Econ. 2021, 87, 100753. [Google Scholar] [CrossRef]
- Maltese, I.; Le Pira, M.; Marcucci, E.; Gatta, V.; Evangelinos, C. Grocery or @grocery: A Stated Preference Investigation in Rome and Milan. Res. Transp. Econ. 2021, 87, 101096. [Google Scholar] [CrossRef]
- de Magalhães, D.J.A.V. Analysis of Critical Factors Affecting the Final Decision-Making for Online Grocery Shopping. Res. Transp. Econ. 2021, 87, 101088. [Google Scholar] [CrossRef]
- Lachapelle, U.; Burke, M.; Brotherton, A.; Leung, A. Parcel Locker Systems in a Car Dominant City: Location, Characterisation and Potential Impacts on City Planning and Consumer Travel Access. J. Transp. Geogr. 2018, 71, 1–14. [Google Scholar] [CrossRef]
- Kanninen, B.J. Optimal Design for Multinomial Choice Experiments. J. Mark. Res. 2002, 39, 214–227. [Google Scholar] [CrossRef]
- McFadden, D. Conditional Logit Analysis of Qualitative Choice Behavior; Frontiers in Econometrics; Academic Press: Cambridge, MA, USA, 1973; pp. 907–914. [Google Scholar]
- Croissant, Y. Estimation of Multinomial Logit Models in R: The Mlogit Packages An Introductory Example. Data Manag. 2003, 73, 2–21. [Google Scholar]
- Gatta, V.; Marcucci, E.; Le Pira, M.; Scaccia, L.; Delle Site, P. Willingness to Pay Measures to Tailor Policies and Foster Stakeholder Acceptability in Urban Freight Transport. Sci. Reg. 2018, 17, 351–370. [Google Scholar]
- INRIX. 2018 Global Traffic Scorecard Report. February 2018. No. 19. Available online: https://static.poder360.com.br/2019/02/INRIX_2018_Global_Traffic_Scorecard_Report__final_.pdf (accessed on 29 February 2021).
- Wuppertal Institute; Greenpeace. Living Moving Breathing—Ranking of European Cities in Sustainable Transport. 2018, 1–106. Available online: https://www.greenpeace.de/sites/www.greenpeace.de/files/publications/living.moving.breathing.20180604.pdf (accessed on 5 August 2020).
- Idealo. E-Commerce in Italia: Identikit del Consumatore Digitale. Available online: https://www.idealo.it/magazine/ecommerce-italia-identikit-consumatore-digitale (accessed on 29 December 2020).
- Gatta, V.; Marcucci, E.; Scaccia, L. On Finite Sample Performance of Confidence Intervals Methods for Willingness to Pay Measures. Transp. Res. Part A Policy Pract. 2015, 82, 169–192. [Google Scholar] [CrossRef]
- Pacelli, V. E-Commerce e Distribuzione Urbana Delle Merci: Parcel Locker Come Soluzione Ultimo Miglio. 2018. Available online: http://www.trelab.it/wp-content/uploads/2019/04/DUM-e-E-commerce-Parcel-Locker-come-Soluzione-per-lUltimo-Miglio.pdf (accessed on 20 December 2020).
- Beckers, J.; Verhetsel, A. The Sustainability of the Urban Layer of E- Commerce Deliveries: The Belgian Collection and Delivery Point Networks. Eur. Plan. Stud. 2021, 1–20. [Google Scholar] [CrossRef]
- Comune di Roma. PUMS—Piano Urbano Della Mobilità Sostenibile. 2019, 2. Available online: https://romamobilita.it/sites/default/files/Pums_volume2.pdf (accessed on 29 May 2021).
- Polinori, P.; Marcucci, E.; Bollino, C.A.; Bigerna, S.; Gatta, V. Eco-Labeling and Sustainable Urban Freight Transport: How Much Are People Willing to Pay for Green Logistics? Int. J. Transp. Econ. 2018, 45, 631–658. [Google Scholar]
- Gatta, V.; Marcucci, E.; Nigro, M.; Serafini, S. Sustainable Urban Freight Transport Adopting Public Transport-Based Crowdshipping for B2C Deliveries. Eur. Transp. Res. Rev. 2019, 11, 13. [Google Scholar] [CrossRef] [Green Version]
Figure 1.
Base scenario–demand–incentive curve.

Figure 2.
Scenario I–base scenario with h24 accessibility.

Figure 3.
Scenario II–base scenario with 500-meter distance.

Figure 4.
Scenario III–base scenario with 500 m distance and h24 accessibility.


Table 1.
Example of a choice task (Source: own elaborations).
| Imagine Having Purchased Something Online and Choosing the Delivery Mode | Parcel Locker 1 | Parcel Locker 2 | Home Delivery |
|---|---|---|---|
| Accessibility | 8–18–5–7 | 8–18–5–7 | |
| Distance | 500 m | 1000 m | |
| Location | Shopping centre, supermarket | Gas station, metro station | |
| Green certification | No | Yes | |
| Typology | Assisted | Assisted | |
| Incentive | 0 € | 0 € | |
| What would you choose? |
Table 2.
MNL results summary.
| Parameters | Coefficient | Standard Error |
|---|---|---|
| INTERCEPT | ||
| Intercept [PL2] | −0.101529 | 0.179811 |
| Intercept [HD] | 0.435139 ** | 0.207196 |
| PL ATTRIBUTES | ||
| Assistance | −0.051814 | 0.070845 |
| Incentive | 0.281412 *** | 0.050476 |
| Green certification | 0.211605 *** | 0.075649 |
| Location (public transport) | −0.074414 | 0.055975 |
| Location (shops) | 0.043570 | 0.055311 |
| Distance 500 m | 0.689798 *** | 0.063932 |
| Distance 1500 m | −0.501715 *** | 0.074986 |
| Accessibility | 0.462071 *** | 0.082752 |
| INDIVIDUAL AND BEHAVIOURAL CHARACTERISTICS | ||
| Previous use of collection points [PL2] | −0.012961 | 0.272678 |
| Previous use of PLs [PL2] | −0.090487 | 0.267397 |
| Presence of someone at home to collect a parcel [PL2] | 0.071480 | 0.179545 |
| Level of education [PL2] | 0.042427 | 0.145687 |
| Previous use of collection points [HD] | −1.279940 *** | 0.450587 |
| Previous use of PLs [HD] | −1.069055** | 0.418009 |
| Presence of someone at home to collect a parcel [HD] | 0.794460 *** | 0.192009 |
| Level of education [HD] | −0.585778 *** | 0.141255 |
| Pseudo r2 | 0.131 |
Significant 90% (*), Significant 95% (**), significant 99% (***).
Table 3.
Marginal willingness to pay.
| Variables | Coefficients |
|---|---|
| Distance from 1000 to 500 m | 3.11 *** |
| Accessibility h24 | 1.64 *** |
| Distance from 1500 to 1000 m | 1.11 *** |
| Green certification | 0.75 ** |
Significant 90% (*), Significant 95% (**), significant 99% (***).
Publisher’s Note: MDPI stays neutral with regard to jurisdictional claims in published maps and institutional affiliations. |
© 2021 by the authors. Licensee MDPI, Basel, Switzerland. This article is an open access article distributed under the terms and conditions of the Creative Commons Attribution (CC BY) license (https://creativecommons.org/licenses/by/4.0/).
Share and Cite
MDPI and ACS Style
Iannaccone, G.; Marcucci, E.; Gatta, V. What Young E-Consumers Want? Forecasting Parcel Lockers Choice in Rome. Logistics 2021, 5, 57. https://0-doi-org.brum.beds.ac.uk/10.3390/logistics5030057
AMA Style
Iannaccone G, Marcucci E, Gatta V. What Young E-Consumers Want? Forecasting Parcel Lockers Choice in Rome. Logistics. 2021; 5(3):57. https://0-doi-org.brum.beds.ac.uk/10.3390/logistics5030057
Chicago/Turabian StyleIannaccone, Gabriele, Edoardo Marcucci, and Valerio Gatta. 2021. "What Young E-Consumers Want? Forecasting Parcel Lockers Choice in Rome" Logistics 5, no. 3: 57. https://0-doi-org.brum.beds.ac.uk/10.3390/logistics5030057