1. Introduction
The ability to integrate production and distribution to maximize profit can be done by optimizing production planning and distribution planning decisions. According to Ganji, Kazemipoor, Molana, and Sajadi [
1], production-distribution integration can achieve significant profitability and a total cost reduction of 3 to 20 percent. A similar opinion was conveyed by Noroozi et al. (2018) in that the integration of production-distribution in the supply chain can maximize total profits. This is in line with the study of Aazami and Saidi-Mehrabad [
2], which uses distribution-production integration planning to maximize profits. On the other hand, integrating production and distribution is a significant problem in the supply chain network [
3]. This means that the decision to integrate production and distribution is very relevant because they are interrelated [
4] and need to be handled together in an integrated manner [
5]. However, research into distribution-production in the food supply chain has become complicated in the last few decades due to globalization and the many interactions throughout the food system [
6]. This triggers undesirable factors and food safety behaviors that could lead to global food poisoning disasters [
7]. According to Feng [
8], a systems approach is needed to ensure food safety and quality, namely a traceability system. Several studies have reported that traceability is believed to trace and identify the source of various quality problems [
9]. The same opinion was expressed by Sun and Wang [
10], who stated that a traceability system is a powerful solution to overcome food safety problems. In addition, the traceability system can help minimize the production and distribution of unsafe or low-quality products [
11]. For this reason, products with the best quality and safe for consumption are given more attention [
12]. Moreover, food products must maintain and guarantee food safety and production process history [
13].
The traceability system in the production-distribution process is fundamental because every actor in the chain has a responsibility to ensure food safety and quality through handling, manufacturing, packaging, and transporting products [
14]. Several studies have examined this, such as Agustin, Mawengkang, and Mathelinea [
15], who created a production-integration model in the marine product processing industry by considering the traceability system. Similarly, Yeh, Liu, Chen, Yang, and Liang [
16] used a traceability system to keep fish products fresh and safe in the production-distribution process. Likewise, Chen, Chiu, Chen, Kao, and Chang [
17] built a traceability information system for coordination and quality control of production, distribution, and consumption. However, to achieve profitability, companies need to integrate production-distribution by considering traceability, but it is essential to control carbon emissions [
18]. This is because some carbon emissions from the entire process will come at a cost [
19]. This is in line with the opinion of Aktas and Temis [
20] that the production and distribution of products cause about 45% of carbon emissions. In this regard, carbon emissions have become increasingly prominent [
21], and companies need to pay attention to it [
22].
In recent years, reducing carbon emissions in the food supply chain has become an increasingly important issue [
23] and has received attention [
18]. This is because the production-distribution problem that involves multiple stages with multiple processes can produce significant carbon emissions [
24]. The production of carbon emissions from production and distribution activities is expected to increase by up to thirty percent by 2050 [
25]. In line with these conditions, Yang, Liu, Su, and Jing [
26] and Manupati et al. [
23]; accordingly stated that in 2020 various countries had committed and made unique plans to reduce carbon emissions. Meanwhile, the latest information on carbon emissions is still limited [
23,
27], and the amount of research is still lacking [
22]. However, several researchers examining production-distribution integration considering carbon emissions, such as Palacio et al. [
19] conducted a production-distribution integration study that minimized total network costs and minimized total carbon emissions (including total carbon emissions from facilities and transportation). Meanwhile, Moon et al. [
24] designed a production-distribution system and tested the effect of carbon emission limits. Likewise, Aktas and Temis [
20] modeled multi-product and multi-stage distribution-production networks and the value of the resulting carbon emissions. Other carbon emission research has focused more on supply chain sustainability [
18,
21,
22]. This is because carbon emissions can affect a company’s performance in a sustainable supply chain [
28], which can reduce overall emissions [
23]. In particular, reducing carbon emissions could slow global climate change [
29].
Global climate change is related to the role of humans in protecting and maintaining environmental ecosystems. Carbon dioxide (CO
2) emissions are one of the GHG emissions resulting from the burning of fossil fuels [
30]. The higher the carbon content in the fossil fuel or the lower combustion efficiency, the larger the carbon emissions. Currently, climate change is becoming more and more worrying, so governments and businesses are increasingly pressing to minimize carbon emissions. According to Sureeyatanapas et al. [
29], they state that reducing carbon emissions can slow global climate change. In addition, the carbon emission index is widely used as an indicator of corporate sustainability assessment and reporting. This is because the assessment and evaluation of carbon emissions can provide an opportunity to develop supply chain sustainability [
31]. Therefore, sustainability is of considerable concern for companies. Moreover, the company that considers applying the principle of sustainability can create a competitive advantage [
32] and control carbon emissions [
18].
According to Sarkar et al. [
18], every supply chain management strategy is fundamental to reduce carbon emissions and improve quality. One way to guarantee food quality and safety is by implementing a traceability system [
14,
33,
34]. Gallo, Accorsi, Goh, Hsiao, and Manzini [
35] applied a traceability system along the supply chain to reduce carbon emissions from distribution to ensure product safety. Meanwhile, the relationship between traceability systems and carbon emissions was revealed by Muirhead and Porte [
36]. They found that carbon emissions are one such case that can be reduced using a traceability system. Similar research conducted by Parashar et al. [
25] identified the main supporting factors that affect the food supply chain and carbon emissions, one of the prominent supporters of the food supply chain, namely traceability. However, various traceability and carbon emission studies on production and transportation activities in the food supply chain have not been sufficiently explored. Current research tends only to consider carbon emissions, ignoring traceability, and vice versa. Meanwhile, study of traceability and carbon emissions has examined traceability as a tool to resolve the impact of carbon emission problems. Thus, there has been no research involving distribution and production activities taking account of traceability and carbon emissions simultaneously.
Some research on production-distribution integration models has considered traceability and carbon emissions studied. However, there is no research involving both production-distributions by simultaneously considering traceability and carbon emissions. Therefore, this study developed a production-distribution integration decision model by considering traceability and carbon emission in canned fish foods. The mathematical model developed in this study uses a mixed-integer linear programming (MILP) approach. The mixed-integer linear programming (MILP) method is believed to optimize mathematically [
37]. Several studies, such as Agustin et al. [
15], have made MILP models in production-distribution integration by considering traceability. In addition, Bilgen and Çelebi [
38] presented the MILP model in solving production scheduling and distribution planning problems in a multi-product yogurt production line. Moreover, Jolayemi and Olorunniwo [
39] formulated a two-stage supply chain model in determining the optimal number of products produced in each factory to be then distributed to each distribution center. Thus, this study used the MILP model simultaneously by considering traceability and carbon emissions as a differentiator from other MILP models.
This study aimed to develop a production and distribution integration model by considering traceability and carbon emissions to minimize total costs. The total costs include production, raw material purchasing, transportation, regular labor, raw material inventory, finished product inventory, distribution-inventory, production carbon emissions, shipping carbon emissions, and traceability costs. The structure of the rest of this paper comprises six sections.
Section 1 (introduction) discusses the study’s background and identifies the gap between previous studies and the research statement.
Section 2 discusses the related studies that contributed to developing the model and approach. Subsequently, the next section develops the research model, followed by
Section 4, which presents canned fish food data.
Section 5 discusses the results and discussion. This is followed by the final section, which is the conclusion.
4. Canned Fish Food Data
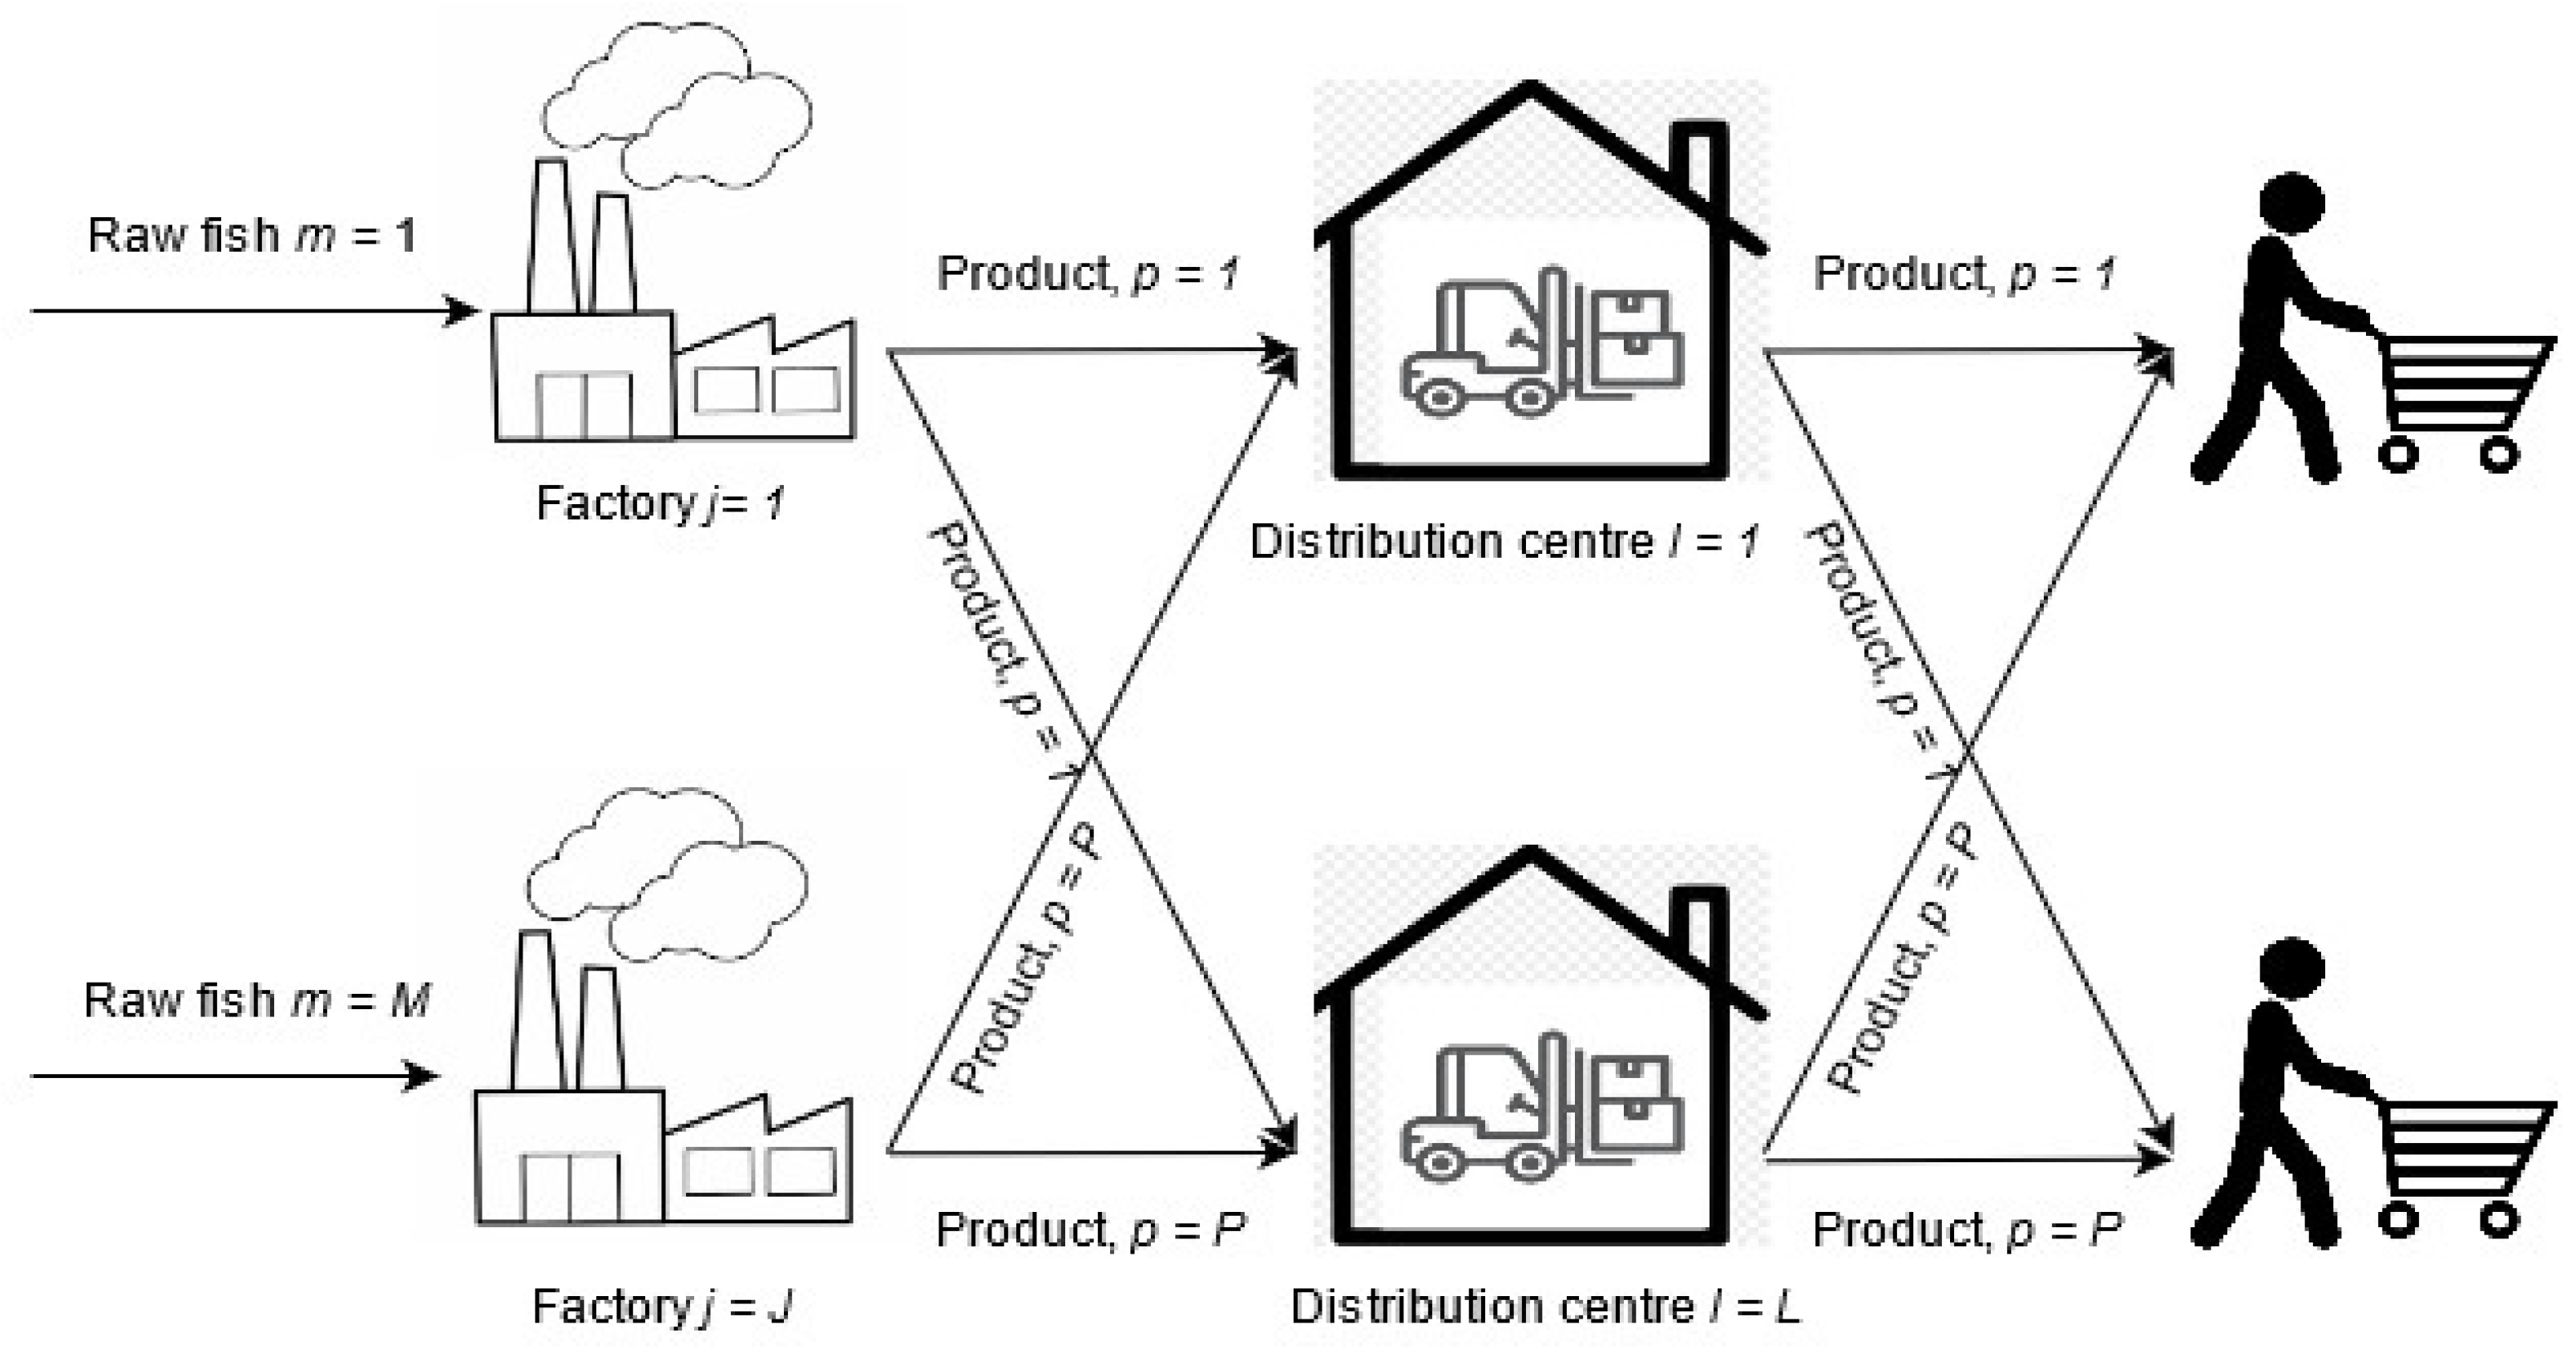
This research was conducted in the seafood processing industry from January to February 2021. The system’s flow starts from the historical data on demand from end customers to distributors, where distributors recap demand data and make demand forecasts. The results of demand forecasting are used as a reference for carrying out the production process. Carbon emissions will be produced during the production processes. Then after the production process is carried out, the product will be sent to the distributor center. Then the product will be sent to the retailer. The process of shipping will produce carbon emissions.
In the case study, two fish canning factories are operating, namely
j1 and
j2. These two factories produce two types of canned fish products,
p1 and
p2, with the need for raw materials,
m1 and
m2, in the
t1 period with the demand as shown in
Table 3.
In the case study, the company operates two types of fish cannery, namely
j1 and
j2 which will produce two types of canned fish products,
p1 and
p2 with the need for raw material types,
m1 and
m2 in the
t1 period with a consecutive amount of 45,000 kg, 45,000 kg, 45,000 kg, 35,000 kg, 45,000 kg, 45,000 kg, 30,000 kg, 35,000 kg and for the
t2 period, with consecutive amounts of 35,000 kg, 30,000 kg, 45,000, 35,000 kg, 45,000 kg, 45,000 kg, 30,000 kg, 35,000 kg. The data on demand for
p1 and
p2 canned fish products for each distributor center,
l1, and
l2 in the
t1 period amounted to 3000 kg, 3000 kg, 3000 kg, and 3000 kg respectively, while in the
t2 period, with a successive demand of 8000 kg, 8000 kg, 8000 kg and 8000 kg. In addition to production and demand data, production costs for factories
j1 and
j2 producing canned fish products,
p1 and
p2 are shown in
Table 4.
Moreover, the cost of purchasing raw fish materials,
m1 and m
2 for each factory
j1 and
j2, namely in the
t1 period, respectively US
$150/kg, US
$250/kg, US
$175/kg, and US
$200/kg, while the cost of purchasing raw fish at
t2 periods are US
$150/kg, US
$250/kg, US
$175/kg, and US
$200/kg. The transportation costs from factories
j1 and
j2 to distribution centers
l1 and
l2 are also provided in sending canned fish products,
p1 and
p2, in the
t1 period can be seen in
Table 5.
In addition, the labor costs for factories j1 and j2 were also obtained, namely US$40/person. It is also known that the data on the cost of raw fish stock, m1 and m2 stored at factories j1 and j2 for each period t1 are US$2/kg, US$1.5/kg, US$1/kg, and US$2/kg. Meanwhile, in period t2 it is US$2/kg, US$1.5/kg, US$1/kg, and US$3/kg. The inventory costs for canned fish products, p1 and p2 stored in factories j1 and j2 for each period t1 are US$2/kg, US$3.2/kg, US$2.2/kg, and US$2.5/kg while in period t2 they are US$2.5/kg, US$4/kg, US$3.2/kg, and US$3.6/kg. Then, the inventory costs for canned fish products, p1 and p2 stored at each distributor center l1 and l2 for each period t1 are US$14.6/kg, US$14.4/kg, US$14.5/kg, and US$14.8/kg, while in the period t2 is $ 14.7/kg, US$14.5/kg, US$14.3/kg and US$14.2/kg.
Another data collection is carbon emission data. Carbon emission data is divided into two, namely production carbon emission and distribution carbon emission data. The following is the production carbon emission data for factory
j1 and
j2 to produce canned fish products,
p1 and
p2 in the period
t1 are shown in
Table 6.
Meanwhile, transportation carbon emission data that sends canned fish products, p1 and p2 to distributor centers l1 and l2 in the t1 period are US$2/kg-CO2, US$2/kg-CO2, US$1/kg-CO2, and US$1.8/kg-CO2 and in period t2 are US$2.2/kg-CO2, US$2/kg-CO2, US$1/kg-CO2, and US$1.8/kg-CO2. Then carbon emission data is also divided into two parts: production carbon emission data and transportation carbon emission data. The following is the production carbon emission data for plants j1 and j2 to produce canned fish products, p1 and p2 period t1, namely US$1.5/kg-CO2, US$1.4/kg-CO2, US$1.4/kg-CO2, and US$1.5/kg-CO2 and in period t2 are US$1.5/kg-CO2, US$1.4/kg-CO2, US$1.4/kg-CO2, and US$1.5/kg-CO2. Meanwhile, the production carbon emissions data in the t1 and t2 periods were 0.05 kg-CO2/kg for all j1 and j2 factories and produced all canned fish products, p1 and p2. Carbon emission of distribution in period t1 and t2 are 0.005 kg-CO2/kg for all shipments to distributor centers l1 and l2 for canned fish products, p1 and p2. In addition, it is also known that the carbon emission threshold value (E), which is 15,000 kg-CO2 for all activities, both production, and transportation, is also known for the availability of 250 workers.
5. Results and Discussion
From the calculation with the Solver software, the total cost is US
$252,361,498.
Table 7 shows the entire cost component with the amount that forms the total cost. From these components, it can be seen that the cost of storing raw fish materials and the cost of storing canned fish products at the factory is US
$0, which means that there is no inventory of these two types of materials and products in the factory. The highest cost composition is the purchase cost component, which is 48.23%.
Table 7 also concludes that the cost of carbon emissions is minimal, at 0.01%. This is because the cost of carbon emissions for each product is lower than the component cost of purchasing raw materials.
The optimal results on the amount of raw fish supply, the amount of production, the number of products sent to distributors, the number of workers, the number of carbon emissions can be seen in
Table 8,
Table 9,
Table 10,
Table 11,
Table 12 and
Table 13 and
Figure 2,
Figure 3,
Figure 4,
Figure 5 and
Figure 6.
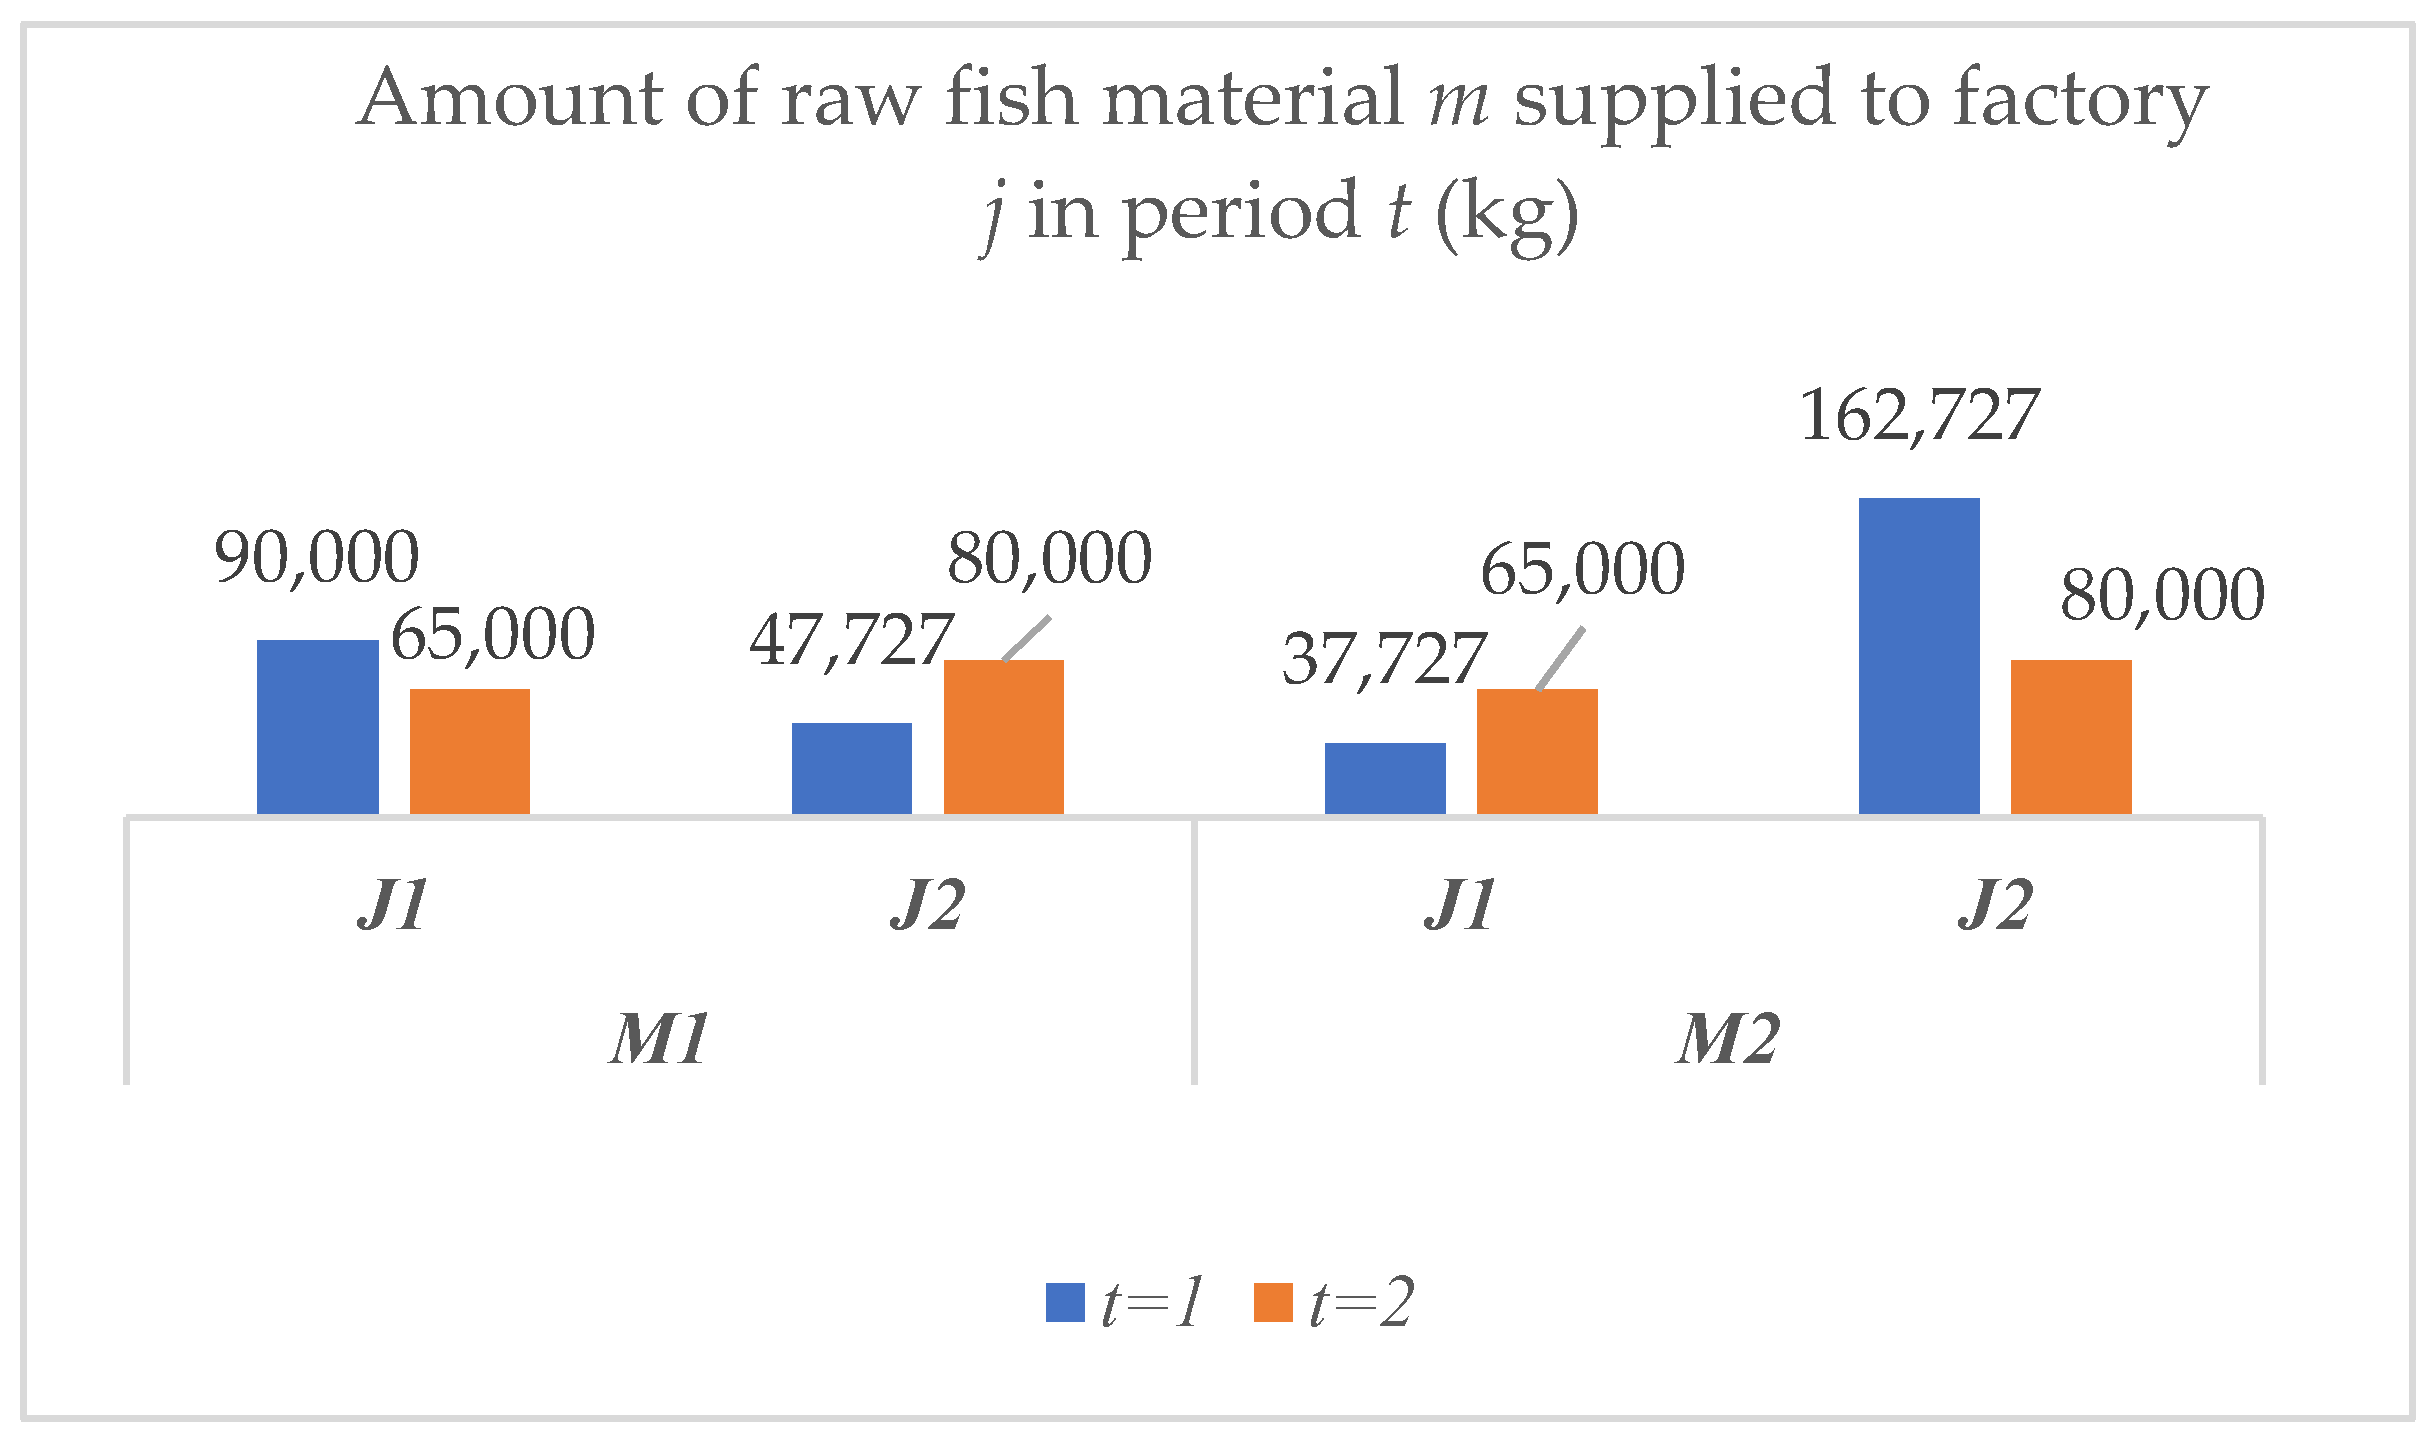
The amount of raw fish material (
m) supplied to factory (
j) in period
(t) can be seen in
Figure 2. It shows that the supply of the second type of raw fish material (
m2) reaches the most significant number for the second factory (
J2) in the first period (
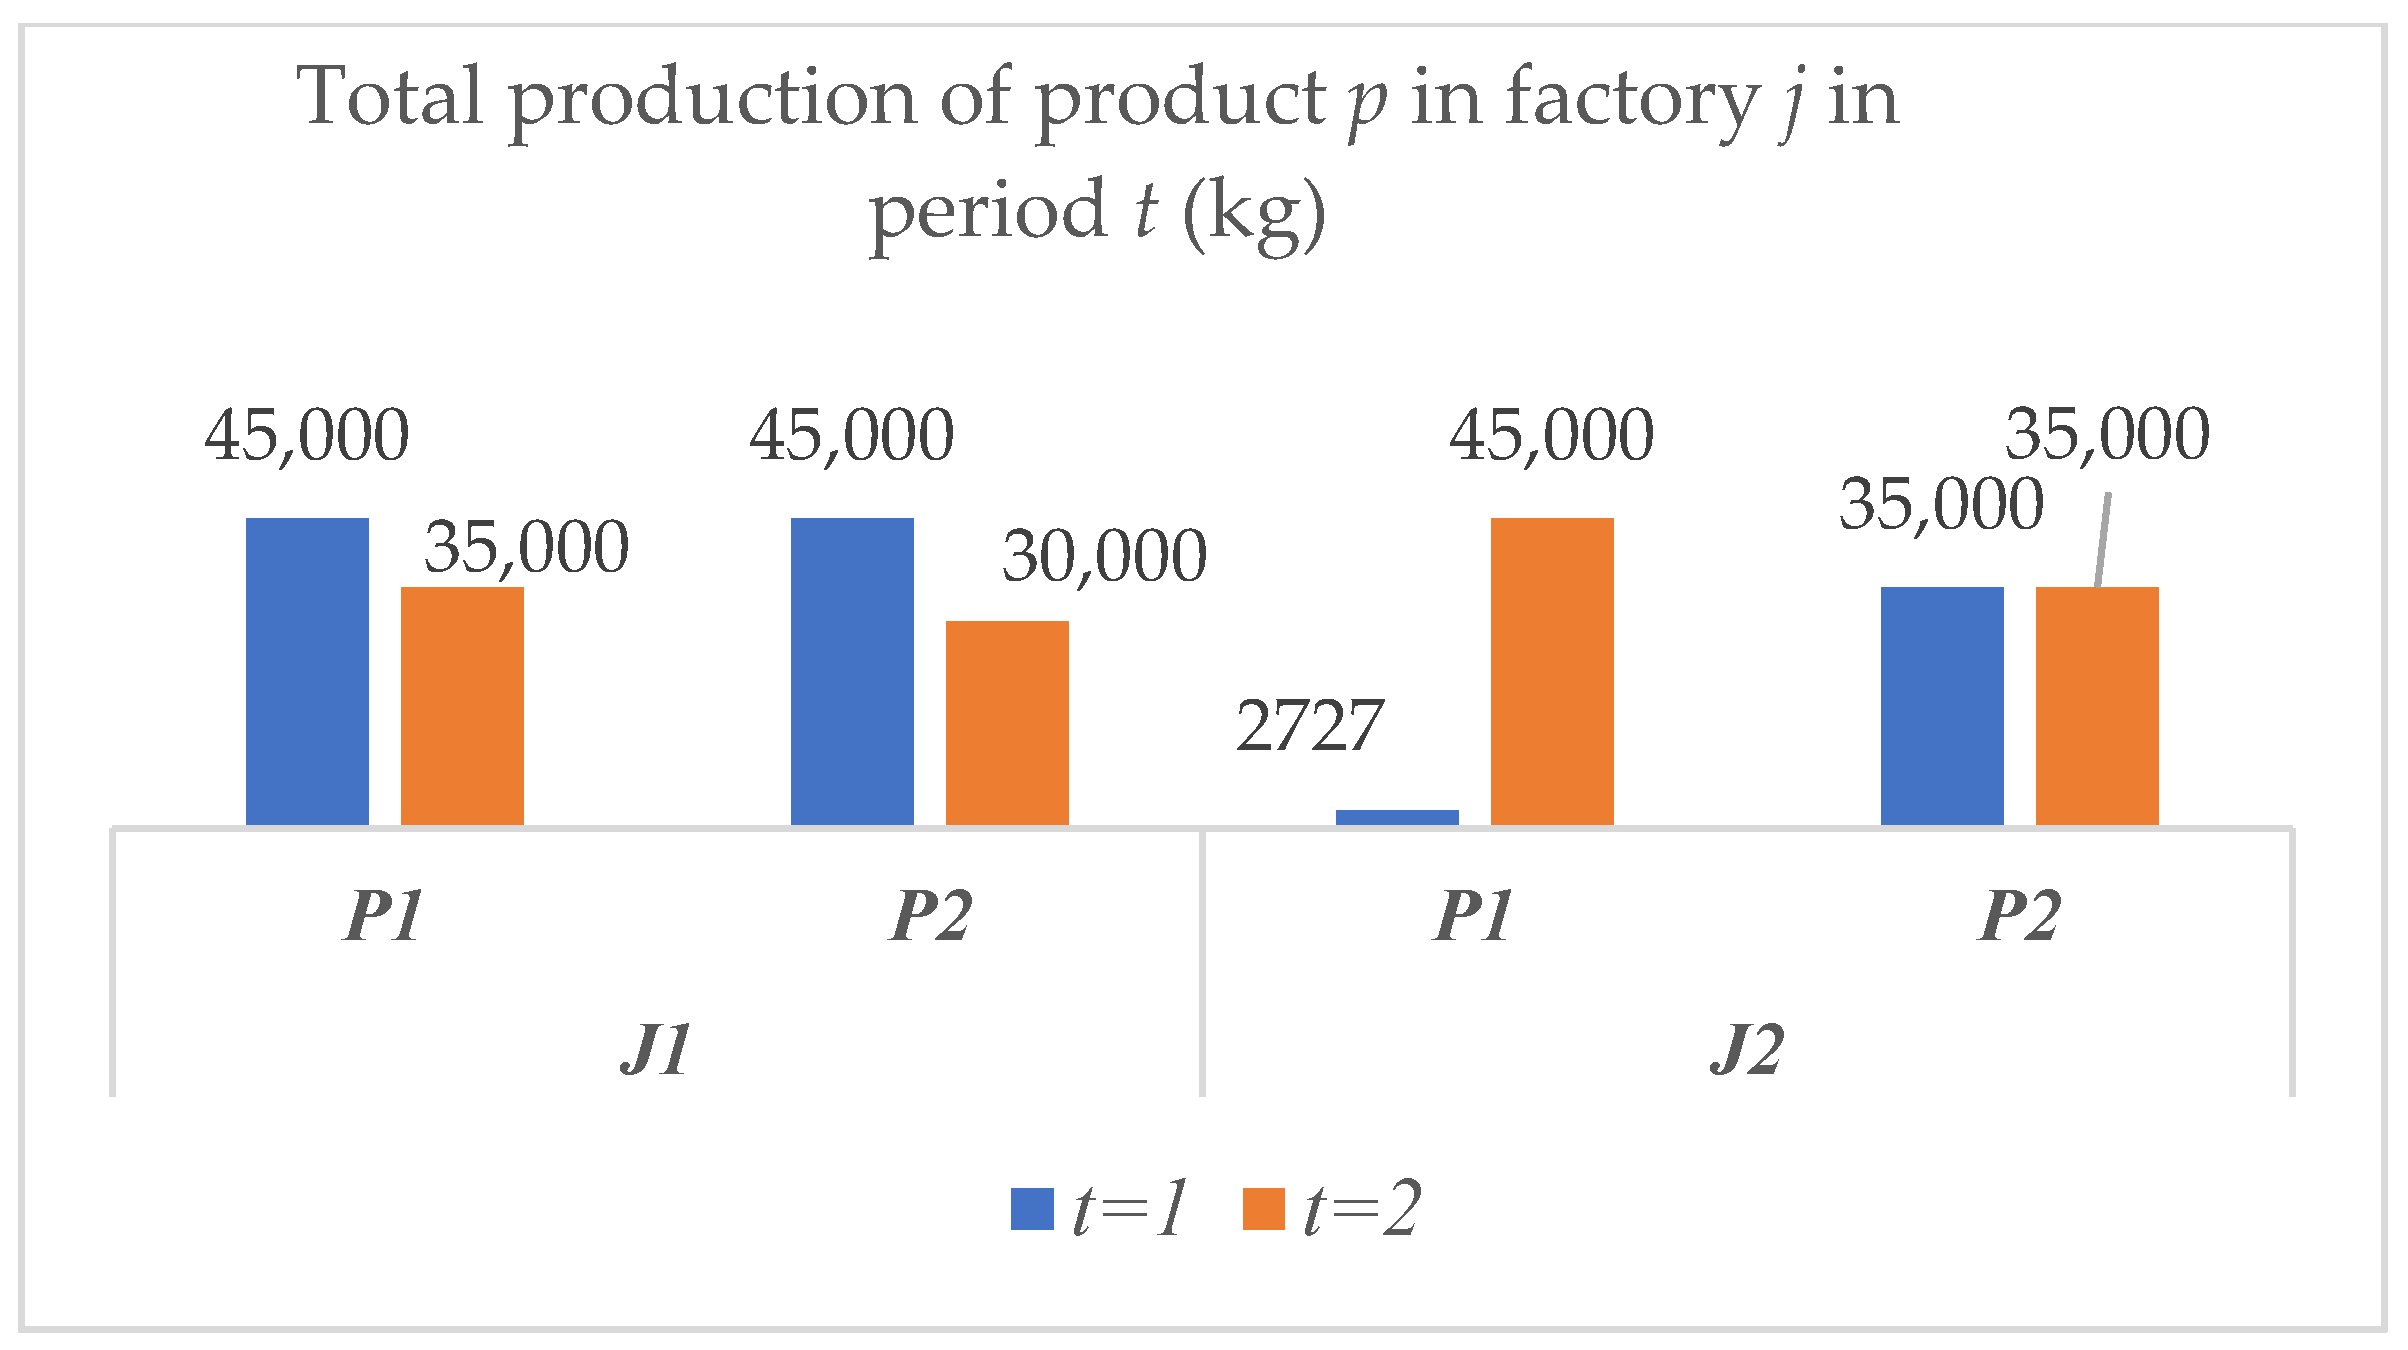
t1). Moreover, the second product type (
P2) is the most produced by the factories compared to other product types (see
Figure 3).
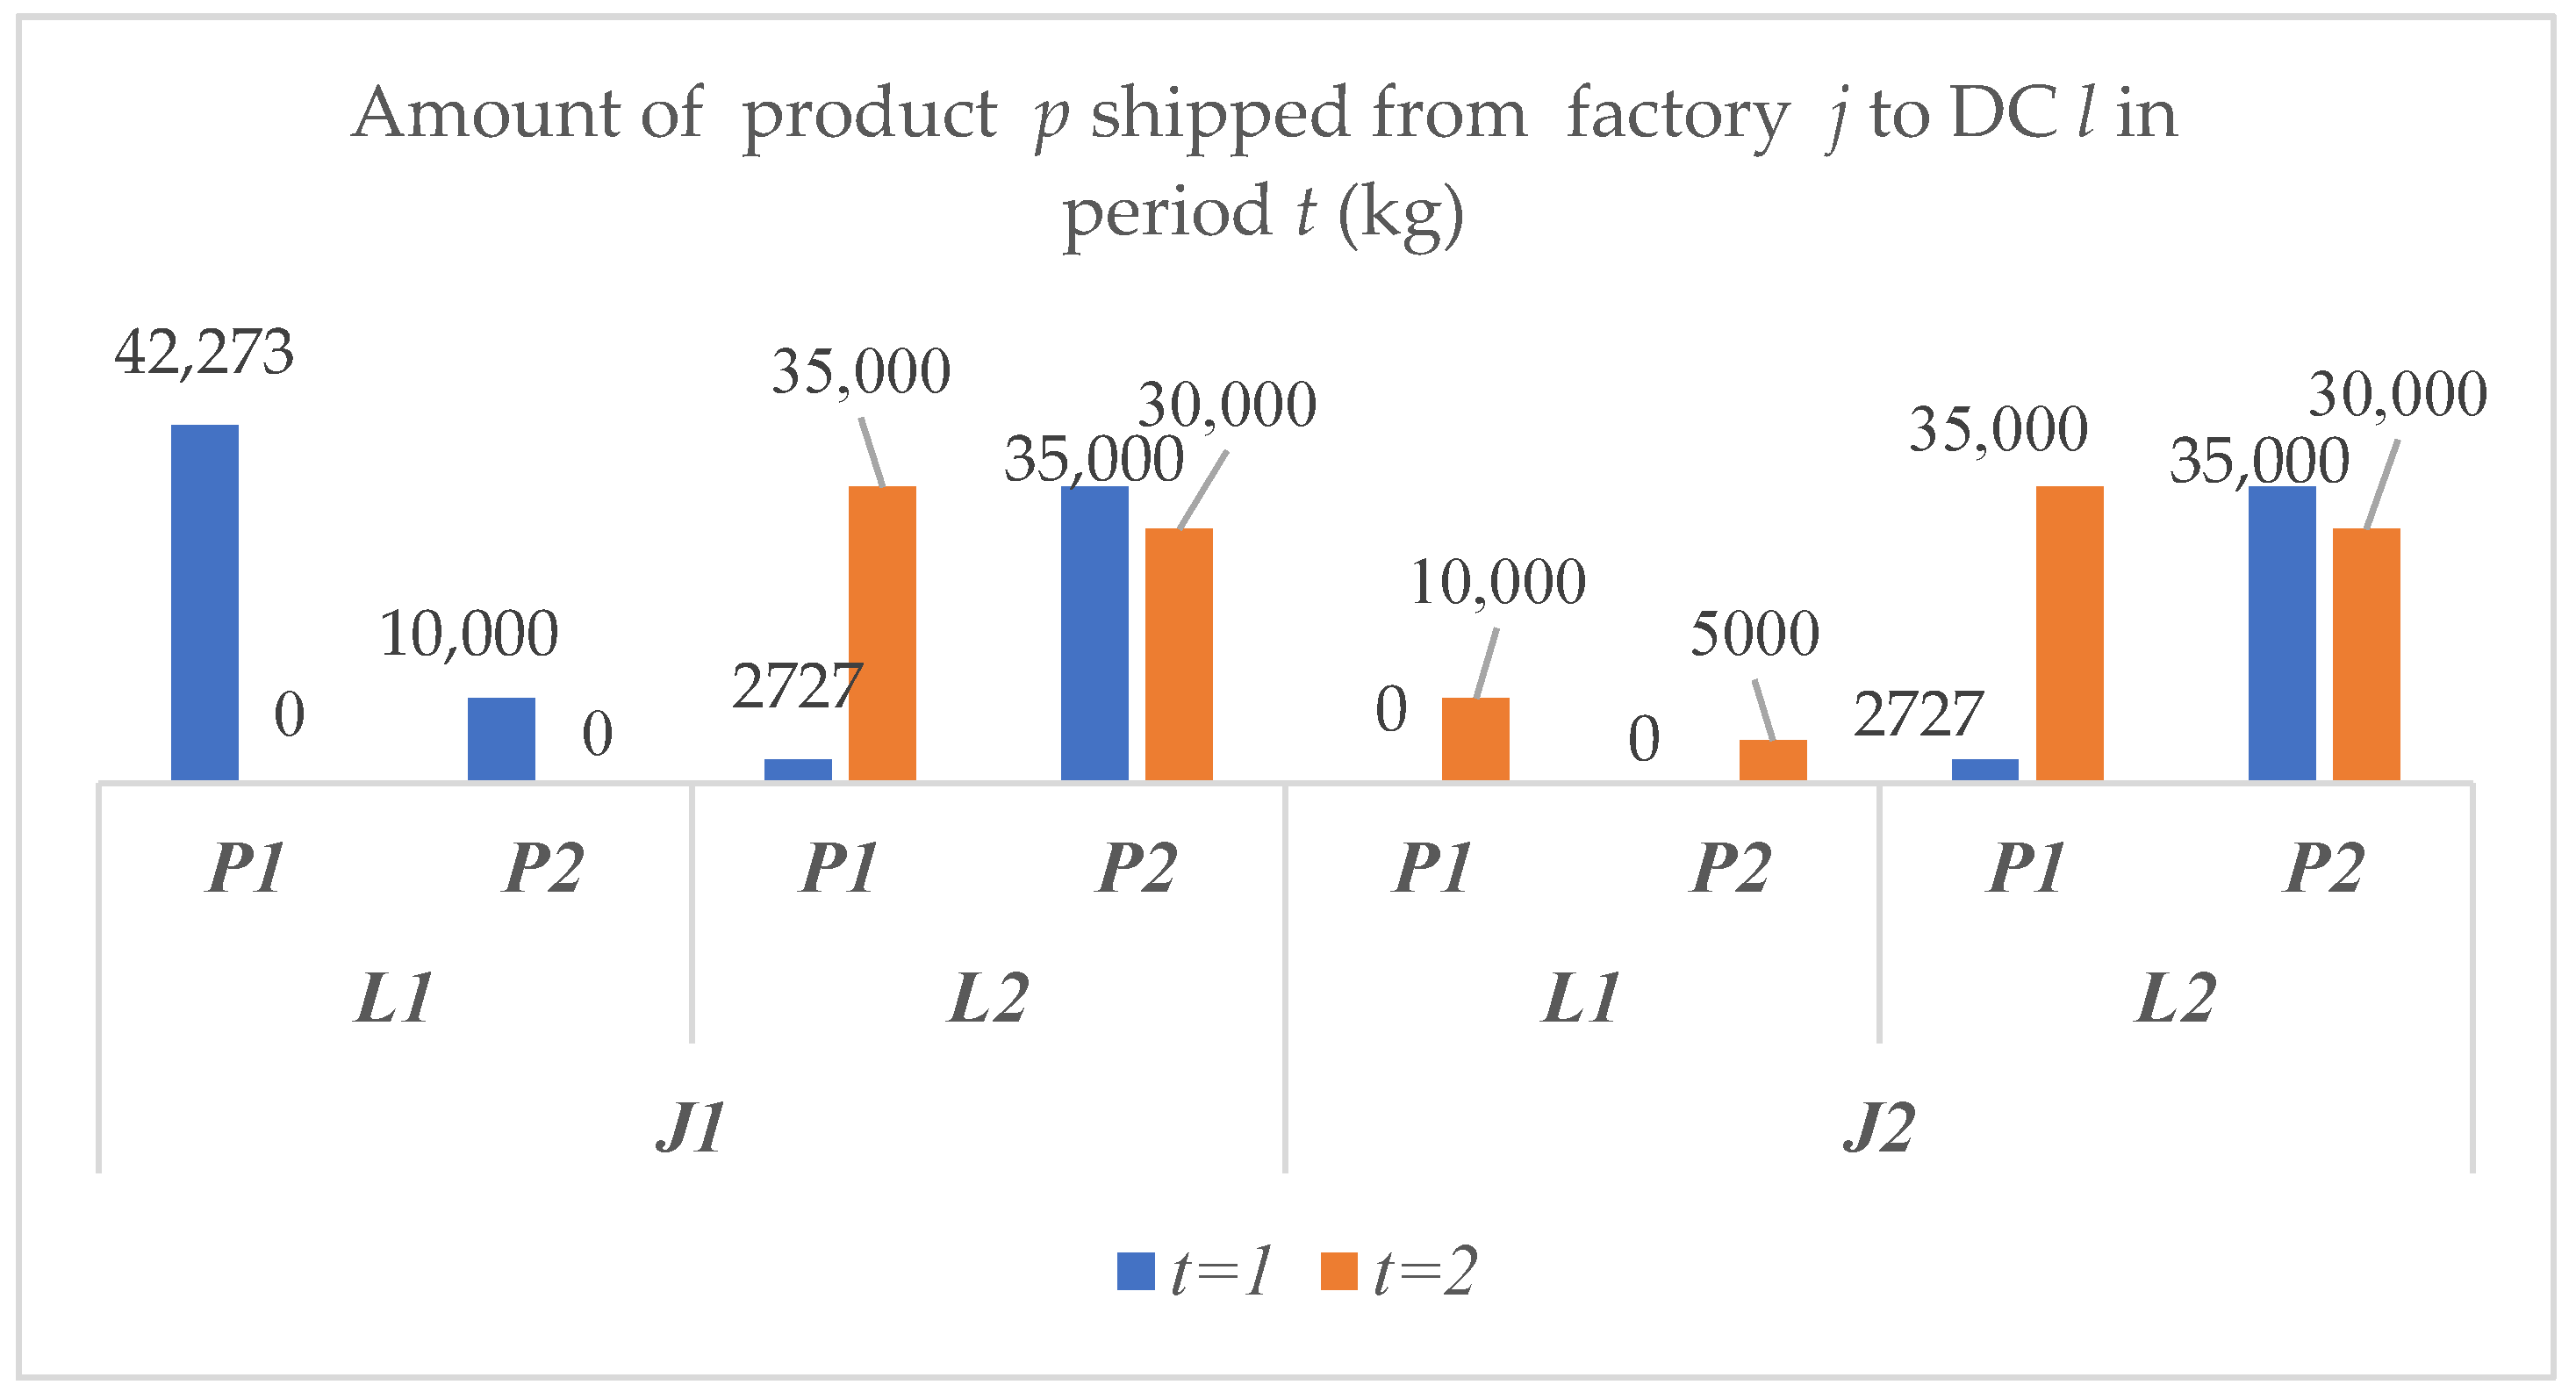
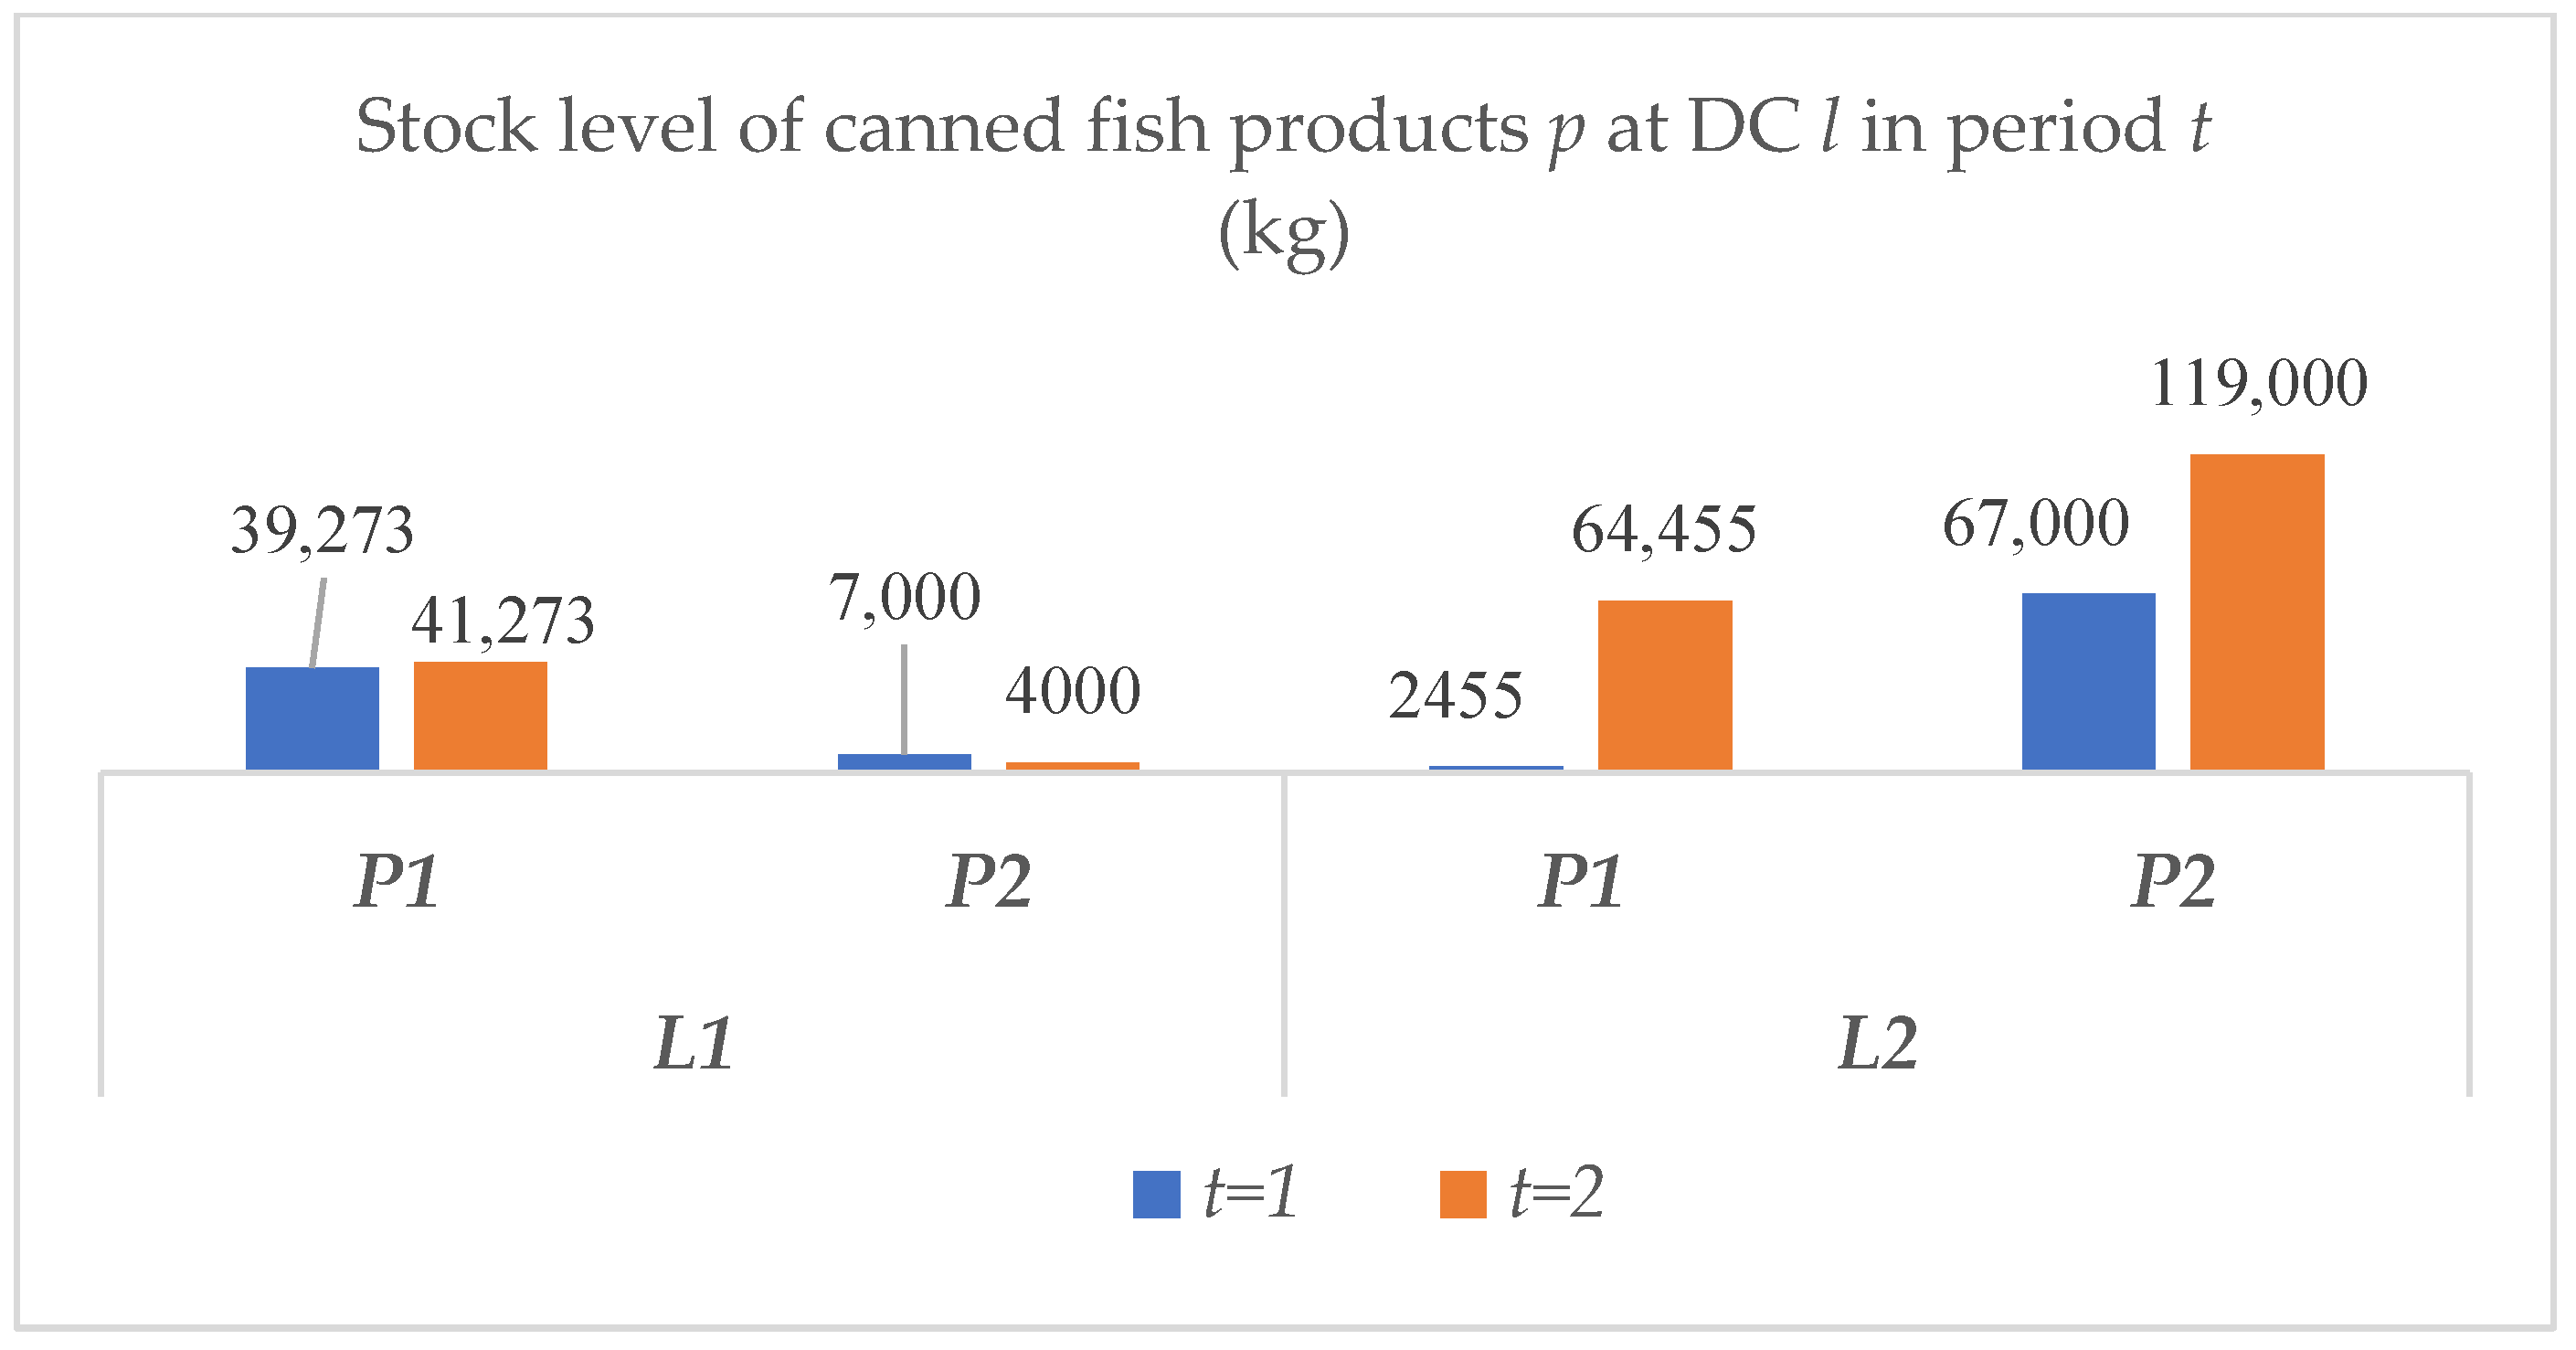
In the perspective of distribution, the results indicate that the first factory (
j1) delivered a higher number of both products to distribution center 1 (
l1) in the first period (
t1) (see
Figure 4). Meanwhile,
Figure 5 shows that the stock level for product 2 (
p2) in distribution center 2 (
l2) is higher than product 1 in distribution center 1 (
l1).
This study resulted in total carbon emission in the production process being greater than the total distribution of carbon emissions. The amount of carbon emission generated in distribution activities is 1364 kg-CO
2 (9.04%). At the same time, the amount of carbon emission in the production process is 13,636 kg-CO
2 (90.91%). This is in line with the opinion of Wang, Zhang, Hou, and Yao [
67], which states that carbon emissions generated in distribution are significantly lower. In contrast to Aktas and Temis [
20], carbon emissions resulting from production and distribution activities are 45%. According to (Parashar et al. [
25], food-related products are likely to cause emissions during production and distribution. The same result was conveyed by Phatak [
68] in his research which states that carbon emissions occur in various stages of food processing that involve machines in the production system [
69]. In addition, according to Aktas and Temis [
20] and Saga, Jauhari, Laksono, and Dwicahyani [
70], the increase in the number of products causes a significantly greater amount of production, which can trigger large carbon emissions. This statement is supported by the facts shown in
Table 7 and
Table 10. The increased production rates affect the cost of carbon emissions [
71], but the number of goods sent will affect the distribution of carbon emissions [
72]. This can be seen in
Table 8, representing the number of products sent from the factory to the distributor center. Meanwhile,
Table 11 amounts to the total distribution of carbon emissions from the factory to the distributor center. Thus, an increase in the amount of production will significantly affect the cost of carbon emissions.
Table 1 shows the cost of production level carbon emissions of 0.01% of the total cost with distribution costs of 0.00%. This means that the costs incurred for production of carbon emissions are US
$19,841 of the total cost of US
$252,361,498. Meanwhile, the cost of distribution carbon emissions was US
$1984, which is 10% of the cost of producing carbon emissions. Unit distribution of carbon emission costs is obtained for each item shipped from the manufacturing unit to the distribution center. In addition, the costs considered in the study, apart from the cost of carbon emissions, were traceability costs of US
$490,727 or 0.19%, being much higher than the cost of carbon emissions (US
$19,841). The traceability cost is influenced by the number of products multiplied by the traceability costs. Traceability costs include tracing costs that include food movement through certain production, processing, and distribution stages. In this case, the definition of traceability is the actions of tracking and following food raw materials and products through the stages of production, inventory, and distribution. The definition of traceability in this study follows the principles of the traceability system of Ramesh & Jarke [
73]. They believed that a successful traceability system is a combination of planning stages, determining when-how-where-why each traceability link is created.
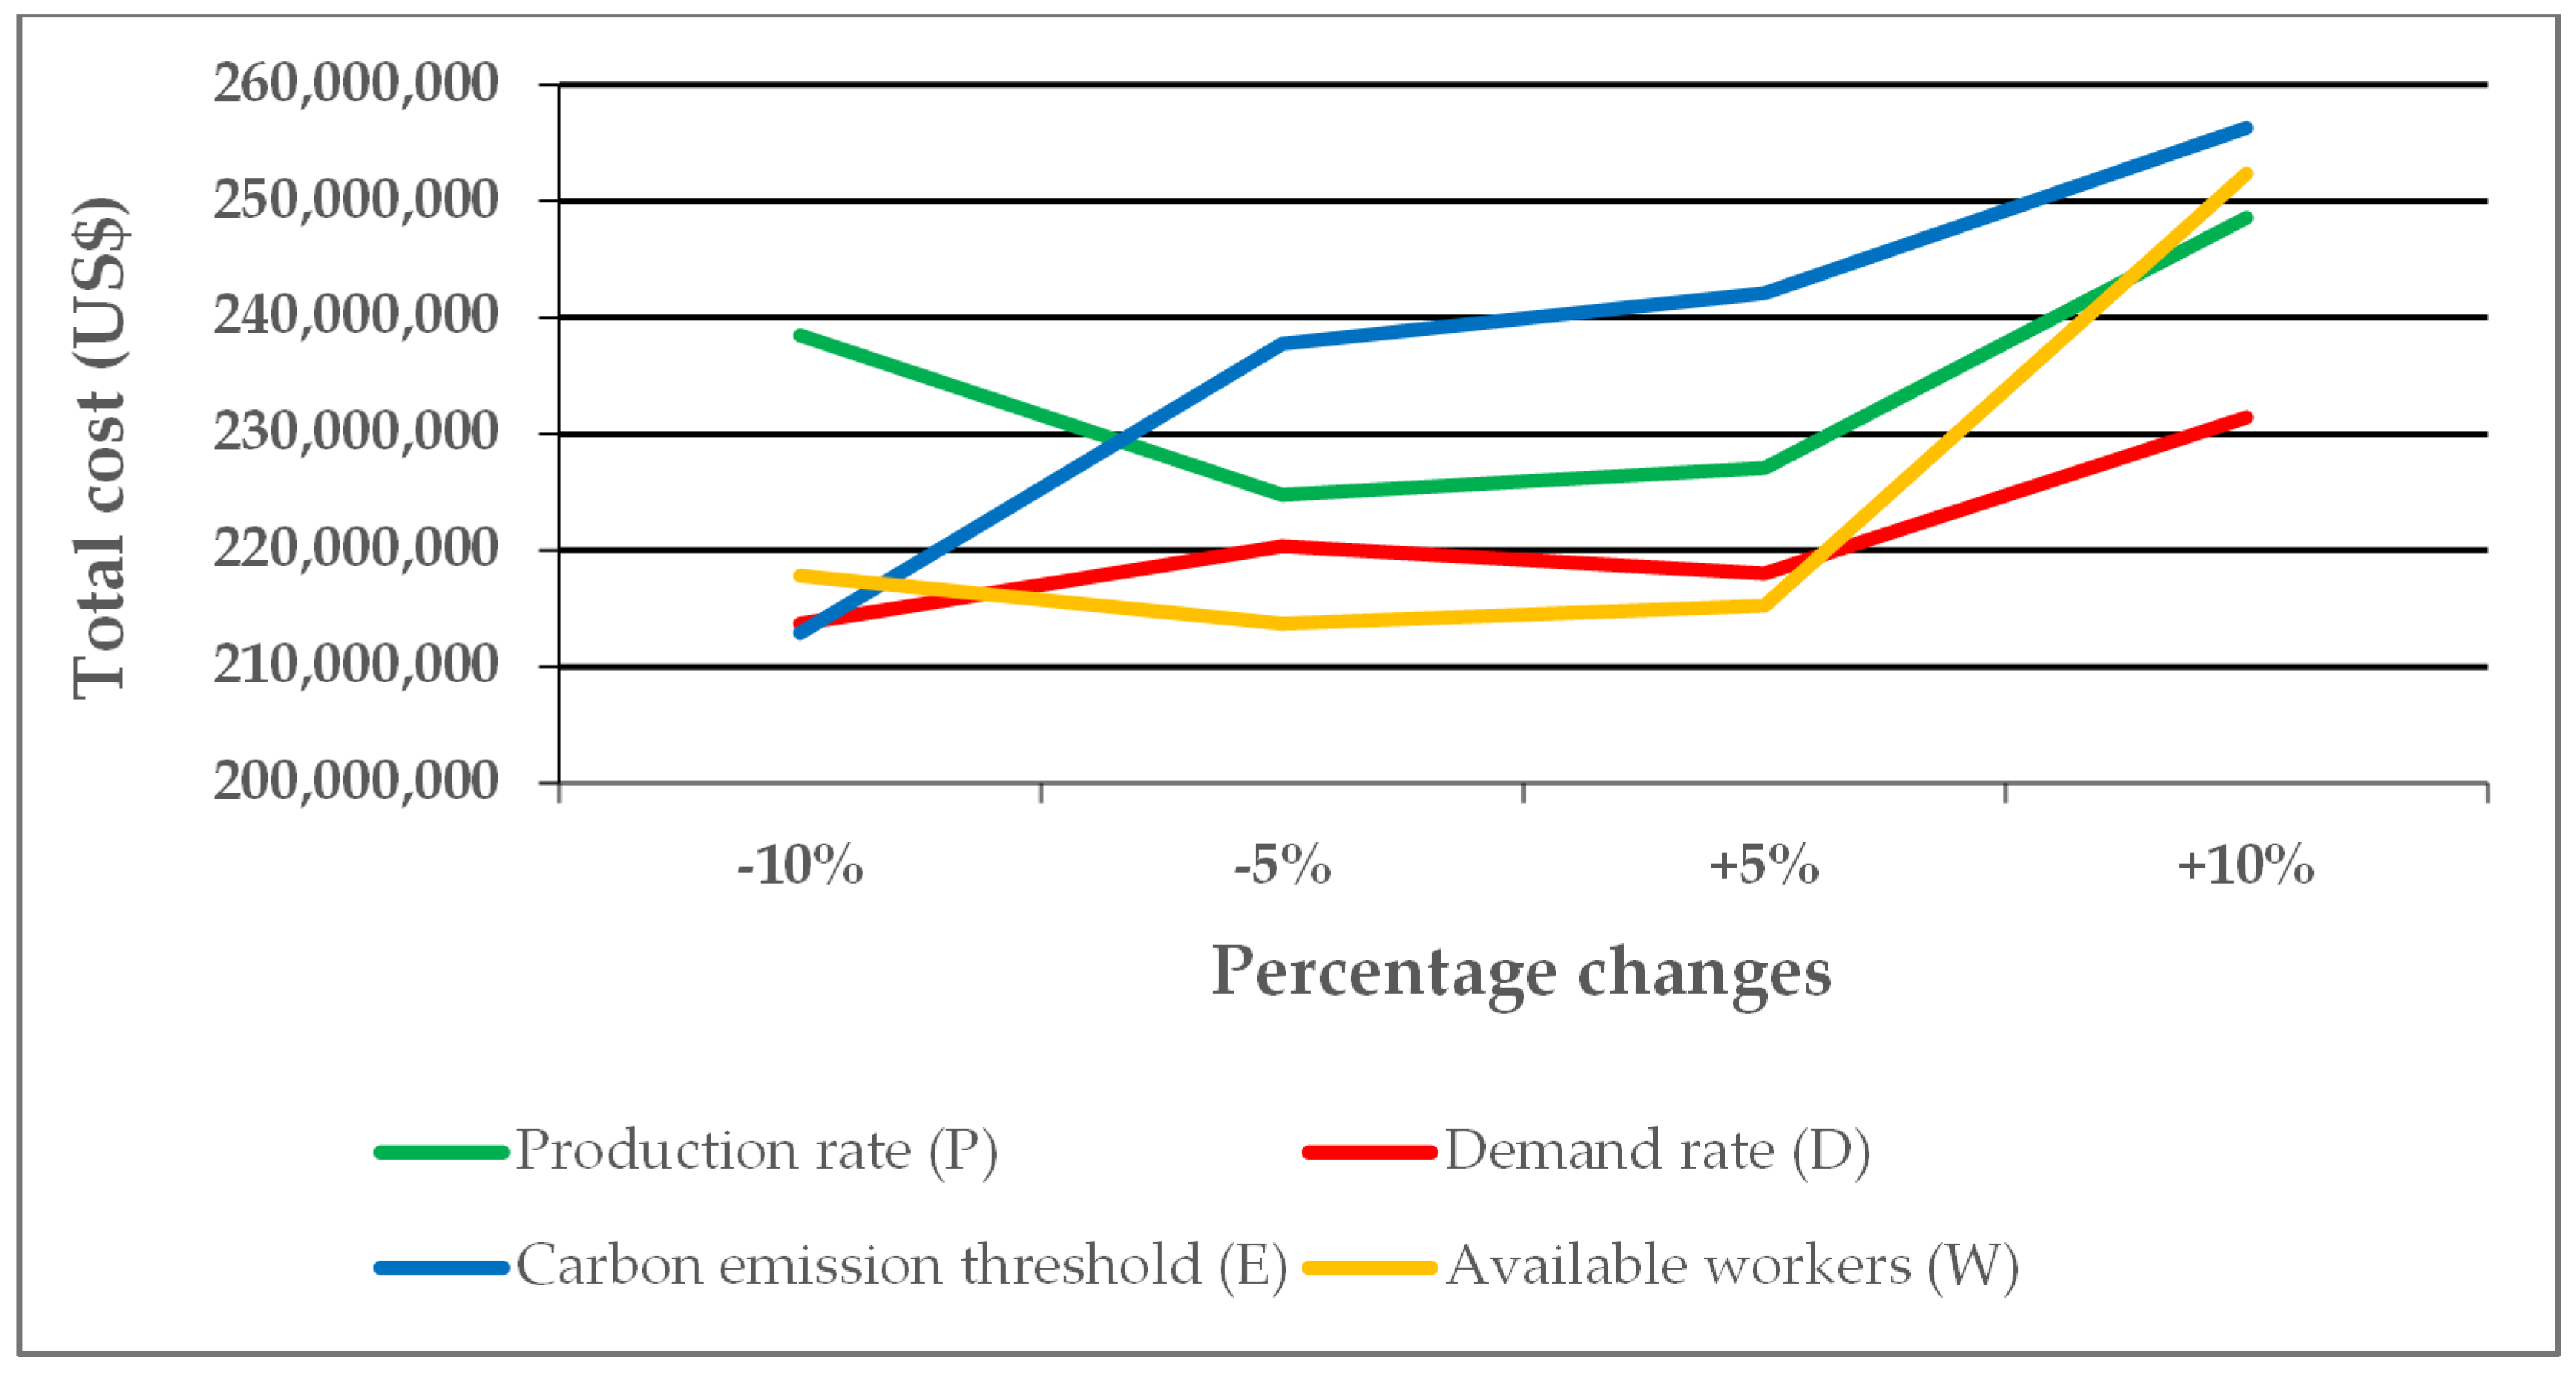
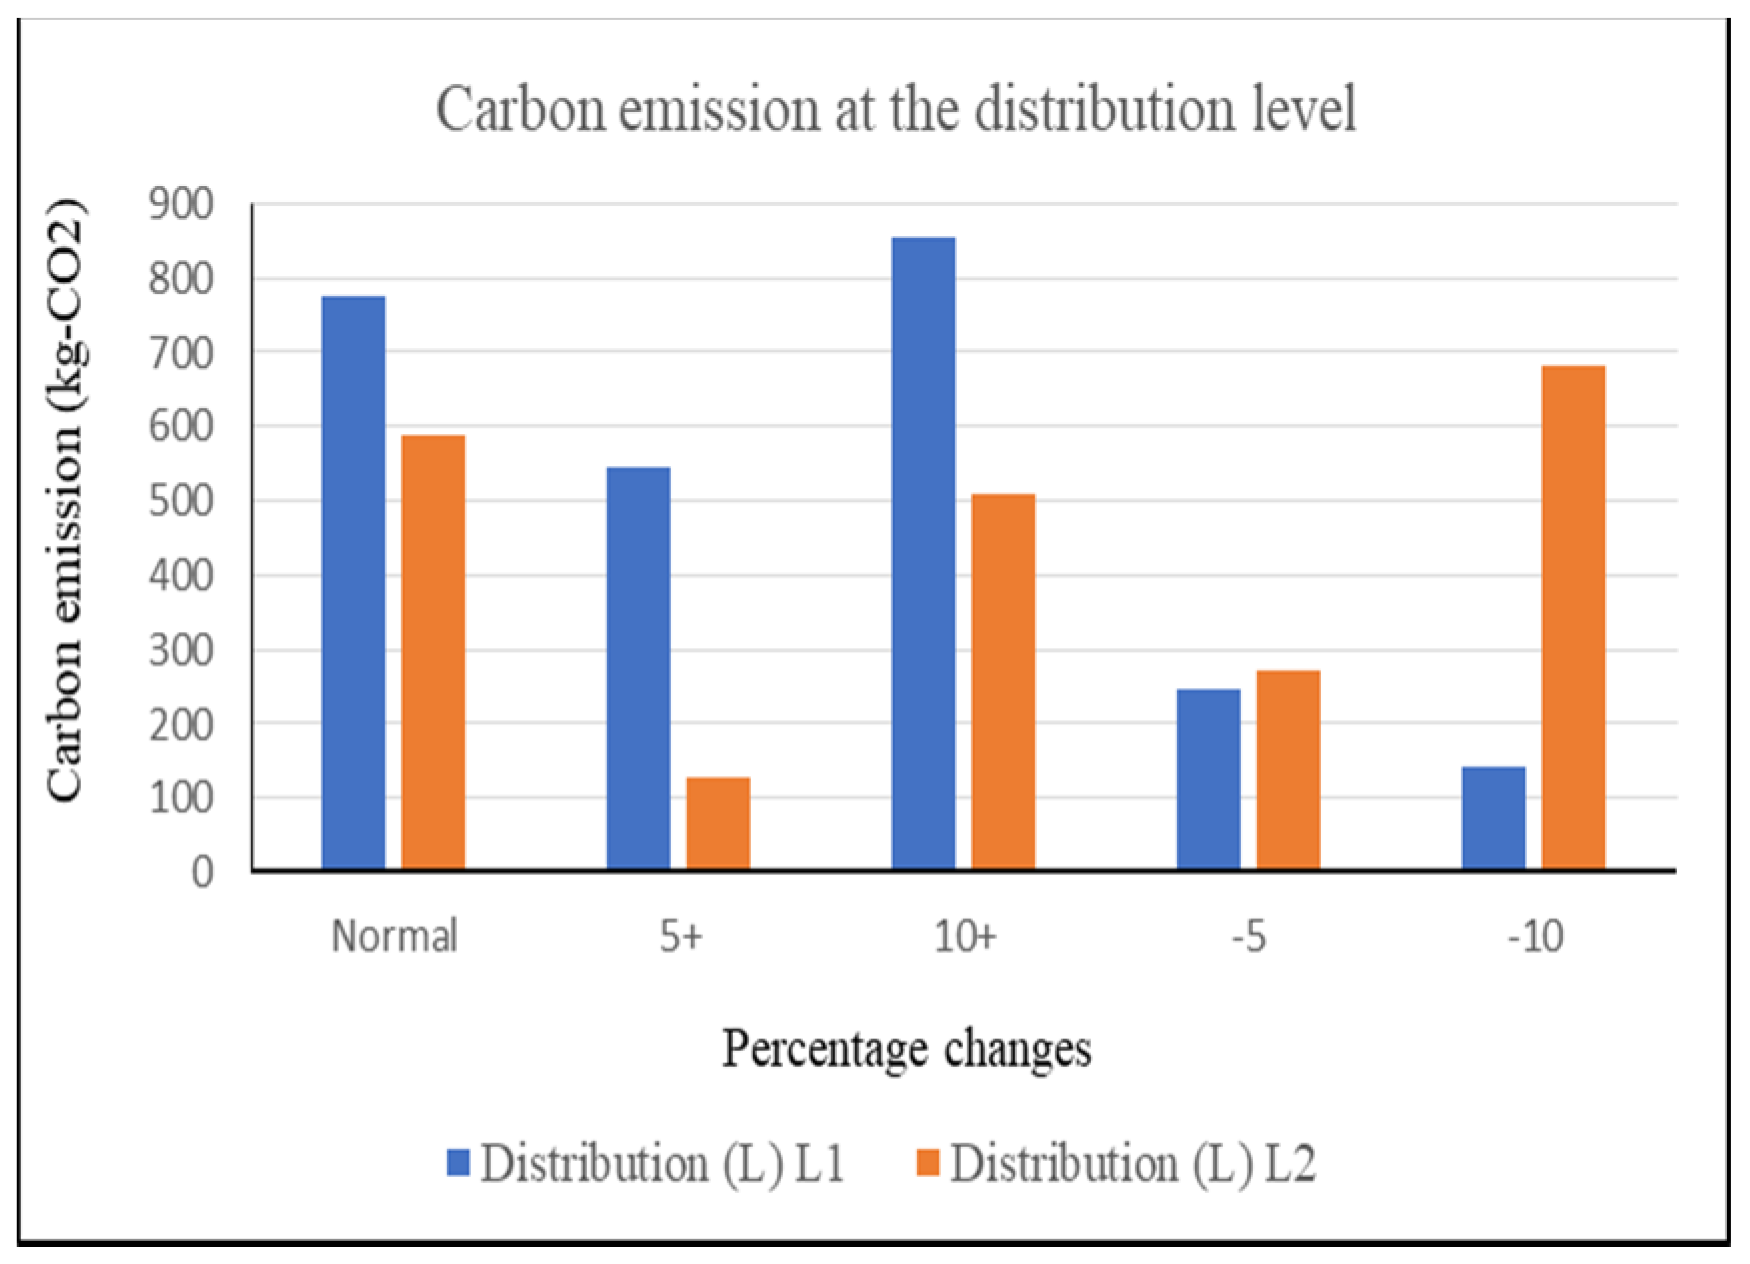
5.1. Sensitivity Analysis
Sensitivity analysis was carried out to test the robustness of the proposed model’s results, meaning that a sensitivity analysis of several parameters carries out the model testing. The parameters carried out by the sensitivity analysis are the level of production from the factory, the level of demand, the carbon emission threshold value, and the available workers. This analysis was carried out by looking at how much influence a parameter changes the outcome of the decision. The rate of change in sensitivity was −10%, −5%, + 5%, and + 10%. The results of the sensitivity analysis are shown in
Table 13 and
Figure 6. In
Table 14, the cost saving is calculated using the following formula:
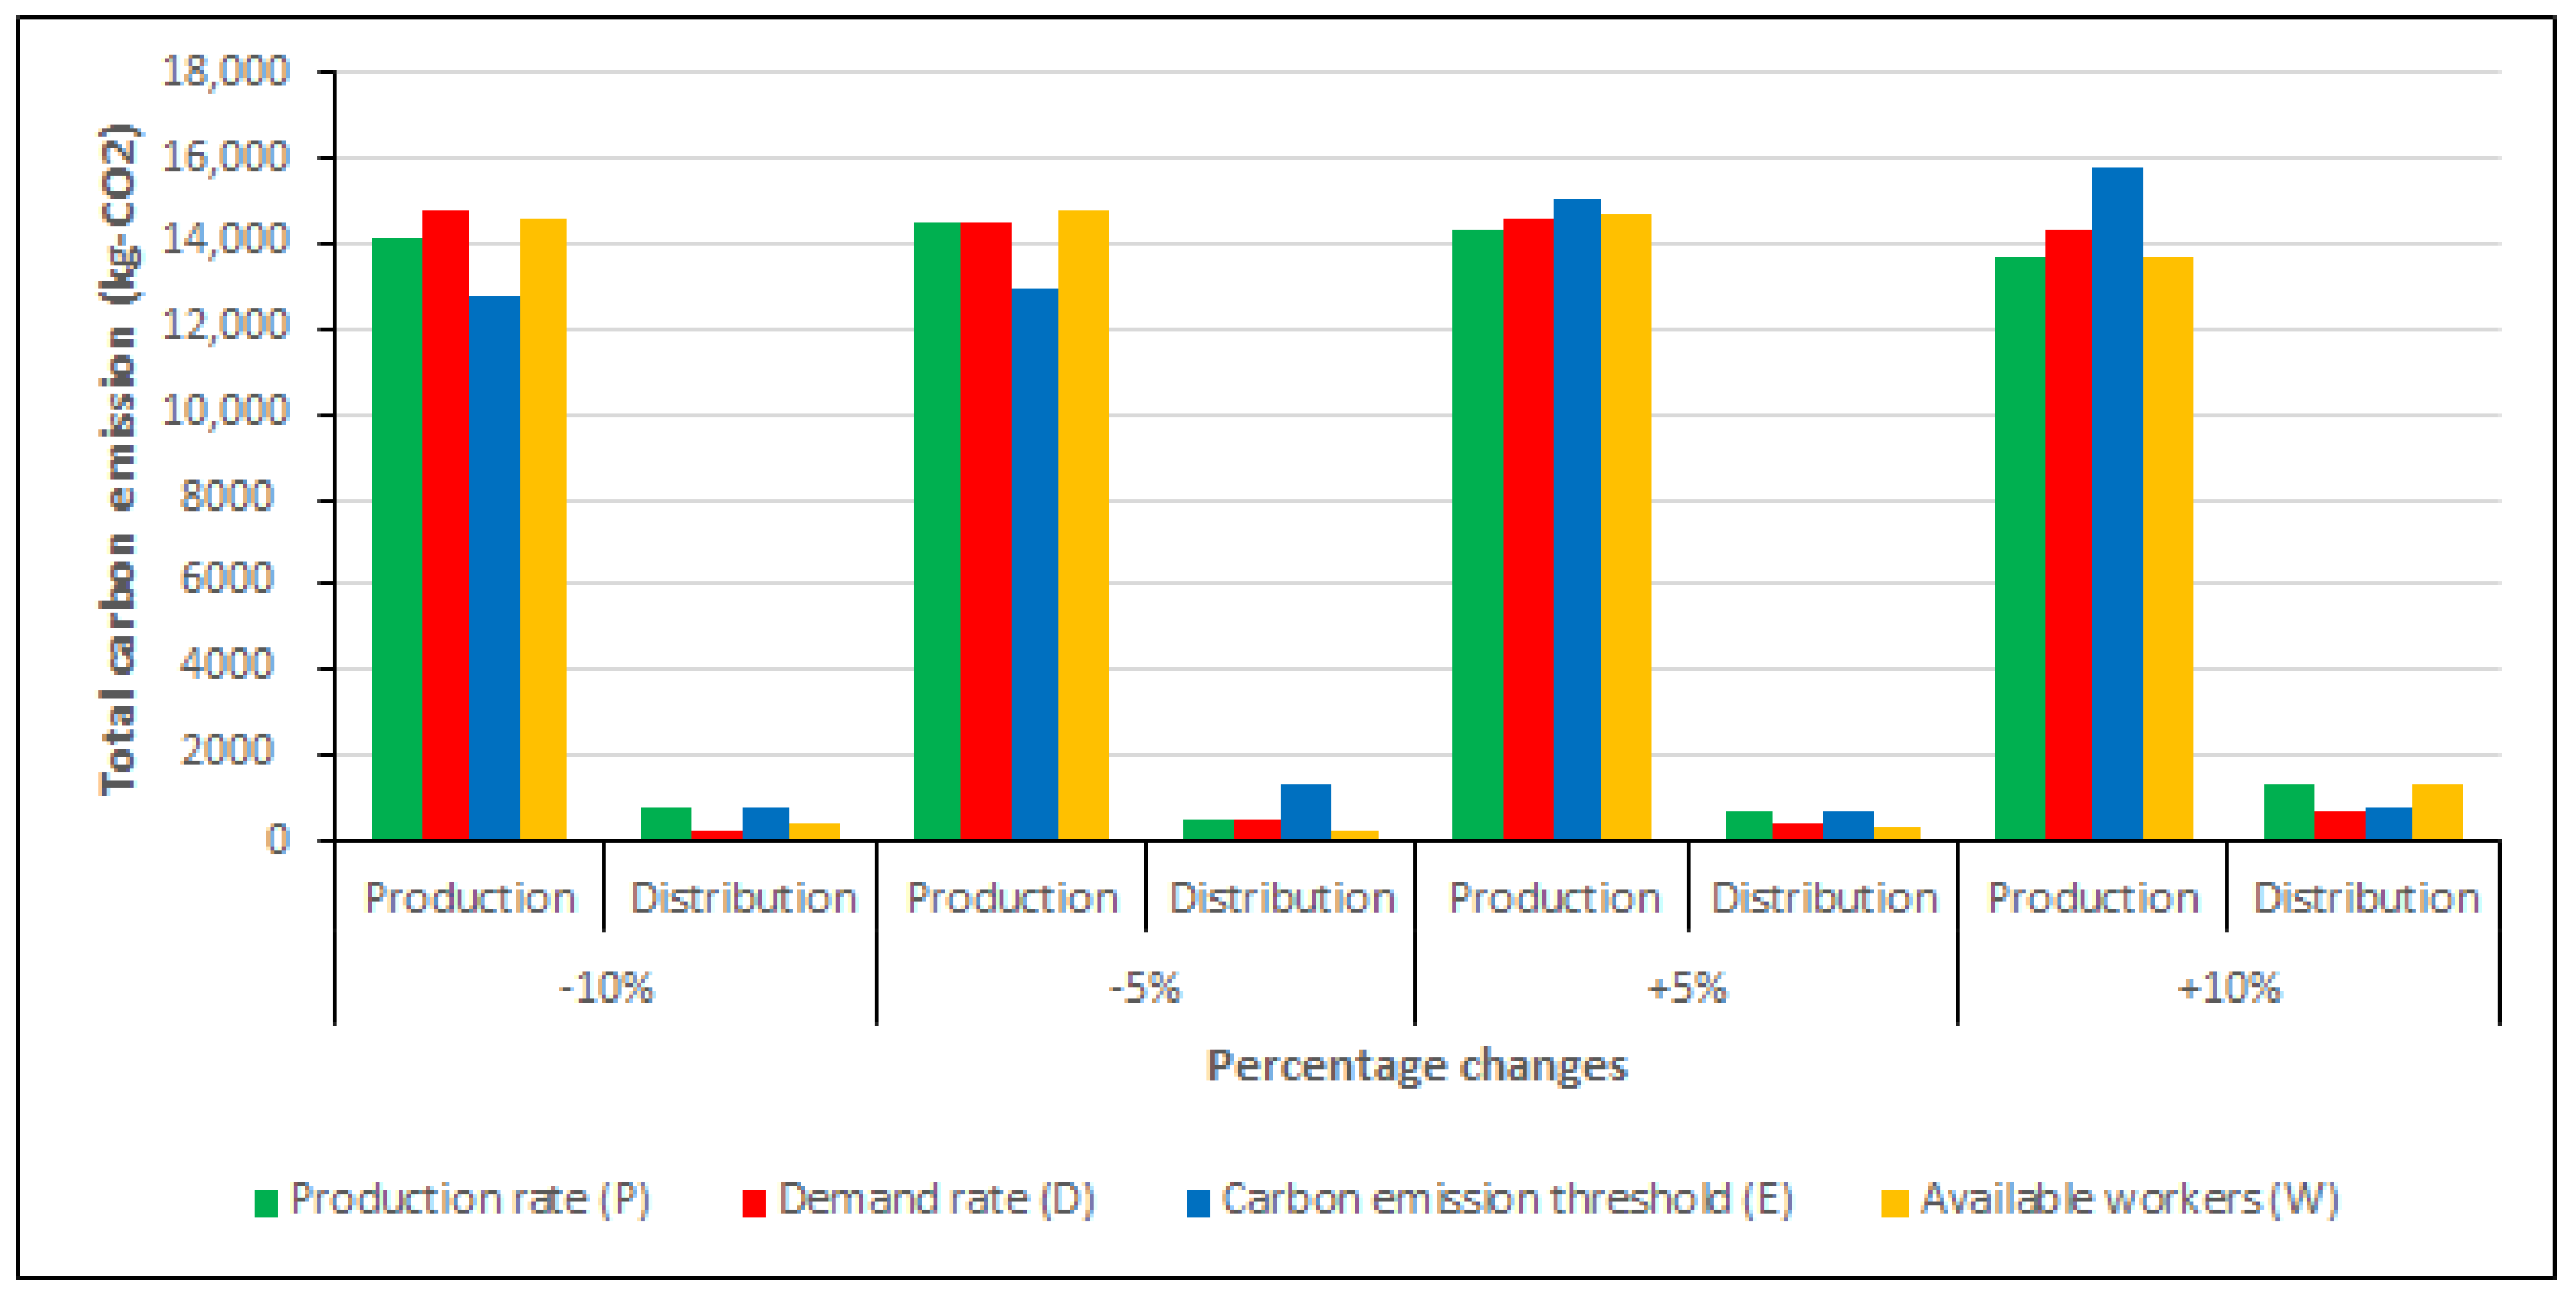
Figure 6 shows that the carbon emission limit parameters and the production level are extremely sensitive to the total cost. Meanwhile, the parameters of the availability of workers and the demand level have changed but are not significant for the total cost. Meanwhile, the relationship between the four other parameters to total carbon emissions (kg-CO
2) can be seen in
Figure 7.
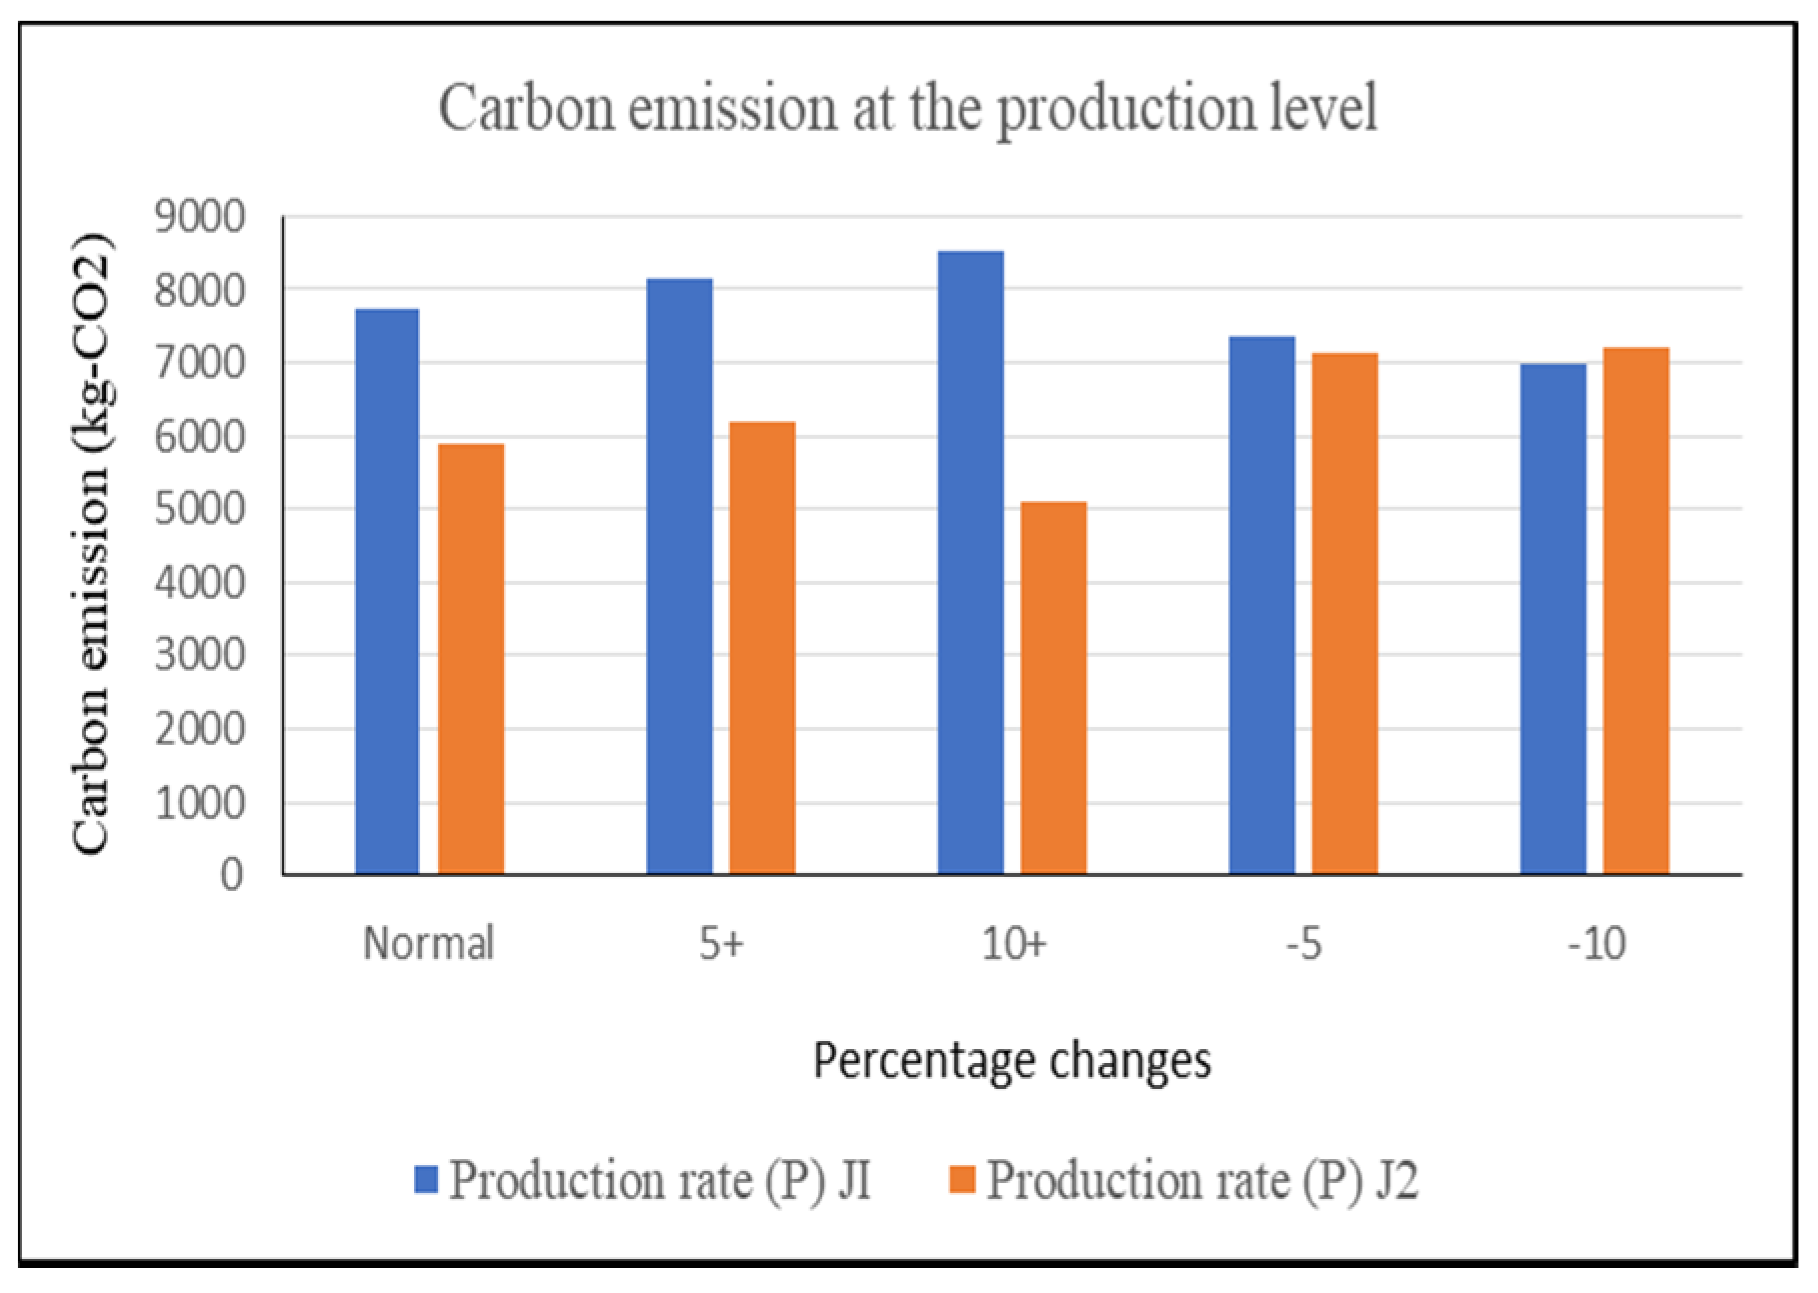
Figure 8 and
Figure 9 shows the impact of carbon emissions from production at each j
1 and j
2 plant and transportation at each distributor center
l1 and
l2.
The parameters used in conducting the sensitivity analysis are similar to other studies, such as production parameters, demand, and carbon emission thresholds. Mishra, Wu, and Sarkar [
52] developed a sustainable economic production quantity model using demand parameters and carbon emissions limits. Likewise, Moon et al. [
24] included the demand parameters and carbon emission limits in the bi-objective optimization problem model with mixed-integer linear programming. These two parameters have been used for the development of mathematical models by other researchers such as Saga et al. [
70], Manupati et al. [
23], Jauhari [
71], and Mishra et al. [
52]. Meanwhile, Sarkar et al. [
72] used production and demand level parameters in developing a model in a three-echelon supply chain. Furthermore, Sarkar et al. [
18] also paid attention to production level parameters and demand for sustainable supply chain management with a single-setup-multi-delivery policy.
The sensitivity analysis results of carbon emission limits show a parameter that is sensitive to the total cost. Moon et al. [
24] concluded that the amount of carbon offsets is cost-sensitive. In addition, Sarkar et al. [
18] show that the carbon emission parameter affects the total cost, so that based on the sensitivity results, this parameter is in an equilibrium position. Another parameter in the study of Sarkar et al. [
18] and Masudin et al. [
74], namely the production level, shows that the production level parameter’s sensitivity increases gradually with the total cost. Saga et al. (2019) found a sensitivity test on energy loss related to carbon emissions released to increase the total cost. Moreover, Sarkar et al. [
72] analyzed the sensitivity to determine changes in the total cost of the supplier’s carbon emission cost parameters and factory carbon emission costs. His research results show that the total cost increases if the supplier’s carbon emission cost parameters and factory carbon emission costs increase. Mishra et al. [
52] stated that the higher the level of social costs of carbon dioxide emissions, the lower the carbon dioxide emissions. Reducing the number of carbon emissions in production-distribution levels can be done by choosing trucks or transporters with lower carbon emissions [
71]. Another way to reduce carbon emissions is applying green technology [
52] and blockchain technology [
22,
75]. In contrast to Tseng and Hung [
76], the government has to impose rules for companies to pay for carbon emission social costs in reducing carbon emissions.
5.2. Managerial Implications and Limitations
For the managerial implications from the results of this study, developing a production-distribution problem by integrating traceability and carbon emissions is providing policy recommendations to stakeholders involved in multi-echelon supply chains. From the government’s perspective, the regulation of carbon emission has impacted significantly on the trading market. It is known that the government’s carbon emission regulated by the government plays a significant role in the cost of the supply chain. Therefore, the local government should apply a wise carbon emission tax for industry sectors. Otherwise, it would affect the cost of production and distribution that would affect the country’s economic performance [
77]. A different tax of carbon emission for food and basic needs should be applied lower than commercial products as it would significantly impact the price of the products [
78].
From the perspective of the industrial sectors, the results of this study indicate that the largest carbon emissions are generated from the production processes. Thus, top management of the production sectors should consider applying sustainable, lean, and green production approaches. Several approaches that can be used are green and lean manufacturing principles that can reduce carbon emissions significantly [
79,
80]. In addition, the recycling policy in the remanufacturing processes will greatly reduce carbon emissions [
81].
This paper discussed the integration of production and distribution by considering traceability and carbon emissions to find the minimum total cost. However, some limitations should be addressed further. First, this study examines the supply chain system of manufacturers and distributors, not involving suppliers in the supply chain network. So that carbon emissions from suppliers have not been considered. Likewise, the total costs generated only involve manufacturers and distributors. In a previous study by Sarkar et al. [
72], it was shown that the longer the supply chain network involved in the development of the model was, the more comprehensive were the results. The second limitation of this research is that it did not integrate the sustainability aspect into the design of the supply chain network. Previous research by Manuputi et al. [
23] showed that the sustainability aspect is an important point to be involved in designing the supply chain network.


