
Construction Site Layout Planning Using a Simulation-Based Decision Support Tool


1
Department of Civil and Environmental Engineering, University of Alberta, Edmonton, AB T6G 2W2, Canada
2
Department of Mechanical and Construction Engineering, Northumbria University, Newcastle upon Tyne NE1 8ST, UK
*
Author to whom correspondence should be addressed.
Logistics 2021, 5(4), 65; https://0-doi-org.brum.beds.ac.uk/10.3390/logistics5040065
Submission received: 21 June 2021
/
Revised: 9 July 2021
/
Accepted: 21 July 2021
/
Published: 22 September 2021
(This article belongs to the Special Issue Advancing Construction Logistics: Unlocking the Potential for Construction Productivity)
Abstract
:Background: A site layout plan is one of the important decisions to be made in the planning phase of each construction project as it can significantly impact on-site transportation, construction logistics, and safety. This decision could be complicated owing to the uncertainties inherent in construction projects and the complex relationships between the influencing factors and decision variables. Methods: To improve site layout planning, this study aims to develop a simulation-based decision support tool (DST) that enables planners to consider the following: (1) construction uncertainties, (2) construction resources (i.e., material, equipment, and workers), (3) site layout constraints, and (4) mutual impacts between site layout and construction plan variables, for site layout planning of construction projects. Results: The developed DST visualizes the site layout plan within a simulation environment and provides seamless interactions between the site layout model and the simulation model. These capabilities facilitate planning construction site layout using simulation by establishing two-way information flows between the site layout and simulation components, which can further promote application of simulation in construction site layout planning. Usefulness and practicality of the proposed DST is demonstrated in site layout planning of a steel erection project. Conclusions: Using this DST can reduce some common wastes in construction projects and the cost associated with them, including on-site transportation, material handling and storage, and waiting time for the material arrival.
1. Introduction
Construction site layout, which includes the information pertinent to the geometry of the site along with the sizes and locations of temporary facilities, is one of the decision variables that influences on-site transportation, logistics, and safety. For some facilities, such as material storage facilities, size can have a significant impact on the project, particularly for projects with congested sites, where the planner may not be able to provide sufficient space for all facilities. Unavailability of sufficient space for material storage, for instance, prevents offloading of materials, which can cause loss of productivity owing to interruptions in the workflow, or can incur extra costs to provide off-site facilities for the temporary storage of materials. The positions of facilities affect on-site transportation distances and on-site logistics. On-site logistics can comprise 60% of the total logistics costs [1] and needs to be properly coordinated with off-site logistics for the success of project delivery [2]. A long distance between facilities can expose a project to the longer transportation time, interruptions in construction operation workflows and logistics, and consequently loss of productivity.
Site layout is also a major component of construction worker safety improvement [3]. Anumba and Bishop (1997) [4] discussed the necessity of integrating safety with site layout planning and identified some of the risks that can be mitigated by improving site layout, such as falls, falling objects, site transportation, and hazardous substances.
An efficient site layout can improve the project time and cost and construction worker safety in the execution phase of the project. Skjelbred et al. (2015) [5] indicated that planning the site layout, logistics, and allocating the proper resources need to all be considered together for an efficient production. These decisions are generally made by logistics specialists who are responsible for planning of site layout, coordinating physical deliveries of supplies, and on-site materials’ handling [6]. However, making these decisions is a complicated task owing to the dependency of influencing factors and the interrelationship between variables. Therefore, a DST is needed to integrate all these factors into a unified model. In addition, site layout and logistics planning need to account for many uncertainties such as delays and interruptions in the supply chain, variability of activity duration and production rates, and equipment breakdown. To address these needs, this research aims to develop a simulation-based decision support tool (DST) that enables planners to consider the following: (1) construction uncertainties, (2) construction resources (i.e., material, equipment, and workers), (3) site layout constraints, and (4) mutual impacts between site layout and construction plan variables, for site layout planning of construction projects. This DST can be used by contractors/subcontractors for supporting their decisions on site layout, material delivery, and logistics plans. The hypothesis of this research is that “the proposed DST is an effective tool for planning construction site layout and improving construction operation costs”.
In the following sections, first, the related literature is reviewed and the methodology for developing the proposed DST is outlined. Then, the developed DST is applied to a case study and the results of the case study are discussed. Next, the process of the verification and validation of the tool is described. In the last section, the conclusion drawn from the research is presented.
2. Literature Review
In the literature, numerous approaches have been developed to facilitate and improve site layout planning. Most of these studies have focused on where to locate temporary facilities and how to optimize facility locations. For positioning of facilities on the site, constraints such as on-site transportation cost, safety and environmental issues, accessibility, and planners’ preferences may be considered. For evaluating site layouts and optimizing the locations of facilities, the majority of the methods used the sum of weighted distance function (SWDF). There are two approaches for defining SWDF: (1) the quantitative approach, where the material handling cost is minimized, and (2) the qualitative approach, where some measures of closeness rating are minimized [7]. Studies conducted by Elbeltagi et al. (2004) [8] and Cheng and Connor (1996) [9] employed qualitative methods, while studies by El-Rayes and Khalafallah (2005) [10], McKendall Jr. and Hakobyan (2010) [11], and Zhang and Wang (2008) [12] used quantitative methods. Ning et al. (2010) [13] indicated that quantitative factors can include material flows, equipment flows, personnel flows, and information flows, and qualitative factors can consist of interaction weights between facilities, safety/environmental concerns, and user preferences. For locating facilities, some studies have focused on safety and environmental impacts of the site layout. El-Rayes and Khalafallah (2005) [10] developed a model to quantify crane safety, hazardous material safety, and safety of travel route intersections. Ning et al. (2018) [14] identified risks associated with interactions between facilities (e.g., transportation of material, equipment, and personnel), and risks due to site wastes (e.g., noise, dust, and vibration). They developed a quantitative model for assessment of these safety risks in construction site layout planning. Another approach for considering safety and environmental concerns is to use hard constraints. Hard constraints are discrete, which means that they either are satisfied or are not. This approach is suitable to identify hazard zones and excludes them from the areas where the facilities can be positioned. Sanad et al. (2008) [15] specified prohibited zones adjacent to the facilities that have harmful effects on neighbours, such as the zones around construction areas. El-Rayes and Said (2009) [16] used exclusion/inclusion constraints and minimum/maximum distance constraints from a facility to limit the position of facilities outside/inside of a zone or an area around a facility. Building information modelling (BIM) has also been used for automating checking rules for the planning of construction site layouts, particularly safety standards such as safety distance between temporary site elements [17].
In recent years, some new technologies such as unmanned aerial vehicles (UAVs) have been used for layout planning. For instance, Jiang et al. (2020) [18] used UAV-based 3D reconstruction of the construction site in real time for hoist site mapping and facility layout planning. Vrijhoef et al. (2018) [19] used 4D BIM, which can link space and time, for modeling different facility layout scenarios and evaluating their impacts on walking, waiting, and working times of construction workers in a project in the Netherlands. In addition, some commercial tools such as Bluebeam have been developed for site layout planning. Bluebeam has a capability of marking up the site using digital tools and sharing it with site workers to streamline communication [20]. This tool can address the common on-site problem of information deficiencies, and lack of proper workflow planning due to changing site layout, identified by Thunberg et al. (2017) [21].
In the past, fewer studies considered facility size as one of the major decision variables in site layout planning. Zouein and Tommelein (2001) [22] categorized the profile of the space needs for facilities into two groups: (1) resource independent, which is fixed, and (2) resource dependent, which is either fixed or variable over the project time. For the variable-size facilities, space needs may decrease linearly or fluctuate between minimum and maximum levels as the corresponding activities progress. Said and El-Rayes (2011) [23] developed a model for optimizing material procurement and material storage layout to achieve minimum logistics costs. In their model, material procurement decision variables (i.e., ordering periods and quantities of materials) influence the required size of the material storage.
Lean thinking also has applications in site layout and logistics planning. Lean thinking first emerged in Toyota Motor Corporation and identified seven wastes [24]: transport, inventories, movement, waiting, inappropriate processing, over-production, and defects. While lean thinking was originated based on automobile production and manufacturing, it has implications for the construction industry, although there are some differences between the construction and manufacturing industries. For instance, in manufacturing, the intermediate/incomplete product can be transported internally, and the complete product is then transported to the customer; however, in construction, the products do not move; instead, equipment and workers move around the products [25]. Inventories of materials, movement of people, transportation of material, and waiting time are the wastes that can be effectively addressed through proper site layout and logistics planning. In a study by Josephson and Saukkoriipi (2007) [26] in Sweden, it was revealed that construction workers spend more than 35% of their time waiting and handling materials. In Canada, it was reported that approximately 50% of the time of the handling crew at module shops is wasted while waiting for the materials’ arrival [27]. Sezer and Fredriksson (2021) [28] emphasized that lack of proper logistics management is one of the main factors contributing to such wastes. Some techniques, such as just-in-time (JIT), which is based on ordering materials only when they are to be used immediately; the pull system, which is based on producing only the amount of goods that are needed; Kitting, which is based on gathering, packing, and delivering separate parts as one package; and off-site construction, which is based on manufacturing some parts of final products off-site, have been effectively used for implementing lean construction and eliminating wastes in logistics [29]. Using these methods can eliminate or minimize on-site storage, as well as unnecessary on-site transportation and movement. In particular, JIT can improve construction logistics by eliminating material storage, material defects, and unnecessary material handling. Despite the proven advantages of JIT in improving transportation efficiencies, reducing environmental impact, and increasing production efficiency [30], some companies still adopt a traditional ad hoc strategy for the delivery of materials. For instance, in a study undertaken by Ying et al. (2014) [2] in New Zealand, 41.2% of the firms that participated in a project used the ad hoc strategy for the delivery of construction materials, while 21.6% used JIT and 37.3% used both methods. This could stem from the typical logistics problems in the construction industry such as lack of planning of material deliveries and unloading resources [2], missing or delayed deliveries [31], and unpredictability in supply owing to lack of detail planning [19].
Despite the novelty of the abovementioned methods, the uncertainties of construction projects were not taken into account in their models. For modelling uncertainties, some studies have used simulation. Tommelein (1999) [32] utilized simulation to evaluate the efficiency of different alternatives for the number and location of tool rooms. Ying et al. (2021) [33] used simulation for modeling vehicle movement to identify potential improvements of logistics performance. Marasini et al. (2001) [34], Alanjari et al. (2014) [35], and RazaviAlavi and AbouRizk (2017a) [36] integrated GA with simulation to optimize layouts for precast concrete stock yards, for steel fabrication yards, and for construction sites, respectively. Zhou et al. (2009) [37] developed a special-purpose simulation (SPS) tool for modelling site layout in tunnelling projects and for facilitating integration of the simulation model with the site layout model. RazaviAlavi and AbouRizk (2015) [38] used simulation to quantify the impact of facility size on project time and cost. In addition to modeling uncertainties, modeling resources is important as utilization of resources at site can significantly impact the performance of on-site logistics [39]. Alanjari et al. (2014) [35] proved that modeling resources is another advantage of simulation over SWDF for layout planning. RazaviAlavi and AbouRizk (2017b) [40] highlighted the importance of modeling the mutual impacts of site layout and construction operation variables, which was neglected in most of the existing methods, and proposed a simulation-based framework to simultaneously optimize them in an integrated model. Siemens developed a commercial simulation-based tool (Tecnomatix® Plant Simulation) for modeling material handling, logistics, and machine utilization in manufacturing plants [41]. As mentioned earlier, there are some differences between the manufacturing and construction industries, which make these tools unsuitable for construction site layout planning. For instance, these tools focus on modeling the material flow because, in the manufacturing processes, the products can be transported on the site; however, in the construction industry, equipment and workers move around the products [25], and equipment and worker work flow also need to be modeled.
The aforementioned studies illustrated the capabilities of simulation in modelling and analyzing the impacts of the site layout plans on construction projects. To create simulation models, some of these studies [37] used customized simulation tools, while others [32,35], used generic simulation tools such as Simphony [42] and STROBOSCOPE [43]. Each of these tools has its own advantages and limitations. Using customized tools significantly reduces the modelling effort needed; however, these tools are limited to specific types of projects such as tunneling projects. Existing generic simulation tools have the flexibility of being able to model different types of projects; however, they do not include specific site layout components for modelling. Consequently, modelling of site layout characteristics becomes a laborious and time-consuming task, particularly when the planner wants to experiment with different site layout alternatives, because the corresponding parameters must be prepared and changed manually. To address these shortcomings, this study outlines the development of a simple-to-use DST for site layout planning embedded in the simulation environment and capable of building the site layout for various types of projects, visualizing the layout, and seamlessly interacting with the simulation model. The next section describes the methodology for developing the proposed DST.
3. Methodology
The proposed DST is implemented in the Simphony environment to interact with Simphony’s general purpose template (GPT), which is used to build the discrete event simulation (DES) models. In addition to the simulation functionality, this tool can account for the site layout constraints for positioning facilities by defining general as well as site-specific rules. This tool comprises two main components: (1) layout visualization and (2) simulation. Through the visualization component, the site layout model representing the configuration of the site geometry and facility location and size is created. Using the simulation components, a DES model representing the project processes is created, which can interact with the site layout model using predefined elements and/or simple programming codes if needed. This interaction includes receiving of the site layout information by the simulation model and updating some properties of the site layout model while the simulation model run advances. Details of tool components and their functionalities are described in the following subsections.
3.1. Layout Visualization Components
Visualization components consist of the site element, facility element, constraint element, and material element. In the site element, the site boundary (i.e., site geometry) is identified. The facility elements can then be added to the site element in order to identify facility size and location. The constraint element can also be added in order to identify the site-specific constraints for the purpose of positioning facilities. If the material flow is simulated, the material element, which collects the types of materials, is utilized in the model. The following subsections explain the properties of these elements.
3.1.1. Site Element
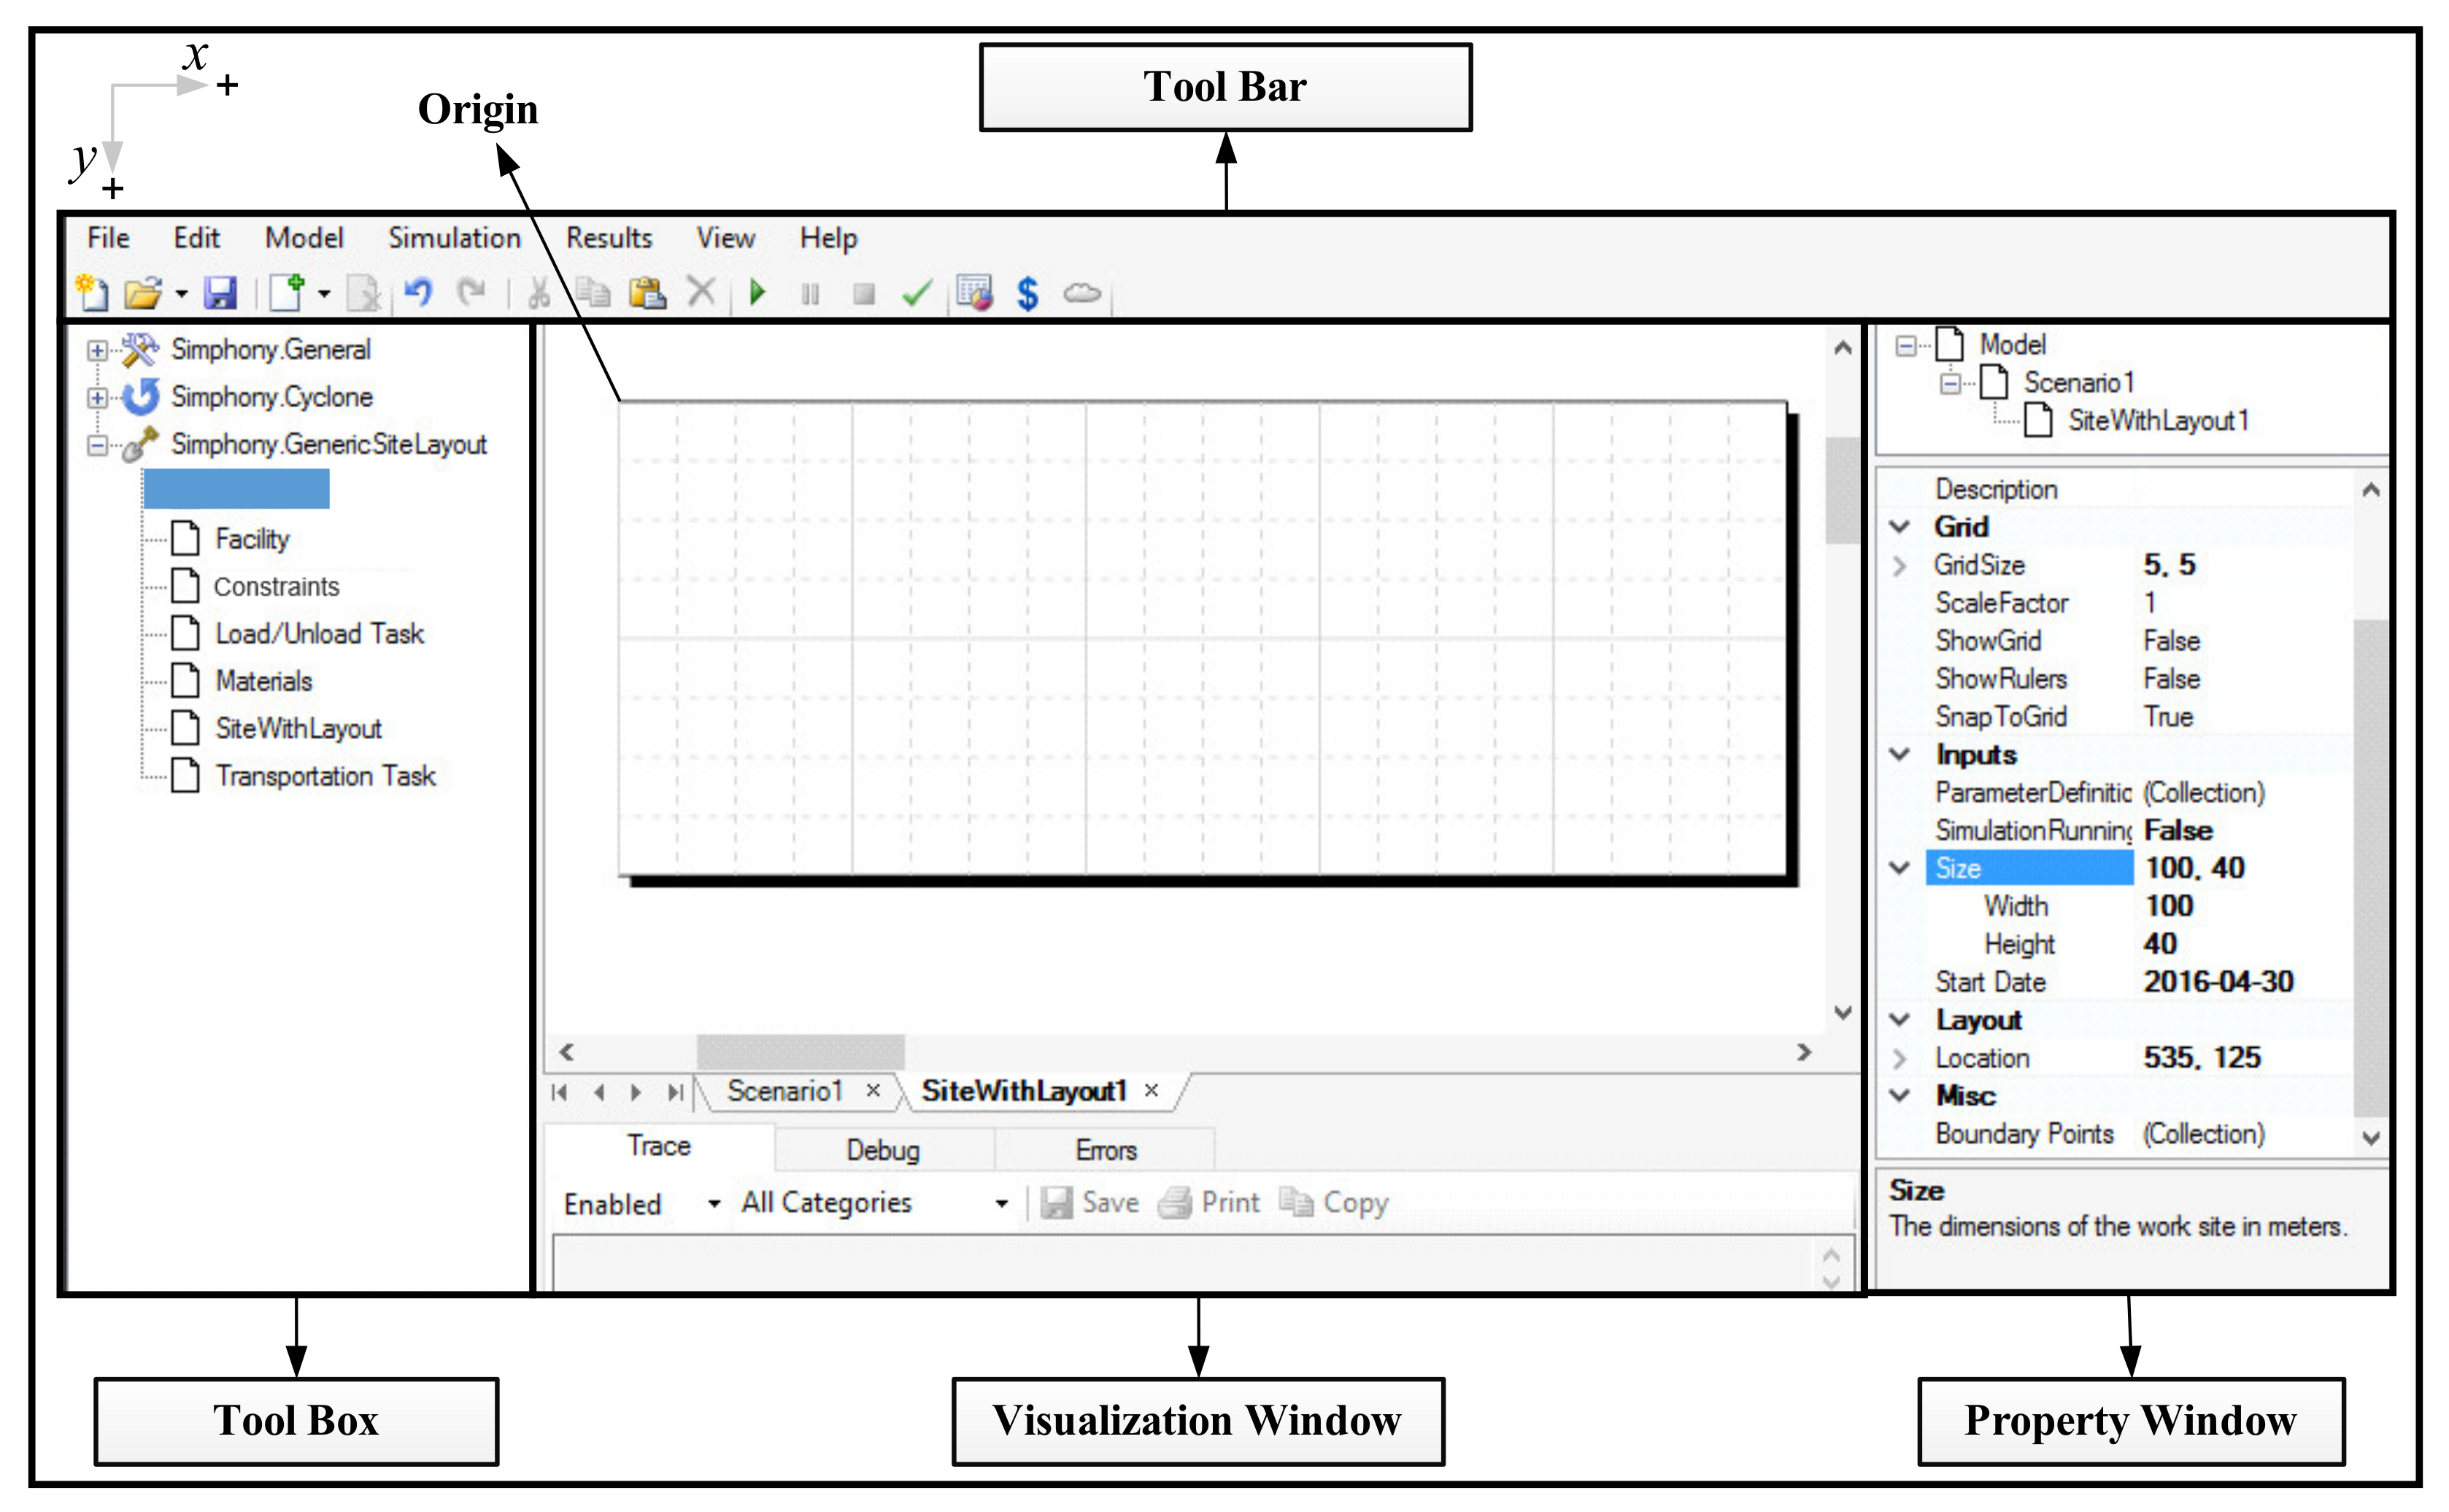
The graphical user interface (GUI) includes a visualization window to visualize the elements, a property window to identify the characteristics of the element as the model inputs, and a toolbox window providing access to the modelling elements. An overview of the GUI and site element is depicted in Figure 1. The site element is a plane area using a Cartesian coordinate system in which the origin is placed at the top-left corner of the site, and the positive directions of the x and y axes are as shown in Figure 1. The site element has the following properties:
- Size of the plane area, which is specified by the width (i.e., the length in the x direction) and the height (i.e., the length in the y direction);
- The boundary of the site, which is specified by the coordinates of the site boundary vertices.
It should be emphasized that any changes to the site characteristics in the property window are automatically reflected in the visualization window.
3.1.2. Facility Element
The facility element represents the facilities located on the site. The main properties of the facility element are as follows:
- Name, which is a unique identification assigned to the facility for recognition in the simulation model;
- Size, which is determined by the width (i.e., the length in the x direction) denoted by W and the height (i.e., the length in the y direction) denoted by H, once the facility edges are parallel to the x and y axes;
- Location, which is determined by the x and y coordinates of the center of the facility;
- Orientation, which is determined by the angle that the facility is rotated about the x axis;
- Facility type, which can be either material-dependent or material-independent. This property identifies whether any material is to be placed in the facility. If so, it is material-dependent. Otherwise, it is material-independent. For the material-dependent facility, the following properties are considered:
- ○
- Capacity, which is identified as the maximum unit of materials that can be placed in the facility. For material-dependent facilities, capacity is an important parameter that can affect the productivity and project cost. For instance, materials cannot be unloaded in a facility in excess of its capacity, which entails waiting time for unloading tasks and resultant workflow interruption;
- ○
- Material type, which identifies the type of material that can be placed in the facility;
- ○
- Available material, which is used to account for the amount of each material type existing in the facility at any time as the simulation model is run. The initial amount of material (i.e., the amount available in the facility at the beginning of the simulation run) can also be defined as an input.
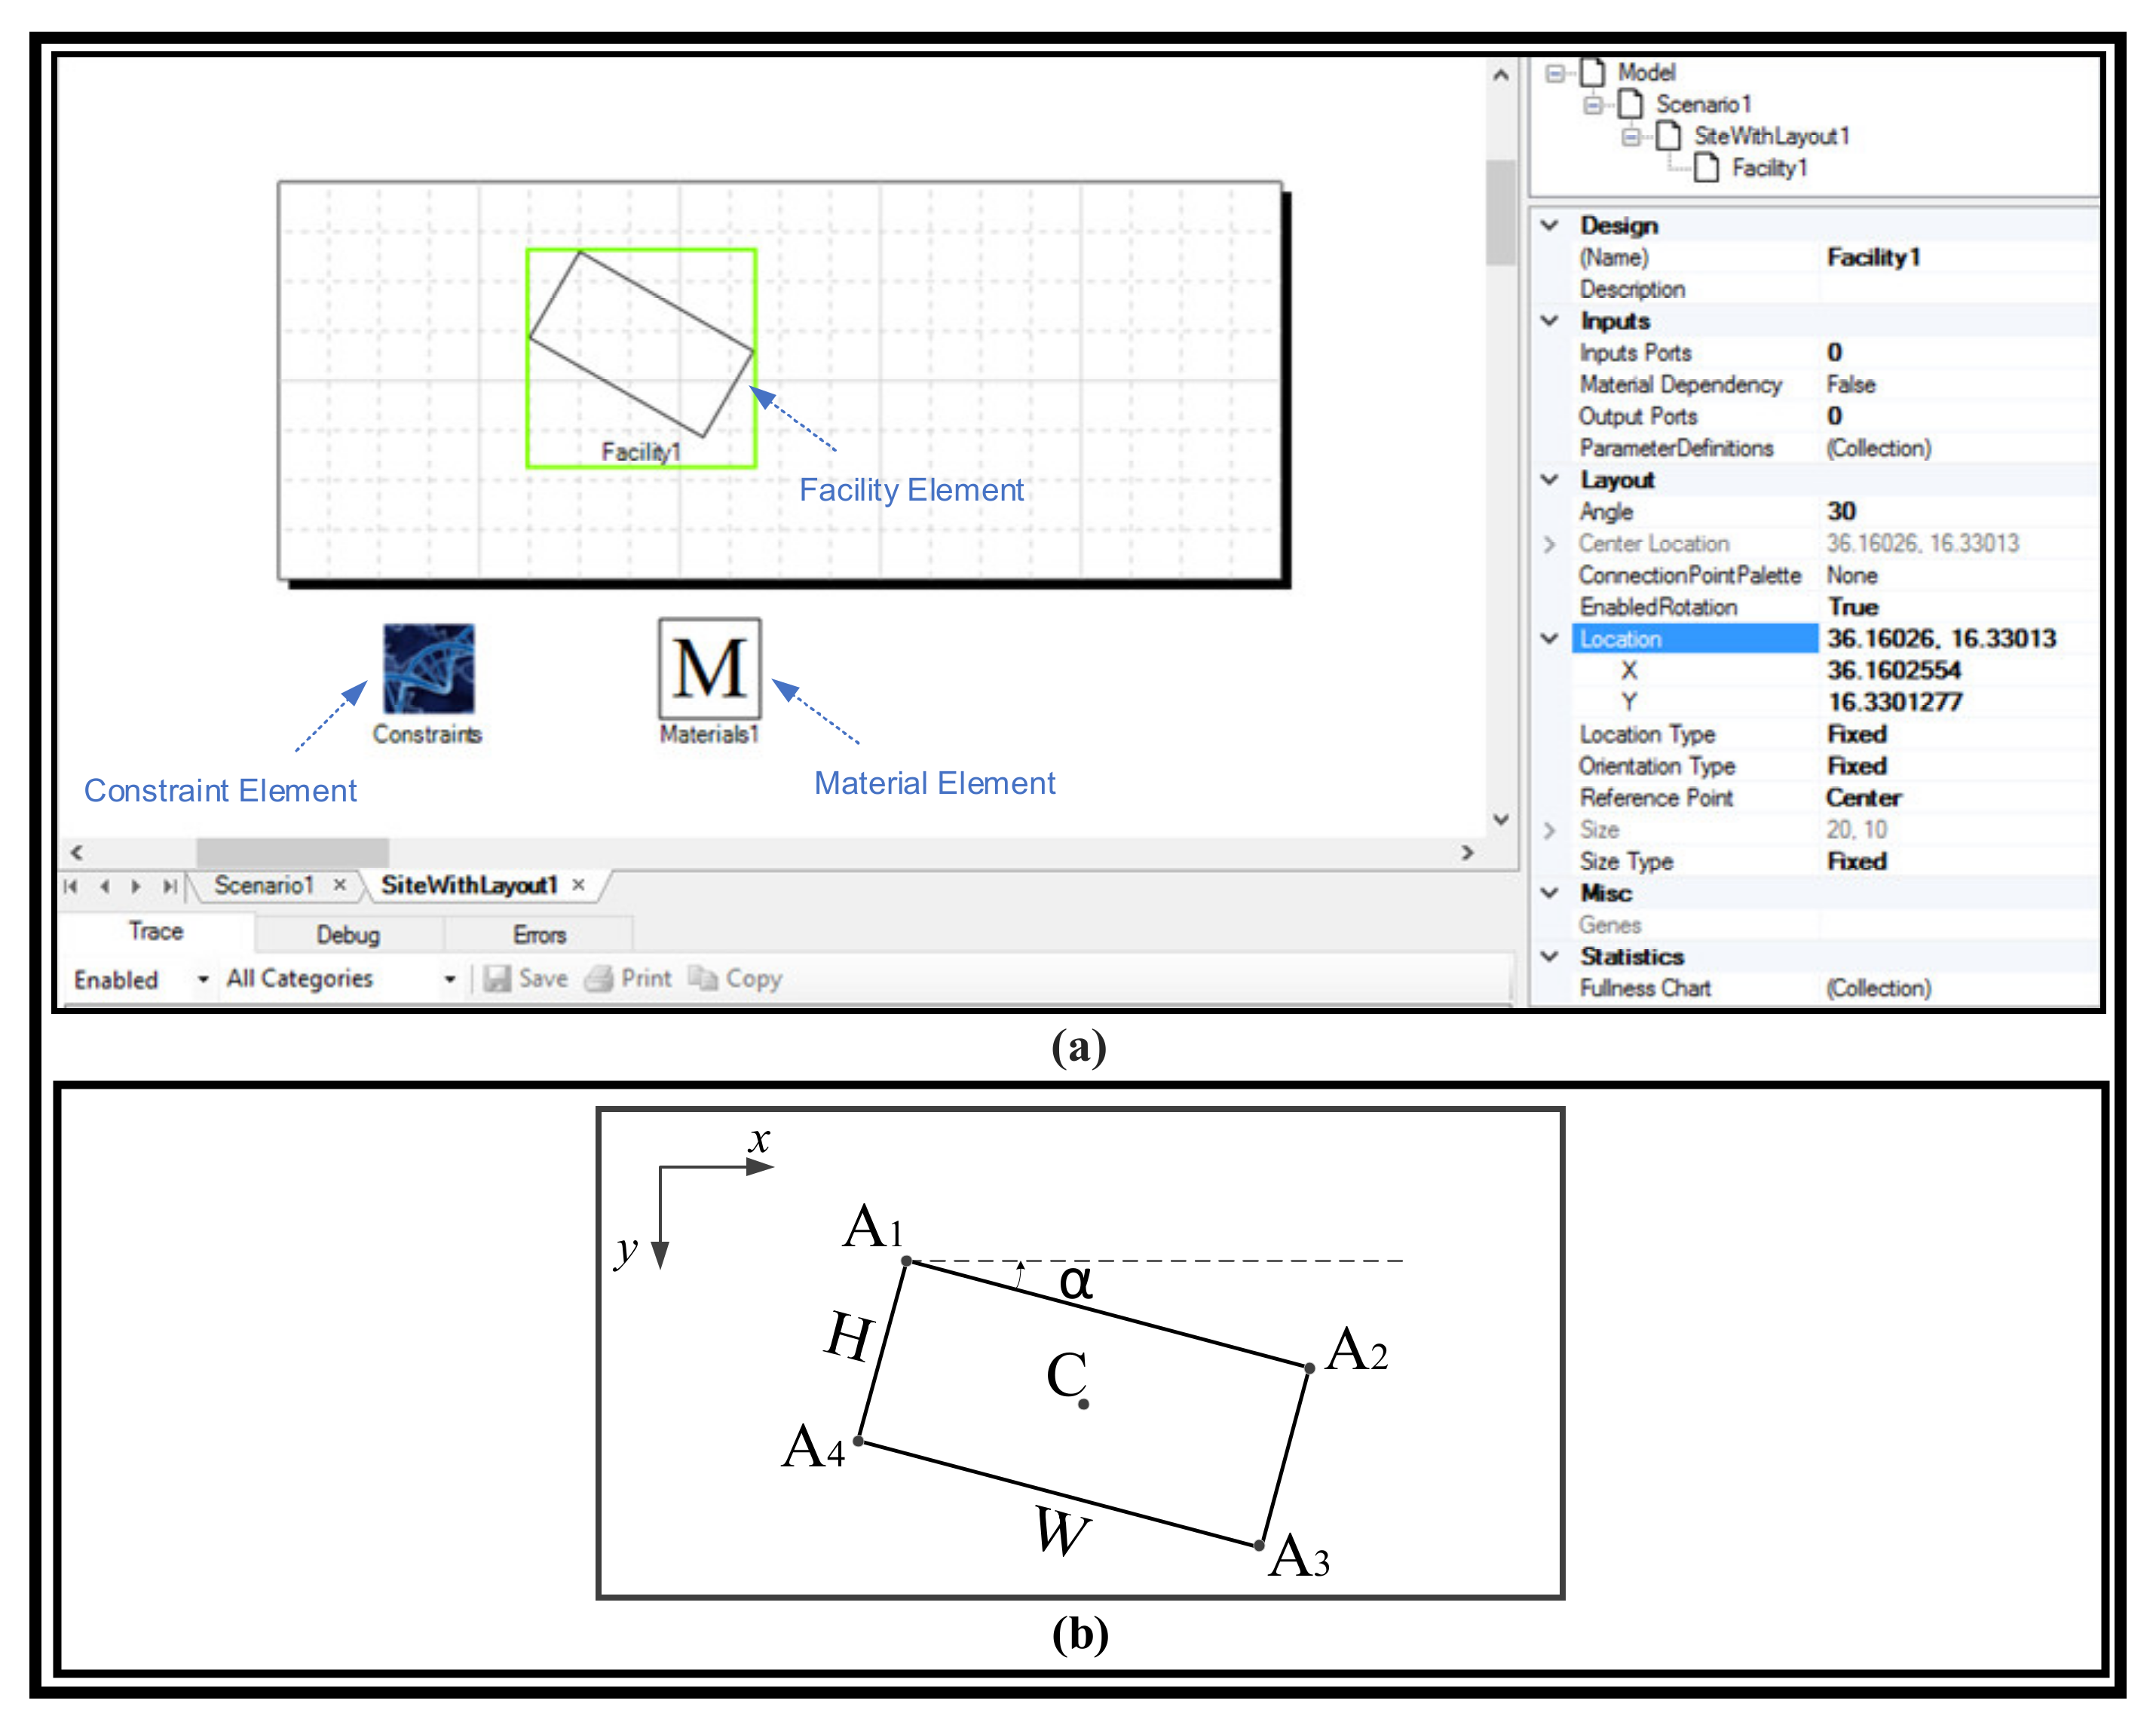
Figure 2a depicts an overview of the facility element positioned on the site element. More details about the facility element are presented in Appendix A. The DST is capable of creating outputs in the tabular and chart formats for the quantity of the material available in the material-dependent facilities, and of calculating the average fullness as the available material quantity in the facility, and average fullness ratio as fullness value over capacity throughout the simulation run time.
3.1.3. Material Element
The material element is used to define the materials that are to be modelled. The user can list the names of the materials in this element. Then, this list will be accessible in the tool for the material-dependent facilities in order for the user to specify the types of materials identified by their names. The material element is shown in Figure 2a inside the site element.
3.1.4. Constraint Element
In site layout planning, there are two types of constraints for positioning facilities: general constraints and site-specific constraints. General constraints are the ones that must be satisfied in every site, including the following:
- Being inside the site boundaries, which entails that all facilities must be positioned inside the site boundary;
- Non-overlapping between facilities, which entails that no facility can overlap with another one.
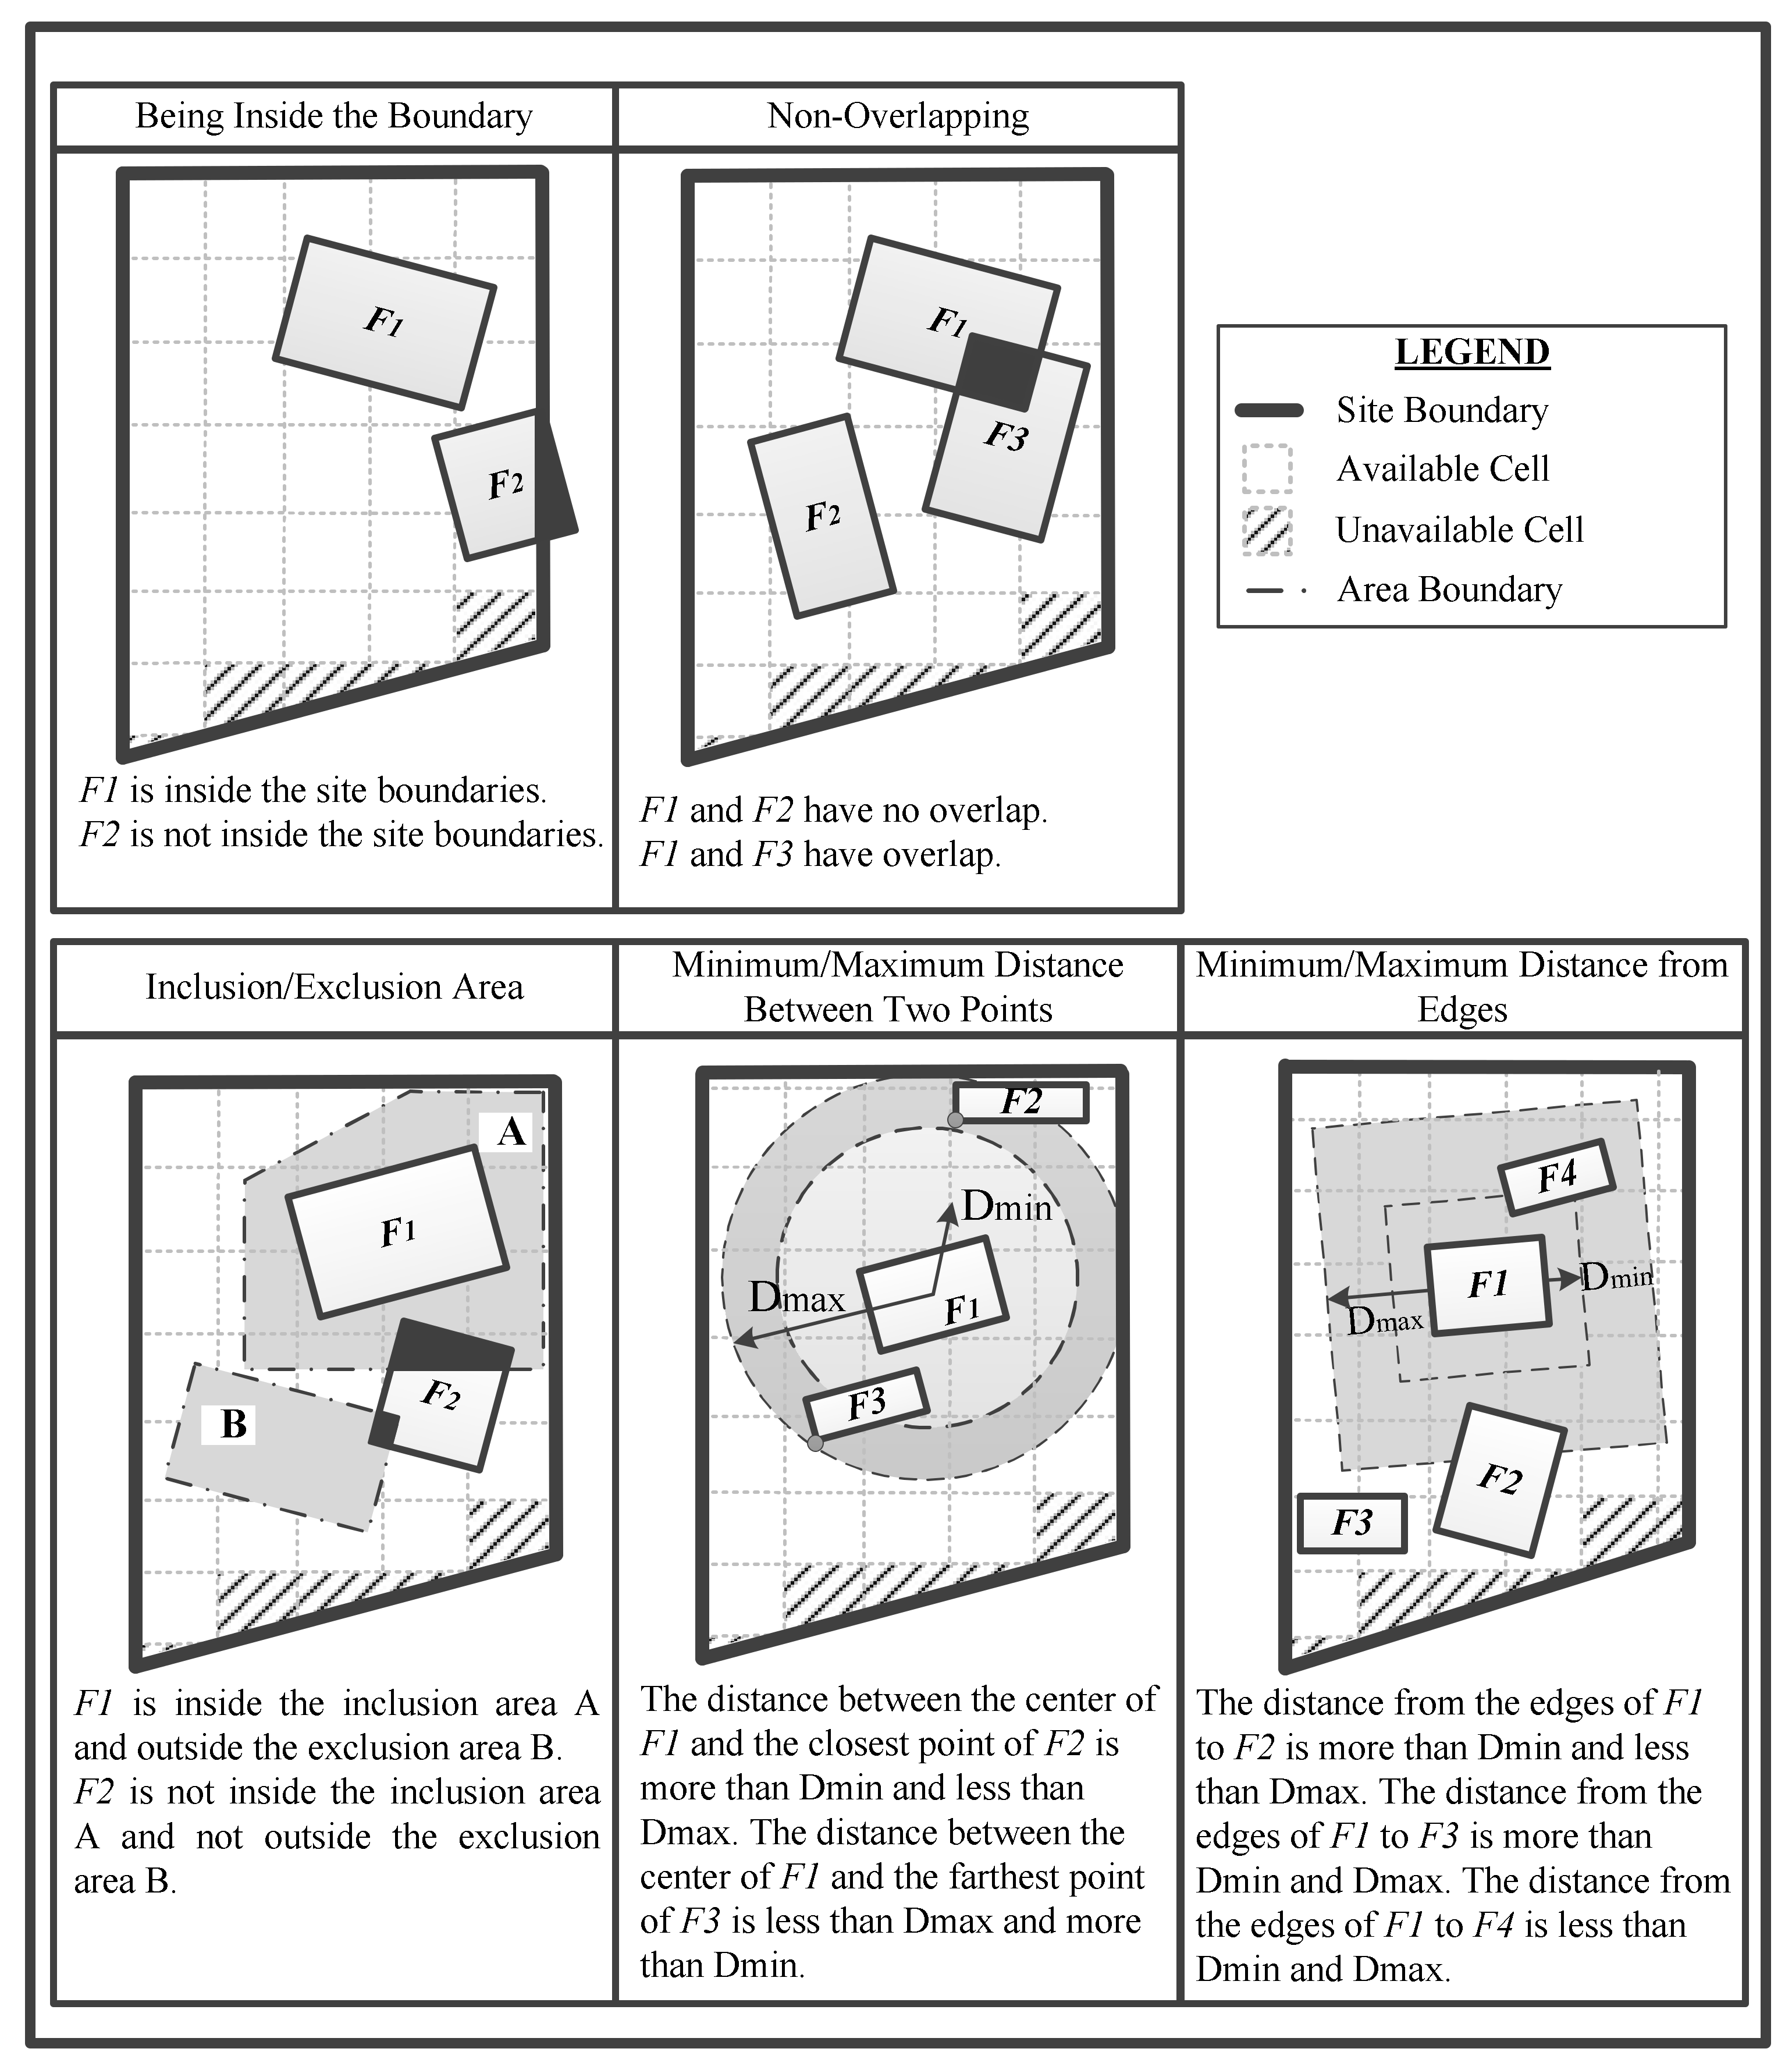
Site-specific constraints are those that the planner defines to be satisfied specifically for each site, and can encompass closeness constraints, safety concerns, accessibility, and planner preferences, to name a few. Figure 3 depicts different types of constraints that are considered in the tool.
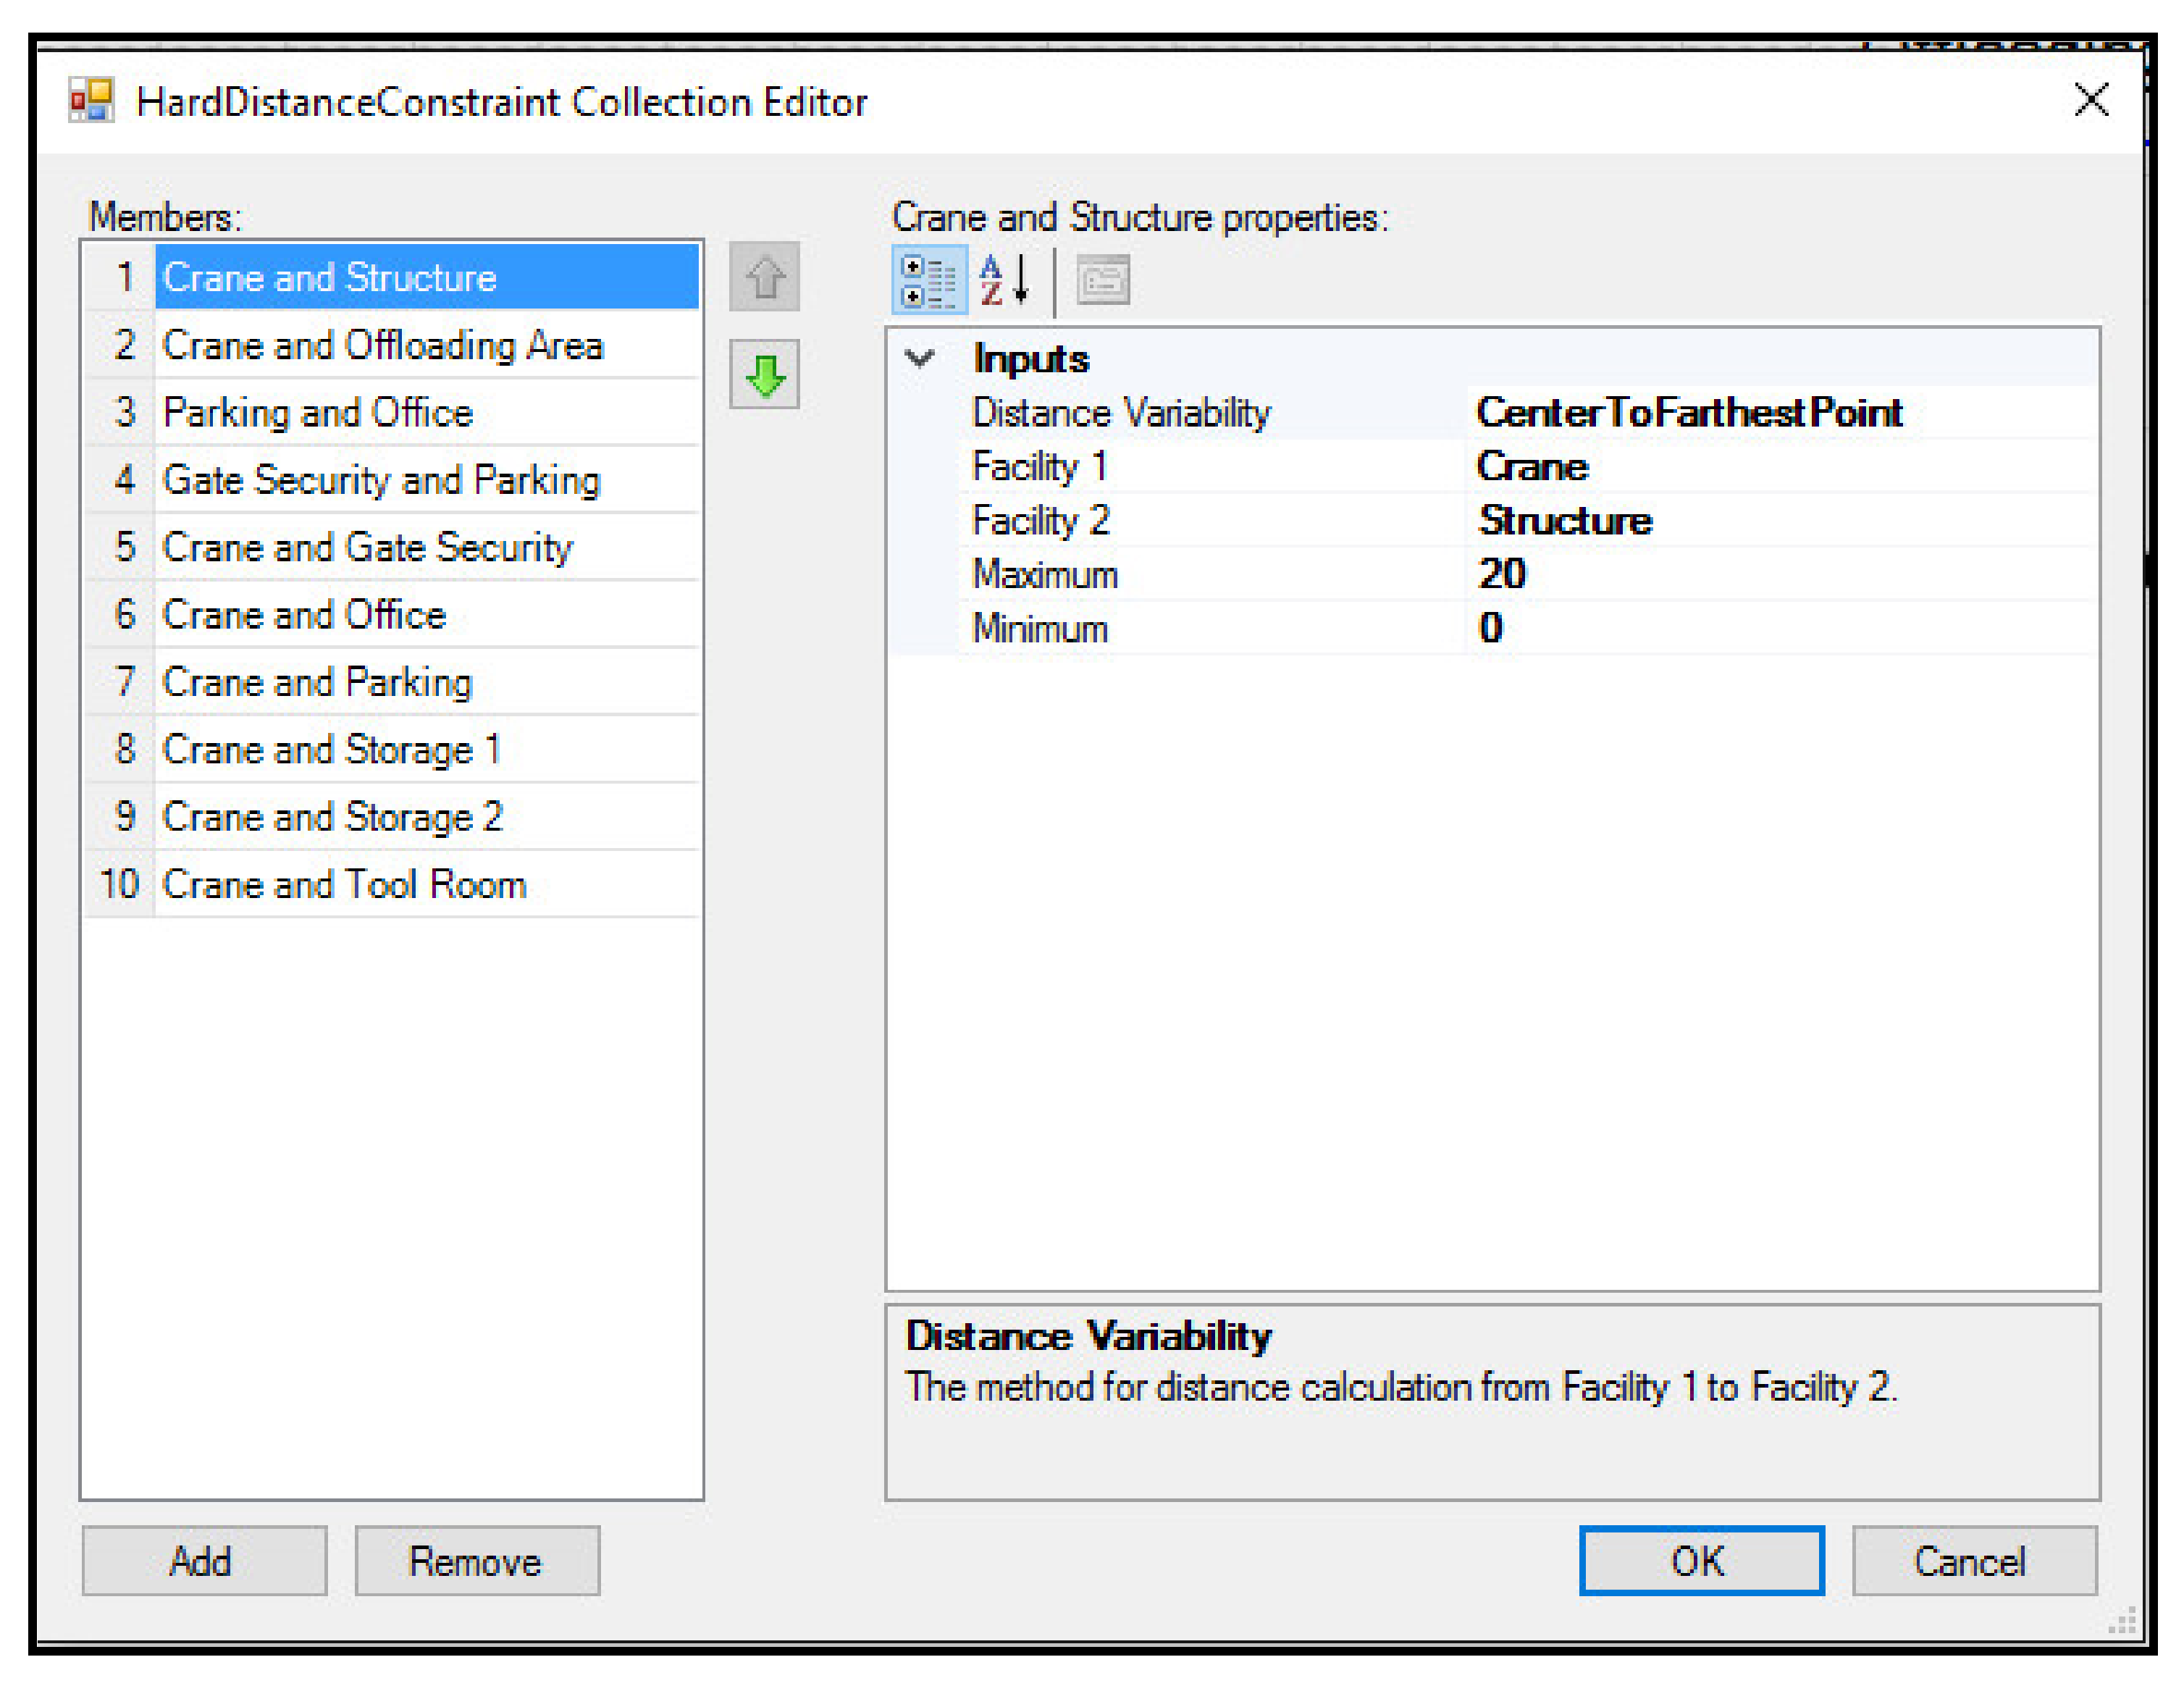
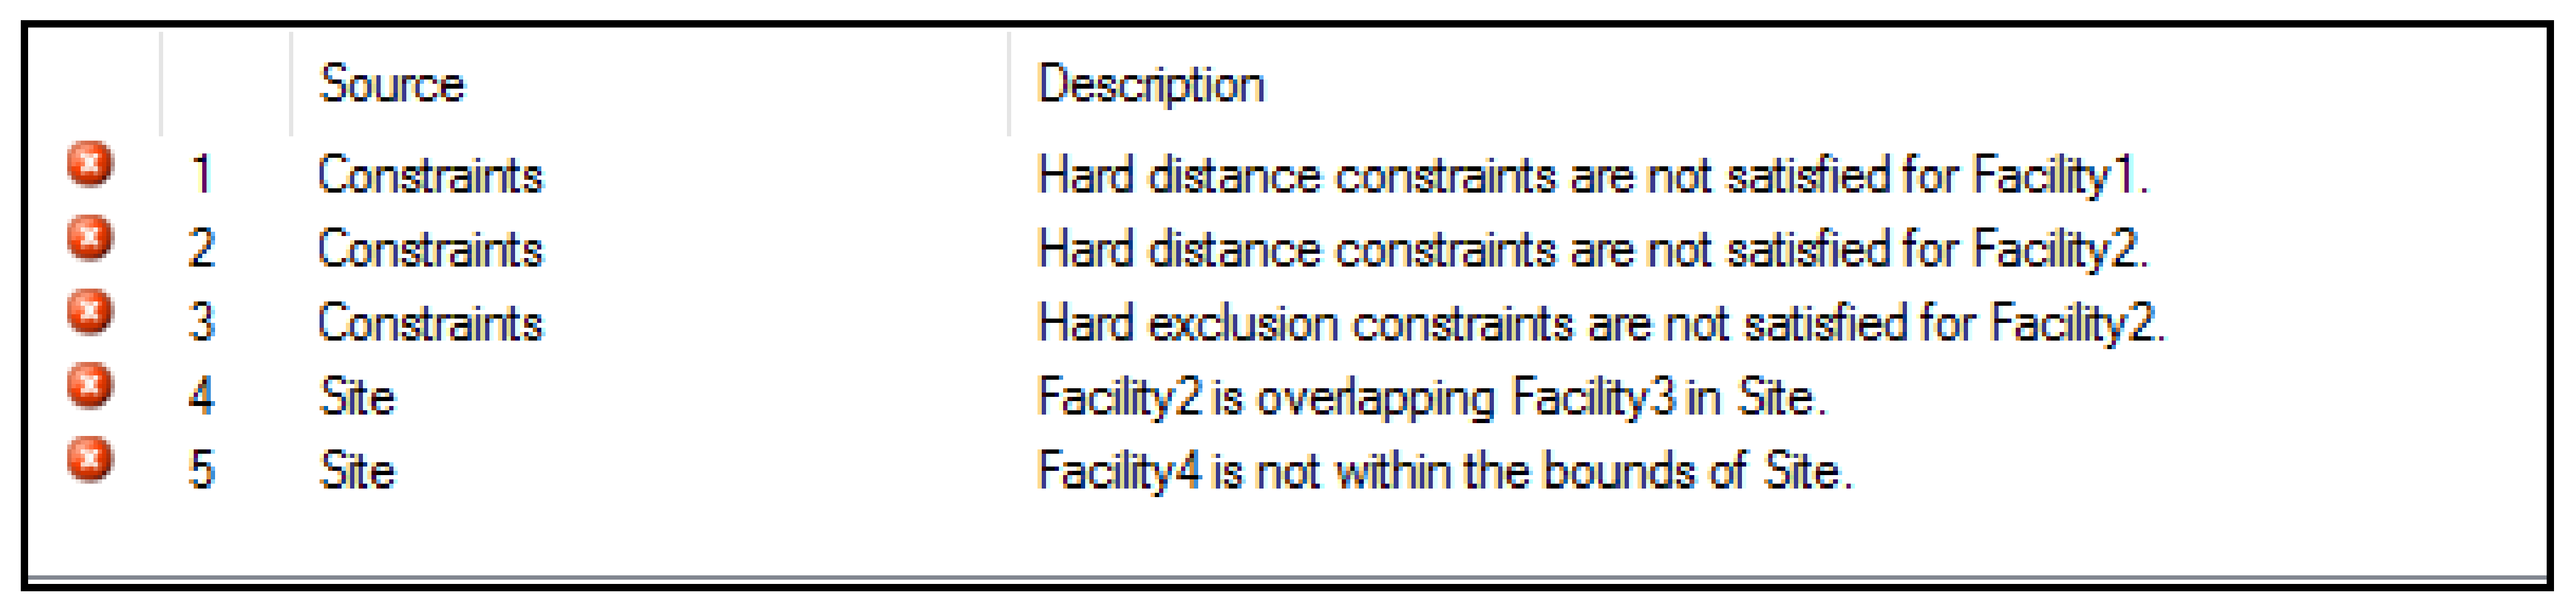
The constraint element is shown in Figure 2a inside the site element. Figure 4 demonstrates a sample of the GUI for defining distance hard constraints. All the constraints are automatically checked before running the simulation model. If any constraint is not satisfied, explanatory messages inform the user about it. Figure 5 demonstrates a sample of these messages. More details about the constraint element are presented in the Appendix A.
3.2. Simulation Components
The simulation components of the DST connect the site layout model and the DES model to have seamless interactions between them and to capture the impacts of the site layout on the project operations. These impacts can be made in two ways:
- By the location of the facilities, which affects the transportation distance/time between facilities;
- By the capacity of the material-dependent facilities, which can affect the workflow when materials are to be unloaded in the facility and sufficient space is not available in the facility.
It should be emphasized that, for identifying the impact of facility capacity on the project, the amount of material available in the facility, which determines the occupied and available space in the facility, should be identified. Further to this impact, the amount of available material can affect the workflow when materials are to be loaded from a facility and sufficient material is not available in the facility.
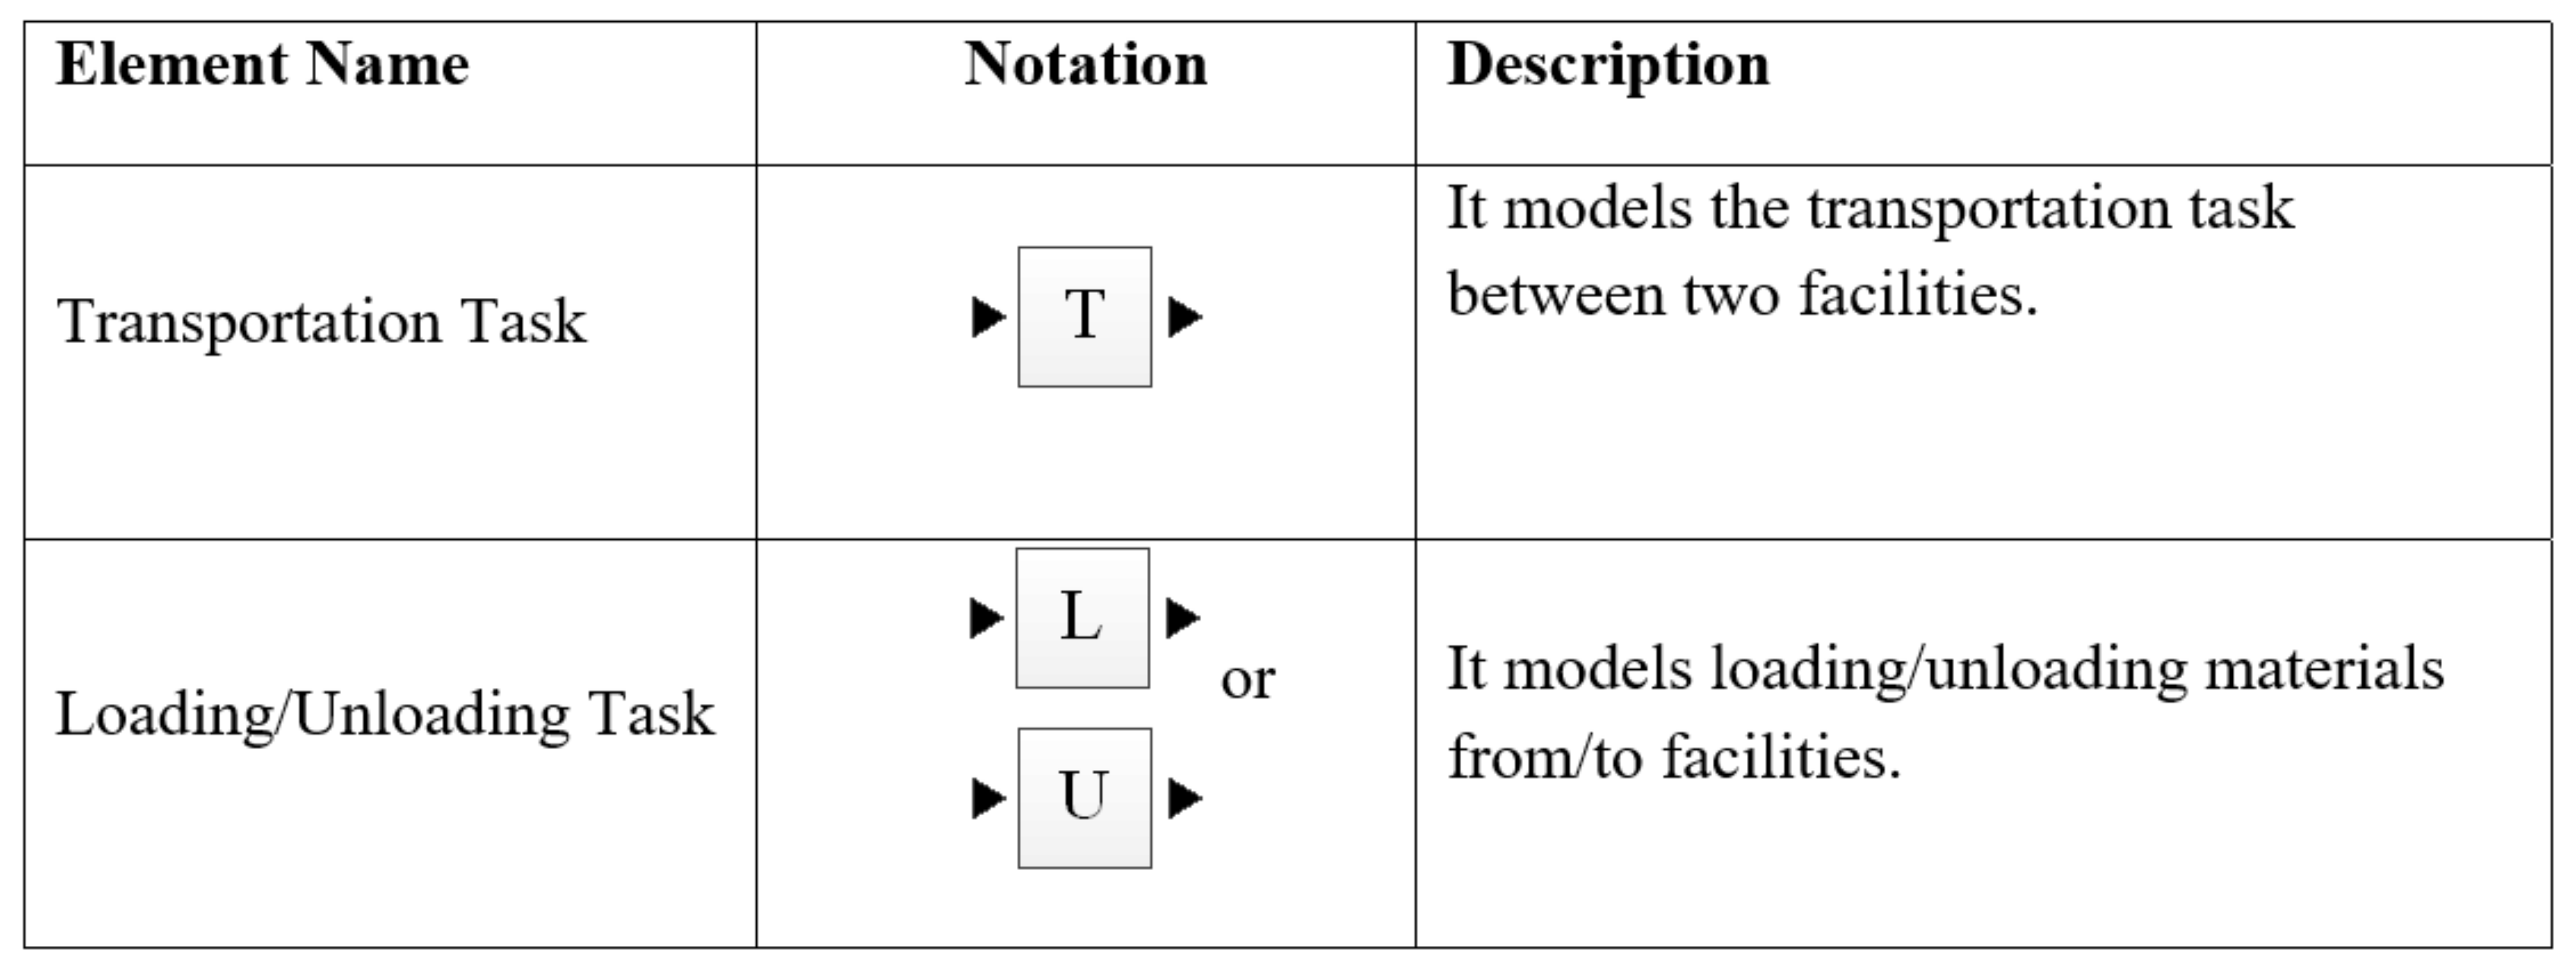
In order to seamlessly connect the site layout model to the DES model and capture the abovementioned impacts, some predefined elements are designed. For modelling the impact of facility location on transportation distance and time, a transportation task element was designed. For modelling the impact of capacity and available material of the material-dependent facilities on the workflow, a loading/unloading task element was also designed. These elements are used in the DES model to simulate the corresponding tasks using the information received from the site layout model and the information provided by the user. Figure 6 shows notation of these elements in the visualization window, as well as the description of these elements. In addition to these elements, some simple programming code can be used to access the values of the facility properties. The details of the elements and codes are described below.
3.2.1. Transportation Task Element
This element is used in DES to model on-site transportation tasks between two facilities. The functionality of this element is similar to the generic task element existing in GPT. In GPT, once the entities (i.e., the objects circulating in the model elements) enter into a generic task element, they remain there for the time specified by the duration of the task. Then, they leave the task element. In this process, two events occur in DES: (1) starting a task when an entity enters the task element, and (2) finishing the task when an entity leaves the task element. The transportation task element runs in the same way and its main property is the duration, which is determined by the distance between facilities and the velocity of the means travelling between these facilities. This information is specified in the property window of the element as follows:
- Velocity (V), which determines the velocity of the means of transportation;
- Source facility, which determines the facility from which the transportation starts;
- Destination facility, which determines the facility at which the transportation ends;
- Resource, which determines the resource(s) or means of transportation deployed for executing the task if the user intends to model them;
- Method of distance measurement, which determines the method used for measuring the distance between the specified facilities. The user can select between two equations, perpendicular and Euclidean distance functions, which are calculated as Equations (1) and (2), respectively:
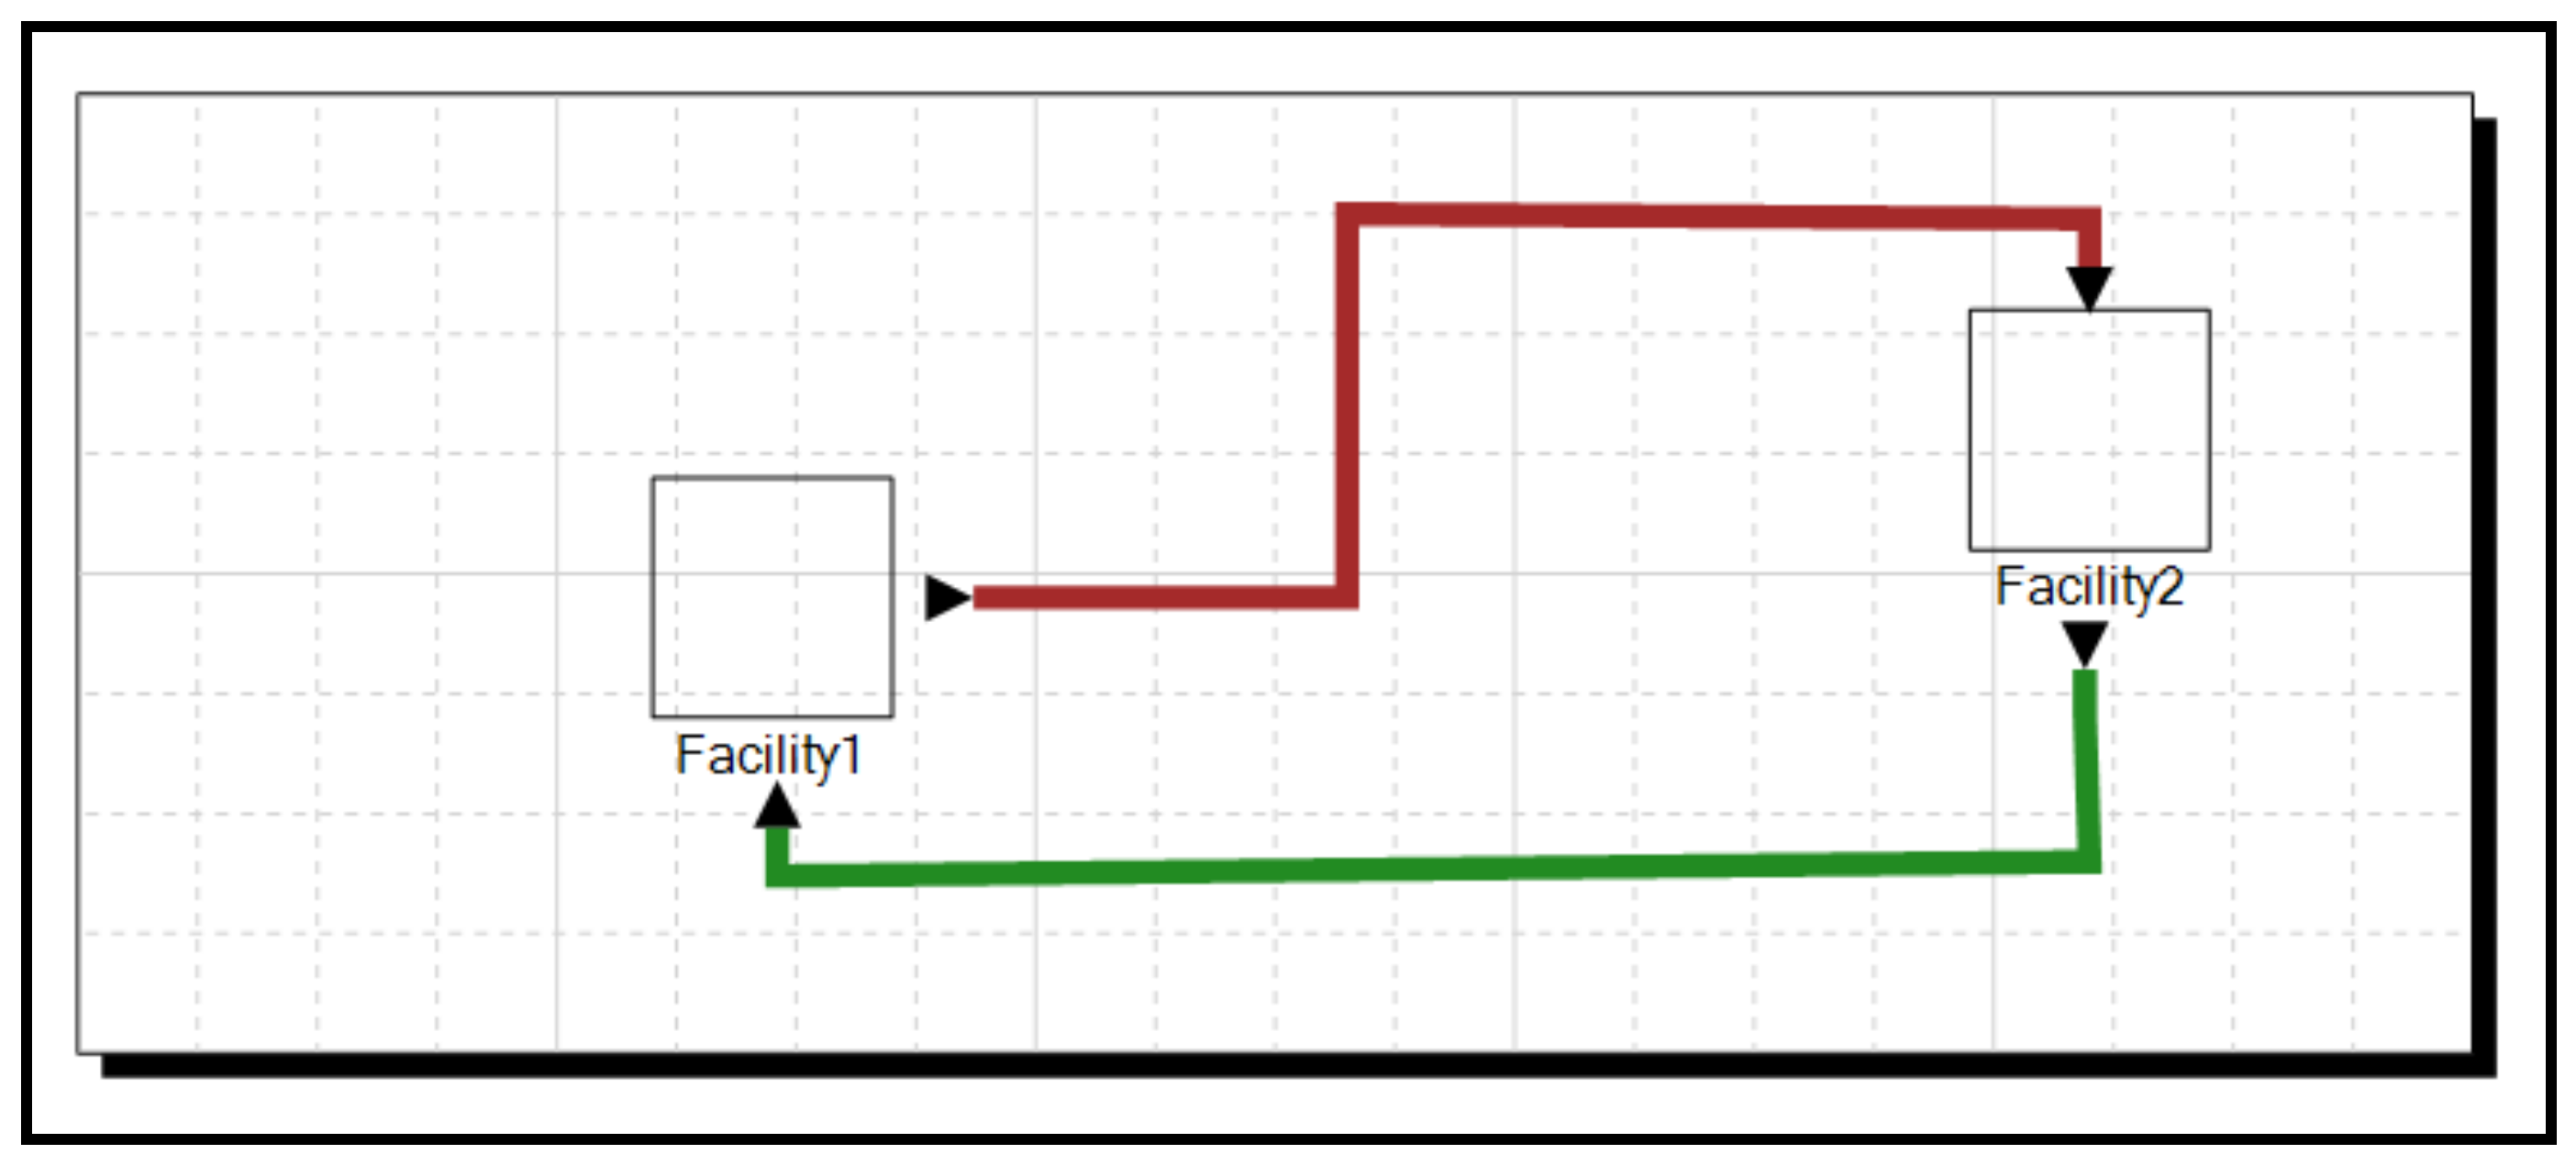
A third method is available to the user in which they can draw links between facilities as the transportation paths; the distance is then calculated based on the lengths of the links. Figure 7 demonstrates the drawn links between facilities. As seen in this figure, the path from Facility 1 to Facility 2 (red line) can be different from the path from Facility 2 to Facility 1 (green line), which is automatically recognized in the model.
Once an entity enters the transportation task element, the distance (D) between the specified facilities is calculated based on the selected distance measurement method. Then, the duration (T) of the transportation is calculated as follows:
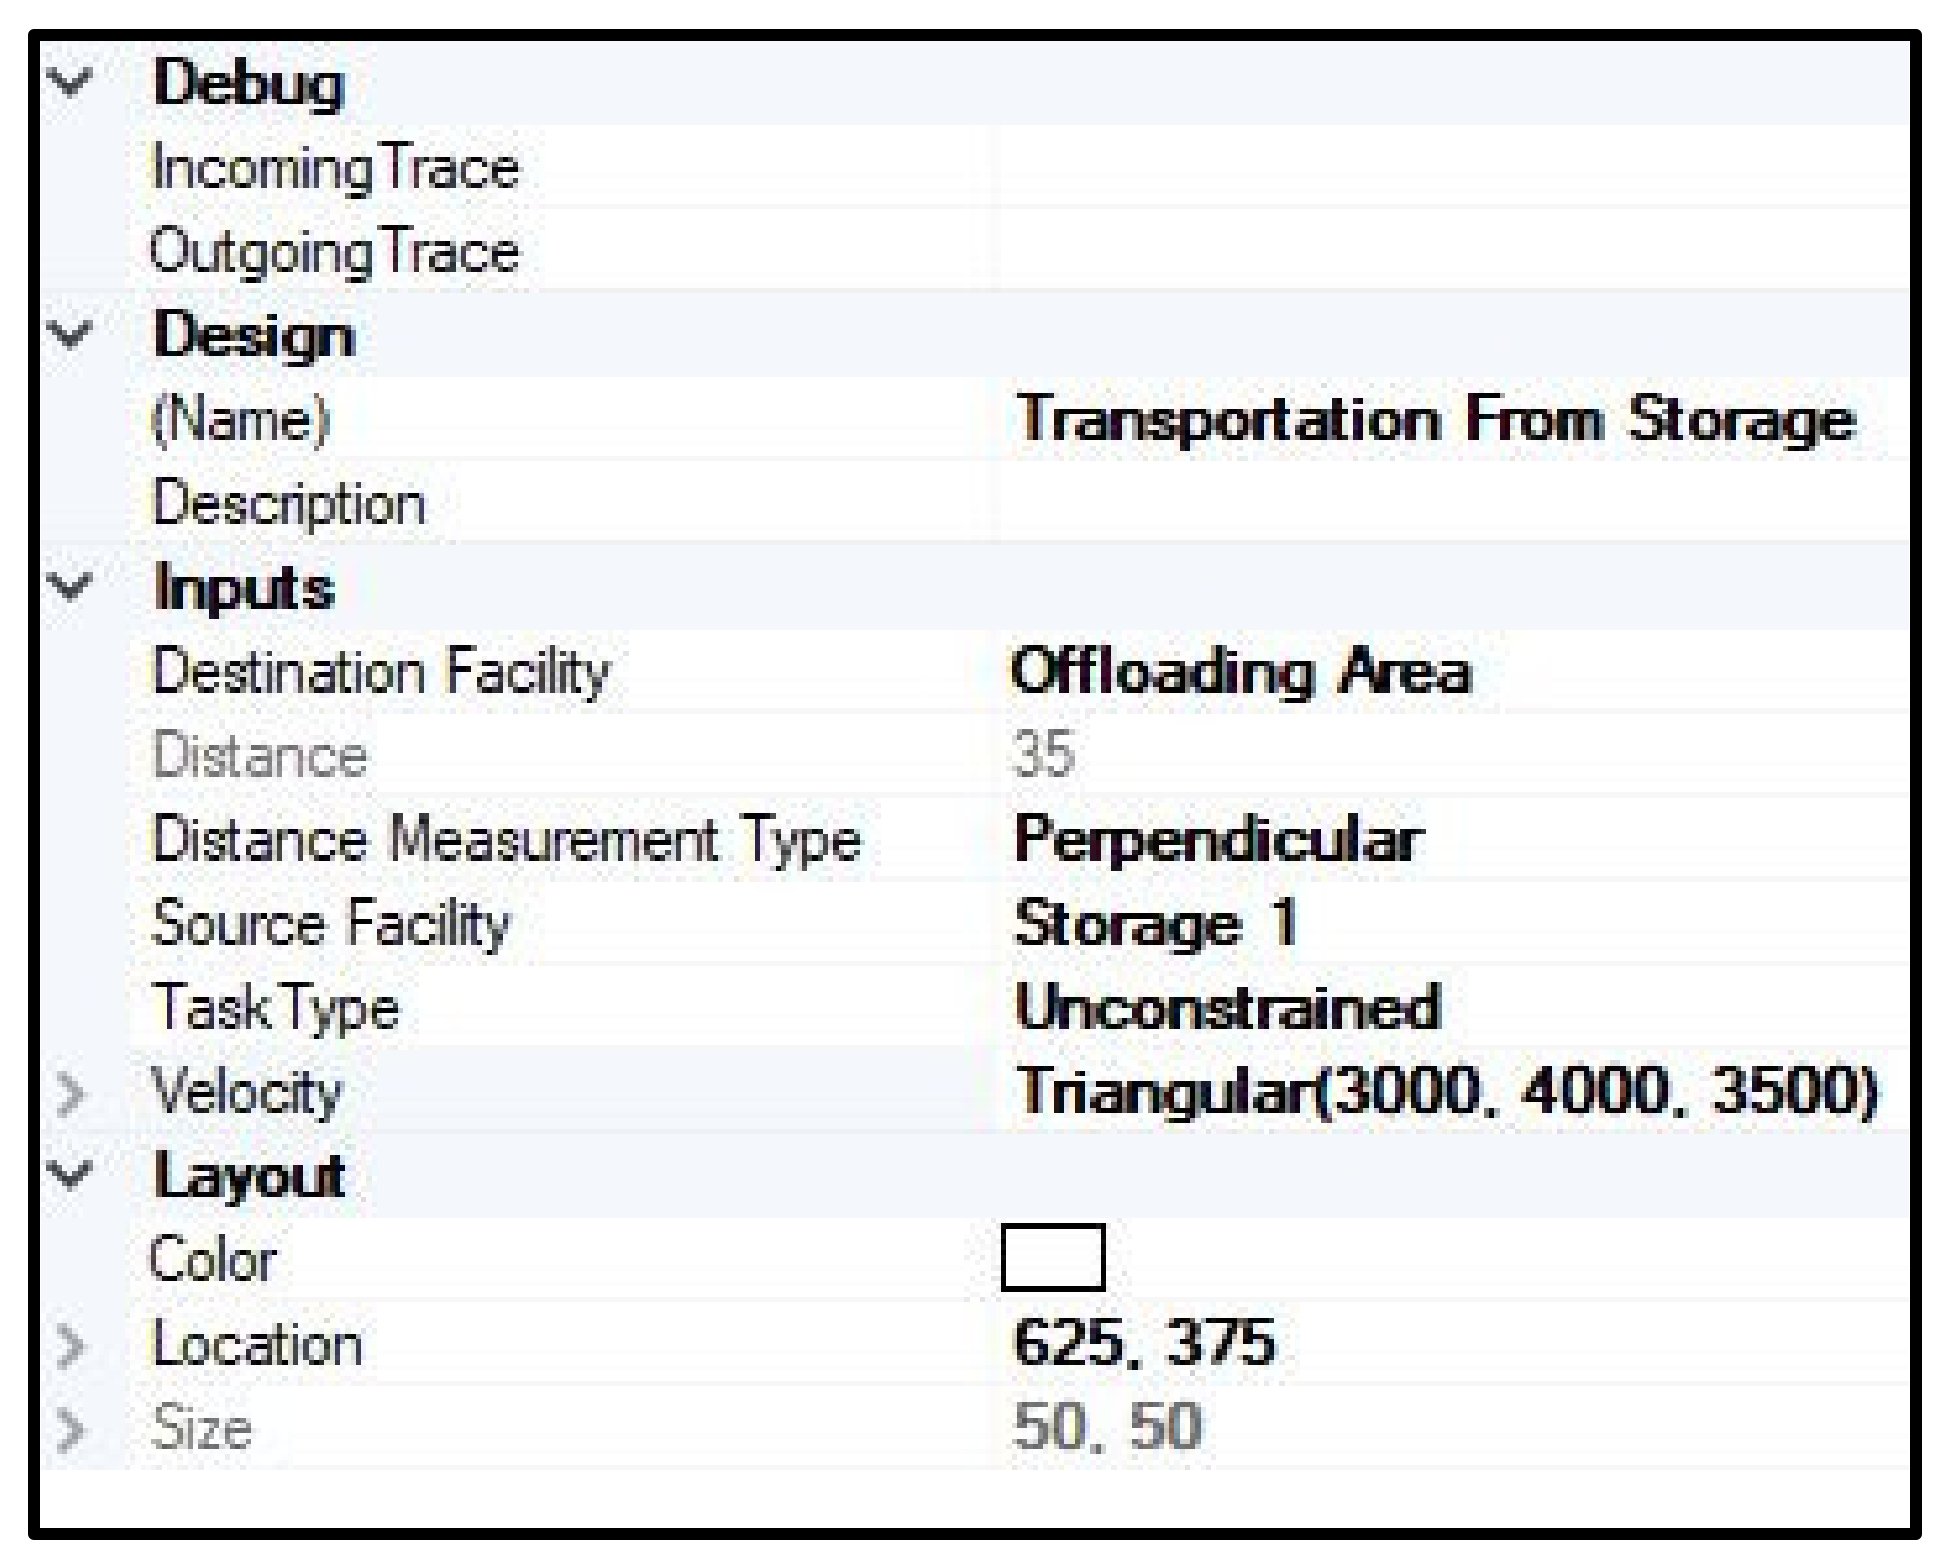
If the user models any resource, the specified resource is captured at the starting time of the task and released at the finishing time of the task. The general approach for modelling the resources in DES is that, if the specified resource is not available, the entity stays in a queue for capturing the resource, and the task does not start until the resource becomes available for that entity. It is noteworthy that the velocity value can be determined stochastically using probabilistic distributions (e.g., uniform, triangular, beta). As a result of using this element, if the user changes the location of the facilities on the site, no further changes in the simulation model are needed, as the changes are effortlessly reflected in calculating the distance and duration of the transportation task. Figure 8 displays a sample property window of a transportation task.
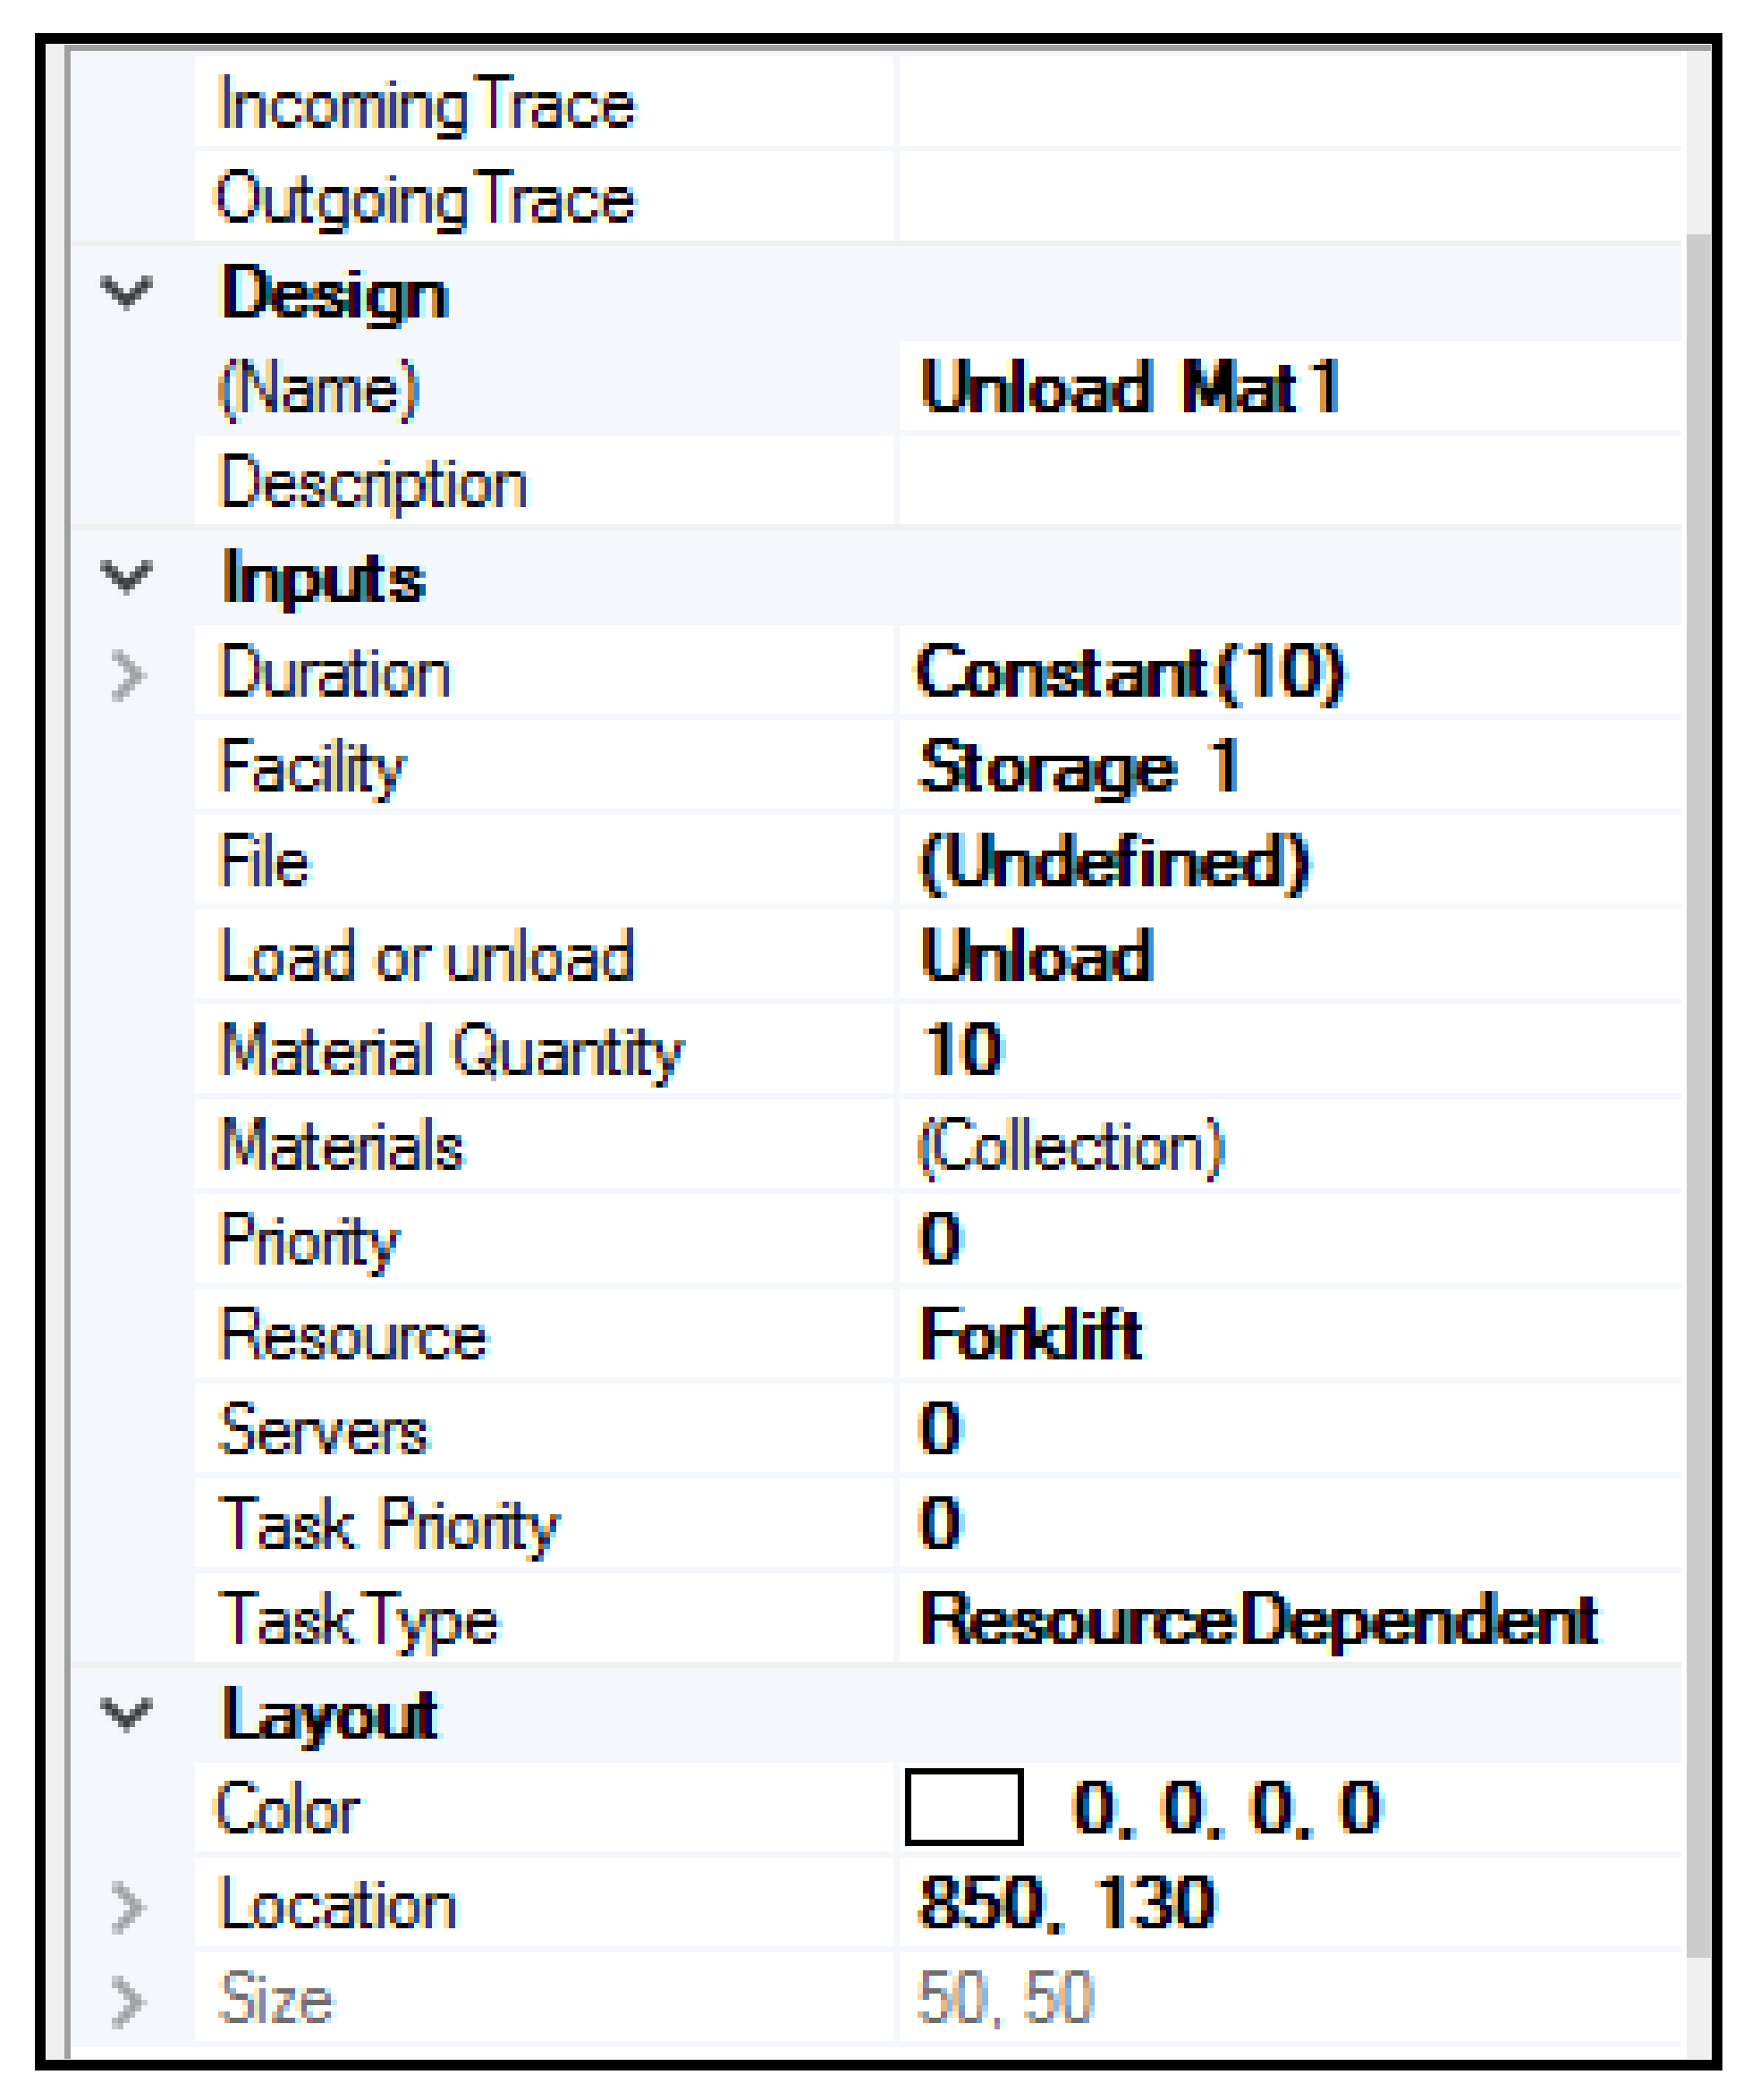
3.2.2. Loading/Unloading Task Element
The loading/unloading task elements model the activity of loading/unloading material from/in the material-dependent facilities, and create the same two events in DES as mentioned above. At the start-time of this task, the element receives facility information (i.e., the capacity and available material), while at the finish time of the task, it updates the value of the available material. If the task is loading, it reduces the amount of available material in the facility, while if the task is unloading, it increases the amount of available material. Thus, using this task, a two-way information flow is created between the site layout and the DES model. The properties of this task are as follows:
- Type of task, i.e., either loading or unloading;
- Duration, which determines the duration of the task;
- Facility name, which determines the facility in which loading and unloading happen;
- Material type, which determines which types of material are loaded from or unloaded in the facility;
- Material quantity, which determines the quantity of materials loaded from or unloaded to the specified facility;
- Resource, which determines the resource, such as equipment, deployed for executing the task if the user intends to model it.
As the required material should be available in the facility in order to execute the loading task, and as the required space should be available in the facility in order to execute the unloading task, two predefined resources, material and space, are modelled for material-dependent facilities. Then, through execution of the loading task, some space as a resource is released in the facility and, through execution of the unloading task, some quantity of material as a resource is released in the facility. The required material/space for loading/unloading task is identified by means of the material quantity given by the user as a property of the element. If the task starts at time t1 and ends at time t2, the following formula is used to update the available material at time t2:
where “−” indicates a loading task and “+” refers to unloading.
Available Material (t2) = Available Material (t1) ± Material Quantity
Available space at any time (t) in the facility also depends on the available material at that time and the capacity of the facility, calculated as follows:
Available Space (t) = Capacity − Available Material (t)
It is noteworthy that available material and capacity are the properties of the material-dependent facilities and, if the facility is capacity-unconstrained, available space is also considered to be unlimited.
As a result of modelling material and space as resources, material/space is captured at the starting time of the loading/unloading task and space/material is released at the finishing time of the task. As such, if the required resource (i.e., material or space) is not available, the entity stays in a queue for capturing that resource, and the task does not start until the resource becomes available for that entity. It should be emphasized that, for greater flexibility, the model is capable of selecting multiple types of material for a single loading/unloading task.
The resource given in the property of element by the user can be used for modelling the other resources required for execution of the task, such as equipment. The duration of the task can also be either deterministic or stochastic. Figure 9 displays a sample property window of a loading task.
3.2.3. Programming Codes
{SiteElement Facility = Scenario.GetElement<SiteElement>(“Facility 1”);
var X = Facility.MaterialCapacity;}
4. Case Study
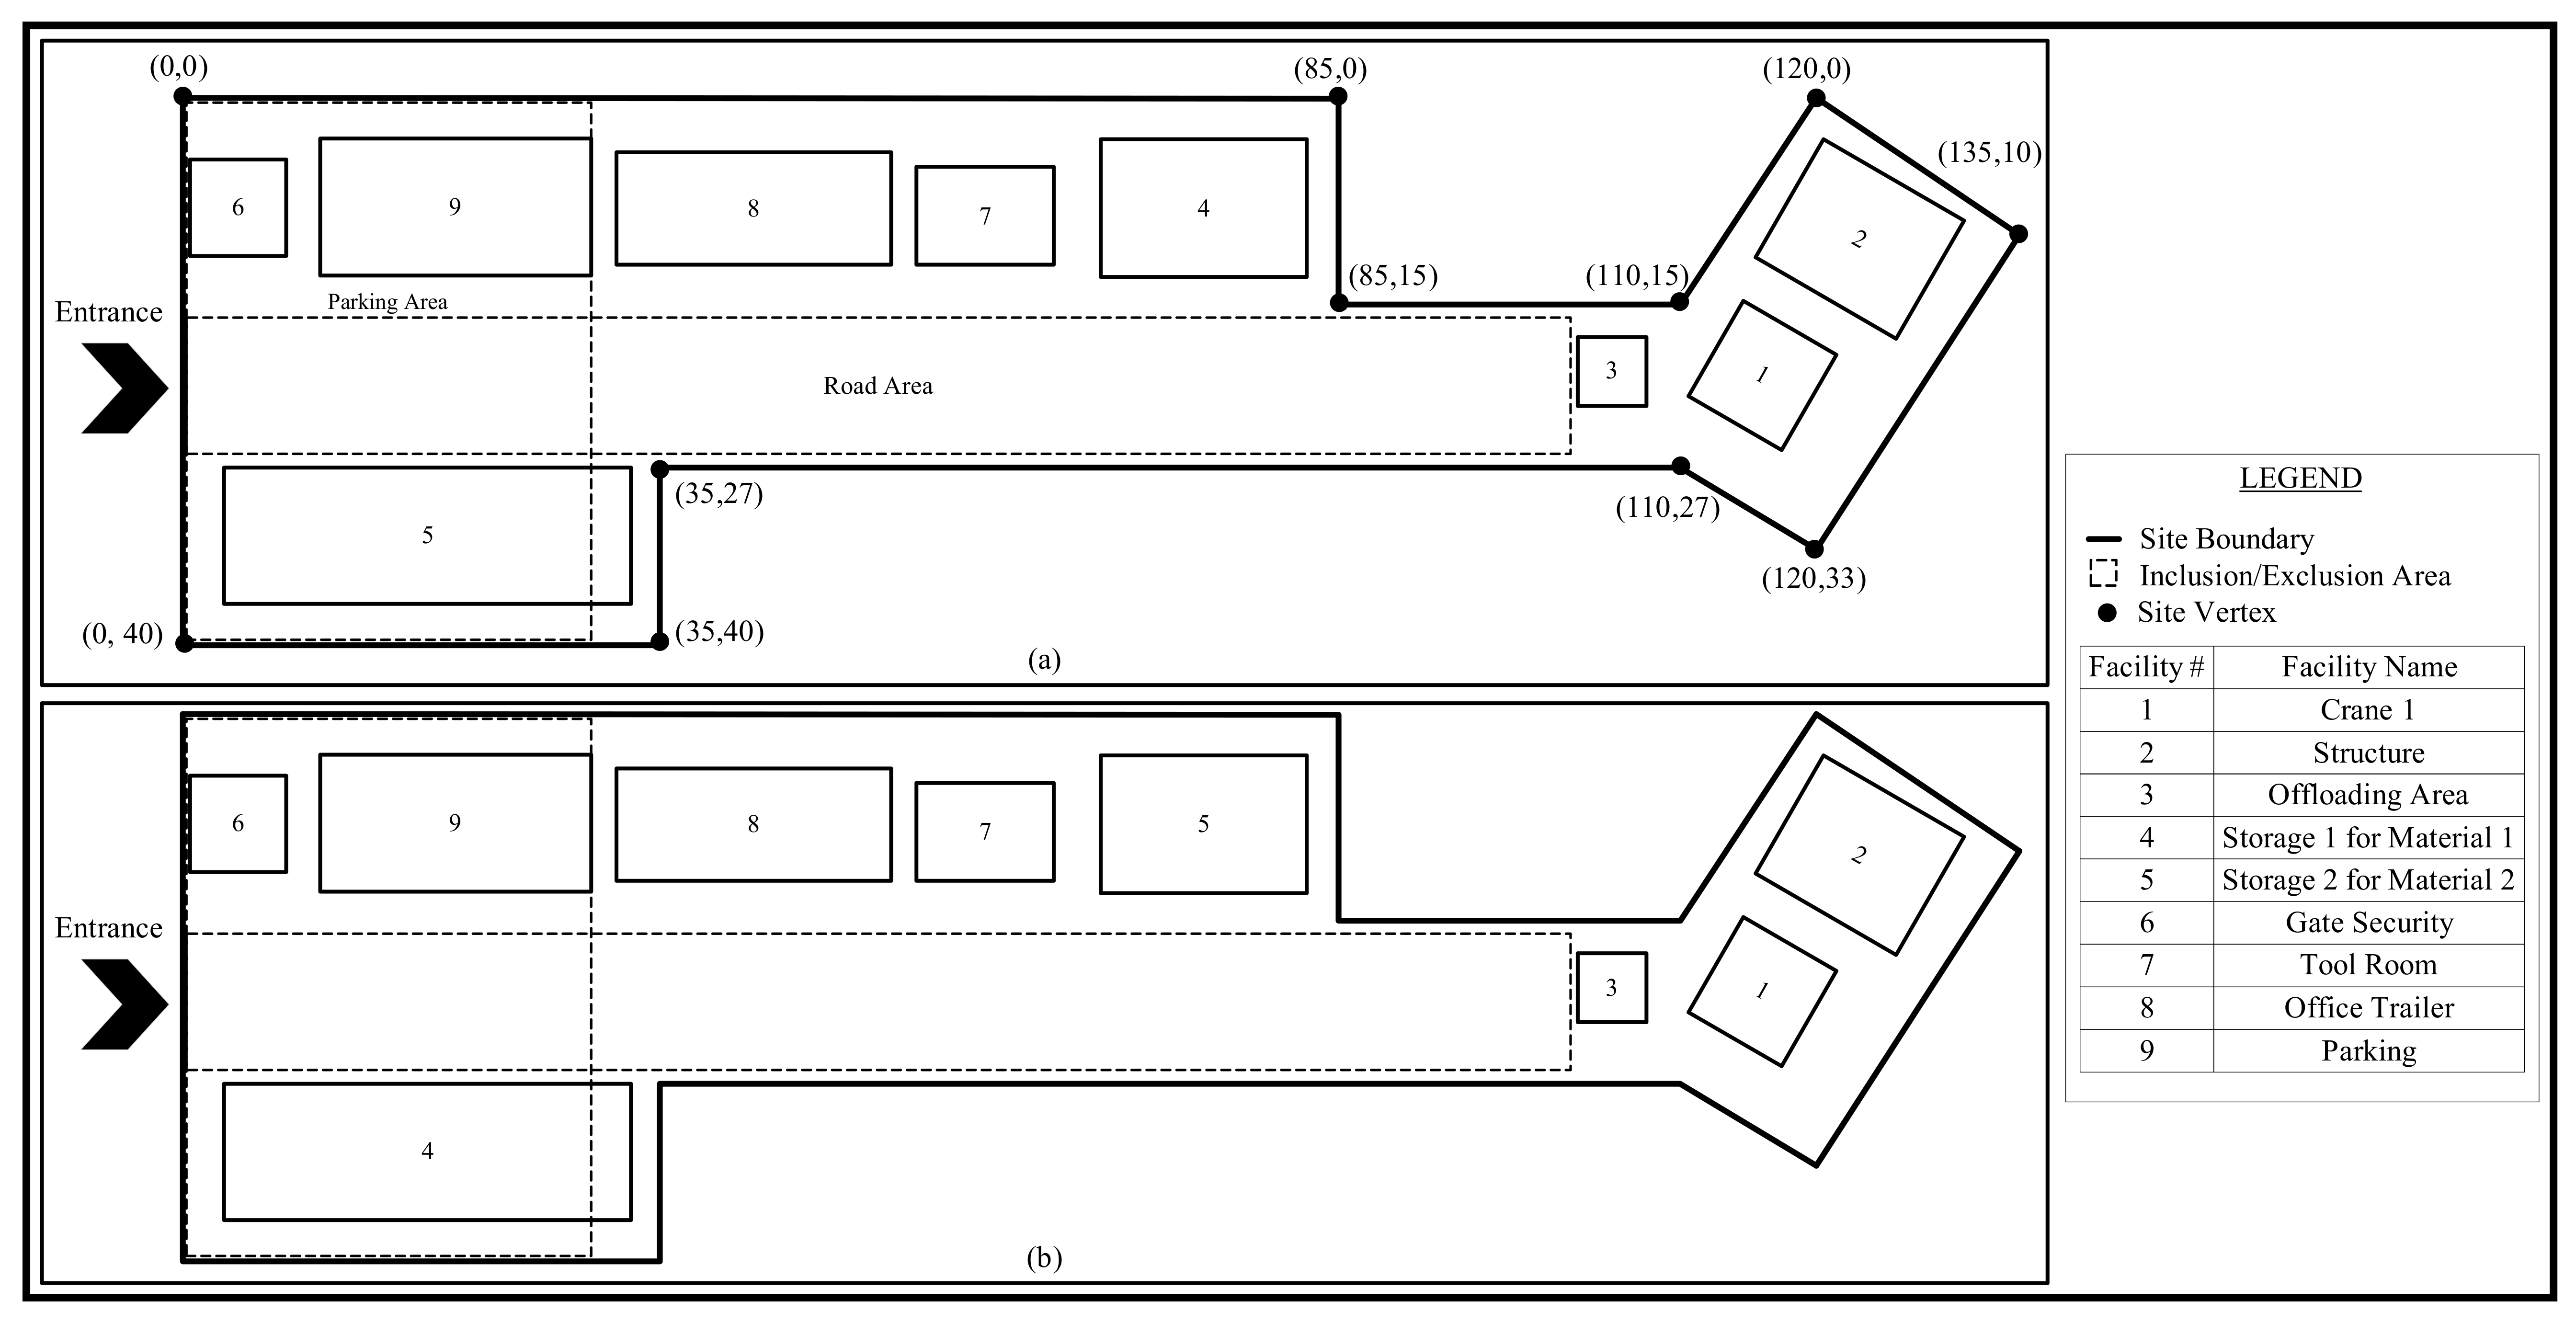
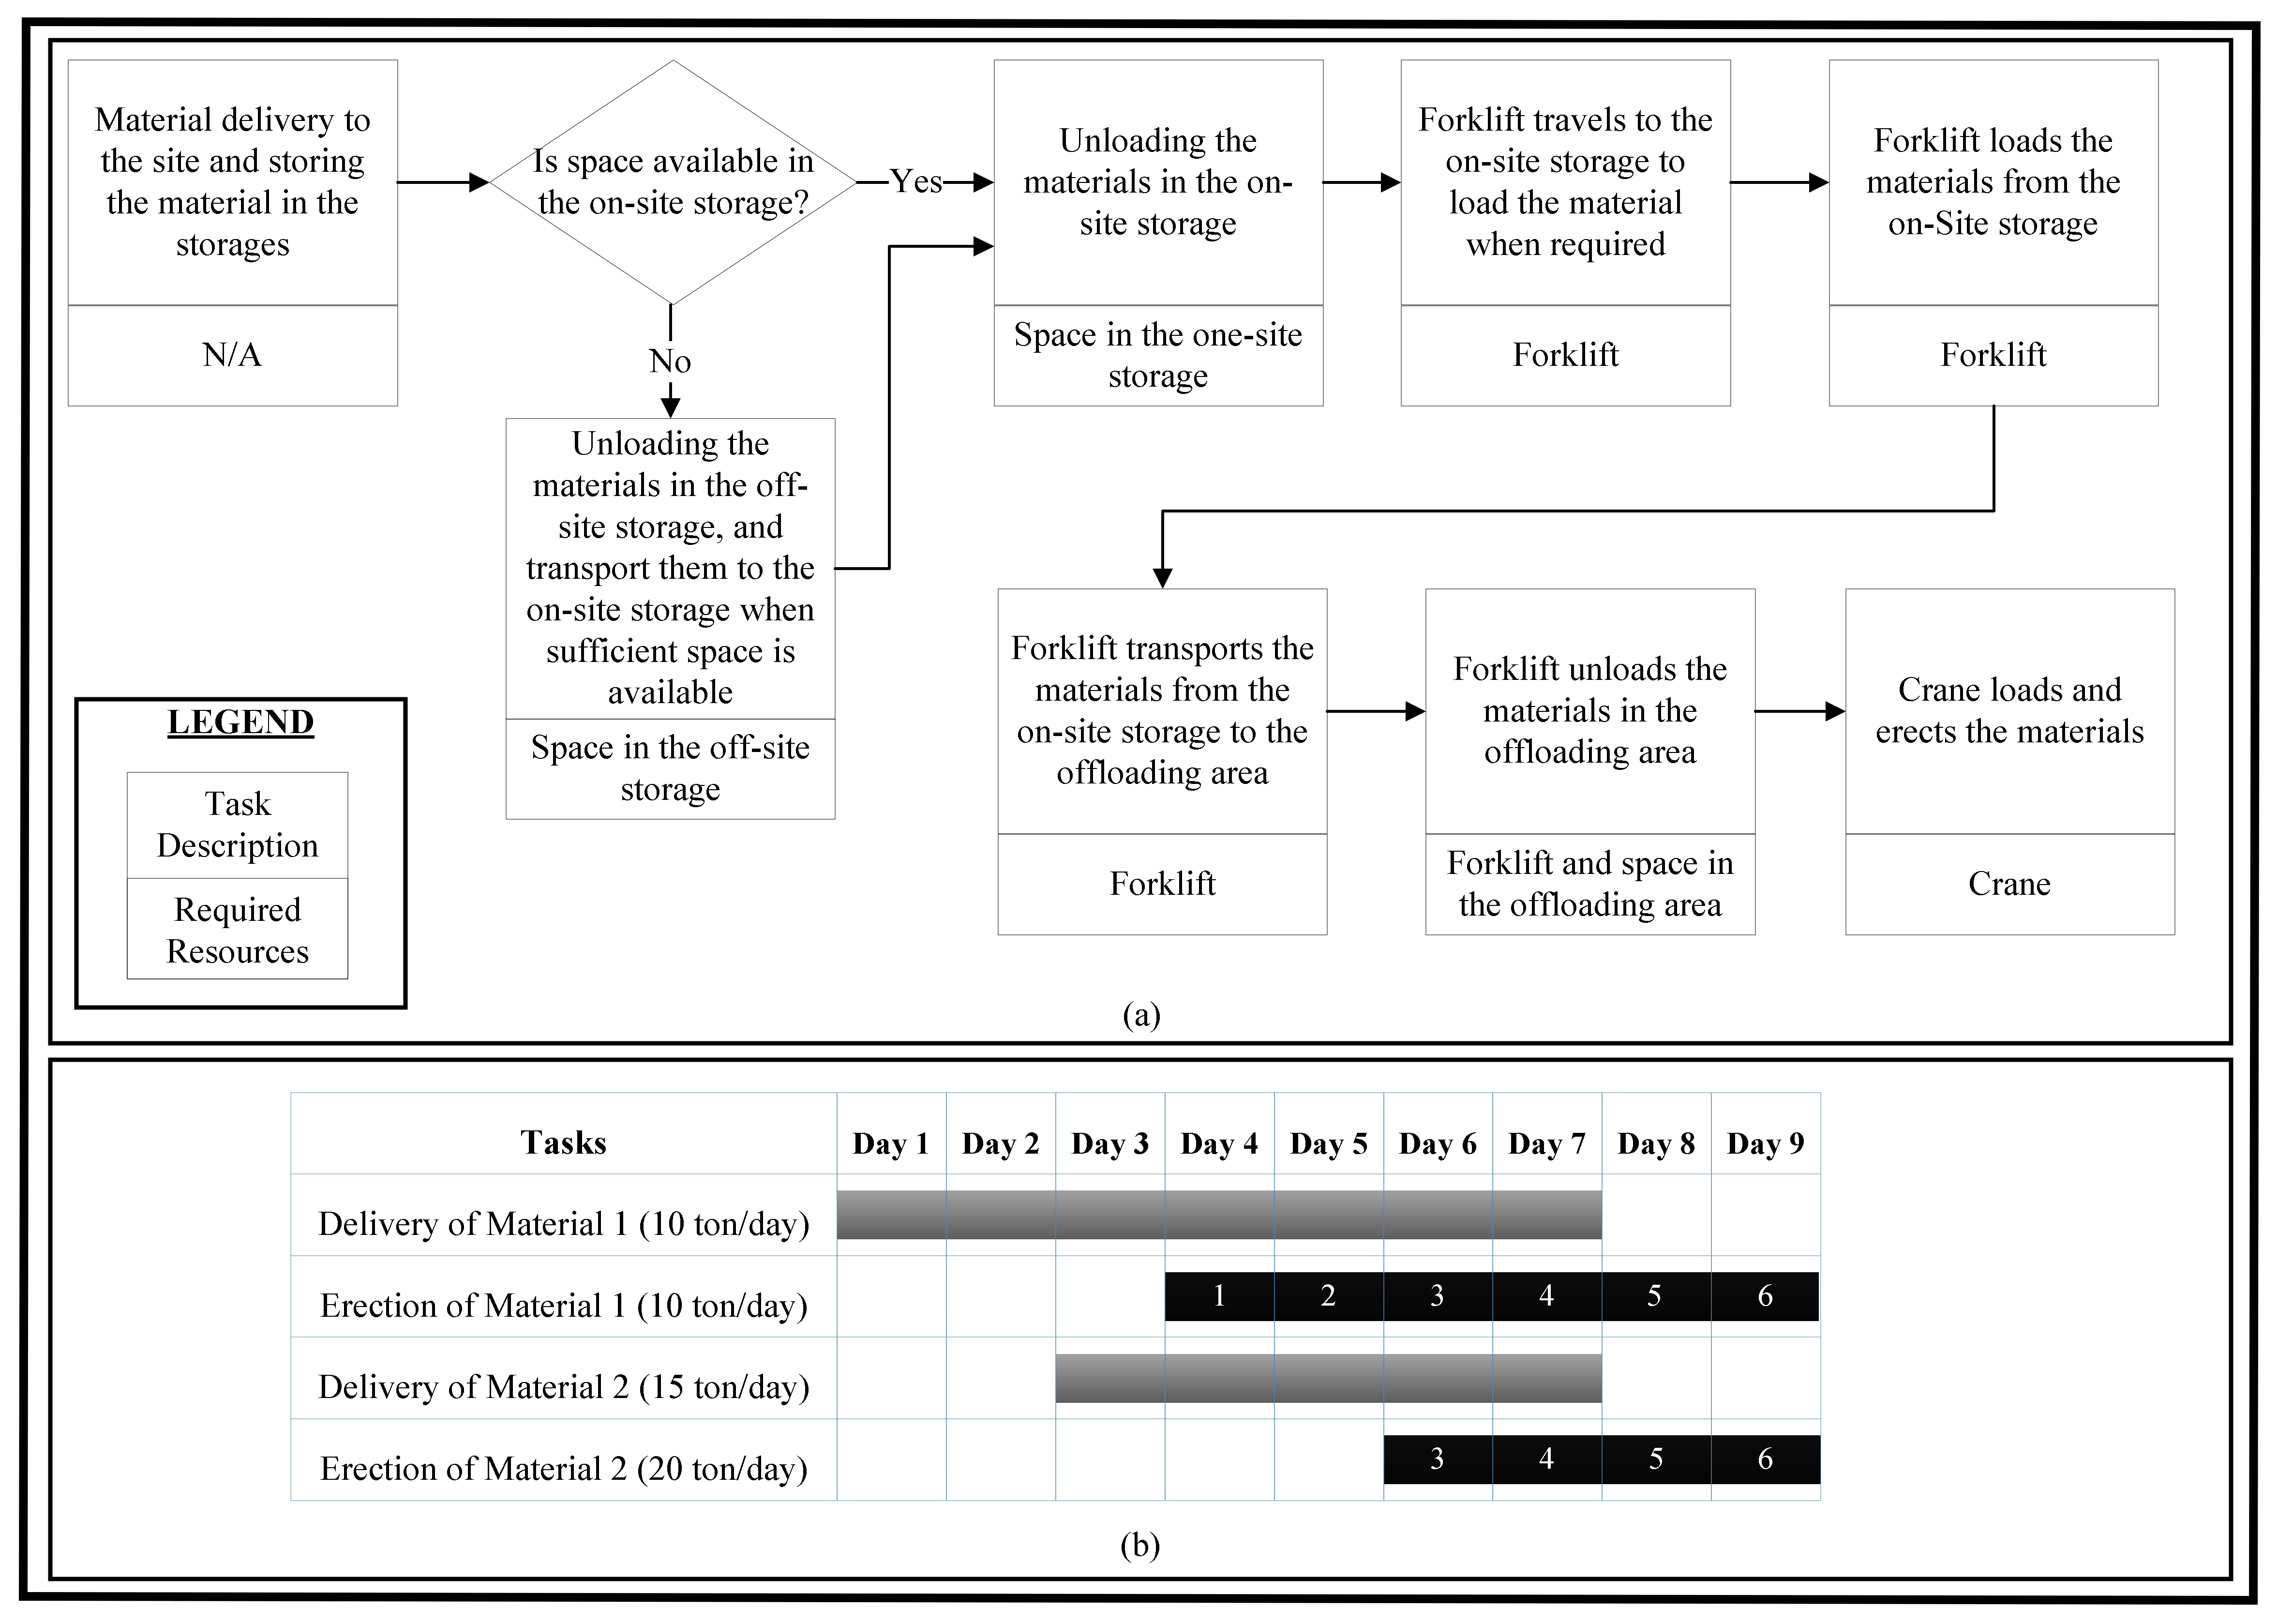
The developed DST was used to simulate a steel erection process and to experiment with two site layout alternatives as depicted in Figure 10. The construction process modelled in this case study was inspired from a real project in Canada. The process involves delivering to the site two types of steel materials, referred to as Material 1 and Material 2, storing them in storage facilities, moving stored materials to the structure being erected, and erecting the materials. The details of this process and the required resources are shown in Figure 11a. As seen in this figure, the materials are stored in the on-site storage facilities (Storage 1 for Material 1 and Storage 2 for Material 2) if the facilities have sufficient space. Otherwise, the materials are stored in the off-site storage facility and transported to the site when there is sufficient space on site. This incurs extra costs for rental of off-site storage space and transportation between off-site and on-site storage facilities. On the site, a forklift for transportation of materials from the on-site storage to the structure being erected, and a crane for erecting the materials, are deployed. The plan for material delivery as well as the delivery rate and the estimated steel erection rate are illustrated in Figure 11b. In this figure, the numbers on the bars indicate the sequence of material erection on each day. As the forklift and crane are shared between the two types of material, for capturing the forklift and crane for the materials, the priority is given to the material with a lower sequence number. If the sequence numbers are equal, Material 2 has a lower priority. Availability of space in the offloading area is required as another resource for transporting materials from the storage facility to the structure being erected. Owing to the uncertainties in the material supply chain, a 10% chance material delivery delay by 1 to 2 days is considered for each day. The worker travel time from the office trailer to the tool room and then to the working area at the beginning of the shift, and returning to the office trailer at break time and at the end of the shift, is also considered in the model. The input information for creating the simulation model is given in Table 1.
The characteristics of the layouts and the constraints for positioning facilities are presented in Table 2 and Table 3, respectively. As seen in Figure 10, the main difference between the layouts is the location and size of the material storage facilities. In layout (a), Storage 1 is closer to the structure, but its size is smaller, whereas Storage 2 is farther from the structure, but it is larger than in layout (b). As more material is transported from Storage 2 to the structure, the rule of thumb would suggest it should be positioned closer to the structure in order to reduce transportation time while improving production rate and reducing operation cost. However, the smaller size of Storage 2 means that it is more likely to be short of space for material storage, introducing the concern that the cost for off-site storage may exceed the cost saved by locating it closer to the structure. Owing to the uncertainties inherent in activity durations and material supply chain as well as the complexity of the resource interactions, conventional methods cannot accurately estimate these costs. Thus, simulation is employed to model the process and compare the cost efficiency of the two layouts.
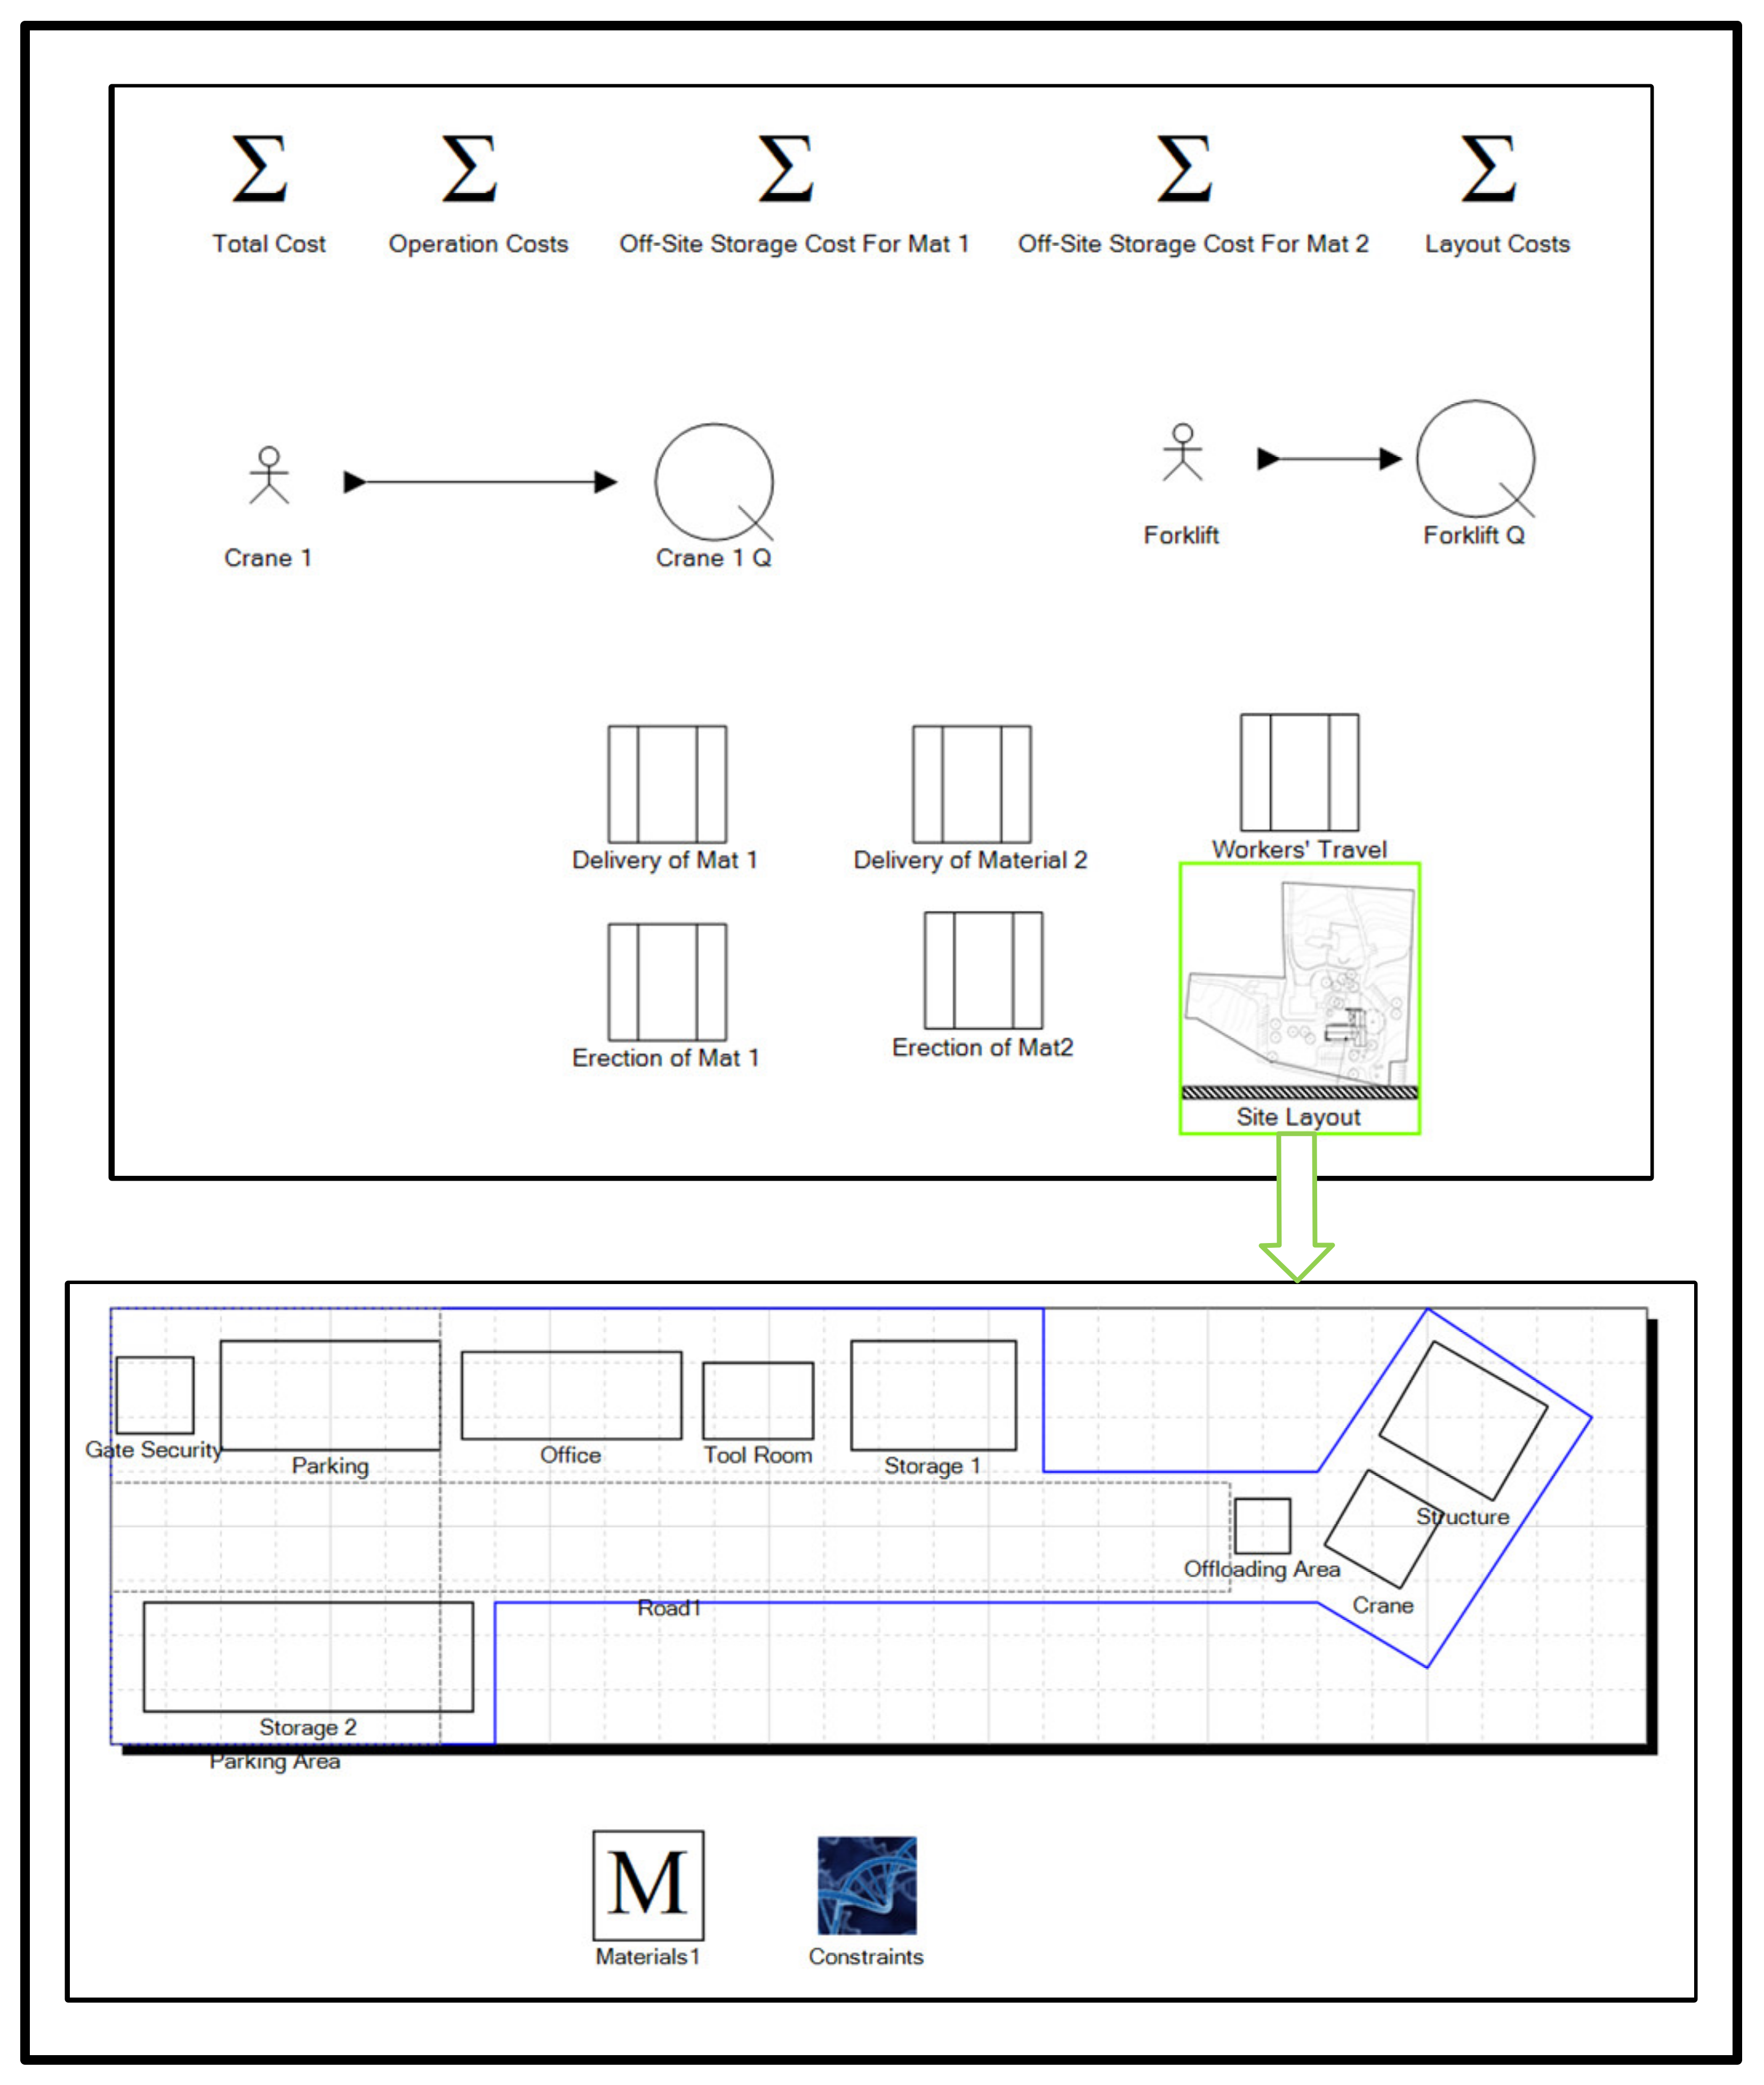
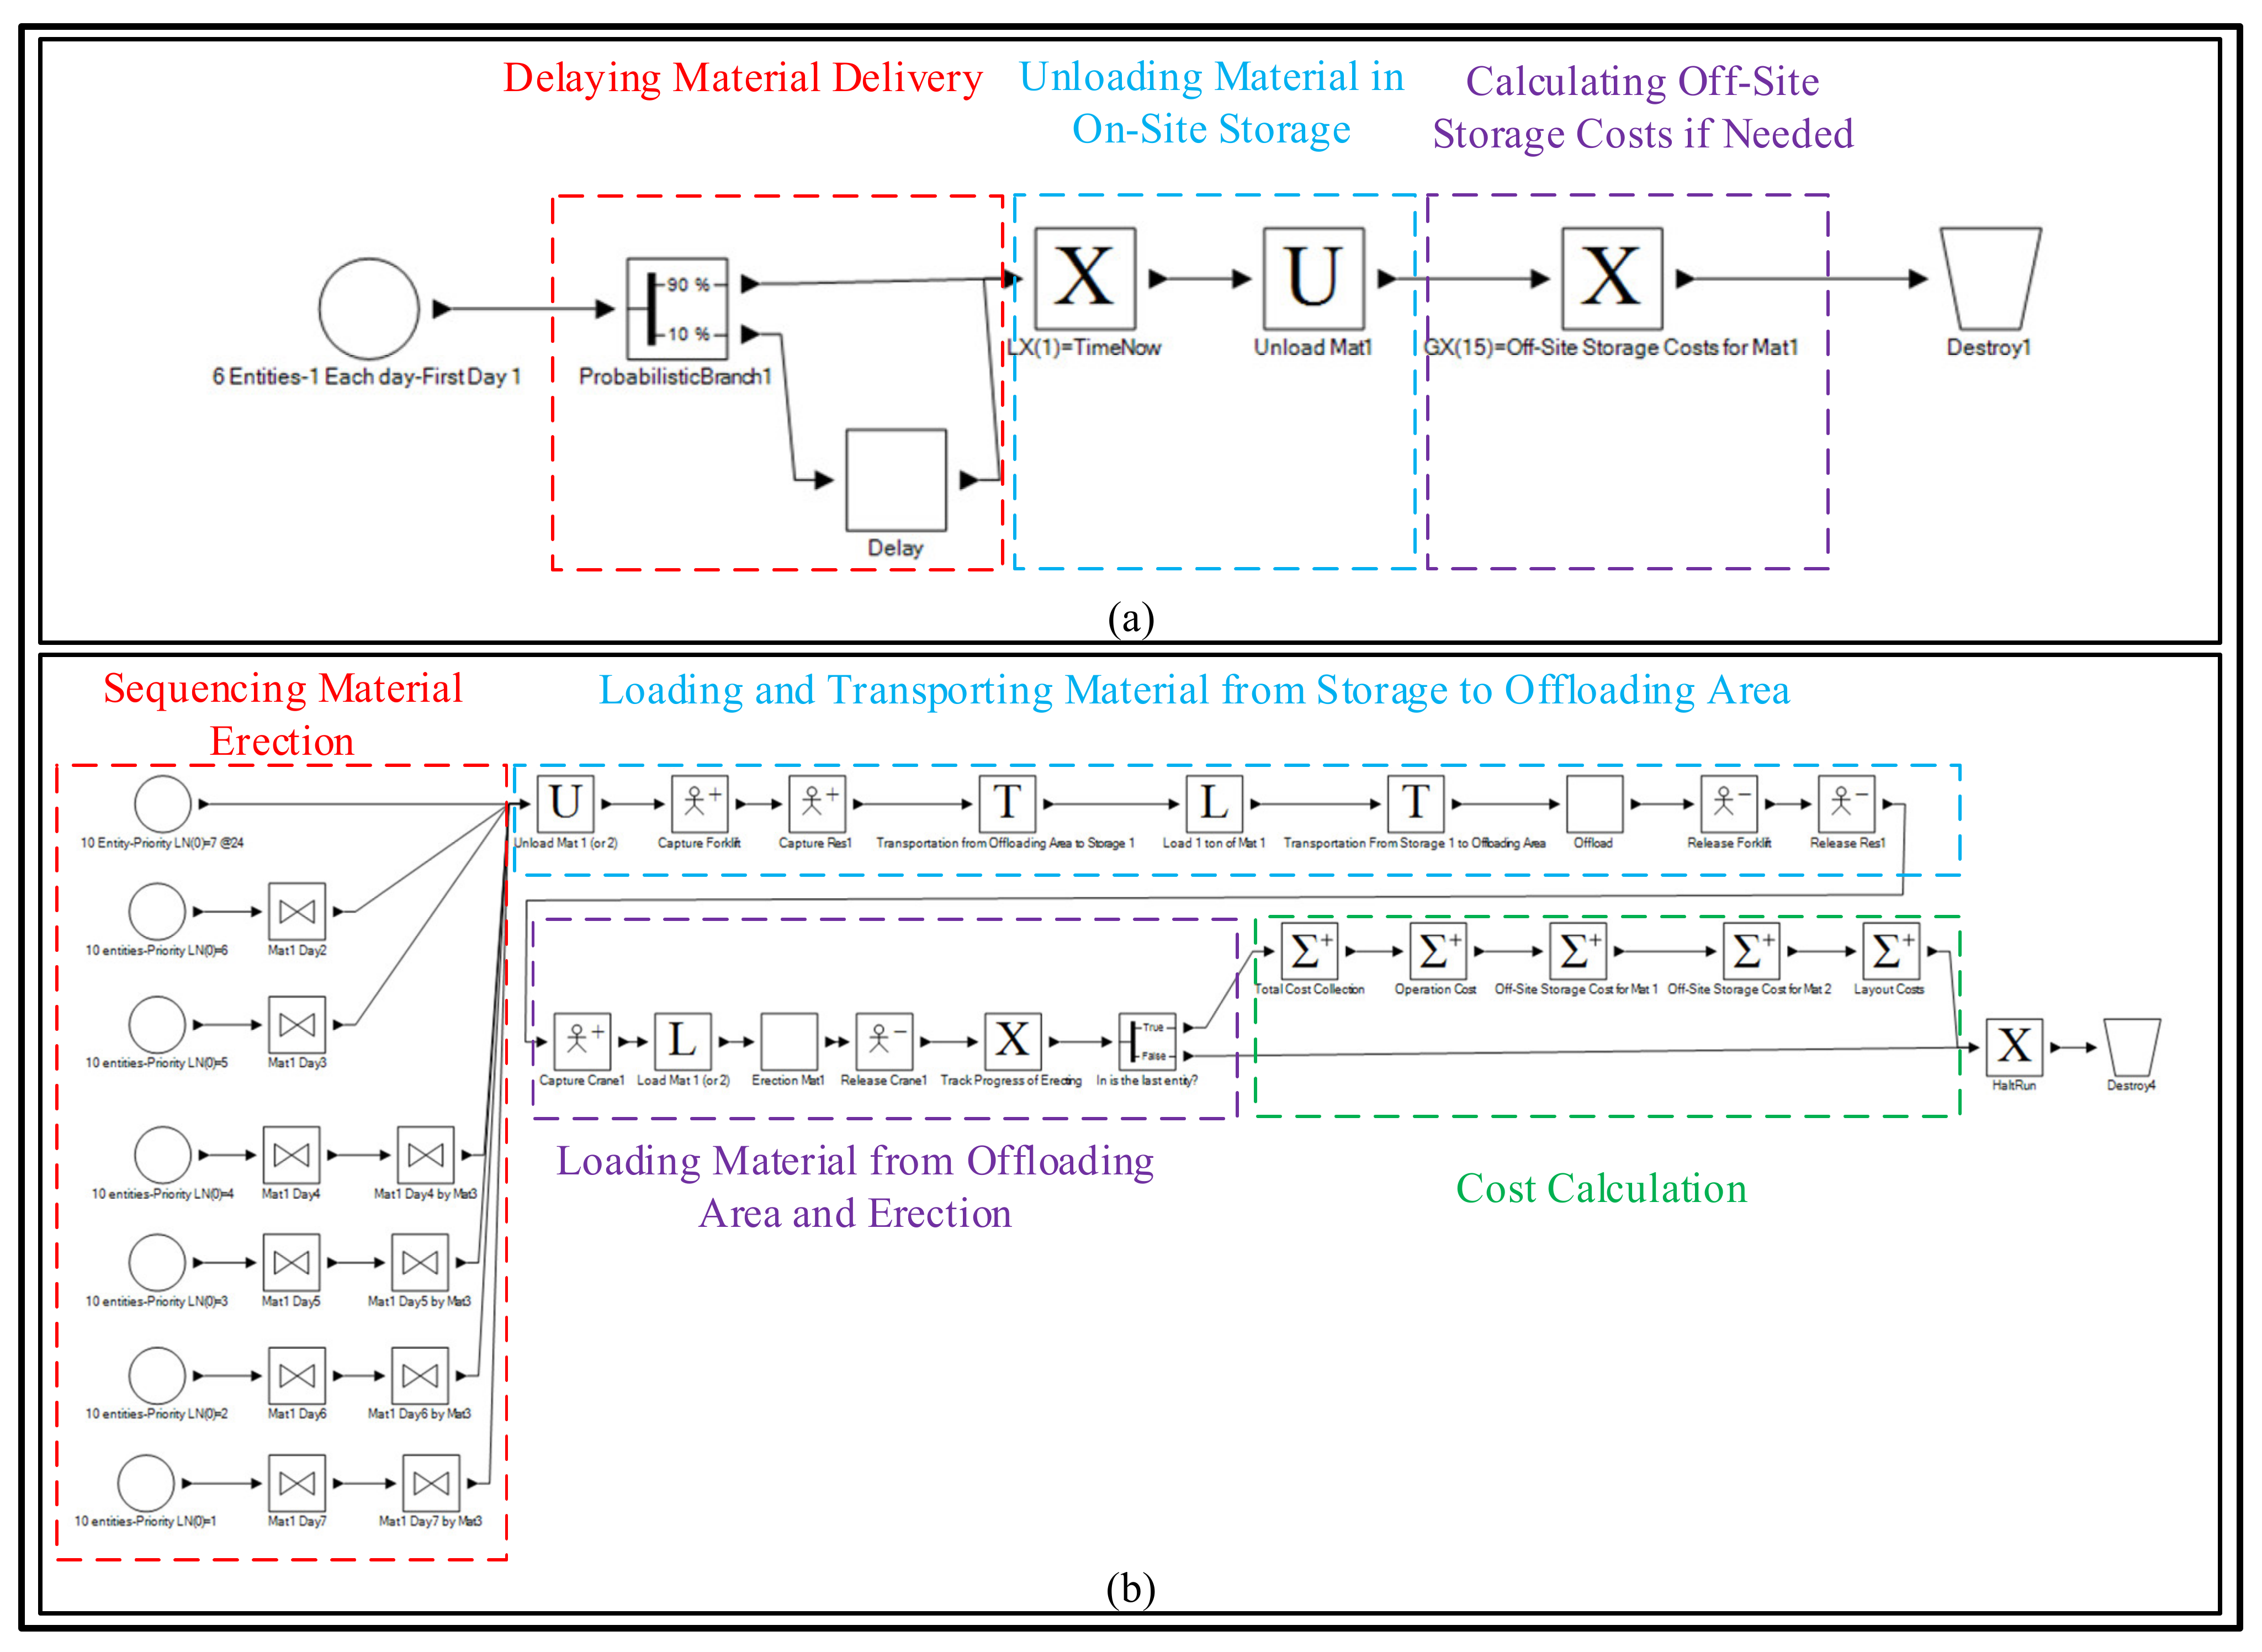
The simulation model has five blocks (two for delivery of Material 1 and Material 2, two for erection process of Material 1 and Material 2, and one for crew travel time), which interact with each other by sharing resources, including material, space, crane, forklift, and crews. The overview of the created simulation model and the site layout is shown in Figure 12. In the first four blocks of the simulation model, the entities are the steel materials, which are circulating in the model. The project is run for 8 working hours per day. Figure 13a,b displays an overview of the modelling of delivery and erection of Material 1.
5. Results and Discussion
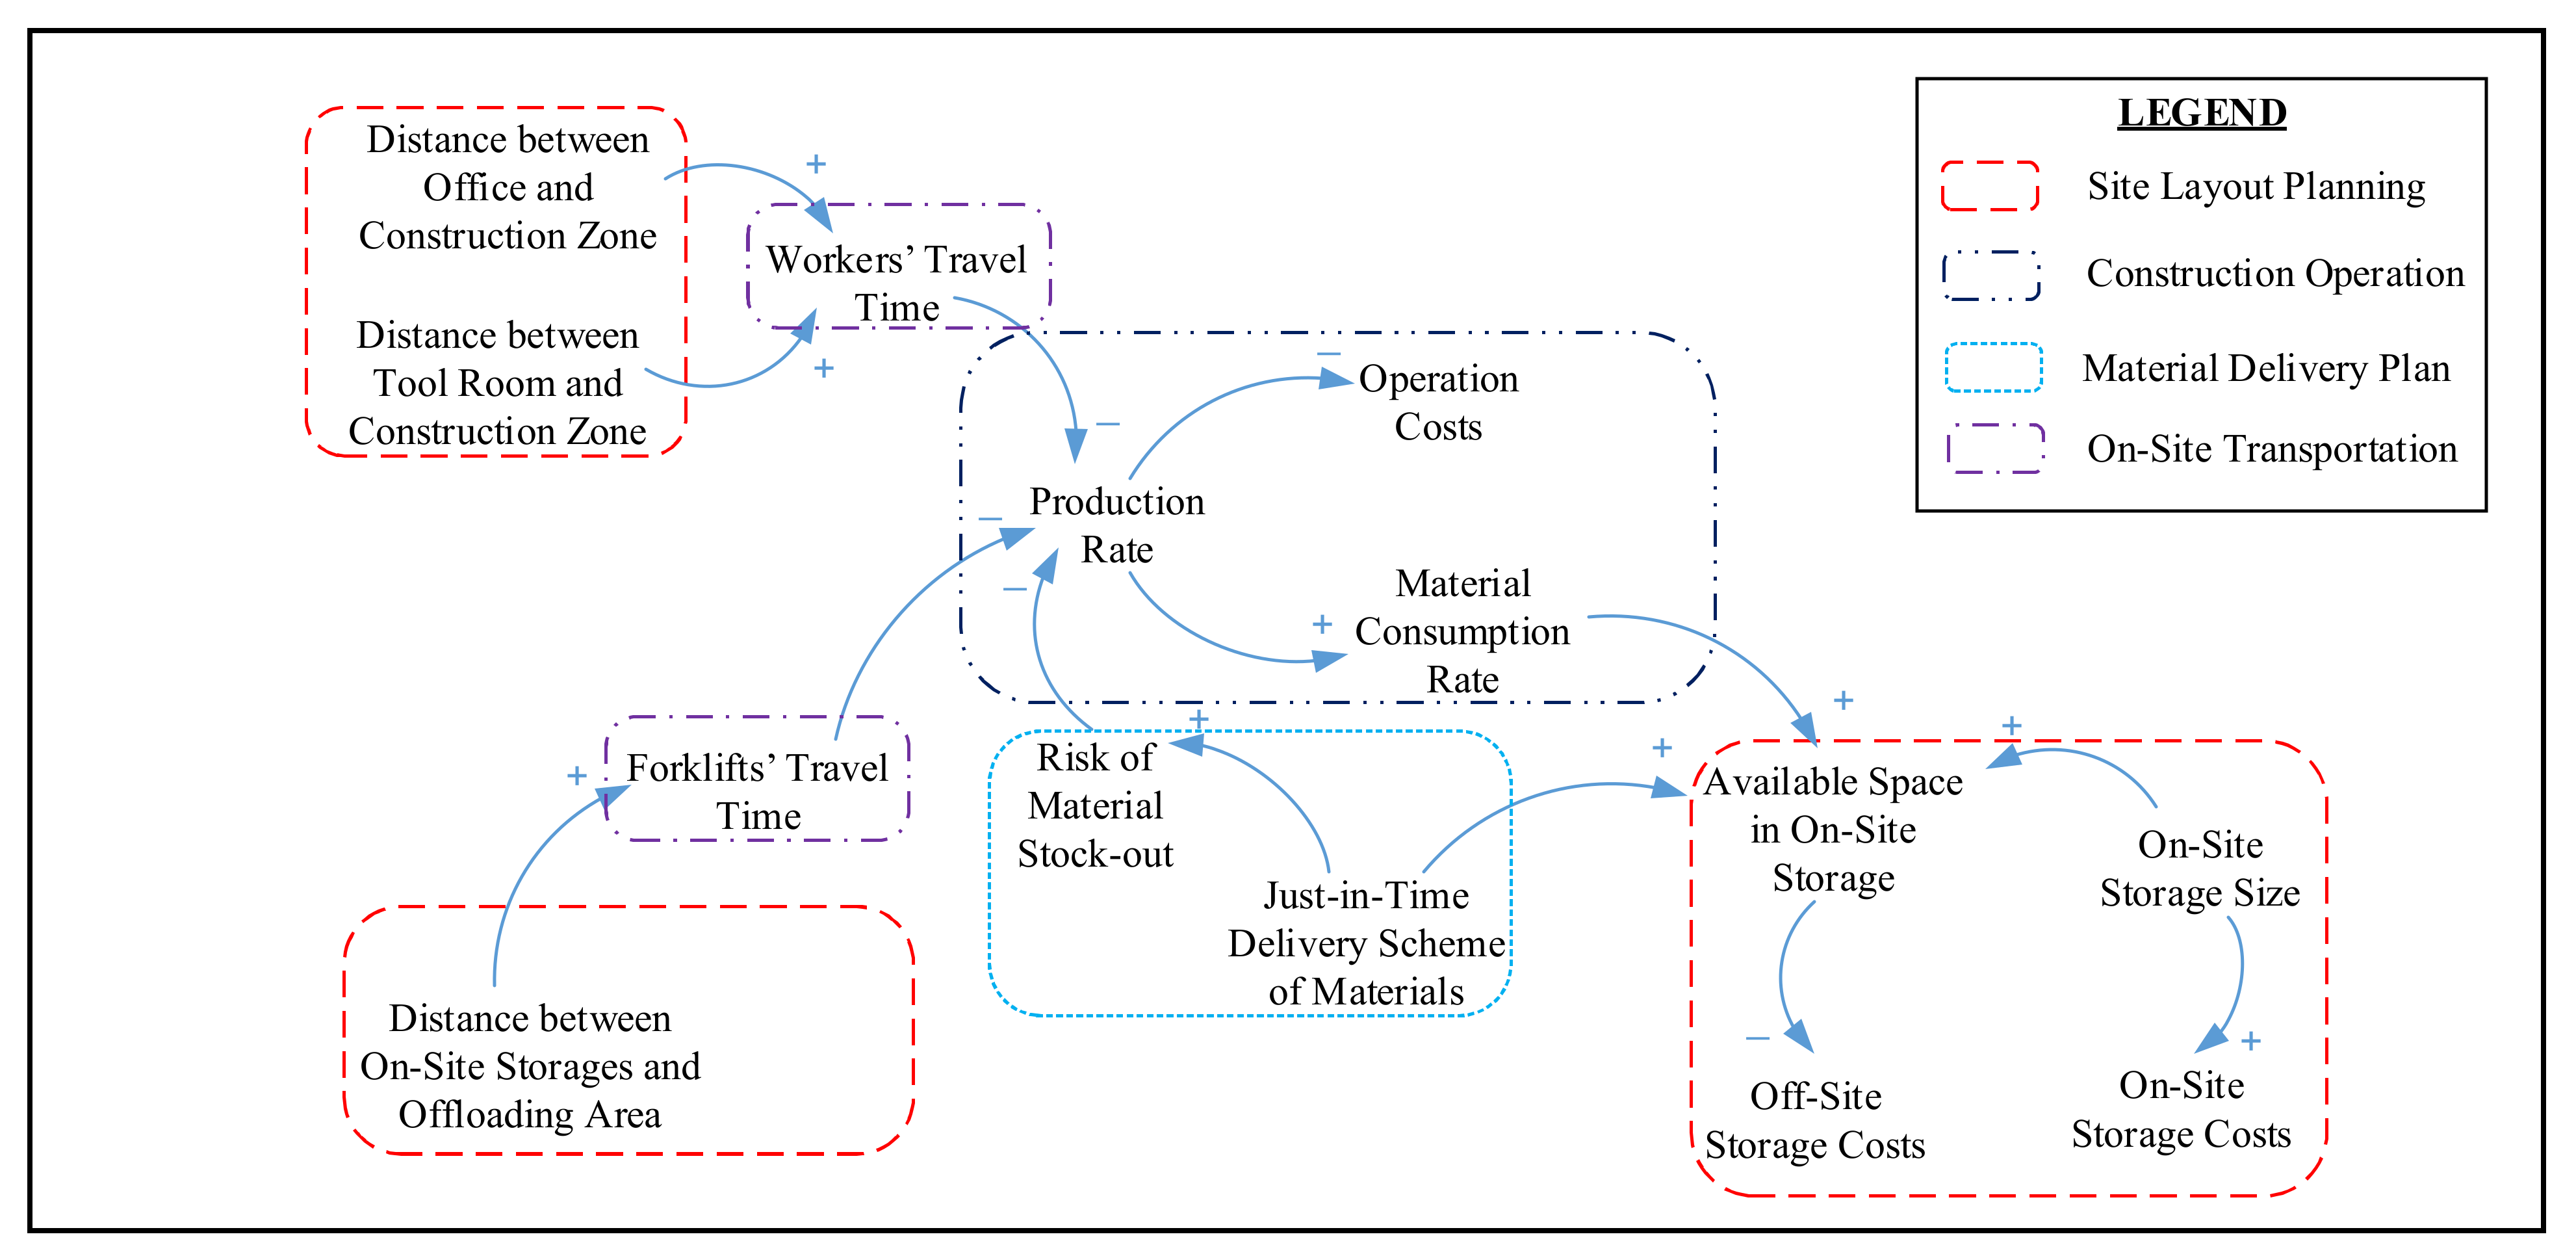
To better understand the complex relationship and dependency of the influencing factors and variables in the decision-making process, a casual loop diagram was used as shown in Figure 14. In the causal loop diagram, independent variables are linked to dependent variables via arrows, and the polarities shown on the arrows, which are either positive (+) or negative (−), indicate how the changes to the independent variable affect the dependent variables [44]. As seen in Figure 14, one of the decisions that could be made is to adopt the JIT delivery scheme for material delivery. This decision could reduce the need for material storage and reduce the correspondent costs, but at the same time, it increases the risk of material stock-out, which can reduce the production rate because of increasing waiting time for material arrival, and consequently increase the construction operation costs. This is one of the challenging decisions owing to the dependency of influencing factors and interrelationship between variables. In the literature, similar challenges were identified in different cases. For instance, Skjelbred et al. (2015) [5] analyzed four oil and gas and construction projects in Norway and Sweden, and concluded that a balance between material buffers on site and JIT needs to be assessed for not interrupting the production flow because of lack of materials. One of the factors to be considered in this assessment is the amount of available space on the site for storage [5], which is determined in site layout planning.
The simulation model was run 100 times for the two layouts, with the cost results given in Table 4. The results show that layout (b) is more cost-efficient (by approximately 2%) than layout (a), which is primarily because of the improvement in the operation costs by positioning Storage 2 closer to the structure. As seen in Table 4, the off-site storage cost in layout (b) for Material 1 is zero because the space in Storage 1 is sufficient to accommodate all of Material 1 on the site. Meanwhile, the smaller amount of space in layout (a) for Storage 1 results in extra costs for the off-site storage. Similarly, for Material 2, owing to the larger space for Storage 2 in layout (a), the off-site storage cost for Material 2 is less than in layout (b). However, the total of off-site storage costs for two materials is slightly different between the layouts, while their volumes, delivery rates, and erection rates also differ. Layout costs, which include mobilization, maintenance, and demobilization costs, are the same for the two layouts as the total storage space in the two layouts is the same.
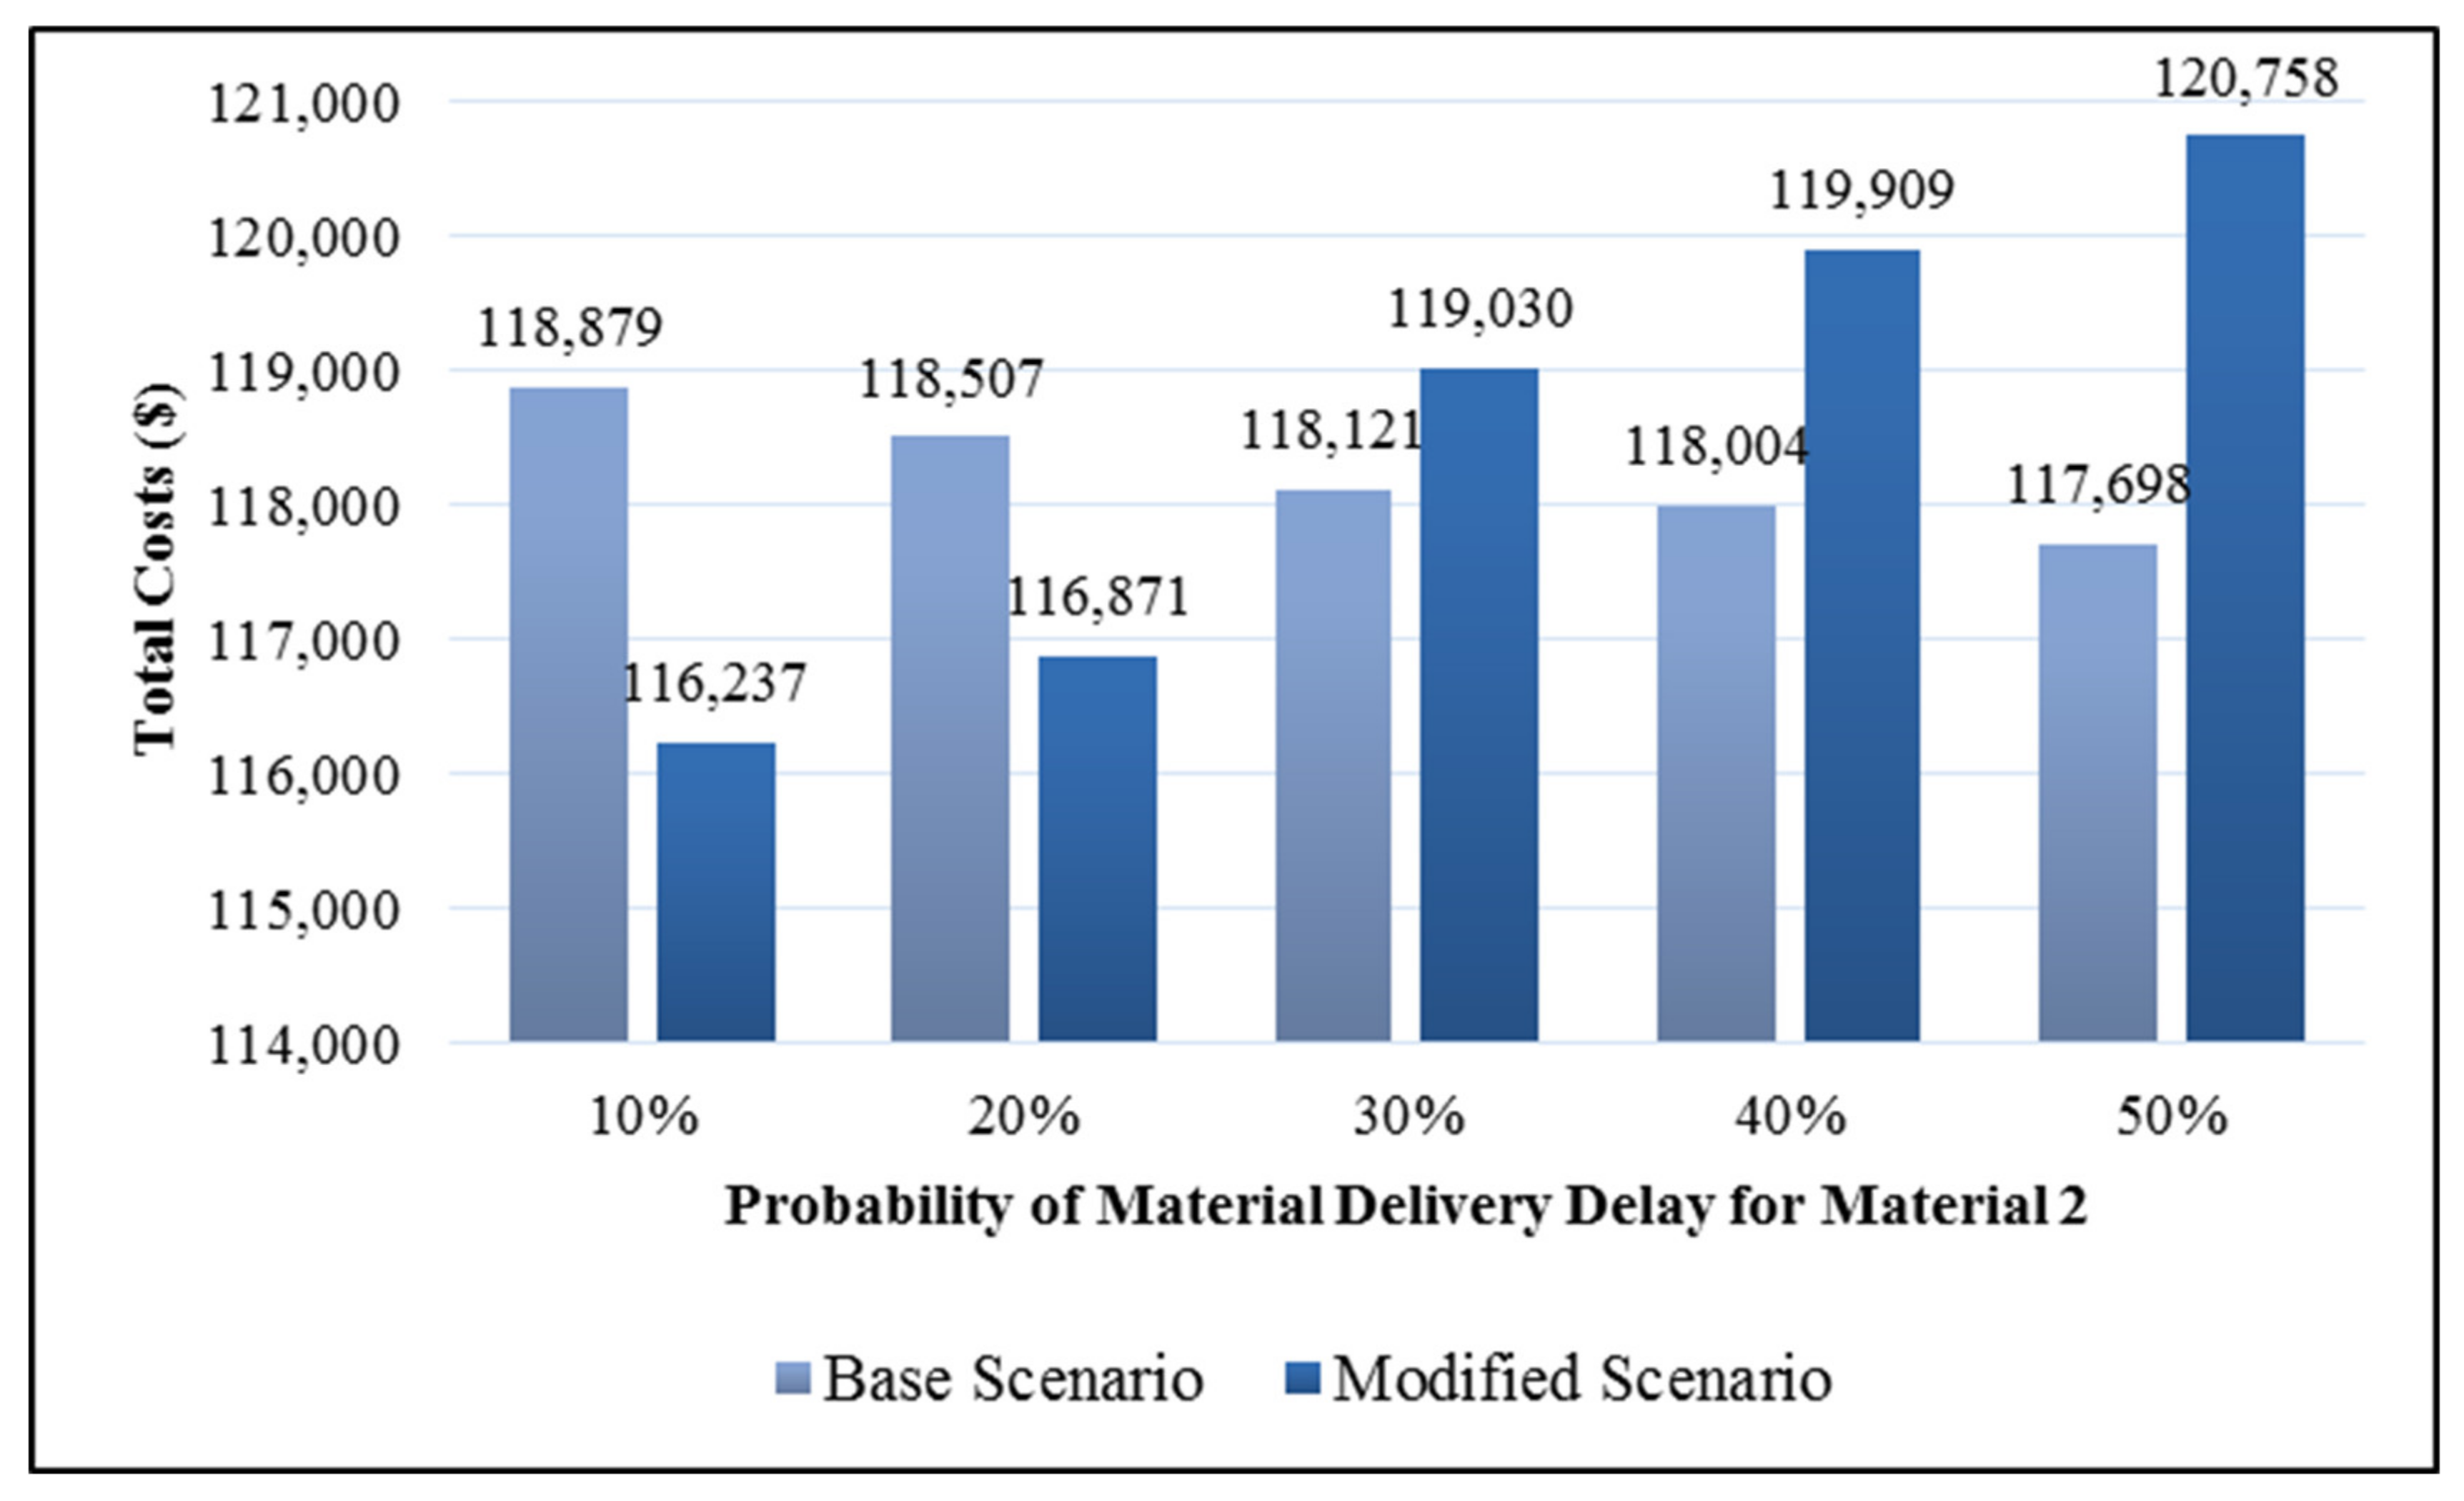
In addition to the base scenario, owing to the high cost of the off-site storage for Material 2 in layout (b), the planner may consider postponing Material 2 delivery for one day, starting on day 4, to reduce this cost. As mentioned before, this may entail material stock-out due to the possibility of late delivery. The simulation model is also examined for this modified scenario and compared with the base scenario for layout (b), as presented in Table 5. As seen in Table 5, owing to the relatively low chance of material delivery delay (i.e., 10%), in the modified scenario, the operation cost is increased owing to late material delivery by for about 1%, while reducing the off-site storage costs leads to a reduction in total cost by approximately 2%. In other words, this decision is more cost-efficient. However, this result would be sensitive to the probability of material delivery delay for Material 2, a factor that must be considered. To this end, a sensitivity analysis is undertaken for layout (b) by varying the probability of delivery delay of Material 2 from 10% to 50%, and the results are compared between the base and modified scenarios, as shown in Figure 15. The simulation results show that the modified scenario is more cost-efficient than the base scenario when the probability of material delay is 10% and 20%. For the probabilities equal to or greater than 30%, the base scenario is found to be more cost-efficient. It is also seen that the trends resulting from varying the total costs by changing the probability are completely different between the scenarios; the total costs of the base scenario are reduced by increasing the probability, while the total costs of the modified scenario are found to increase. This is because of the fact that sufficient contingency is considered in the material delivery plan of the base scenario for the late material delivery. That is, increasing the probability of material delivery delay does not have a significant impact on the operation cost, while it considerably reduces the off-site storage cost. This kind of analysis in the planning stage can help reduce the waiting time, which has been identified as one of the major construction wastes in different countries such as Canada [27] and Sweden [26]. As such, similar analysis could be undertaken for other variables, though this is beyond the scope of this case study. Overall, using the simulation tool enables planners to identify bottlenecks in the project, and to make decisions on the site layout and construction planning variables simultaneously, thereby allowing them to find the most cost-efficient plans. In particular, using the developed DST, the decisions to be made on the facility locations, material storage size, material delivery plan, and material handling resources can be evaluated and their impacts on the on-site transportation and logistics costs, material handling and storage costs, and waiting time for the material arrival can be qualitatively assessed.
6. Verification and Validation
A variety of verification and validation tests described by Sargent (2003) [45] are performed to determine the validity of these components. A summary of these tests is presented in Table 6. In some cases, the results of the developed DST were compared to those obtained using GPT of Simphony and its accuracy was verified. To this end, the created models were run using the same set of input data to compare the outputs.
7. Conclusions
This paper outlined the development of a simple-to-use DST that creates and visualizes the site layout plan within a simulation environment, thereby facilitating integration of the site layout components with the simulation components provided by accessing the properties of the facilities (e.g., size, location, capacity) through predefined elements and simple programming codes. For testing and the research hypothesis, the developed DST was applied to a case study, and it was verified that the developed DST is an effective tool for site layout and construction planning, and can result in significant project cost savings. In the case study, it was shown that seamless interactions between site layout and simulation components enable planners to experiment with different site layout and construction plan alternatives in a unified model with minimal effort. This capability is of great assistance for planners in the following ways:
- Identifying the most efficient plan, including site layout, material delivery plans, and site logistics;
- Eliminating or minimizing wastes such as on-site transportation and movement, material storage, and waiting time for the material arrival;
- Reducing the project costs by reducing on-site logistics costs, material storage costs, and some potential delays.
Further to the simulation capabilities, site layout constraints for positioning of facilities can be modelled and automatically checked in the model. Overall, the developed DST is able to consider the following: (1) construction uncertainties, (2) construction resource, (3) site layout constraints, and (4) mutual impacts between site layout and construction plan variables. These capabilities can further promote the application of simulation in construction site layout planning by facilitating the modelling efforts.
The developed DST has some limitations. The shape of the facilities is limited to rectangular shapes. In addition, the automatic path finding is not incorporated in the tool, and the distance calculation is based on perpendicular/Euclidean distance function or manual identification of the path. In future studies, the developed DST can be extended by considering irregular facility shape and automatically finding the shortest/optimum path between facilities to calculate the transportation distance and duration. Integration of the tool with BIM can also enhance the visualization aspect of the tool and reduce data preparation for the simulation model.
Author Contributions
Conceptualization, S.R.; Formal analysis, S.R.; Funding acquisition, S.A.; Investigation, S.R.; Methodology, S.R.; Project administration, S.A.; Resources, S.A.; Software, S.R. and S.A.; Supervision, S.A.; Validation, S.R.; Visualization, S.R.; Writing—original draft, S.R.; Writing—review & editing, S.R. and S.A. All authors have read and agreed to the published version of the manuscript.
Funding
This research was funded by a Collaborative Research and Development (CRD) Grant from Natural Sciences and Engineering Research Council of Canada, grant number CRDPJ 492657.
Institutional Review Board Statement
Not applicable.
Informed Consent Statement
Not applicable.
Data Availability Statement
Not applicable.
Acknowledgments
The researchers would like to extend their appreciation to Waiward Steel for their vital cooperation during this study.
Conflicts of Interest
The authors declare no conflict of interest.
Appendix A
Appendix A.1. Facility Element
Given the coordinates of one of the corners of the facility, such as (x1, y1) for point A1, and the clockwise rotation angle of the facility, i.e., α, the coordinates of the other corner points, i.e., (x2, y2) for point A2, (x3, y3) for point A3 and (x4, y4) for point A4, and the center point, i.e., (xc, yc) for point C, as shown in Figure 2b, can be calculated as follows:
With respect to the capacity of material-dependent facilities, the user may intend to consider unlimited capacity for the facility. To this end, the unconstrained capacity option can be selected for the facility. This option can be used for the cases in which the planner is interested in experimenting with the scenarios of having no impact by the facility capacity on a project, or in identifying the maximum required capacity of a facility that entails no delay for unloading of materials.
Appendix A.2. Constraint Element
Satisfaction of the site constraints shown in Figure 3 is formulated as follows:
- To be considered inside the boundary, a given facility must satisfy each of the following conditions:
- ○
- No edge of the facility intersects with any edges of the boundaries;
- ○
- At least one point of the facility (e.g., its center or reference point) is inside the boundary.
- For facilities to be considered non-overlapping, each of the following conditions must be satisfied:
- ○
- No edge of the facility intersects with any edges of other facilities;
- ○
- At least one point of the facility (e.g., its center point) is not inside another facility.
- For inclusion/exclusion of a facility in/from Area A, each of the following conditions must be satisfied:
- ○
- No edge of the facility intersects with the edges of the area;
- ○
- At least one point of the facility (e.g., its center) is inside/outside the area.
- For inclusion/exclusion of a facility in/from Area A, each of the following conditions must be satisfied:
- ○
- No edge of the facility intersects with any edges of the area;
- ○
- At least one point of the facility (e.g., its center point) is inside/outside the area.
- Minimum or maximum distance (Dmin/max) between two points of Facility #j and #k using the Euclidean method:
- Minimum or maximum distance from the edges of Facility #j to Facilit #k:
- ○
- For the minimum distance, an imaginary area, the center and orientation of which are the same as those of Facility #j and the dimensions of which are Wj + 2 × Dmin and Hj + 2 × Dmin, is assumed, and Facility #k should be excluded from this area, where Wj and Hj are the width and height of Facility #j;
- ○
- For the maximum distance, an imaginary area, the center and orientation of which are the same as those of Facility #j and the dimensions of which are Wj + 2 × Dmax and Hj + 2 × Dmax, is assumed, and Facility #k should be included in this area.
Appendix A.3. Programming Codes
The properties that may frequently be used for the site layout elements in programming codes are presented in Table A1.

Table A1.
Frequently used properties for the site layout elements in programming codes.
| Property Name | Definition of the Property |
|---|---|
| Angle | Rotation angle of the facility |
| CenterLocation.X | X coordinate of the center of the facility |
| CenterLocation.Y | Y coordinate of the center of the facility |
| ElementSize.Width | The length of the facility along the x axis when the rotation is 0° |
| ElementSize.Height | The length of the facility along the y axis when the rotation is 0° |
| Visual Basic: Materials (0).AvailableMaterial C#: Materials (0).AvailableMaterial | The available material units for a specific material listed as the first material in the facility at the current time. For the second and third and so on, 0 is replaced by 1, 2, and so on, respectively |
| Visual Basic: Materials (0).InitialMaterial C#: Materials (0).InitialMaterial | The initial available material units for a specific material listed as the first material in the facility at beginning of the model. For the second and third and so on, 0 is replaced by 1, 2, and so on, respectively |
| Visual Basic: Materials (0).MaterialCapacity C#: Materials (0).MaterialCapacity | The capacity of the facility for a specific material listed as the first material in the facility. For the second and third and so on, 0 is replaced by 1, 2, and so on, respectively. |
References
- Wegelius-Lehtonen, T. Performance measurement in construction logistics. Int. J. Prod. Econ. 2001, 69, 107–116. [Google Scholar] [CrossRef]
- Ying, F.; Tookey, J.; Roberti, J. Addressing effective construction logistics through the lens of vehicle movements. Eng. Constr. Arch. Manag. 2014, 21, 261–275. [Google Scholar] [CrossRef] [Green Version]
- Gambatese, J.; Hinze, J. Addressing construction worker safety in the design phase: Designing for construction worker safety. Autom. Constr. 1999, 8, 643–649. [Google Scholar] [CrossRef]
- Anumba, C.; Bishop, G. Importance of safety considerations in site layout and organization. Can. J. Civ. Eng. 1997, 24, 229–236. [Google Scholar] [CrossRef]
- Skjelbred, S.; Fossheim, M.E.; Drevland, F. Comparing site organization and logistics in the construction industry and the oil industry: A case study. In Proceedings of the 23rd Annual Conference of the International Group for Lean Construction, Perth, Australia, 29–31 July 2015; pp. 13–22. [Google Scholar]
- Dubois, A.; Hulthén, K.; Sundquist, V. Organising logistics and transport activities in construction. Int. J. Logist. Manag. 2019, 30, 620–640. [Google Scholar] [CrossRef]
- Rosenblatt, M.J. The Dynamics of Plant Layout. Manag. Sci. 1986, 32, 76–86. [Google Scholar] [CrossRef] [Green Version]
- Elbeltagi, E.; Hegazy, T.; Eldosouky, A. Dynamic Layout of Construction Temporary Facilities Considering Safety. J. Constr. Eng. Manag. 2004, 130, 534–541. [Google Scholar] [CrossRef]
- Cheng, M.Y.; O’Connor, J.T. ArcSite: Enhanced GIS for Construction Site Layout. J. Constr. Eng. Manag. 1996, 122, 329–336. [Google Scholar] [CrossRef]
- El-Rayes, K.; Khalafallah, A. Trade-off between Safety and Cost in Planning Construction Site Layouts. J. Constr. Eng. Manag. 2005, 131, 1186–1195. [Google Scholar] [CrossRef] [Green Version]
- McKendall, A.R., Jr.; Hakobyan, A. Heuristics for the dynamic facility layout problem with unequal-area departments. Eur. J. Oper. Res. 2010, 201, 171–182. [Google Scholar] [CrossRef]
- Zhang, H.; Wang, J.Y. Particle Swarm Optimization for Construction Site Unequal-Area Layout. J. Constr. Eng. Manag. 2008, 134, 739–748. [Google Scholar] [CrossRef]
- Ning, X.; Lam, K.-C.; Lam, M.C.-K. Dynamic construction site layout planning using max-min ant system. Autom. Constr. 2010, 19, 55–65. [Google Scholar] [CrossRef]
- Ning, X.; Qi, J.; Wu, C. A quantitative safety risk assessment model for construction site layout planning. Saf. Sci. 2018, 104, 246–259. [Google Scholar] [CrossRef]
- Sanad, H.M.; Ammar, M.A.; Ibrahim, M.E. Optimal Construction Site Layout Considering Safety and Environmental Aspects. J. Constr. Eng. Manag. 2008, 134, 536–544. [Google Scholar] [CrossRef]
- El-Rayes, K.; Said, H. Dynamic Site Layout Planning Using Approximate Dynamic Programming. J. Comput. Civ. Eng. 2009, 23, 119–127. [Google Scholar] [CrossRef]
- Schwabe, K.; Teizer, J.; König, M. Applying rule-based model-checking to construction site layout planning tasks. Autom. Constr. 2019, 97, 205–219. [Google Scholar] [CrossRef]
- Jiang, W.; Zhou, Y.; Ding, L.; Zhou, C.; Ning, X. UAV-based 3D reconstruction for hoist site mapping and layout planning in petrochemical construction. Autom. Constr. 2020, 113, 103137. [Google Scholar] [CrossRef]
- Vrijhoef, R.; Dijkstra, J.T.; Koutamanis, A. Modelling and Simulating Time Use of Site Workers With 4d BIM. In Proceedings of the 26th Annual Conference of the International Group for Lean Construction, Chennai, India, 16–22 July 2018; pp. 155–165. [Google Scholar]
- Construction Site Logistics Management Software (Bluebeam). Available online: https://www.bluebeam.com/uk/solutions/site-logistics (accessed on 6 July 2021).
- Thunberg, M.; Rudberg, M.; Gustavsson, T.K. Categorising on-site problems. Constr. Innov. 2017, 17, 90–111. [Google Scholar] [CrossRef]
- Zouein, P.; Tommelein, I. Improvement Algorithm for Limited Space Scheduling. J. Constr. Eng. Manag. 2001, 127, 116–124. [Google Scholar] [CrossRef] [Green Version]
- Said, H.; El-Rayes, K. Optimizing Material Procurement and Storage on Construction Sites. J. Constr. Eng. Manag. 2011, 137, 421–431. [Google Scholar] [CrossRef]
- Ohno, T. Toyota Production System: Beyond Large-Scale Production, 3rd ed.; Productivity Press: New York, NY, USA, 1988. [Google Scholar]
- Murata, K.; Tezel, A.; Koskela, L.; Tzortzopoulos, P. Sources of Waste on Construction Site: A Comparison to the Manufacturing Industry. In Proceedings of the 26th Annual Conference of the International Group for Lean Construction, Chennai, India, 16–22 July 2018; pp. 973–981. [Google Scholar]
- Josephson, P.-E.; Saukkoriipi, L. Waste in Construction Projects: Call for a New Approach; The Centre for Management of the Built Environment, Chalmers University of Technology: Gothenburg, Sweden, 2007. [Google Scholar]
- Liu, J. The Significance of Logistics Performance to Industrial Modular Construction Project under the “Big Site” Scenario. Master’s Thesis, University of Alberta, Edmonton, AB, Canada, 2016. [Google Scholar] [CrossRef]
- Sezer, A.A.; Fredriksson, A. Environmental impact of construction transport and the effects of building certification schemes. Resour. Conserv. Recycl. 2021, 172, 105688. [Google Scholar] [CrossRef]
- Dakhli, Z.; Lafhaj, Z. Considering Materials Management in Construction: An Exploratory Study. Logistics 2018, 2, 7. [Google Scholar] [CrossRef] [Green Version]
- Vrijhoef, R. Improving efficiency and environmental impact applying JIT logistics and transport consolidation in urban construction project. In Proceedings of the Creative Construction Conference, Ljubljana, Slovenia, 30 June–3 July 2018; pp. 552–559. [Google Scholar]
- Lange, S.; Schilling, D. Reasons for an optimized construction logistics. In Proceedings of the 23rd Annual Conference of the International Group for Lean Construction, Perth, Australia, 29–31 July 2015; pp. 733–742. [Google Scholar]
- Tommelein, I.D. Travel-time simulation to locate and staff temporary facilities under changing construction demand. In Proceedings of the 31st Conference on Winter Simulation—A Bridge to the Future—WSC ’99, Phoenix, AR, USA, 5–8 December 1999; pp. 978–984. [Google Scholar]
- Ying, F.J.; O’Sullivan, M.; Adan, I. Simulation of vehicle movements for planning construction logistics centres. Constr. Innov. 2021. [Google Scholar] [CrossRef]
- Marasini, R.; Dawood, N.N.; Hobbs, B. Stockyard layout planning in precast concrete products industry: A case study and proposed framework. Constr. Manag. Econ. 2001, 19, 365–377. [Google Scholar] [CrossRef]
- Alanjari, P.; Razavialavi, S.; AbouRizk, S. A simulation-based approach for material yard laydown planning. Autom. Constr. 2014, 40, 1–8. [Google Scholar] [CrossRef]
- RazaviAlavi, S.; Abourizk, S. Genetic Algorithm–Simulation Framework for Decision Making in Construction Site Layout Planning. J. Constr. Eng. Manag. 2017, 143, 04016084. [Google Scholar] [CrossRef]
- Zhou, F.; Abourizk, S.; Al-Battaineh, H. Optimisation of construction site layout using a hybrid simulation-based system. Simul. Model. Pr. Theory 2009, 17, 348–363. [Google Scholar] [CrossRef]
- RazaviAlavi, S.; Abourizk, S. A hybrid simulation approach for quantitatively analyzing the impact of facility size on construction projects. Autom. Constr. 2015, 60, 39–48. [Google Scholar] [CrossRef]
- Sundquist, V.; Gadde, L.-E.; Hulthén, K. Reorganizing construction logistics for improved performance. Constr. Manag. Econ. 2018, 36, 49–65. [Google Scholar] [CrossRef]
- RazaviAlavi, S.; Abourizk, S. Site Layout and Construction Plan Optimization Using an Integrated Genetic Algorithm Simulation Framework. J. Comput. Civ. Eng. 2017, 31, 04017011. [Google Scholar] [CrossRef]
- Siemens Digital Industries Software. Available online: https://www.plm.automation.siemens.com/global/en/products/manufacturing-planning/plant-simulation-throughput-optimization.html (accessed on 6 July 2021).
- Hajjar, D.; Abourizk, S.M. Building a special purposes simulation tool for earth moving operations. In Proceedings of the 28th Conference on Winter Simulation—WSC ’96, Coronado, CA, USA, 8–11 December 1996; pp. 1313–1320. [Google Scholar]
- Martínez, J.C.; Ioannou, P.G. General purpose simulation with Stroboscope. In Proceedings of the Winter Simulation Conference, San Diego, CA, USA, 11–14 December 1994; pp. 1159–1166. [Google Scholar]
- Sterman, J. Business Dynamics: Systems Thinking and Modeling for a Complex World; McGraw-Hill: New York, NY, USA, 2000. [Google Scholar]
- Sargent, R.G. Verification and Validation of Simulation Models. In Proceedings of the Proceedings of the 2010 Winter Simulation Conference, Baltimore, MD, USA, 5–8 December 2010; pp. 166–183. [Google Scholar]
Figure 1.
Overview of the graphical user interface (GUI) and site element.

Figure 2.
(a) Overview of the facility, constraint, and material elements positioned on the site element; (b) geometry of the facility element.
Figure 2.
(a) Overview of the facility, constraint, and material elements positioned on the site element; (b) geometry of the facility element.

Figure 3.
General and site-specific constraints considered in the tool.

Figure 4.
GUI for defining distance hard constraints.

Figure 5.
Explanatory message for unsatisfied hard constraints.

Figure 6.
Simulation elements of the tool.

Figure 7.
Links drawn between facilities.

Figure 8.
A sample property window of a transportation task.

Figure 9.
A sample property window of a loading task.

Figure 10.
(a) Overview of layout and (b) overview of layout.

Figure 11.
(a) Construction process flow and (b) material delivery and erection plan.

Figure 12.
Overview of the created simulation and site layout models for the case study.

Figure 13.
(a) Overview of the simulation model for material delivery and (b) overview of the simulation model for material erection.
Figure 13.
(a) Overview of the simulation model for material delivery and (b) overview of the simulation model for material erection.

Figure 14.
Relationship and dependency of variables in the steel erection process.

Figure 15.
Sensitivity analysis of the total costs of layout (b) in the base and modified scenarios by changing the probability of material delivery delay for Material 2.
Figure 15.
Sensitivity analysis of the total costs of layout (b) in the base and modified scenarios by changing the probability of material delivery delay for Material 2.

Table 1.
Simulation inputs.
| Input | Value |
|---|---|
| Forklift velocity | Triangular a (3000, 3500, 4000) (m/h) |
| Loading 1 ton of material from storage using forklift | Uniform b (0.08, 0.12) h |
| Unloading 1 ton of material in the offloading area by forklift | Uniform (0.05, 0.1) h |
| Loading 1 ton of material from the offloading area using crane | Uniform (0.08, 0.15) h |
| Erection of 1 ton of Material 1 using crane | Triangular (0.3, 0.4, 0.45) h |
| Erection of 1 ton of Material 2 using crane | Triangular (0.15, 0.2, 0.25) h |
| Worker travel velocity | Uniform (2000, 2500) (m/h) |
| Construction operation costs | $1930/h |
| Mobilization, maintenance, and demobilization of the storage with size of 30 m × 10 m | $8000 |
| Mobilization, maintenance, and demobilization of storage facility with dimensions of 15 m × 10 m | $4000 |
| Transportation cost of materials to off-site storage | $500 per material delivery |
| Rent cost of off-site storage | $30 per ton of material per day |
| Working hours excluding the lunch break | 8 h per day |
a Triangular (L, M, H) is the triangular probability distribution, where L, M, and H are the lower bound, mode, and higher bound, respectively. b Uniform (L, H) is the uniform probability distribution, where L and H are the lower and higher bounds, respectively.
Table 2.
Site layout characteristics.
| Facility | Facility Type | Facility Size (Capacity) a | |
|---|---|---|---|
| Layout #1 | Layout #2 | ||
| Structure | N/A | 10 m × 12 m | 10 m × 12 m |
| Crane | N/A | 8 m × 8 m | 8 m × 8 m |
| Offloading Area | Material-dependent | 5 m × 10 m (1 ton) | 5 m × 10 m (1 ton) |
| Office | N/A | 20 m × 8 m | 20 m × 8 m |
| Tool Room | N/A | 10 m × 7 m | 10 m × 7 m |
| Parking | N/A | 20 m × 10 m | 20 m ×10 m |
| Storage of Material 1 | Material-dependent | 15 m × 10 m (20 tons) | 30 m × 10 m (40 tons) |
| Storage of Material 2 | Material-dependent | 30 m × 10 m (40 tons) | 15 m × 10 m (20 tons) |
a Capacity is defined for the material-dependent facilities that maintain steel materials.
Table 3.
Defined site layout hard constraints.
| Constraint Description | Defined Constraints |
|---|---|
| Parking must be close to the site entrance | Including parking in the parking area |
| Parking must be close to the security gate | Maximum distance between centers of parking and security gate less than 20 m |
| No facilities must block the road | Excluding all facilities from the road area |
| Office must be close to parking | Maximum distance between centers of office and parking less than 30 m |
| Cranes must have access to the offloading area | Maximum distance between center of crane and farthest point of the offloading area must be less than 20 m |
| Crane 1 must have access to the structure | Maximum distance between centers of crane and farthest point of the structure must be less than 20 m |
| All facilities except for the offloading area and structure must be out of the cranes’ zone | Minimum distance between the center of the cranes and the closest point of all facilities except for the offloading area and structure must be greater than 20 m |
Table 4.
Simulation results for the base scenario.
| Layout | Layout Costs ($) | Operation Cost ($) | Off-Site Storage Cost for Material 1 ($) | Off-Site Storage Cost for Material 2 ($) | Total Costs ($) |
|---|---|---|---|---|---|
| Layout (a) | 12,000 | 101,924 | 3789 | 3495 | 121,208 |
| Layout (b) | 12,000 | 99,753 | 0 | 7126 | 118,879 |
Table 5.
Simulation results of the base scenario with the modified scenario for layout (b).
| Scenario | Layout Costs ($) | Operation Cost ($) | Off-Site Storage Cost for Material 1 ($) | Off-Site Storage Cost for Material 2 ($) | Total Costs ($) |
|---|---|---|---|---|---|
| Base scenario | 12,000 | 99,753 | 0 | 7126 | 118,879 |
| Modified scenario (postponing Material 2 delivery for one day) | 12,000 | 100,851 | 0 | 3386 | 116,237 |
Table 6.
Tests performed for verification and validation of the model.
| Test Description | Purpose | Summary of the Test Process |
|---|---|---|
| Dynamic testing, in which the computer program is executed under different conditions and the obtained values are used to determine if the computer program and its implementations are correct | Validation of the constraint element | Using the visualization feature of the tool, satisfaction of the hard constraints in the site layout component was tested for different conditions, and the results were verified as expected. |
| Comparison to other models, in which the results of the model being validated are compared to the results of other models | Validation of the simulation component | The developed simulation model was tested by comparing its results to the results of the model created using GPT. The results obtained from two models were found to be identical. |
| Traces, in which the behaviour of different types of specific entities in the model are traced through the model to determine if the model’s logic is correct | The test is performed using a trace window of the simulation tool, which can print different information such as the time and duration of the loading/unloading and transportation tasks. This information was analyzed and compared to the results from hand calculation of the model to verify if the logic of the model is correct. | |
| Extreme condition tests, in which the model structure and output are tested to be plausible for any extreme and unlikely combination of levels of factors in the system | The model is tested for extreme conditions such as having zero capacity for storage, or having no material delivery in the simulation model. The simulation outputs were found to be plausible for these values of inputs, as they result in zero progress. | |
| Parameter variability—sensitivity analysis, in which changing the values of the input of a model should have the same effect in the model as in the real system | This test was performed by changing different variables such as material delivery and probability of material delivery delay in the simulation model, as presented in the case study. These impacts on project cost, and the trend of changes in the model, were found to be as expected in the real system. | |
| Operational graphics, in which values of various performance measures are shown graphically as the model runs through time | This test was undertaken using graphs produced in the simulation model for the available material in the storages. The combination of this test with the test comparing the results with those of GPT was used to verify the outputs of the model. |
Publisher’s Note: MDPI stays neutral with regard to jurisdictional claims in published maps and institutional affiliations. |
© 2021 by the authors. Licensee MDPI, Basel, Switzerland. This article is an open access article distributed under the terms and conditions of the Creative Commons Attribution (CC BY) license (https://creativecommons.org/licenses/by/4.0/).
Share and Cite
MDPI and ACS Style
RazaviAlavi, S.; AbouRizk, S. Construction Site Layout Planning Using a Simulation-Based Decision Support Tool. Logistics 2021, 5, 65. https://0-doi-org.brum.beds.ac.uk/10.3390/logistics5040065
AMA Style
RazaviAlavi S, AbouRizk S. Construction Site Layout Planning Using a Simulation-Based Decision Support Tool. Logistics. 2021; 5(4):65. https://0-doi-org.brum.beds.ac.uk/10.3390/logistics5040065
Chicago/Turabian StyleRazaviAlavi, SeyedReza, and Simaan AbouRizk. 2021. "Construction Site Layout Planning Using a Simulation-Based Decision Support Tool" Logistics 5, no. 4: 65. https://0-doi-org.brum.beds.ac.uk/10.3390/logistics5040065