
Measuring the Total Logistics Costs at the Macro Level: A Study of Indonesia


1
Department of Management, Faculty of Economics and Business, Mercu Buana University, Jakarta 11650, Indonesia
2
Fiscal Policy Office, Ministry of Finance in Indonesia, Jakarta 10710, Indonesia
3
Department of Agricultural Economics, College of Bio-Resources and Agriculture, National Taiwan University, Taipei 10617, Taiwan
4
School of Strategic and Global Studies, University of Indonesia, Depok 16424, Indonesia
*
Authors to whom correspondence should be addressed.
Logistics 2021, 5(4), 68; https://0-doi-org.brum.beds.ac.uk/10.3390/logistics5040068
Submission received: 24 June 2021
/
Revised: 24 August 2021
/
Accepted: 27 August 2021
/
Published: 1 October 2021
Abstract
:Background: Efforts made to calculate the logistics costs in Indonesia, at the macro level, are facing various problems, due to the fact that there have been no national agreements—to any models employed—to calculate those costs. Moreover, limited data and information due to the lack of use of such integrated information technology to reduce the information asymmetry on the logistics processes and activities have created some additional problems. Objective: This study is aimed at reviewing the measurement model, of the logistics costs used in Indonesia, at the macro level. Method: It provides a potential measurement approach proposed by several previous studies as an alternative option that may help develop the existing models by elaborating on their limitations. Results: The results of this study emphasize the recognition of the components of the logistics costs and the formulation of a more accurate, transparent, and comprehensive measurement framework to improve the standard used to assess the logistics costs. Conclusion: Thus, the calculation output of the logistics costs is expected to be able to provide stakeholders with reliable information to develop an efficient logistics system. Furthermore, logistics costs will be more controllable, allowing Indonesia to achieve such comparative advantages.
1. Introduction
Logistics play such a crucial role in various business activities, at both the micro level and macro level. Its position closely relates to customer satisfaction, since it determines whether the products arrive on time or whether they respond to their specific needs [1]. Therefore, lowering the costs of logistical activities becomes a manager’s increasingly important task [2]. Managing logistics activities efficiently is a strategic factor to reach a competitive advantage [3]. In other words, logistics issues, in terms of their appropriate and viable ways, are currently being incorporated into a country’s or company’s strategies, in order for them to cope with a highly competitive global market, exceeding all interested parties or stakeholders [4,5].
Indonesia’s logistics activities have faced enormous challenges due to the nature of Indonesia’s geography, the fact that it is comprised of thousands islands, and its unevenly-developed infrastructures [6]. High logistics costs have posed a significant threat in the supply chain in all of the economic sectors. Based on the size of its logistics measured by total logistics costs on the GDP, Indonesia ranks the highest of ASEAN countries. During the 2004–2019 period, the size of Indonesia’s logistics only achieved a 4.4% decline in its GDP—from 27.6% in 2004 to 23.2% in 2019. The Indonesian government is seeking to enhance this negative trend. Moreover, the government is aiming for a target that, by the end of 2024, the decline will account for 18% of its GDP [7].
It is crucial that the government achieves that target, since the logistics costs are known as one of the biggest obstacles when trying to increase the export capacity and to fully participate globally [8]. Based on the World Bank data, in the 2004–2019 period, Indonesia’s export accounted for 25% of its GDP; this figure was much smaller than that of Singapore (197%), Malaysia (86%), Thailand (67%), and the Philippines (32%). Indonesia’s trade openness employed to measure its global production network participation has shown a negative trend. In fact, it made such a substantial decrease, accounting for about 37.5% of the GDP, from 59.7% in 2004 to 37.3% in 2019. This figure is relatively smaller than that of other ASEAN countries such as Singapore (367%), Malaysia (158%), Thailand (128%), and the Philippines (67.6%) although there is no systematic evidence that countries with smaller logistics costs tend to be more open to the global market [9]; hence, it is worth evaluating the logistics costs to increase international participation and competitiveness.
Therefore, it is necessary for us to come up with a unified and reliable method to measure the logistics costs to identify the factors in which we can find any scope to reduce the costs [10]. By optimizing the flow and integrating all resources in a supply chain, we will be able to achieve these needs. However, we need to provide transparent information in regards to the logistics costs in all stages of the product flows, so the managers will be able to measure the impact of a decision on the costs in all stages of the supply chain [11]. Logistics cost measurement is an appropriate indicator that can support a future national policy planning, measure the performance carried out, and pave the way to any corrective actions [12]. As a result, measuring the logistics costs is actually not an objective; rather, it is an appropriate indicator employed to monitor and evaluate the national logistics.
There has been no national consensus on how to measure or calculate logistics costs in Indonesia. Data availability poses a major problem when attempting to develop a model used to calculate national logistics costs. Calculating the logistics costs at a macro level has more complexity than that of a micro level. The complexity lies in the calculation of the materials and information flows in all stages and the calculation of the depreciation and amortization of all assets involved in the logistics activities [13]. Taking into account these complexities, the decision makers in every country, including in Indonesia, rely on estimations based on statistical information of the main logistical components, to calculate the logistics costs at the macro level or national level. Without this information, it is almost impossible for them to calculate the logistics costs at the national level, and the results will be unreliable.
It is worth noting that there are no standard versions of the logistics components revealed in the literature; therefore, they are subject to the cost assessment purposes. Toyli et al. [14] and Naula et al. [15] said that total logistics costs were comprised of six individual components—transportation, warehousing, inventory carrying, administration, packaging, and indirect logistics costs. Rushton et al. [16] identified transportation costs, storage costs, carrying costs, packing costs, consolidation costs, inventory costs, information costs, and controlling costs serving as the components of the logistics costs. Zeng and Rossetti [17] included transportation costs, carrying costs, administration costs, tax, risk and damage costs, handling costs, and packing costs into the components of the logistics costs. Gunasekaran et al. [18] said that the components of the logistics costs consist of the opportunity costs of capital and storage, risk costs, and the possible costs of lost sales under inventory; thus, combining inventory carrying and warehousing.
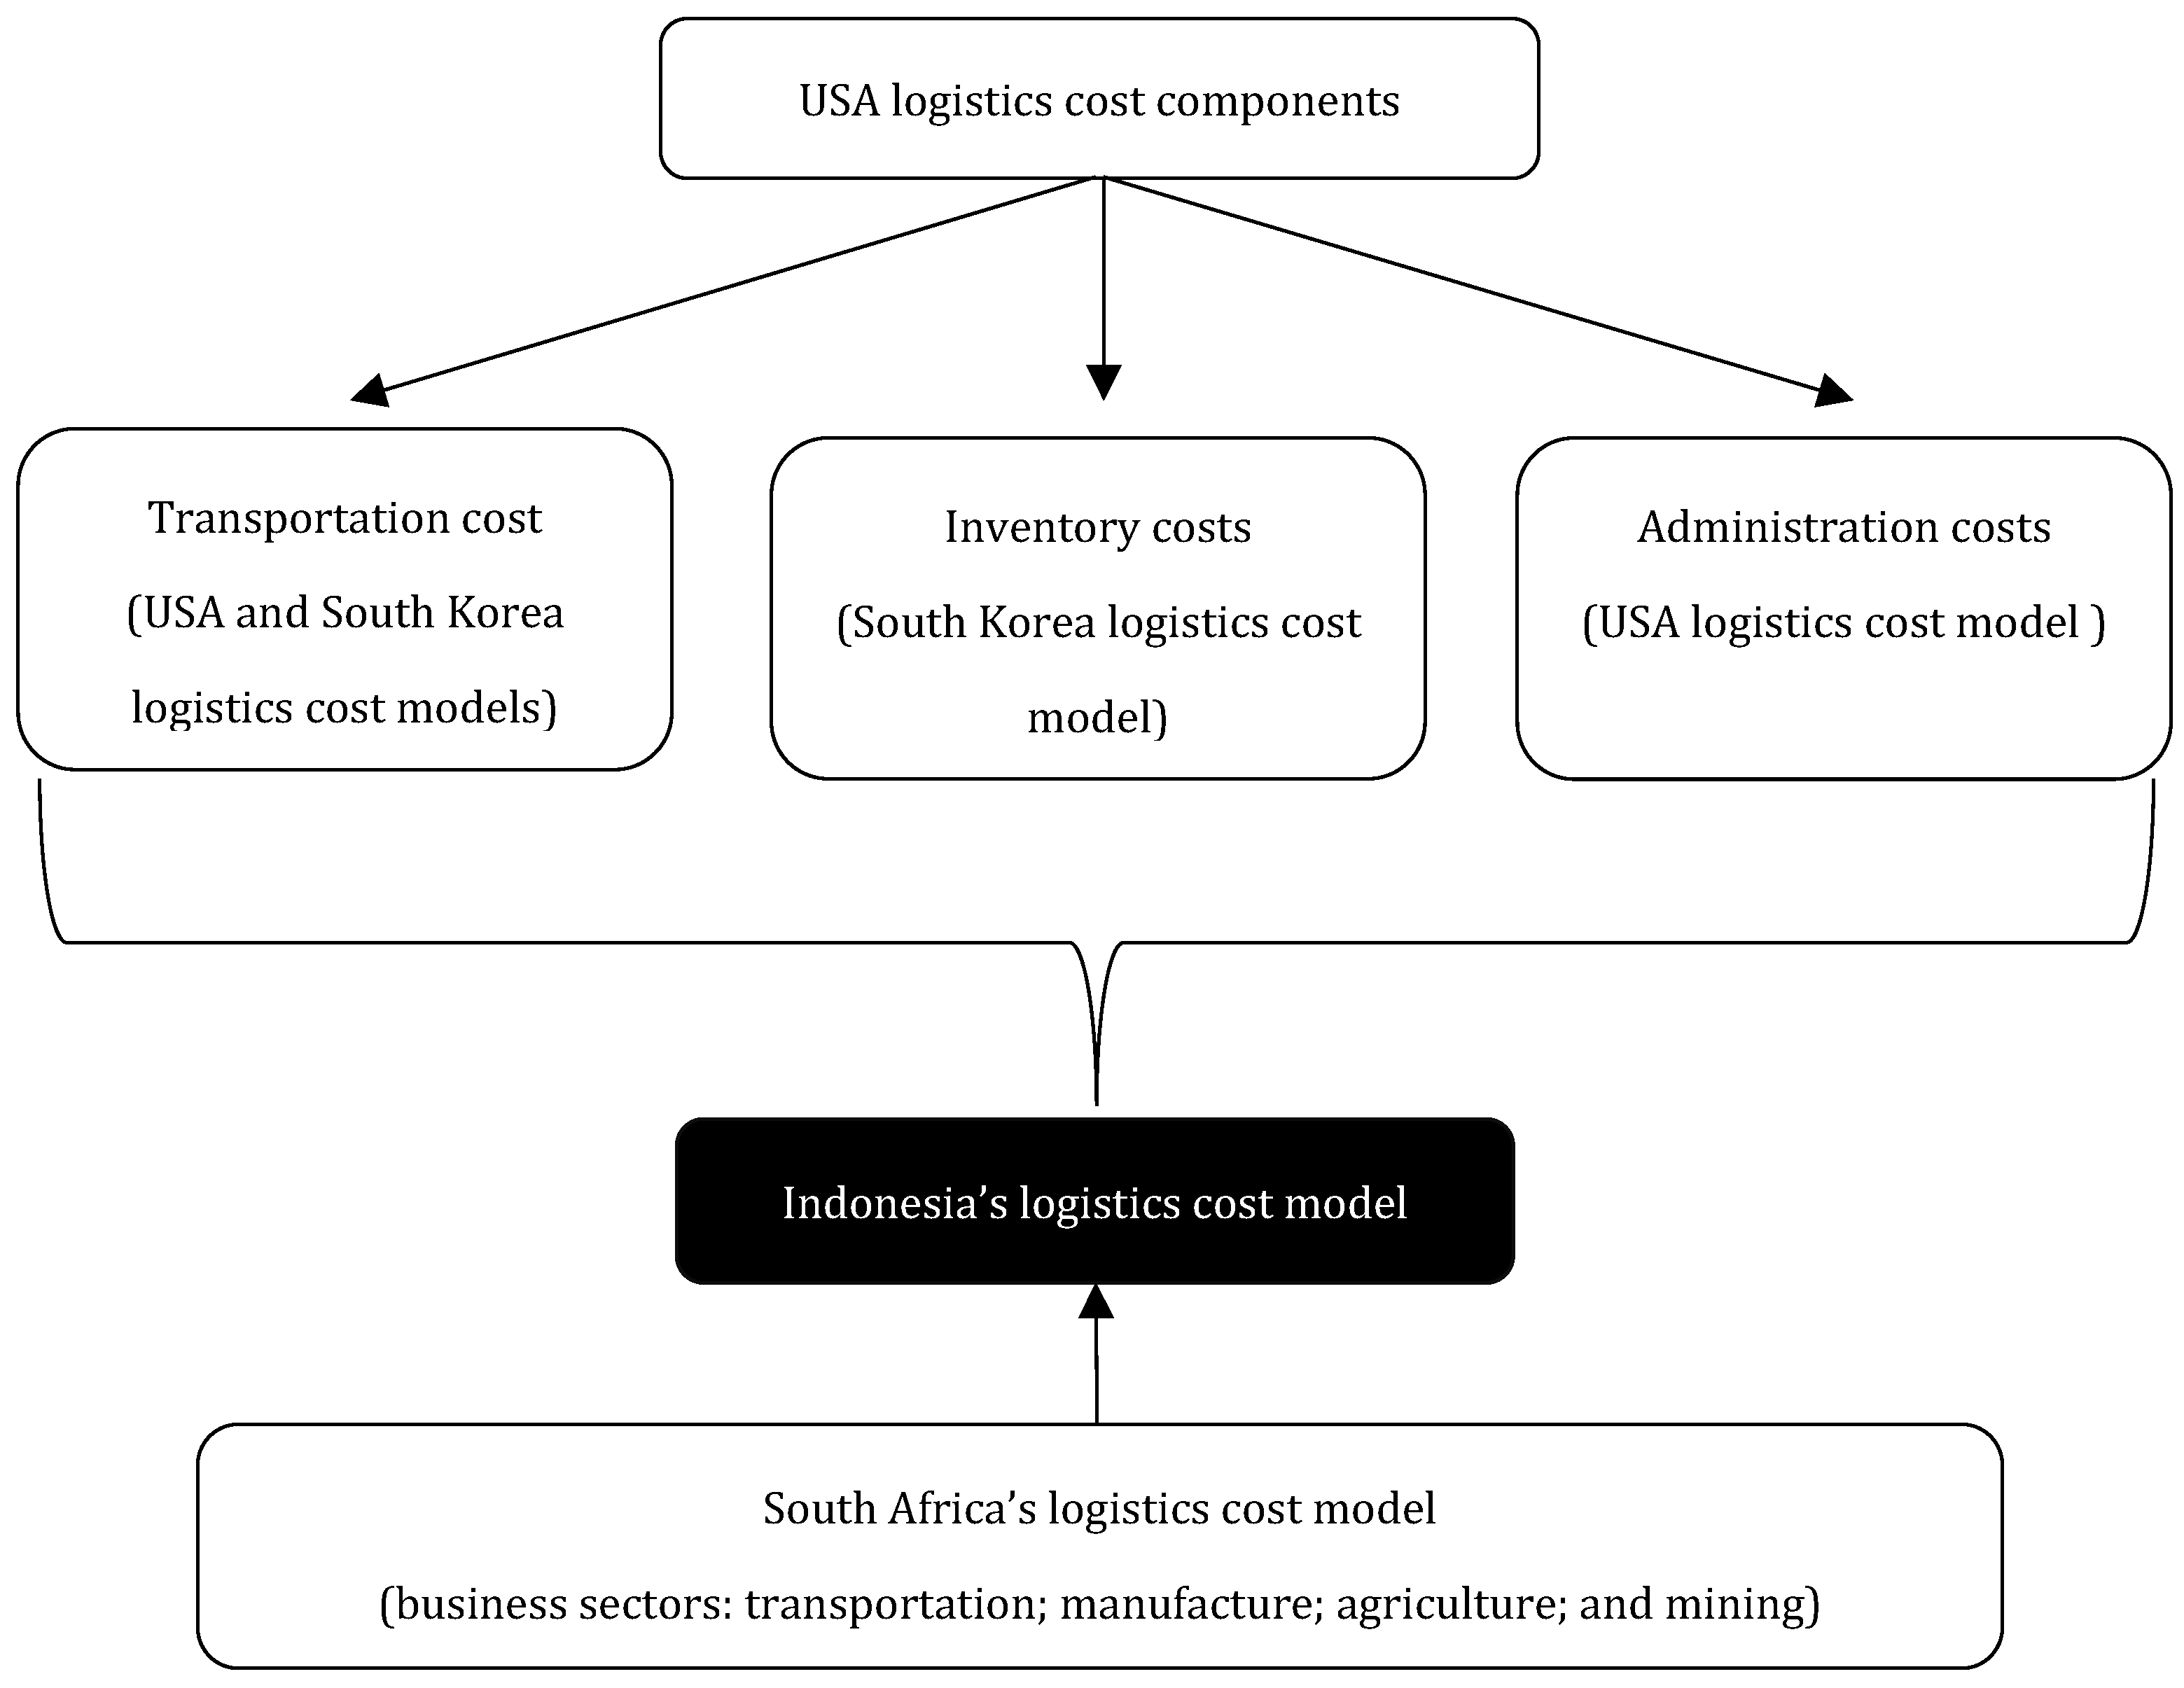
Although each country has its own model and method, in general, the components (widely used as the components of logistics costs) are divided into three categories—transportation costs, inventory costs, and administration costs [6]. Today, Indonesia chooses to adopt logistics models from the USA, South Korea, and South Africa into its own model, due to the simplicity of their cost structures and components. The USA model is used to calculate the transportation and administration costs. South Korea’s logistics model is used to calculate the transportation and inventory costs. Meanwhile, South Africa’s model is used to classify the economic sector, since both South Africa and Indonesia are “producing countries” of similar natural resources, namely agriculture and mining. Therefore, it is necessary to develop a logistical model that includes the cost components holistically at the macro level, based on the data availability obtained from both the pertinent public and private institutions.
In this study, we share the results of the latest model used to measure logistics costs at the national level and propose critical indicators that may need to be included in the measurement framework. Accordingly, our discussion in the following sections will be as follows: Section 2 discusses the importance and constraints that we face when assessing the total logistics costs in Indonesia, primarily due to the complexity of the logistics activities and the difficulty to obtain such relevant information. Section 3 provides the methods used to evaluate the logistics costs at the macro level in Indonesia. Section 4 supplies the results of the calculation methods. Section 5 proposes some recommendations in relation to the future logistics costs model. The last section concludes the study.
2. Urgency and Constraints in Calculating Logistics Costs in Indonesia
In the context of Indonesia, it is of a crucial matter to measure the logistics costs in order to fulfill Indonesia’s 2025 Logistics Vision, namely “The realization of a locally integrated and globally-connected Logistics System to improve national competitiveness and people’s welfare (locally integrated, globally-connected for national competitiveness and social welfare)” as stipulated in the Government Regulation of the Republic of Indonesia, Number 26 of 2012, concerning the blueprint for the development of the national logistics system, namely to accomplish the goals of determining the course of the national logistics policies, made to increase business capabilities and competitiveness, in order to compete globally. Hence, they are related to the document processing, distribution costs, and time efficiency in the export and import trades.
It is critical to calculate the logistics costs in Indonesia to create an integrated logistics system. Indonesia is an archipelagic country, so a proper calculation basis for effective and an efficient logistics cost management is required to formulate such a lower calculation of the logistics costs. Mulyadi [19] stated that an efficient and effective logistics management would help business actors compete since it created a superior added value that would create such competitiveness at the national and global levels. Eventually, it would therefore increase the economic growth and improve the society’s welfare.
Moreover, the calculation of logistics costs can also serve as a reference to improve Indonesia’s rank on the Logistics Performance Index (LPI), issued by the World Bank. In 2018, out of 160 countries surveyed, Indonesia ranked 46. It was still below that of several ASEAN countries, such as Singapore (ranked 7th), Thailand (32nd), and even Vietnam (39th), and Malaysia (41st). Haryana [20] said that one of the components assessed in LPI was the efficiency of customs procedures at ports. On the contrary, Kennedy [21] stated that, of the various components of LPI, the customs aspect accounted for the lowest percentage in 2018. It implies that Indonesia’s customs processes in logistics have not improved yet.
However, what we have to understand is that, when assessing logistics costs in Indonesia, we will always face various complexities. Indonesia’s complexities in the calculation of the logistics costs at both the micro level and the macro level are more or less the same as that of other countries, as revealed in various literatures, such as limited information on the statistical data and an extremely wide range of the structures and components of the logistic costs. Furthermore, constraints existing at the micro level have significantly impacted the macro calculations, such as in the calculation of logistics costs. Various available choices may hamper cost transparency, so they will subsequently result in the lack of information, extremely narrow viewpoints of cost management, or differences in the overhead cost allocations. One option significantly affecting the logistics costs is whether or not the corporation will outsource its logistics operations. In terms of measurement of logistics costs, it is still uncertain whether the outsourcing costs will enter into the logistics functions or not; in fact, the works of an outsourcing contract also include other functions and costs that we find difficult to assesses, since the lower the outsourcing rate is, the higher the likelihood of all relevant logistics costs being calculated will be [2].
In particular, one of the problems that Indonesia faces in calculating the logistics costs is that there are no certain institutions authorized to regulate and control the national logistics sector, so no authorized bodies have issued any binding regulations or procedures in relation to the assessment system of the logistics costs. The scope of the policies or regulations in relation to the logistics sector is not integrated yet; therefore, the approach and formulation of logistics regulations are still very partial. To make matters worse, the regional autonomy and the overlapped regulations created by various ministries and that of the central and regional institutions have made the licensing procedures lengthier, so tracking the logistical process of the value chain becomes complicated. Farahani et al. [22] stated that the information on (and the transparency of) each logistics process include factors used to assess logistics costs at the micro or macro level.
Wibowo dan Chairuddin [23] noted an example in relation to the complexity of the regulations on the transportation arrangement, namely the absence of a sole responsibility and the absence of a sole document employed in the intermodal transport processes. In general, each mode of transport still uses its own transport document, having not been integrated to other modes of transport, the responsibility of the person in charge of the transport often becomes unclear; moreover, it takes a relatively long time, as each stage of the supply chain is manually conducted.
Another obstacle is the absence of a specific indicator used to measure the logistics costs; therefore, there are no definitive measures in relation to the calculation of the logistics costs. Moreover, there are no consistent variables to be included in the calculation of the logistics costs at the micro and macro level. Pamudji and Achmadi [24] stated that a logistics indicator evaluated conditions, allowing the measurement and changes to occur in the existing logistics system in an area.
3. Methodology of Measuring Logistics Costs in Indonesia
It may take some time to find an appropriate formula to assess Indonesia’s logistics costs. The government of Indonesian relies more on the findings of the World Bank’s logistics performance index (LPI) and consultant reports when determining the course of strategic planning, to improve the country’s logistics performance by reducing the costs, as stipulated in the National Medium Term Development Plan (RPJMN), 2020–2024 period [7]. As mentioned in our introduction, the measurement of national logistics costs in Indonesia was a model developed by the Center for Logistics and Supply Chain Studies (CLoCs) from Bandung Institute of Technology (ITB), which adopted the US’s calculation model, involving three cost components—transportation, administration, and inventory handling. In the United States, those three logistics costs are calculated using the CASS Information System, Inc. When measuring the administration costs, Indonesia uses the USA model. Moreover, Indonesia uses the South Korean model, proposed by the Korea Transport Institute (KOTI), when measuring inventory costs. When measuring transportation costs, Indonesia adopted a combined model from the USA and South Korea. Figure 1 presents a framework of Indonesia’s model development of logistics costs.
The logistics cost model employs a bottom-up computation approach by combining specific data of each mode of transportation and the inventory handling activities, relating the income generated in each mode of transport to the percentage of the transported goods (to measure the costs of transportation), and relating the inventory assets/values to a certain type of costs (such as an interest and a risk). Moreover, the administrative costs are passed on to the total costs of those two logistics functions, namely transportation and inventory handling. Since all of the measured logistics costs are expressed as a percentage of the GDP (% of GDP), the data on the related GDP sector must be involved in each of the measurements. The logistics costs, measured as a percentage of the GDP, are considered as a benchmark used to measure the logistical efficiency [25]. MacroSys Research and Technology [26] stated that the percentage of the logistics costs in the GDP did not represent the logistics costs in the formation of the GDP since its contribution to the GDP only includes its added value from one sector to another sector; it does not serve as the sum of the turnover of all business activities in the economy. Therefore, the use of the logistics cost metrics on the GDP only shows a relative measurement of these costs.
The total national logistics costs sum up those three components of the costs as described in Equation (1). It is worth noting that some assumptions underlie the calculation of the national logistics costs as proposed, namely: (1) the assessed companies must be listed companies (listed at the Indonesia Stock Exchange (IDX)); (2) the assessed companies that are not listed companies listed at the IDX must have similar properties to that of the listed companies; and (3) a company’s costs shall serve as another company’s revenues.
;
;
.
The methodology used to calculate each component of the costs will, in turn, be elaborated in the following sections.
3.1. Transportation Costs
The total transportation cost is measured by adding up the costs of the transports by land (both public and private transports), by rail, by air, and by water, and the costs of the transport support services (refer to Equation (2)).
;
;
;
;
Below is the methodology for each element of the transport costs.
(i) Land transportation cost—adopting South Korea’s model, the land transportation costs () are separately evaluated based on the public or private costs . Hence, we have:
However, up to now, there have been no Indonesian government agencies officially reporting the statistical data of the land transportation costs; therefore, the data are not available on the national accounting data. Only the operating costs of the private trucks have statistical sources in Indonesia; they are taken from the statistical report of the Asia Foundation. The public land transportation costs are calculated by using the data of the receipts of the land transportation companies registered at IDX; moreover, they will be correlated to the percentage of goods transported by the trucks comprising several types of vehicles. The availability of the data used to measure the public land transportation costs are adequate than the costs of the private land transportation. Therefore, to estimate the personal costs, CLoCs measure the operating costs of the trucks required for a certain distance in a 1-year period. Mathematically, Equations (4) and (5) show the models of the public and private land transportation costs, respectively.
;
.
Equation (5) involves the distance covered as a determining factor in the costs of the private land transportation. It discusses an important issue raised by Rietveld and Vickerman [27]. They stated that it was of important matters to involve various geographic factors such as distance when determining the total transportation costs since, occasionally, mileage exerts, such a continuous exponential upward pressure on several logistics costs by either extending transit times (and, thus, wage costs), increasing energy consumption or depreciating assets.
(ii) Rail transportation cost—the actual cost of rail transportation is estimated by using the data obtained from the railway companies in Indonesia. The statistical information required from the companies is the income generated during the year in which the logistic functions were carried out, such as the freight revenues and the rail transport incomes. This measurement is based on an assumption that the rail transport revenues are equal to the rail costs. The rail transport’s business share for Indonesia’s national rail administration always suffers a deficit whenever the operating costs of the rail transportation exceed its revenue. The mathematical equation used to measure those costs is not a complex equation since it only accounts for a ratio of the freight to the rail freight, which will then be multiplied by the rail revenue, as in Equation (6) shows.
Various efforts made to improve the quality and the details of the rail transport data in order to increase the comprehensiveness of aspects of this model are being carried out by various experts.
(iii) Water transportation cost—water transportation cost refers to the transportation of goods/commodities among Indonesia’s ports. Estimating the water transportation costs employing a cost indicator collides with the coastal companies’ essential characteristics characterized with a complex cost structure and various costs [28]. Therefore, the statistical information on the freight revenue and water transport revenue is required in order to determine the total water transportation costs. Related data are obtained from the annual financial statements of the companies dealing with maritime logistics activities, such as PT. Pelindo (Indonesian Port Company) and PT. ASDP Indonesia Ferry. Equation (7) shows the formulation of the water transportation costs.
.
(iv) Air transportation cost—air transportation costs account for a minor contribution to Indonesia’s total costs of the transportation goods. However, we still calculate the logistics costs of this transportation mode to analyze the trends and development of logistics through air transports and to take such corrective actions in certain areas. These figures are taken from the data on air cargo revenues obtained from both national airlines and international airlines listed at IDX. Moreover, both the volume of goods carried and the ship capacities, both of which are measured with tons, are also included in the search for the total costs of air transports. Equation (8) shows the mathematical model employed to calculate the total transportation logistics costs.
.
The model employed to measure the air transport is different from that of all of the other modes of transport, and the difference lies in the cargo and the cargo carrier of each mode of transportation. If compared, those two indicators represent an economy of scale. Camisón-Haba and Clemente-Almendros [29] emphasized the fact that the economy of scale, obtained from the size of goods transported by companies through a route, and obtained from the size of vehicles transported each year, is a more crucial factor used to determine the transportation costs than the mileage.
(v) Costs of the transport support services—the agents rendering a support service in the transportation activities do not control the modes of transport. They simply serve to organize any transportation services for the operators and the shippers, and they earn revenue for the services that they render. These revenue data are used to measure the costs of the transportation support services because they weigh on the companies that use the services. This cost calculation model is much like the transportation cost model. It is created by connecting the transportation support service providers’ income to the average percentage of the freight costs for all modes of transport. Equation (9) illustrates the mathematical model measuring the costs of the transportation support services.
3.2. Inventory Handling Costs
The inventory handling costs, as in the measurement of the transportation costs, combine all of elements of costs taking place during the management activities of the goods/commodity inventory, such as storage, warehousing, and risks of accidents. The total inventory handling costs shall be formulated as follows.
s = storage costs;
Furthermore, the measurement model for each element of the inventory handling costs will be elaborated in the next section.
(i) Storage costs—the storage costs are calculated by examining the average inventory value for the past two years at each company, and the obtained value will then be multiplied with the loan interest rate (Equation (11)).
n-th year;
year’s inventory;
n-th year.
(ii) Warehousing costs—each of the types of the warehousing costs—warehouse operational costs and warehouse depreciation costs—is separately measured. The total operating costs are estimated based on the value of the inventory assets, while the total depreciation costs are estimated based on the value of the fixed assets. Equations (12) and (13) show the models used in these two calculations.
w = warehousing operational costs;
the percentage of inventory assets to the company’s total assets.
wd = costs go;
(iii) Risk and damage—the costs of risks and damage are measured by multiplying the level of damage with the average inventory assets for the past two years. Equation (14) shows the calculation model.
-th year inventory;
-th year.
3.3. Administration Costs
The administrative costs are the percentage of the administrative fees charged for any costs incurred in the transportation activities and the procurement handling (refer to Equation (15)).
South Africa’s methodology, used to measure the administrative costs proposed by Botes et al. [30], is adopted here. The percentage of the administrative fees that are charged does not vary pursuant to the type of the storage and the mode of transportation. In Indonesia, the logistics administration fee is set at 4% of the inventory handling and the transportation costs, and it is in line with the methodology consistently employed in the United States.
All of the above-mentioned costs are calculated based on the data obtained from the government or private institutions, which have assessed the structure of the logistics costs found in various representative companies, in four business sectors—transportation, manufacturing, agriculture (including livestock, forestry, and fisheries), and mining (to calculate inventory costs). The classification of these business sectors follows the South Africa/Council for Scientific and Industrial Research (CSIR) measurement model of logistics costs, since South Africa and Indonesia have similar economic structures and natural resources (see Figure 1). Table 1 summarizes the statistical data required to do all of the calculations together, with the sources, releasing the data.
4. Discussion of Model Outputs
4.1. Indonesia’s Logistics Costs in the Global Context
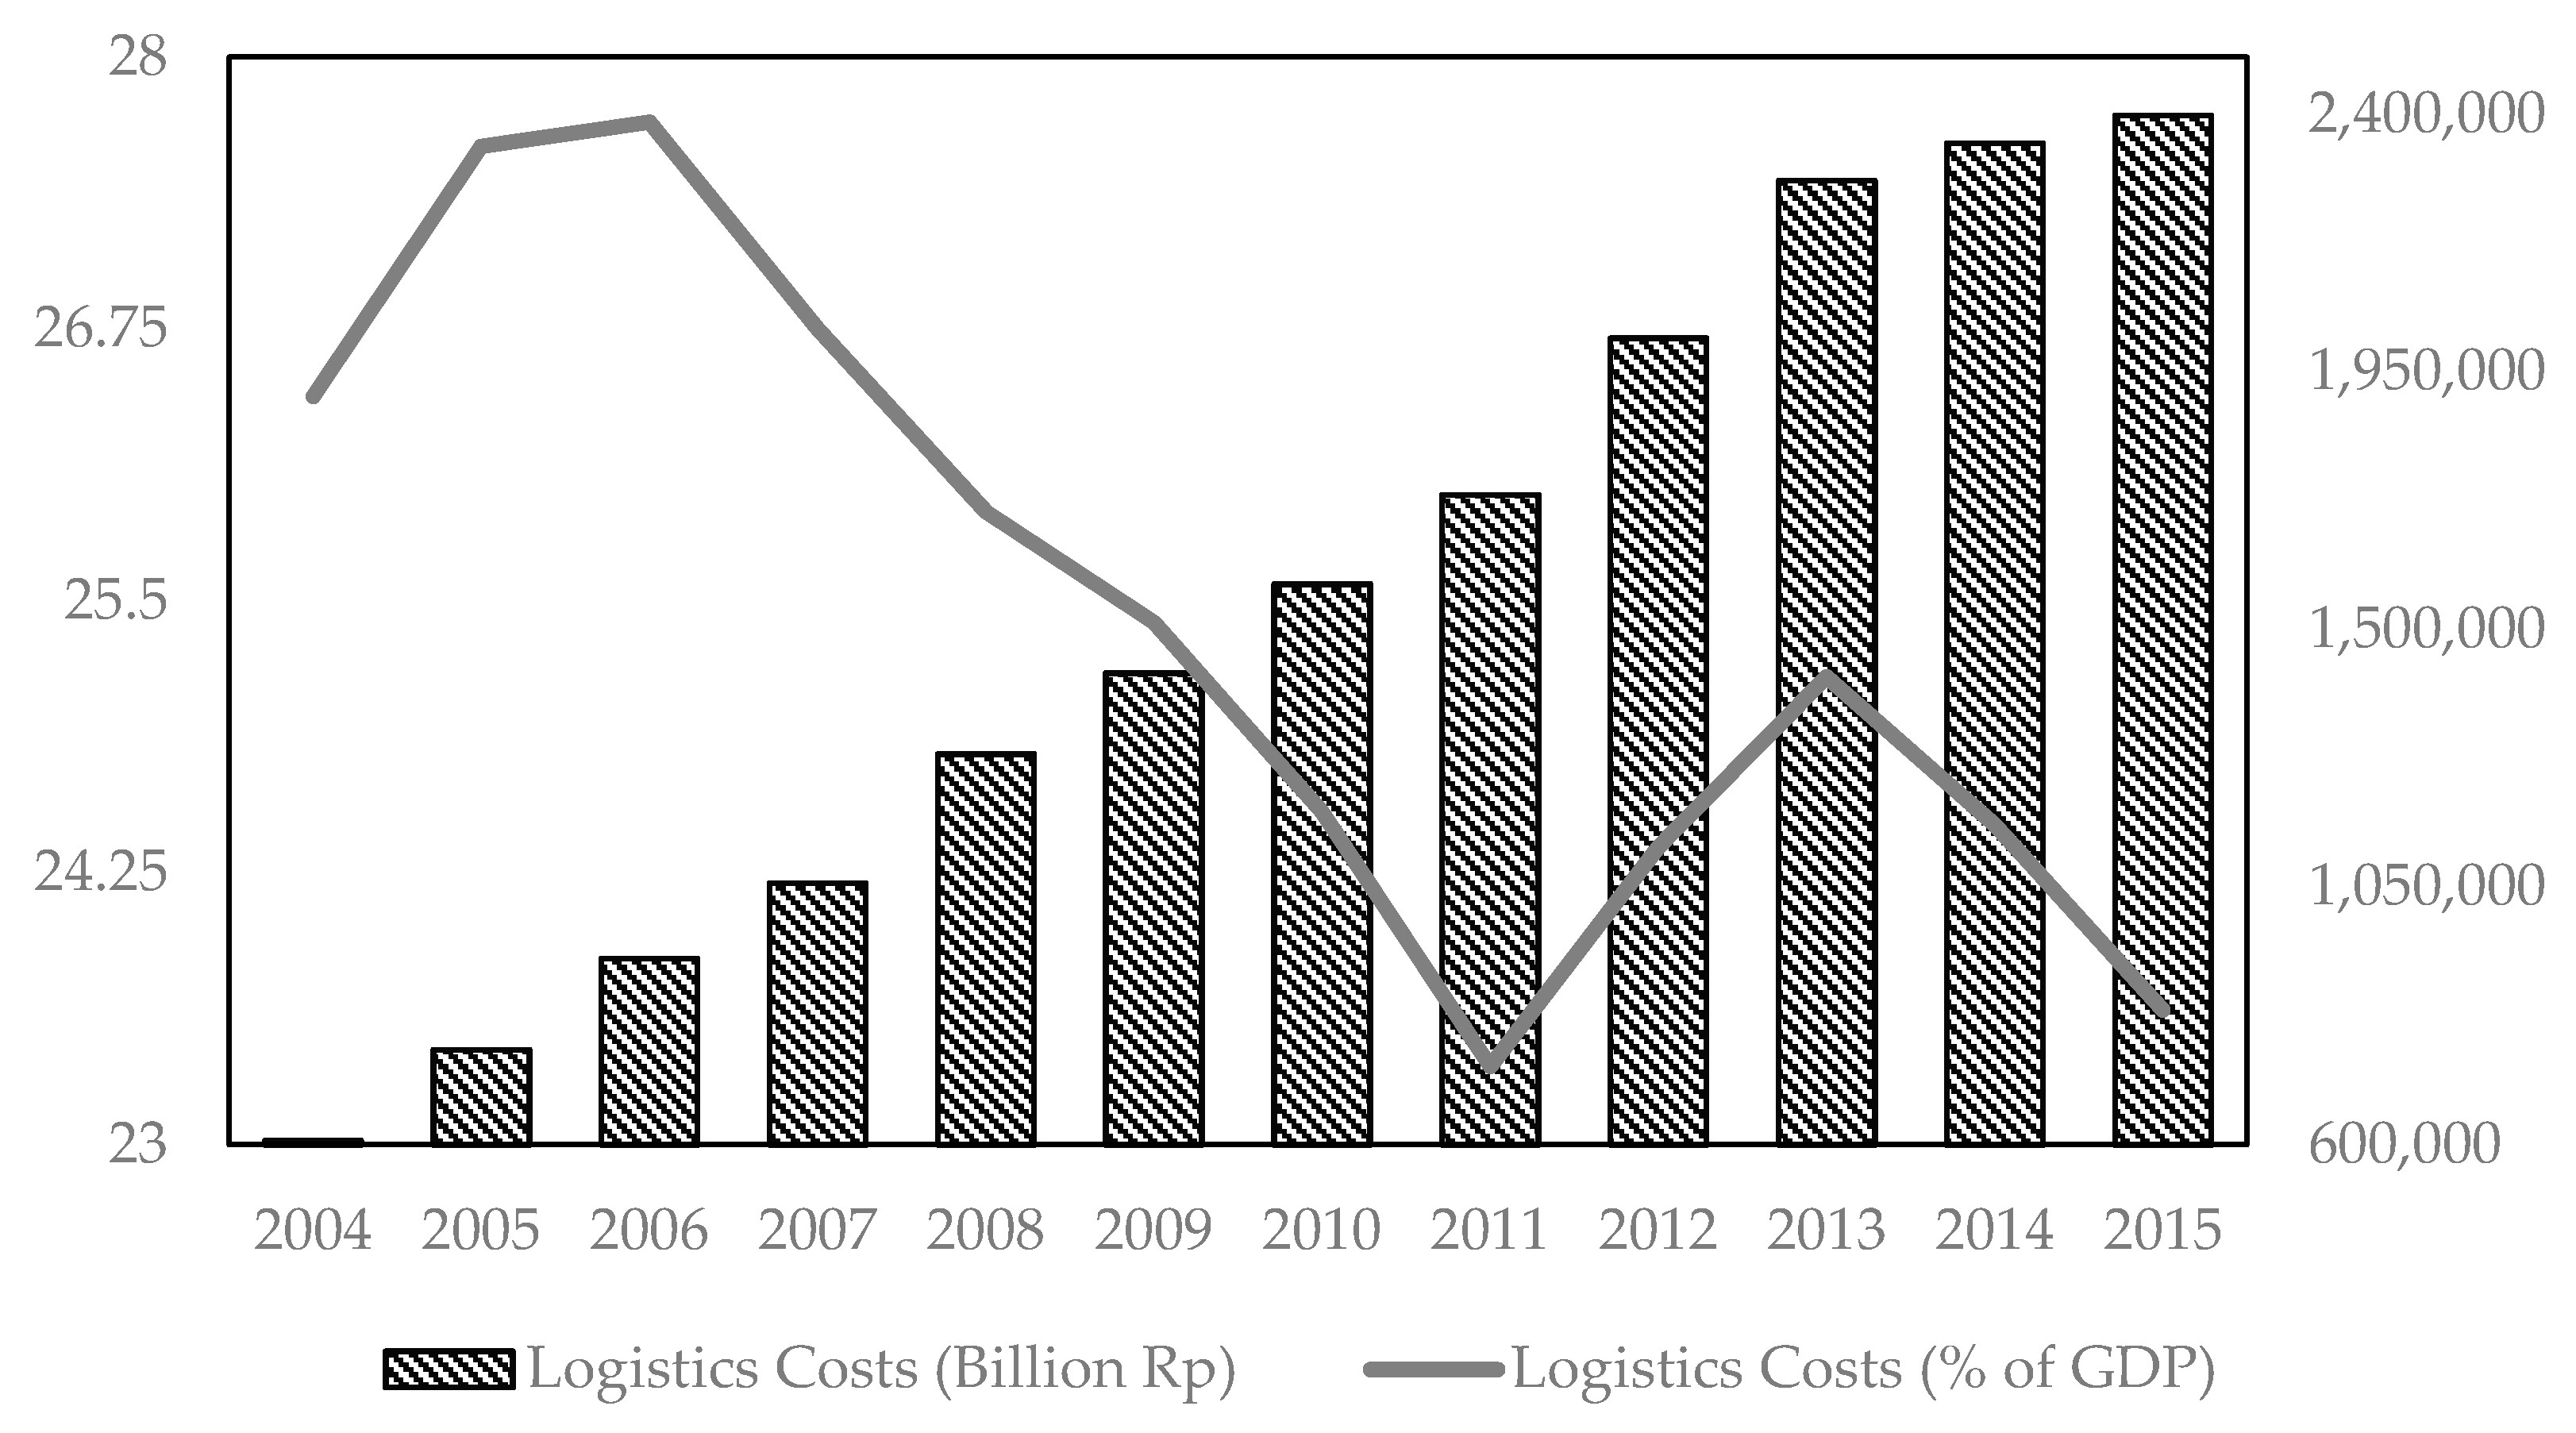
The model output plays a significant role in providing adequate information in relation to the performance of Indonesia’s logistics. Moreover, it underlies the government’s development goals of the logistics costs in 2024, accounting for 18% of GDP. It is a very ambitious target, given a low annual decline of the national logistics costs at GDP. The last national logistics costs were calculated for the last time in 2015. They were IDR 2,397,464 billion; they accounted for 23.62% of GDP. Accordingly, to achieve the 2024 target, the required logistics decline based on last year’s calculation should account for 23.7% of the GDP. In other words, the annual cost reduction should at least be 2.9% of the GDP in order to realize the target.
What matters is that efforts made to realize the targets are confronted with the fact that the annual rate of the logistics cost decline is not so big. As shown in Figure 2, elaborating the data on the logistics costs for the 2004–2015 period, Indonesia’s logistics costs fell by 10.6% of the GDP, so the average national logistics cost decline rate was only 1.2% of the GDP. Despite the fact that this simple calculation ignores deviations, the authorities should consider the trends of this low decline rate when taking any corrective actions.
Additionally, Figure 2 shows that Indonesia’s logistics costs vary, ranging from 23% to 28% of the GDP. Accordingly, in terms of the global level, the size of Indonesia’s logistics is high. Pienaar [32] calculated South Africa’s national logistics costs. He discovered that the ratio of logistics costs to GDP amounted to 11.7% in 2015. The Council of Supply Chain Management Professionals [33] stated that the USA’s logistics costs account for about 7.9% of the GDP in 2015. However, its total absolute logistics costs are the highest in the world, it amounted to USD 1408 in 2015. The Australian logistics council [34] revealed that Australia’s logistics costs account for 8.6% of Australia’s GDP in 2013 (almost one-third of that of Indonesia). In fact, Indonesia’s logistics costs are still much higher than that of Finland and Germany, which rank first and second in Europe. The national logistics costs of those two European countries amounted to 11.4% and 8.6% of their GDP in 2015, respectively [32]. Moreover, Indonesia’s logistics costs are much higher than that of other developing countries. Armstrong and Associates [35] revealed that the logistics costs of developing countries ranged from 11 to 15% in 2015.
Due to different methods employed in different countries to measure their logistics costs, and due to some sporadic measurements, it is difficult to compare the logistics costs fairly at the global level. By employing the artificial neural network method [36], experts have estimated the global logistics costs of 24 countries with various geographic areas. One thing posed as a challenge to the estimation of the costs. It was the availability of data and the data constraints in the observed countries. To solve that problem, the types of the data employed in those countries should be the same. Moreover, the variables previously employed by Bowersox and Calantone [37] and Delaney and Wilson [38], such as economy, income, country size, and transportation, were included in order to observe their relations to the logistics costs.
In their study, Bowersox et al. [36] found out that, in 2010, China’s logistics costs rank the first of those countries. They accounted for 17.7% of the GDP, while the United States logistics costs ranked last. They accounted for 10.1% of the GDP. Globally, in 2000, it was estimated that the ratio of logistics costs to GDP accounted for 13.7% of the GDP. It was 0.3% higher than that of the 1997 GDP. Moreover, the logistics efficiency tended to increase in the developed countries, while the low-income and middle-income countries tended to waste their logistics costs. Therefore, Bowersox et al. [36] emphasized the importance of investing in the logistics infrastructure and increasing the developing countries’ efficiency. Moreover, the world will increasingly be focused on the achievement of an effective and efficient logistics relation among the developing countries and the regions.
The results of that study played a significant role in Indonesia’s current situation. Subiyanto and Rini [39] stated that Indonesia’s logistics infrastructure is limited in terms of its quality and quantity. Although many infrastructure projects have been undertaken, only a portion has been completed and readily operated. Some of the problems found in the infrastructure sector are caused by the lack of technical quality required to support the planned logistics activities. On the other hand, Subiyanto [40] stated that high logistics costs posed the biggest obstacle in the investment activities, especially in the infrastructure sector. In his study, he found out that domestic logistics costs played a significant role in the total investment in cement used in the infrastructure development. These results would require the government to immediately make a policy ensuring the building and development of the logistics infrastructure intended to reduce the logistics costs, so they would realize the predetermined target.
In essence, the logistic costs are a primary indicator in a country’s economic development. Therefore, logistics analyses at the macro level must be supported by the proper tools. Bowersox et al. [36] concluded that identifying logistics costs as a percentage of GDP like what Indonesia had done was more reliable than measuring the costs in an absolute value expressed in USD or any local unit of currency. The US National Research Council [41] considers the ratio of logistics costs to GDP as one of the leading economic growth indicators. Accordingly, we would like to emphasize the importance of a more detailed analysis on the logistics costs/GDP by providing a discussion of the components of the logistics costs.
4.2. Components of Indonesia’s Logistics Costs
As shown in Figure 3, the itemizations of the logistics costs per component indicates that, in the whole stage of the calculation, the compositions of the logistics costs tend to remain unchanged. The transportation and inventory costs dominate the structure of the national logistics costs in Indonesia. On average, in 2004–2005, the transportation and inventory costs accounted for 46.40% and 47.94% of the total national logistics costs, respectively. Meanwhile, the administrative costs accounted for an average of 4.39%, which constituted the lowest cost.
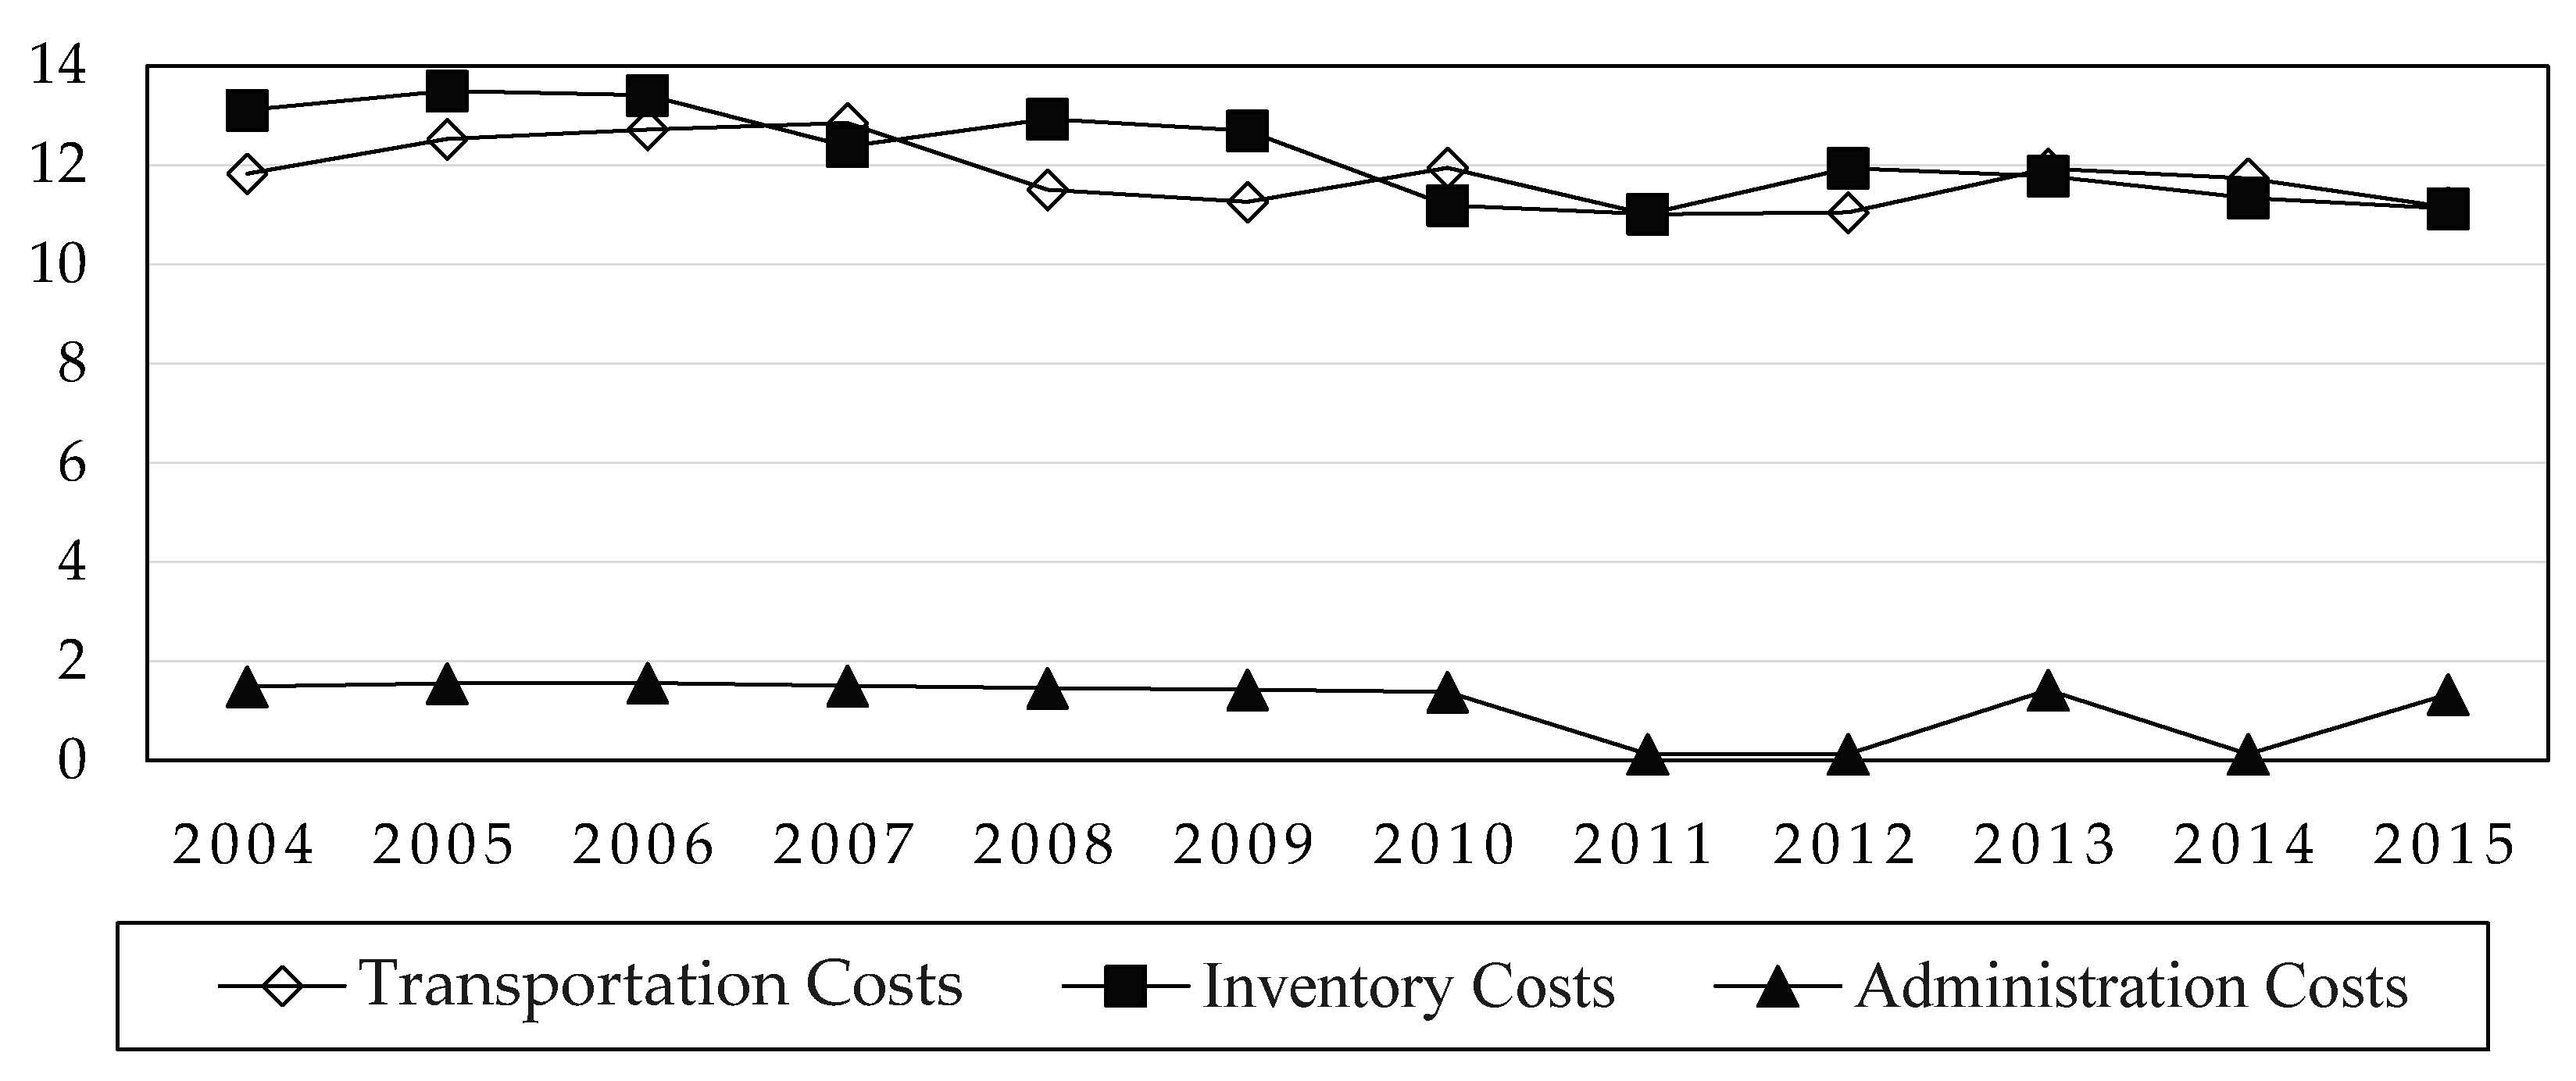
If measured with the ratio to GDP as shown in Figure 4, the average transportation cost accounted for the most considerable contribution (11.8% of GDP) in the same period. Then, it was followed by the inventory handling costs with an average cost amounting to 11.24% of the GDP. On the other hand, the administration fees accounted for the smallest percentage amounting to about 1.13% of the GDP. Figure 5 shows us that each of the individual components has shown a negative trend; however, it is very subtle and even stagnant. Transportation, the biggest cost component and the most important indicator in the international and domestic trades is of particular concern since it has decreased significantly. In 2004–2015, transportation costs fell by 0.78%, while inventory handling costs significantly fell by around 13.48%. Taking into account these figures, we would like to reemphasize what Subiyanto [40] suggested. It is possible for us to complete the logistics infrastructure projects on time and still pay attention to the quality and distribution aspects. Without this pertinent oversight, the road to the target logistics costs set out in the RPJMN will face various obstacles.
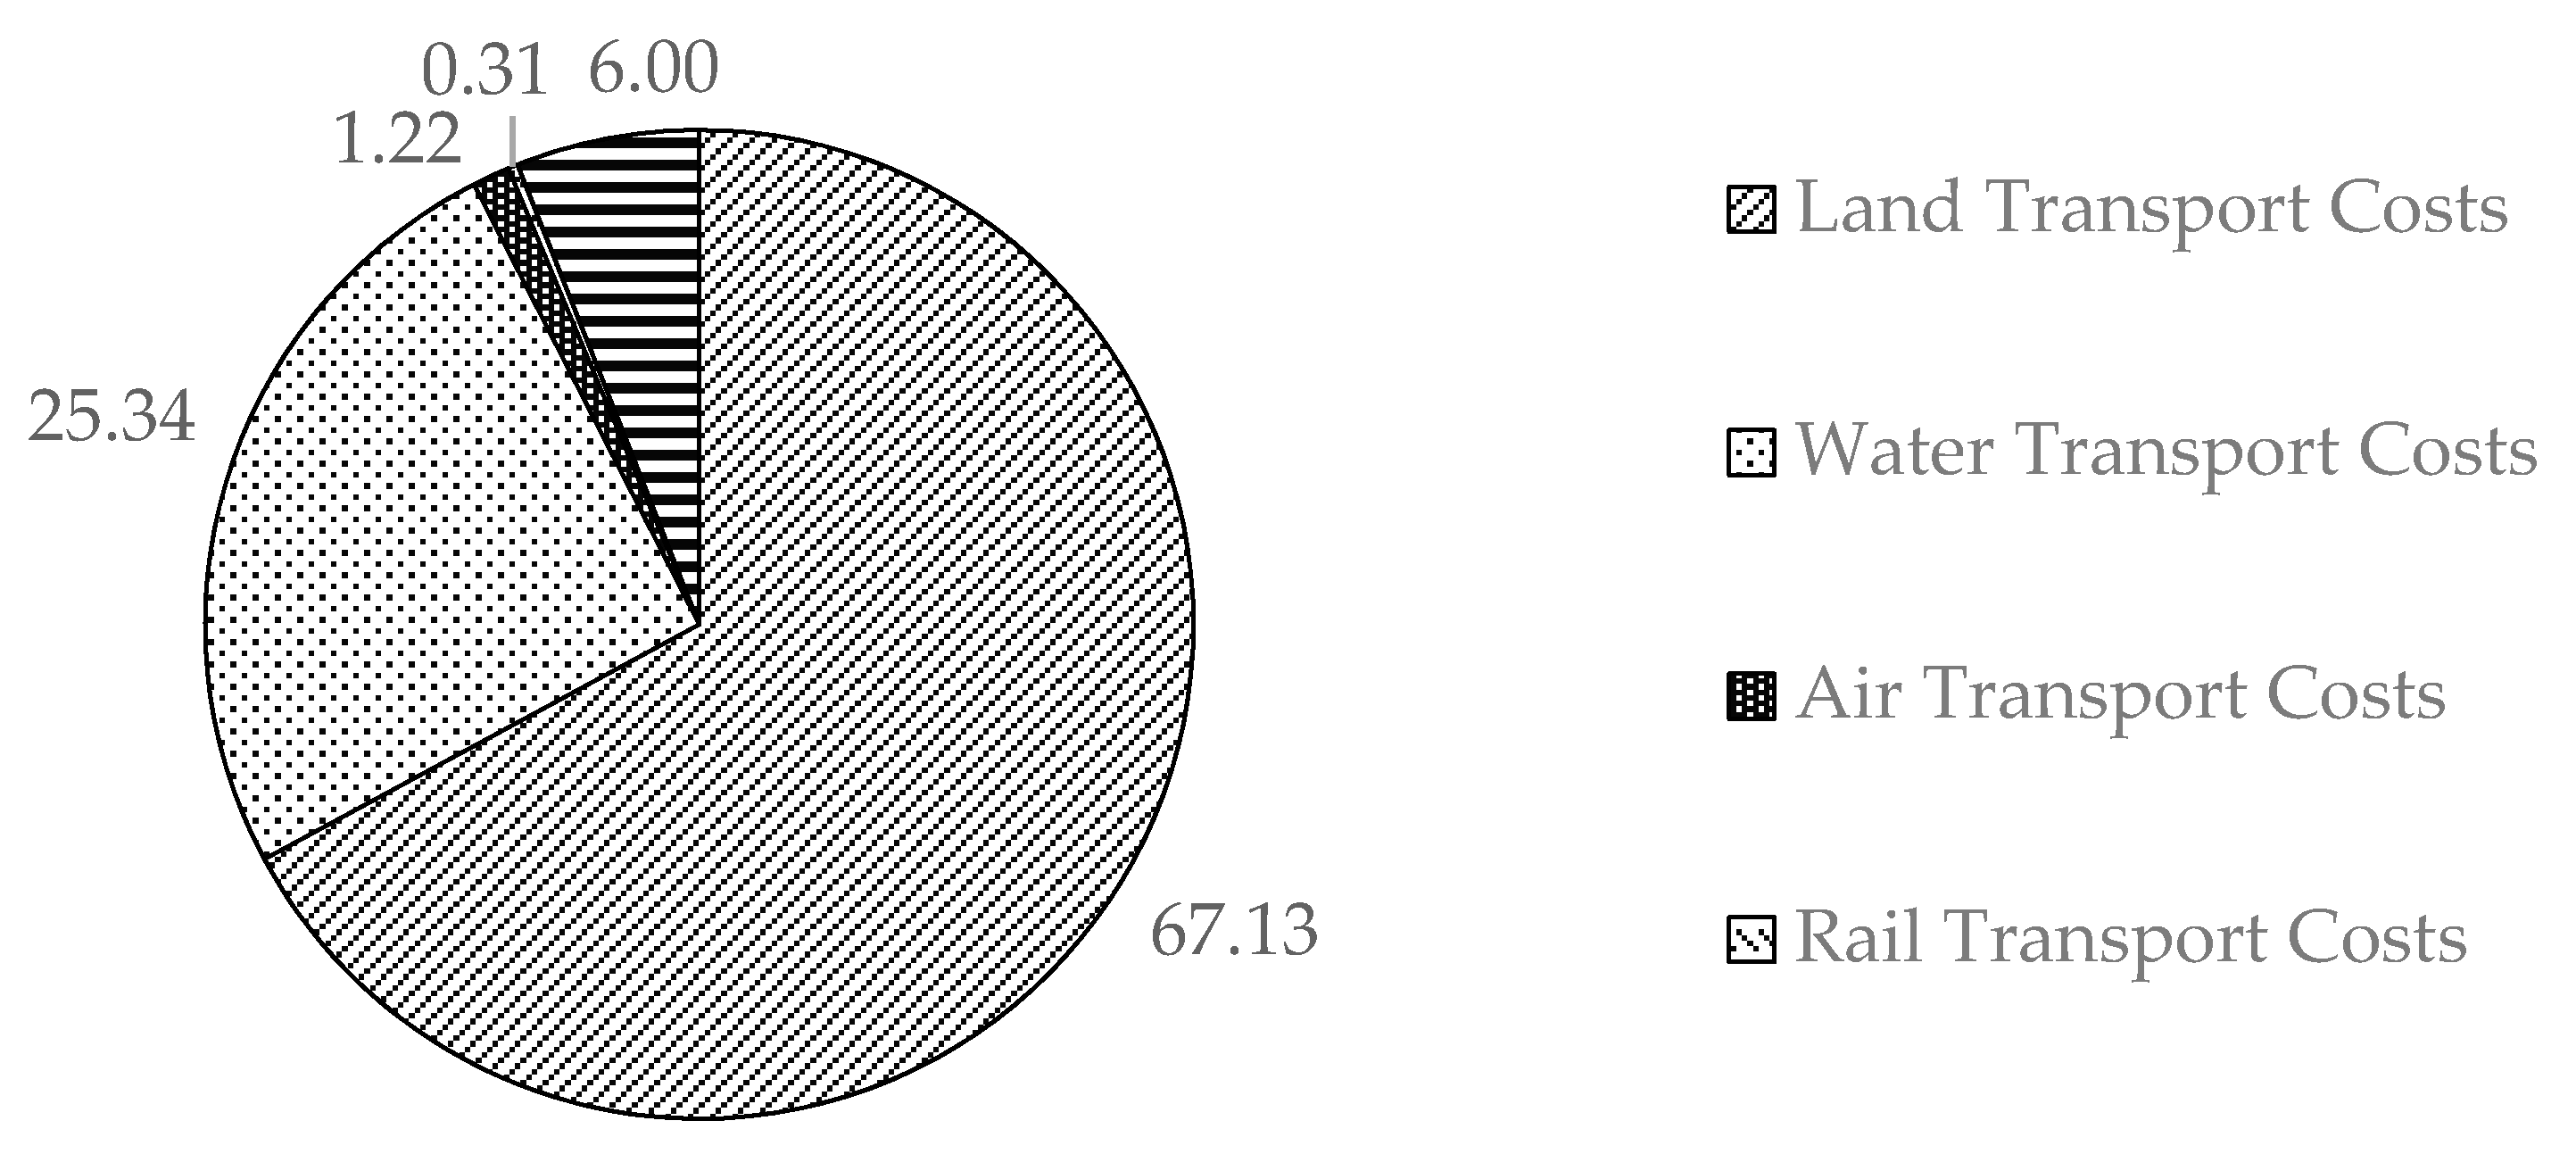
As shown in Figure 5, from 2004 to 2013, the modes of land transports dominated the logistics costs of the transport with an average expenditure amounting to 67.13%. The modes of water transports ranked the second with an average expenditure amounting to 25.34%. The modes of rail transports ranked the last with an average expenditure amounting to 0.31%, so that component was negligible. Those figures have suggested Indonesia be more focused on the development of the modes of water and rail transports since transporting goods/commodities by land costs ten times as much as that by sea or water. Moreover, the tonnage of the land and water transportation is also much higher than that of land; thus, allowing a logistical efficiency. Accordingly, the government needs to promote investment and infrastructure development to support the modes of water and rail transports, so they will be able to reduce the burden of the modes of land transports.
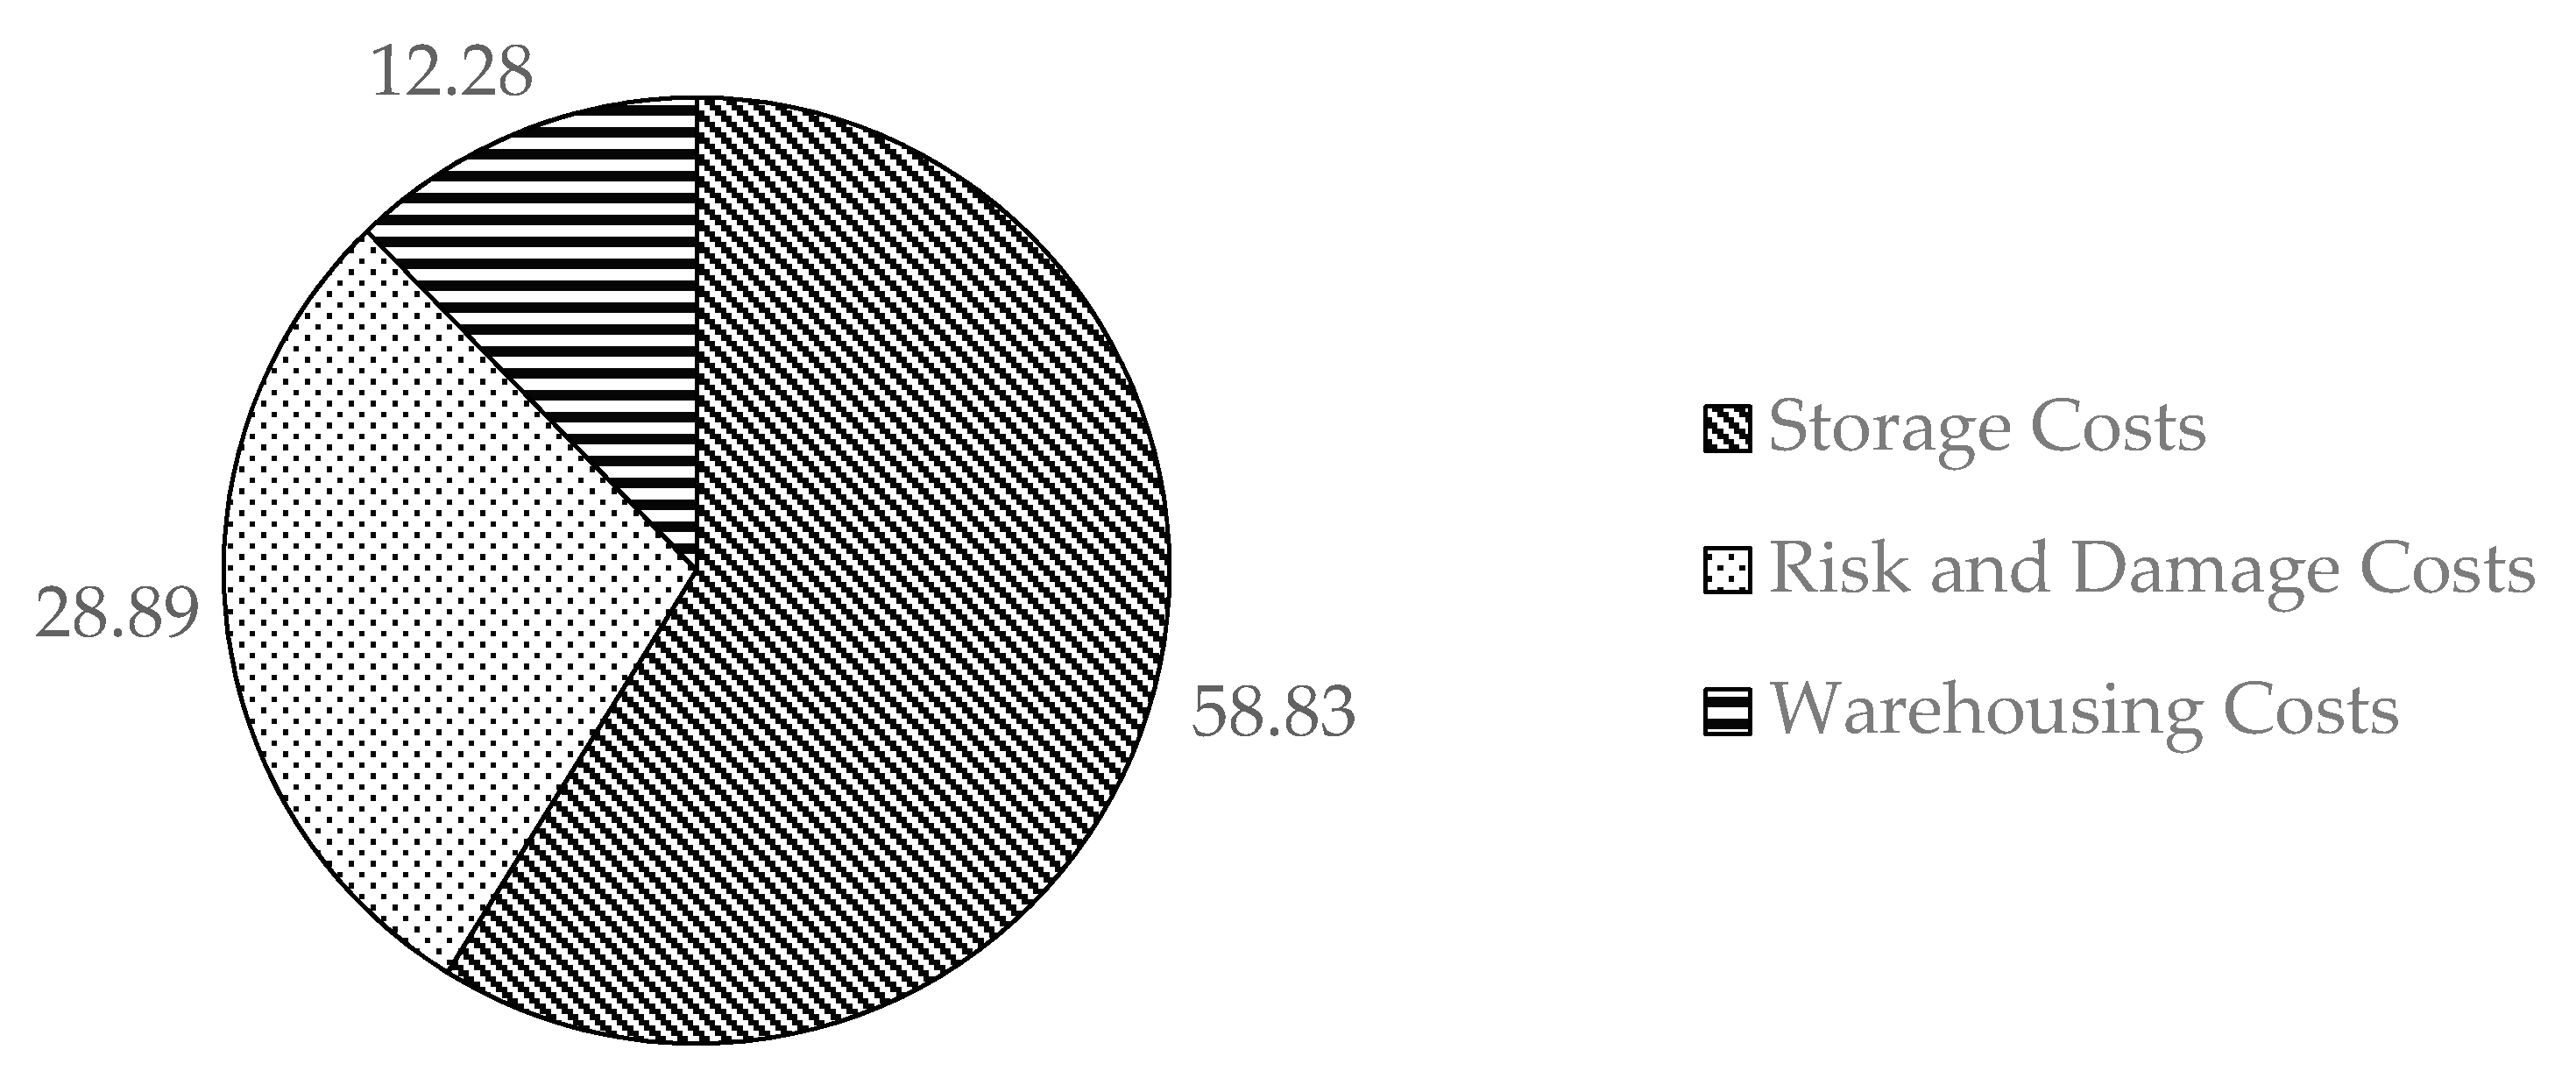
Furthermore, with an average cost amounting to 62.3%, the inventory costs dominated the components of the storage costs. The risk and accident costs ranked the second with an average cost accounting for 28.89% of the total inventory costs. By comparison, the warehousing costs ranked last, with an average cost accounting for 12.28% of the total inventory costs (see Figure 6).
From an economic point of view, as shown in Figure 2, the increased amount of the national logistics costs in Indonesia seems to be highly correlated to the adjusted fuel prices and interest rates [6] since the modes of land transports operationally dependent on the fuel prices account for the biggest transportation costs. Meanwhile, the interest rate is directly proportional to the cost of savings. It means that an increased interest rate may eventually increase the total cost of savings. Having highly contributed to the total inventory costs, an increased interest rate will indirectly increase the inventory costs and will ultimately affect the total national logistics costs.
Taking into account the results of the calculation of the logistics costs above, we notice that the transportation sector has significantly contributed to the national logistics costs. Therefore, we can infer that it is important for us to establish such adequate transportation networks, lateral installations, equipment, and fleets is very necessary to achieve the imagined growth and general development of the country [42]. To that end, the policy makers made several strategic formulations in relation to the transportation sector in order to achieve one of the objectives of the 2020–2024 RPJMN, namely reducing logistics costs to GDP by up to 18% in 2024. In the Government Regulation of the Republic of Indonesia, Number 26 of 2012, concerning the blueprint for the development of the national logistics system, the Indonesian government designed strategies and programs to develop transportation infrastructure. The strategy to be carried out is to build domestic connectivity, local connectivity, national connectivity, and integrated global connectivity to increase the smooth the flows of goods to support the efficiency and effectiveness of the national logistics system performance. The main focus of infrastructure development and development activities is directed to (a) main ports and international hubs, (b) sea transportation, (c) river, lake, and ferry transportation, (d) road transportation (trucks), (e) rail, and (f) airports and air transportation.
In the marine transportation sector, several things were established to connect the western part of Indonesia to the eastern part of Indonesia, including building of export–import ports and international hub ports in the western Part of Indonesia and the eastern part of Indonesia, carrying out several river revitalization programs, developing the ferry transportation industry in the river, lake, and crossing transportation sector to increase the smoothness and capacity of the shipping lanes in the southern, central, and northern belts, to form an efficient multimodal transportation network. One program that will be implemented in the road transportation and traffic sector will be to gradually reduce the road loads by increasing the capacity of the existing roads and developing a multimodal transportation network and logistics center as an effort to improve the smooth transportation of goods from the production center to the export–import and inter-island outlets, increasing the connectivity of the national road network with ports and railway stations, which are logistics routes, and improve the capacity of the cross-regency/city road services.
In the rail transportation sector, the government will develop a rail network for long-distance freight transport in Sumatra, Java, and Kalimantan, increase the capacity and rail services through the development of a rail transportation from/to ports/container terminals, dry ports and industrial centers, and accelerate the construction of double-track railway lines in Java. In the air transportation sector, international cargo hub ports in Eastern Indonesia and Western Indonesia will be developed, so they will effectively and efficiently be operated as an integral part of the multimodal transport system intended to realize the national and global connectivity. Moreover, the multimodal transportation sector focuses on the development of a connectivity between the sea/water transportation and mass land transportation (sea to rail and truck connectivity).
5. Recommendation for Future Logistics Costs Model in Indonesia
As explained in the previous section, Indonesia’s national logistics costs are measured based on the data and information related to logistics processes and activities in companies listed at IDX. There are three logistical processes and activities constituting the components of Indonesia’s national logistics costs, namely transportation, administration, and inventory. Of the three components, transportation costs play the most crucial role in determining the logistics costs due to their most dominant contribution. Abdi et al. [43] and Susanto et al. [44] stated that controlling the transportation costs were of crucial matters to the control of the logistics costs. Therefore, reduced transportation costs would play a crucial role in saving the total logistics costs. Therefore, we need to accurately and transparently measure the components of these costs to trace what factors may affect these costs. In that way, the policymakers will be able to determine strategic steps taken to reduce the logistics costs.
Thus far, transportation logistics costs in any country, including Indonesia, have been calculated involving a limited set of factors [29]. As a result, their measurement models are prone to specification problems since they do not fully capture the complexity of the interactions between the supply and the demand of these services and variations to the routes, establishments, and products. As mentioned in the previous section, one of the measurement models of Indonesia’s logistics costs has created some limitations, in that it does not involve many spatial dimensions, such as distance, to measure the transportation costs. Only modes of private land transportations have considered that particular dimension, by involving the distance traveled when calculating the costs. Hesse and Rodrigue [45] advocated the inclusion of distance in future studies on the freight transport since it would provide “a more comprehensive insight into the nature of distribution and its geographical dimensions” and enable the value chain integration.
Camisón-Haba and Clemente-Almendros [29] defined distance as a major determining factor in the transportation costs, regardless of the infrastructure coverage and quality improvements. Brun et al. [46] stated that distance had a positive, exponential, linear correlation to the transportation costs. The further the distance was, the higher the potential to increase the derivatives of the transportation costs, such as energy/fuel consumption, depreciating assets and extending transit time. Therefore, distance was closely related to increased costs. Márquez-Ramos et al. [47], Micco and Perez [48], and Wilmsmeier et al. [49] revealed that a 1% increase in the distance per trip (the unit in kilometer) would result in a 0.25% increase in the freight costs. Although the tariff of the transportation services is mainly determined by supply and demand situations and conditions, a geographical distance undoubtedly affects the transportation costs. This factor affects certain essential elements closely related to the transportation activities.
In addition to distance, Minken and Johansen [50] included the transportation time as a crucial factor when determining the transportation costs. To define this factor as a cost, they multiplied the hourly cost by the duration (in hours) per trip and the number of trips. Grønland [51] stated that the time factor greatly affected other transport-related costs, such as wages, capital costs, annual registration fees, insurance, and insurance and administrative costs. Accordingly, it was essential to including the time factor in the calculation model of the transportation costs in order that all of the elements of costs serving as part of the transportation activities could hopefully be recorded. However, it seems that Indonesia’s calculation model of the transportation costs lacked this indicator.
Another equally important factor determining the transportation costs is the economy of scale obtained from the volume of products shipped and the average size per shipment. In their study, Camisón-Haba and Clemente-Almendros [29] found out that a 10% increase in the volume of goods shipped in a route and the average size per shipment had resulted in the transportation logistics costs saving amounting to 10.8% and 11.2%, respectively. Memedovic [52] asserted that those two factors could be considered as proxy variables for a company’s logistics capabilities in a country. Exporters transporting the cargo and handling large orders would be forced to invest in assets and logistics skills increasing their logistics performance efficiency. Moreover, how a company configures its logistics system would also affect the efficiency of the distribution process. The need for an external supply could be reduced by opting for a vertically-integrated production and distribution, reducing transportation costs associated with the supply chain PwC [53].
Including these three factors in the calculation model will provide helpful information in controlling the transportation logistics costs. Abdi et al. [43] and Susanto et al. [44] argued that controlling the transportation costs was crucial to the control of the whole logistics costs. Therefore, reducing the transportation costs played a vital role in saving the total logistics cost. In short, measuring the transportation costs by paying attention to specific aspects was closely related to any efforts made to create an efficient logistics system. How the company configures its logistics system also affects the efficiency of its distribution process. Opting for vertically integrated production and distribution reduces the need for external supply, reducing transportation costs associated with supply.
Apart from the factors affecting the transportation costs, Andrejić et al. [54] suggested that, when determining the transportation costs in the distribution system, the person in charge had to consider two cases. The first case is when a professional provider or supplier of a product (transportation service purchased) is involved in the transportation services. The second case—transportation services were realized through their transportation (production transportation services). These two cases went unnoticed by the authority’s consideration when making the measurement model of Indonesia’s logistic costs. Moreover, in the previous section, we mentioned that the most basic limitation lies in the fact that all of the measured logistics costs are expressed as a GDP percentage. The measurement model proposed by Andrejić et al. [54] uses a different metric from the one mostly used in the literature because it designs the logistic cost per unit of product (m.u./kg). With this metric, we can obtain information about the costs incurred to do the logistical activities related to these commodities. The measurement model of the transportation costs proposed by Andrejić et al. [54] also included the distance factor and the average number of products sent in transport vehicles.
6. Conclusions
Logistics plays a crucial role in increasing the competitiveness and creating a sustainable economic growth. Thus, in regards to logistics, countries focuses on (accurately and transparently) measuring logistics costs, as it will help countries develop their national policies and pave the way for corrective actions. Measurement of logistics costs in a country includes the micro level and the macro level. At the micro level, the measurement of logistics costs usually only involves companies, since they reduce the logistics costs. Meanwhile, at the macro level, it involves the national logistics system and policy.
Indonesia’s measurement model of its national logistics cost has adopted models from the USA, South Korea, and South Africa. Three logistics processes and activities were assessed to measure logistics costs—transportation, inventory handling, and administration—by referring to the American, South Korean, and South African models. To determine the transportation costs, Indonesia adopted South Korea’s calculation model. Indonesia adopted the USA calculation model due to its administrative costs, which sets an administrative fee amounting to 4% of the total transportation and inventory handling costs. Regarding inventory handling costs, Indonesia combined the USA and South Korea calculation models. Finally, Indonesia used South Africa’s logistics cost model as a benchmark to determine which industrial sectors were involved in the calculation of the national logistical costs.
The development of the measurement model of the logistics costs in this study highlights the limitations found in the currently-used measurement model. The calculation of the transportation costs in Indonesia does not involve many spatial dimensions, such as a geographical distance. Several studies have concluded that distance is a significant determinant of the transportation costs, regardless of the quality and quantity of the infrastructure and the demand and supply of this service. Moreover, various studies mentioned in this study highlight the economy of scale derived from the volume of goods shipped and the average size per shipment as equally-important factors in determining distance.
By recognizing the components constituting the logistic costs and formulating a more accurate, transparent, and comprehensive measurement model, we can enhance the standards in measuring logistics costs. Moreover, measuring the logistics costs facilitated by adequate data will provide a more accurate picture of a country’s logistics performance. Therefore, this study emphasizes the importance of transparent logistics processes, allowing for data compilation, especially those regarding the costs incurred in each logistic process. In that way, studies on logistics costs will be more exciting, and policy direction will be based on established empirical data, which play a crucial role in managing logistics costs. Stakeholders will find it easier to identify any logistical issues faced in real time, allowing for a more mature “preparation” in taking corrective action. In that way, the level of logistics costs will become more controllable, and the opportunities to achieve a comparative advantage will be more open. All of these efforts play an essential role in promoting Indonesia as the best place for investment, and Indonesia will be able to become a global logistics hub in the future.
Author Contributions
Conceptualization, S.S., R.N., G.M. and A.M.A.; methodology, S.S., R.N., G.M. and A.M.A.; software, S.S., R.N., G.M. and A.M.A.; validation, S.S., R.N., G.M. and A.M.A.; formal analysis, S.S., R.N., G.M. and A.M.A.; investigation, S.S., R.N., G.M. and A.M.A.; resources, S.S., R.N., G.M. and A.M.A.; data curation, S.S., R.N., G.M. and A.M.A.; writing—original draft preparation, S.S., R.N., G.M. and A.M.A.; writing—review and editing, S.S., R.N., G.M. and A.M.A.; visualization, S.S., R.N., G.M. and A.M.A.; supervision, S.S., R.N., G.M. and A.M.A.; project administration, S.S., R.N., G.M. and A.M.A.; funding acquisition, S.S., R.N., G.M. and A.M.A. All authors have read and agreed to the published version of the manuscript.
Funding
This research received no external funding.
Institutional Review Board Statement
Not applicable.
Informed Consent Statement
Not applicable.
Data Availability Statement
Not applicable.
Conflicts of Interest
The authors declare no conflict of interest.
References
- Campos-Garcia, R.M.; Garcia-Vidales, M.A.; Gonzalez-gomez, O. Relationship between cost and logistic practices in small and medium enterprises: A case study of Queretaro, Mexico. Afr. J. Bus. Manag. 2011, 5, 1245–1252. [Google Scholar] [CrossRef]
- Rantasila, K.; Ojala, L. Measurement of National-Level Logistics Costs and Performance. Int. Transp. Forum 2012, 62. [Google Scholar] [CrossRef]
- Silvia, E.; Wardi, Y.; Aimon, H. Analisis Pertumbuhan Ekonomi, Investasi, Dan Inflasi Di Indonesia. J. Kaji. Ekon. 2013, 1, 224–243. [Google Scholar]
- Qureshi, M.N.; Kumar, D.; Kumar, P. An integrated model to identify and classify the key criteria and their role in the assessment of 3PL services providers. Asia Pac. J. Mark. Logist. 2008, 20, 227–249. [Google Scholar] [CrossRef]
- Havenga, J. Logistics costs in South Africa—The case for macroeconomic measurement. S. Afr. J. Econ. 2010, 78, 460–476. [Google Scholar] [CrossRef] [Green Version]
- Bahagia, N.; Sandee, H.; Meeuws, R. State of Logistics Indonesia. Bandung. 2013. Available online: http://www.panteia.eu/nl/News/2013/09/~/media/9PanteiaEU/files/StateofLogisticsIndonesia2013.ashx (accessed on 20 March 2021).
- Kementerian PPN/Bappenas (National Development Planning Agency). Rencana Pembangunan Jangka Menengah Nasional 2015–2019; Bappenas: Jakarta, Indonesia, 2019. [Google Scholar]
- Basri, M.C.; Rahardja, S. Should Indonesia Say Goodbye to Its Strategy of Facilitating Exports? In Managing Openness: Trade and Outward-Oriented Growth after the Crisis; Haddad, M., Shepherd, B., Eds.; The World Bank: Washington, DC, USA, 2011; pp. 217–231. [Google Scholar]
- Shepherd, B. Logistics Costs and Competitiveness: Measurement and Trade Policy Applications; Washington, DC, USA, 2011; Available online: [email protected] (accessed on 20 March 2021).
- Pohit, S.; Gupta, D.; Malik, S.; Pratap, D. Survey of Literature on Measuring Logistics cost: A Developing Country’s Perspective. MPRA Pap. No. 94607. 2019, pp. 1–23. Available online: https://mpra.ub.uni-muenchen.de/94607/ (accessed on 20 March 2021).
- Themido, I.; Arantes, A.; Fernandes, C.; Guedes, A.P. Logistic costs case study—An ABC approach. J. Oper. Res. Soc. 2000, 51, 1148–1157. [Google Scholar] [CrossRef]
- Pishvaee, M.S.; Basiri, H.; Sajadieh, M.S. National Logistics Costs. In Contributions to Management Science; Springer: Berlin/Heidelberg, Germany, 2009; pp. 57–83. [Google Scholar]
- Wajszczuk, K. Logistics costs analysis as an assisting tool to achieve competitive Advantage for agricultural enterprises Paper prepared for presentation at the XI th International Congress of the Eaae Logistics Costs Analysis as an Assisting Tool to Achieve Competitiv. Eur. Assoc. Agric. Econ. 2005, 2, 3–7. [Google Scholar]
- Töyli, J.; Häkkinen, L.; Ojala, L.; Naula, T. Logistics and financial performance: An analysis of 424 Finnish small and medium-sized enterprises. Int. J. Phys. Distrib. Logist. Manag. 2008, 38, 57–80. [Google Scholar] [CrossRef]
- Naula, T.; Ojala, L.; Solakivi, T.; Töyli, J.; Stenholm, P. State of Logistics 2006; Ministry of Transport and Communication: Helsinki, Finland, 2006. Available online: http://www.mintc.fi/oliver/upl367-Julkaisuja%2045_2006.pdf (accessed on 20 March 2021).
- Rushton, A.; Croucher, P.; Baker, P. The Handbook of Logistics and Distribution Management, 3rd ed.; Kogan Page Limited: London, UK, 2007. [Google Scholar]
- Zeng, A.Z.; Rossetti, C. Developing a Framework for Evaluating the Logistics Costs in Global Sourcing Processes: An Implementation and Insights. Int. J. Phys. Distrib. Logist. Manag. 2003, 33, 785–803. [Google Scholar] [CrossRef]
- Gunasekaran, A.; Patel, C.; Tirtiroglu, E. Performance measures and metrics in a supply chain environment. Int. J. Oper. Prod. Manag. 2001, 21, 71–87. [Google Scholar] [CrossRef]
- Mulyadi, D. Pengembangan sistem logistik yang efisien dan efektif dengan pendekatan supply chain management. J. Ind. Res. 2011, 5, 275–282. [Google Scholar]
- Haryana, A. The Role of Bonded Logistic Center (BLC) in Reducing Dwelling Time on the Indonesian Port. J. Cend. Nia. 2017, 1, 1–10. [Google Scholar]
- Kennedy, P.S.J. Analisis Tingginya Biaya Logistik Di Indonesia Ditinjau Dari Dwelling Time. J. Econ. Resour. 2019, 1, 136–145. [Google Scholar] [CrossRef] [Green Version]
- Farahani, R.Z.; Asgari, N.; Davarzani, H. Supply Chain and Logistics in National, International and Governmental Environment Concepts and Models; Springer: Berlin/Heidelberg, Germany, 2009. [Google Scholar]
- Wibowo, W.; Chairuddin, I. Sistem Angkutan Multimoda Dalam Mendukung Efisiensi Biaya Logistik Di Indonesia. J. Manaj. Transp. Dan Logistik. 2017, 4, 25. [Google Scholar] [CrossRef] [Green Version]
- Pamudji, A.; Pamudji, A.A.; Achmadi, T. Pengembangan Indikator Logistik untuk Wilayah Kepulauan. J. Tek. ITS 2012, 1, E15–E20. Available online: http://ejurnal.its.ac.id/index.php/teknik/article/view/379 (accessed on 20 March 2021).
- Botes, F.; Jacobs, C.; Pienaar, W.J. A model to calculate the cost of logistics at a macro level: A case study of South Africa a Model to Calculate the Cost of Logistics at a Macro Level: A Case Study of South Africa f j Botes, c g Jacobs & w j Pienaar Dr Francois Jacobus Botes, Departme. S. Afr. Bus. Rev. 2006. Available online: https://www.researchgate.net/publication/308022791%0AA (accessed on 20 March 2021).
- MacroSys Research and Technology. Logistics Costs and U.S. Gross Domestic Product; 2015. Available online: https://ops.fhwa.dot.gov/freight/freight_analysis/econ_methods/lcdp_rep/index.htm (accessed on 20 March 2021).
- Rietveld, P.; Vickerman, R. Transport in regional science: The ‘death of distance’ is premature. Pap. Reg. Sci. 2004, 83, 229–248. [Google Scholar] [CrossRef] [Green Version]
- Gao, S. Cost Control Method for Goods Transportation of Coastal Enterprises Based on Earned Value Method. J. Coast. Res. 2020, 103, 674–677. [Google Scholar] [CrossRef]
- Camisón-Haba, S.; Clemente-Almendros, J.A. A global model for the estimation of transport costs. Econ. Res. Istraz. 2020, 33, 2075–2100. [Google Scholar] [CrossRef]
- Botes, F.; Jacobs, C.; Pienaar, W. A model to calculate the cost of logistics at a macro level: A case study of South Africa. S. Afr. Bus. Rev. 2006, 10, 1–19. [Google Scholar]
- Bahagia, S.N.; (Institut Teknologi Bandung, Bandung, Indonesia). Personal communication, 2018.
- Pienaar, W.J. Measuring National Business Logistics Costs: A South African Application and International Comparison. Int. J. Appl. Eng. Res. 2017, 12, 7524–7529. Available online: http://www.ripublication.com (accessed on 20 March 2021).
- Council of Supply Chain Management Profesionals. CSCMP’s Annual State of Logistics Report Logistics in Transition: New Drivers at the Wheel US. Illinois. 2016. Available online: https://www.lee-associates.com/logistics/wp-content/uploads/sites/11/2017/05/cscmp-sofl-report-2016.pdf (accessed on 20 March 2021).
- Australian Logistics Council. The Economic Significance of the Australian Logistics Industry. Canberra. 2014. Available online: http://austlogistics.com.au/wp-content/uploads/2014/07/Economic-Significance-of-the-Australian-Logistics-Indsutry-FINAL.pdf (accessed on 20 March 2021).
- Armstrong and Associates. Global and Regional Infrastructure, Logistics Costs, and Third-Party Logistics Market Trends and Analysis; Armstrong & Associates, Inc.: Milwaukee, WI, USA, 2017. [Google Scholar]
- Bowersox, D.J.; Calantone, R.J.; Rodrigues, A.M. Estimation of global logistics expenditures using neural networks. J. Bus. Logist. 2003, 24, 21–36. [Google Scholar] [CrossRef]
- Bowersox, D.J.; Calantone, R.J. Executive Insights: Global Logistics. J. Int. Mark. 1998, 6, 83–93. [Google Scholar] [CrossRef]
- Delaney, R.; Wilson, R. 14th Annual State of Logistics Report: The Case for Reconfiguration; Cass Information System and ProLogis: Washington, DC, USA, 2003. [Google Scholar]
- Subiyanto, E.; Rini, H.P. Developing Model of Logistics Costs in Indonesia’s Cement Projects: A Literature and Empirical Study. Approach J. Econ. Bus. 2020, 3. [Google Scholar] [CrossRef]
- Subiyanto, E. Assessing Total Logistics Costs. Int. J. Appl. Logist. 2020, 10, 45–61. [Google Scholar] [CrossRef]
- The US National Research Council. Key Transportation Indicators: Summary of a Workshop; National Academy Press: Washington, DC, USA, 2002. [Google Scholar] [CrossRef]
- Fathi, M.; Maleki, M.; Moghaddam, H. Futures Investment and Financing of Rail Transportation Industry (Machinery and Equipment). Future Study Manag. 2018, 29, 33–54. [Google Scholar]
- Abdi, A.; Taghipour, S.; Khamooshi, H. A model to control environmental performance of project execution process based on greenhouse gas emissions using earned value management. Int. J. Proj. Manag. 2018, 36, 397–413. [Google Scholar] [CrossRef]
- Susanto, A.D.; Suharyo, O.S. the Optimization of Multipurpose Building Development on Project Scheduling Using Precedence Diagram Method (Pdm). Int. J. ASRO 2018, 9, 1–7. [Google Scholar]
- Hesse, M.; Rodrigue, J.P. The transport geography of logistics and freight distribution. J. Transp. Geogr. 2004, 12, 171–184. [Google Scholar] [CrossRef]
- Brun, J.F.; Carrère, C.; Guillaumont, P.; de Melo, J. Has distance died? Evidence from a panel gravity model. World Bank Econ. Rev. 2005, 19, 99–120. [Google Scholar] [CrossRef] [Green Version]
- Márquez-Ramos, L.; Martínez-Zarzoso, I.; García, E.M.P.; Wilmsmeier, G. Determinantes de los costes de transporte marítimos: El caso de las exportaciones españolas. Inf. Comer. Española 2007, 834, 79–93. [Google Scholar]
- Micco, A.; Pérez, N. Determinants of Maritime Transport Costs; Inter-American Development Bank: Washington, DC, USA, 2002. [Google Scholar] [CrossRef] [Green Version]
- Wilmsmeier, G.; Hoffmann, J.; Sanchez, R.J. The Impact of Port Characteristics on International Maritime Transport Costs. Res. Transp. Econ. 2006, 16, 117–140. [Google Scholar] [CrossRef]
- Minken, H.; Johansen, B.G. A logistics cost function with explicit transport costs. Econ. Transp. 2019, 19, 1–13. [Google Scholar] [CrossRef]
- Grønland, S.E. Cost Models for Freight Transport and Logistics—Base Year 2012. TØI Report 1435/2015. 2015. Available online: https://www.toi.no/getfile.php/1341286-1444047091/Publikasjoner/T%C3%98I%20rapporter/2015/1435-2015/1435-2015-elektronisk.pdf (accessed on 20 August 2021).
- Memedovic, O.; Ojala, L.; Rodrigue, J.P.; Naula, T. Fuelling the global value chains: What role for logistics capabilities? Int. J. Technol. Learn. Innov. Dev. 2008, 1, 353–374. [Google Scholar] [CrossRef]
- PwC. Shifting Patterns. The Future of the Logistics Industry; Madrid, 2016. Available online: https://www.pwc.com/sg/en/publications/assets/future-of-the-logistics-industry.pdf (accessed on 20 August 2021).
- Andrejić, M.; Milorad, K.; Pajić, V. A Framework for Assessing Logistics Costs. Beograd. 2018. Available online: https://www.researchgate.net/publication/328066071 (accessed on 20 August 2021).
Figure 1.
Model development framework of Indonesia’s logistics costs (reprinted from Bahagia et al. (2013)). Source: [6].
Figure 1.
Model development framework of Indonesia’s logistics costs (reprinted from Bahagia et al. (2013)). Source: [6].

Figure 2.
Indonesia’s logistics costs in billion rupiah and their percentage of GDP (adapted from Bahagia et al. (2013)). Source: [6]. Notes: the term logistics costs-to-GDP ratio (%) refers to the percentage of the logistics costs in the GDP. Therefore, the growth rate of the GDP is not linear to that of the logistics costs and, thus, should be their percentages. For instance, in the 2006–2011 period, the growth of the GDP showed a positive trend (from 5.5% in 2006 to 6.2% in 2011). On the other hand, the growth of the logistics costs showed a negative trend (from 20.83% in 2006 to 9.88% in 2011). Therefore, as shown in Figure 2, the logistics costs per GDP showed a negative trend in the 2006–2011 period. On the contrary, an opposite situation took place in the 2011–2013 period. The growth of the GDP growth showed a negative trend (from 6.2% in 2011 to 5.6% in 2013), while the growth of logistics costs showed a positive trend (from 9.88% in 2011 to 13.71% in 2013). As a result, the logistics costs per GDP showed a positive trend in the 2011–2013 period.

Figure 3.
Indonesia’s logistics cost components in 2004, 2010, 2015 (adapted from Bahagia et al. (2013)). Source: [6]. Note: each cost component is quoted as a percentage of total logistics costs.
Figure 3.
Indonesia’s logistics cost components in 2004, 2010, 2015 (adapted from Bahagia et al. (2013)). Source: [6]. Note: each cost component is quoted as a percentage of total logistics costs.

Figure 4.
The trend of individual components, such as a share of GDP (adapted from Bahagia et al. (2013)). Source: [6].
Figure 4.
The trend of individual components, such as a share of GDP (adapted from Bahagia et al. (2013)). Source: [6].

Figure 5.
The average costs of each mode of transportation in the 2004–2013 period (adapted from Bahagia et al. (2013)). Source: [6].
Figure 5.
The average costs of each mode of transportation in the 2004–2013 period (adapted from Bahagia et al. (2013)). Source: [6].

Figure 6.
Average distribution of inventory costs in the 2004–2013 period (adapted from Bahagia et al. (2013)). Source: [6].
Figure 6.
Average distribution of inventory costs in the 2004–2013 period (adapted from Bahagia et al. (2013)). Source: [6].


Table 1.
Source of statistical data for logistics costs measurements in Indonesia (reprinted from Bahagia (2018)).
Table 1.
Source of statistical data for logistics costs measurements in Indonesia (reprinted from Bahagia (2018)).
| Costs Components | Elements | Data | Sources |
|---|---|---|---|
| Transportation costs | Public land transportation | GDP of the related sector Land transportation income Number of trucks Number of buses | Statistics Indonesia (BPS) Indonesia Stock Exchange (IDX) financial report Police data |
| Private land transportation | Truck mileage/year Number of trucks Truck operating costs | Police data Statistics Indonesia (BPS) Asia Foundation | |
| Rail transportation | GDP of the related sector Income of goods Total real income | Statistics Indonesia (BPS) Indonesian Railways company (KAI) financial report | |
| Water transportation | GDP of the related sector Income of Goods Total income | Statistics Indonesia (BPS) Indonesia Stock Exchange (IDX) financial report PT. ASDP Indonesia Ferry financial report PT. Pelindo financial report | |
| Air Transportation | GDP of the related sector The gross income of goods Total gross income | Statistics Indonesia (BPS) Indonesia Stock Exchange (IDX) financial report Garuda Indonesia financial report | |
| Transportation support services | GDP of the related sector The gross income of goods Total gross income Total income | Statistics Indonesia (BPS) Indonesia Stock Exchange (IDX) financial report | |
| Inventory Costs | Storage | GDP of the related sector Inventory Assets Gross Income Interest Rate | Statistics Indonesia (BPS) Indonesia Stock Exchange (IDX) financial report Bank Indonesia |
| Warehouse operational costs | GDP of the related sector Land transportation income on the IDX Number of trucks Number of buses | Statistics Indonesia (BPS) Indonesia Stock Exchange (IDX) financial report Police Data | |
| Warehouse depreciation | GDP of the related sector Inventory Assets Gross Income Interest Rate Percentage of operating costs | Statistics Indonesia (BPS) Indonesia Stock Exchange (IDX) financial report | |
| Risk and damage | GDP of the related sector Fixed assets Warehouse depreciation percentage The percentage of warehouse value | Statistics Indonesia (BPS) Indonesia Stock Exchange (IDX) financial report | |
| Administration Costs | Administration percentage | Benchmark USA, etc | |
Source: [31].
Publisher’s Note: MDPI stays neutral with regard to jurisdictional claims in published maps and institutional affiliations. |
© 2021 by the authors. Licensee MDPI, Basel, Switzerland. This article is an open access article distributed under the terms and conditions of the Creative Commons Attribution (CC BY) license (https://creativecommons.org/licenses/by/4.0/).
Share and Cite
MDPI and ACS Style
Santoso, S.; Nurhidayat, R.; Mahmud, G.; Arijuddin, A.M. Measuring the Total Logistics Costs at the Macro Level: A Study of Indonesia. Logistics 2021, 5, 68. https://0-doi-org.brum.beds.ac.uk/10.3390/logistics5040068
AMA Style
Santoso S, Nurhidayat R, Mahmud G, Arijuddin AM. Measuring the Total Logistics Costs at the Macro Level: A Study of Indonesia. Logistics. 2021; 5(4):68. https://0-doi-org.brum.beds.ac.uk/10.3390/logistics5040068
Chicago/Turabian StyleSantoso, Sugeng, R. Nurhidayat, Gustofan Mahmud, and Abdul Mujib Arijuddin. 2021. "Measuring the Total Logistics Costs at the Macro Level: A Study of Indonesia" Logistics 5, no. 4: 68. https://0-doi-org.brum.beds.ac.uk/10.3390/logistics5040068