
Detailed Speciation of Non-Methane Volatile Organic Compounds in Exhaust Emissions from Diesel and Gasoline Euro 5 Vehicles Using Online and Offline Measurements

 , , , ,
Abstract
:1. Introduction
2. Materials and Methods
2.1. Vehicle Characteristics
2.2. Experimental Setup
2.3. Measurement Techniques for Gaseous Pollutants
2.3.1. PTR-ToF-MS
2.3.2. ATD-GC-MS
2.4. PMF Analysis
2.5. Calculation of EFs
3. Results and Discussion
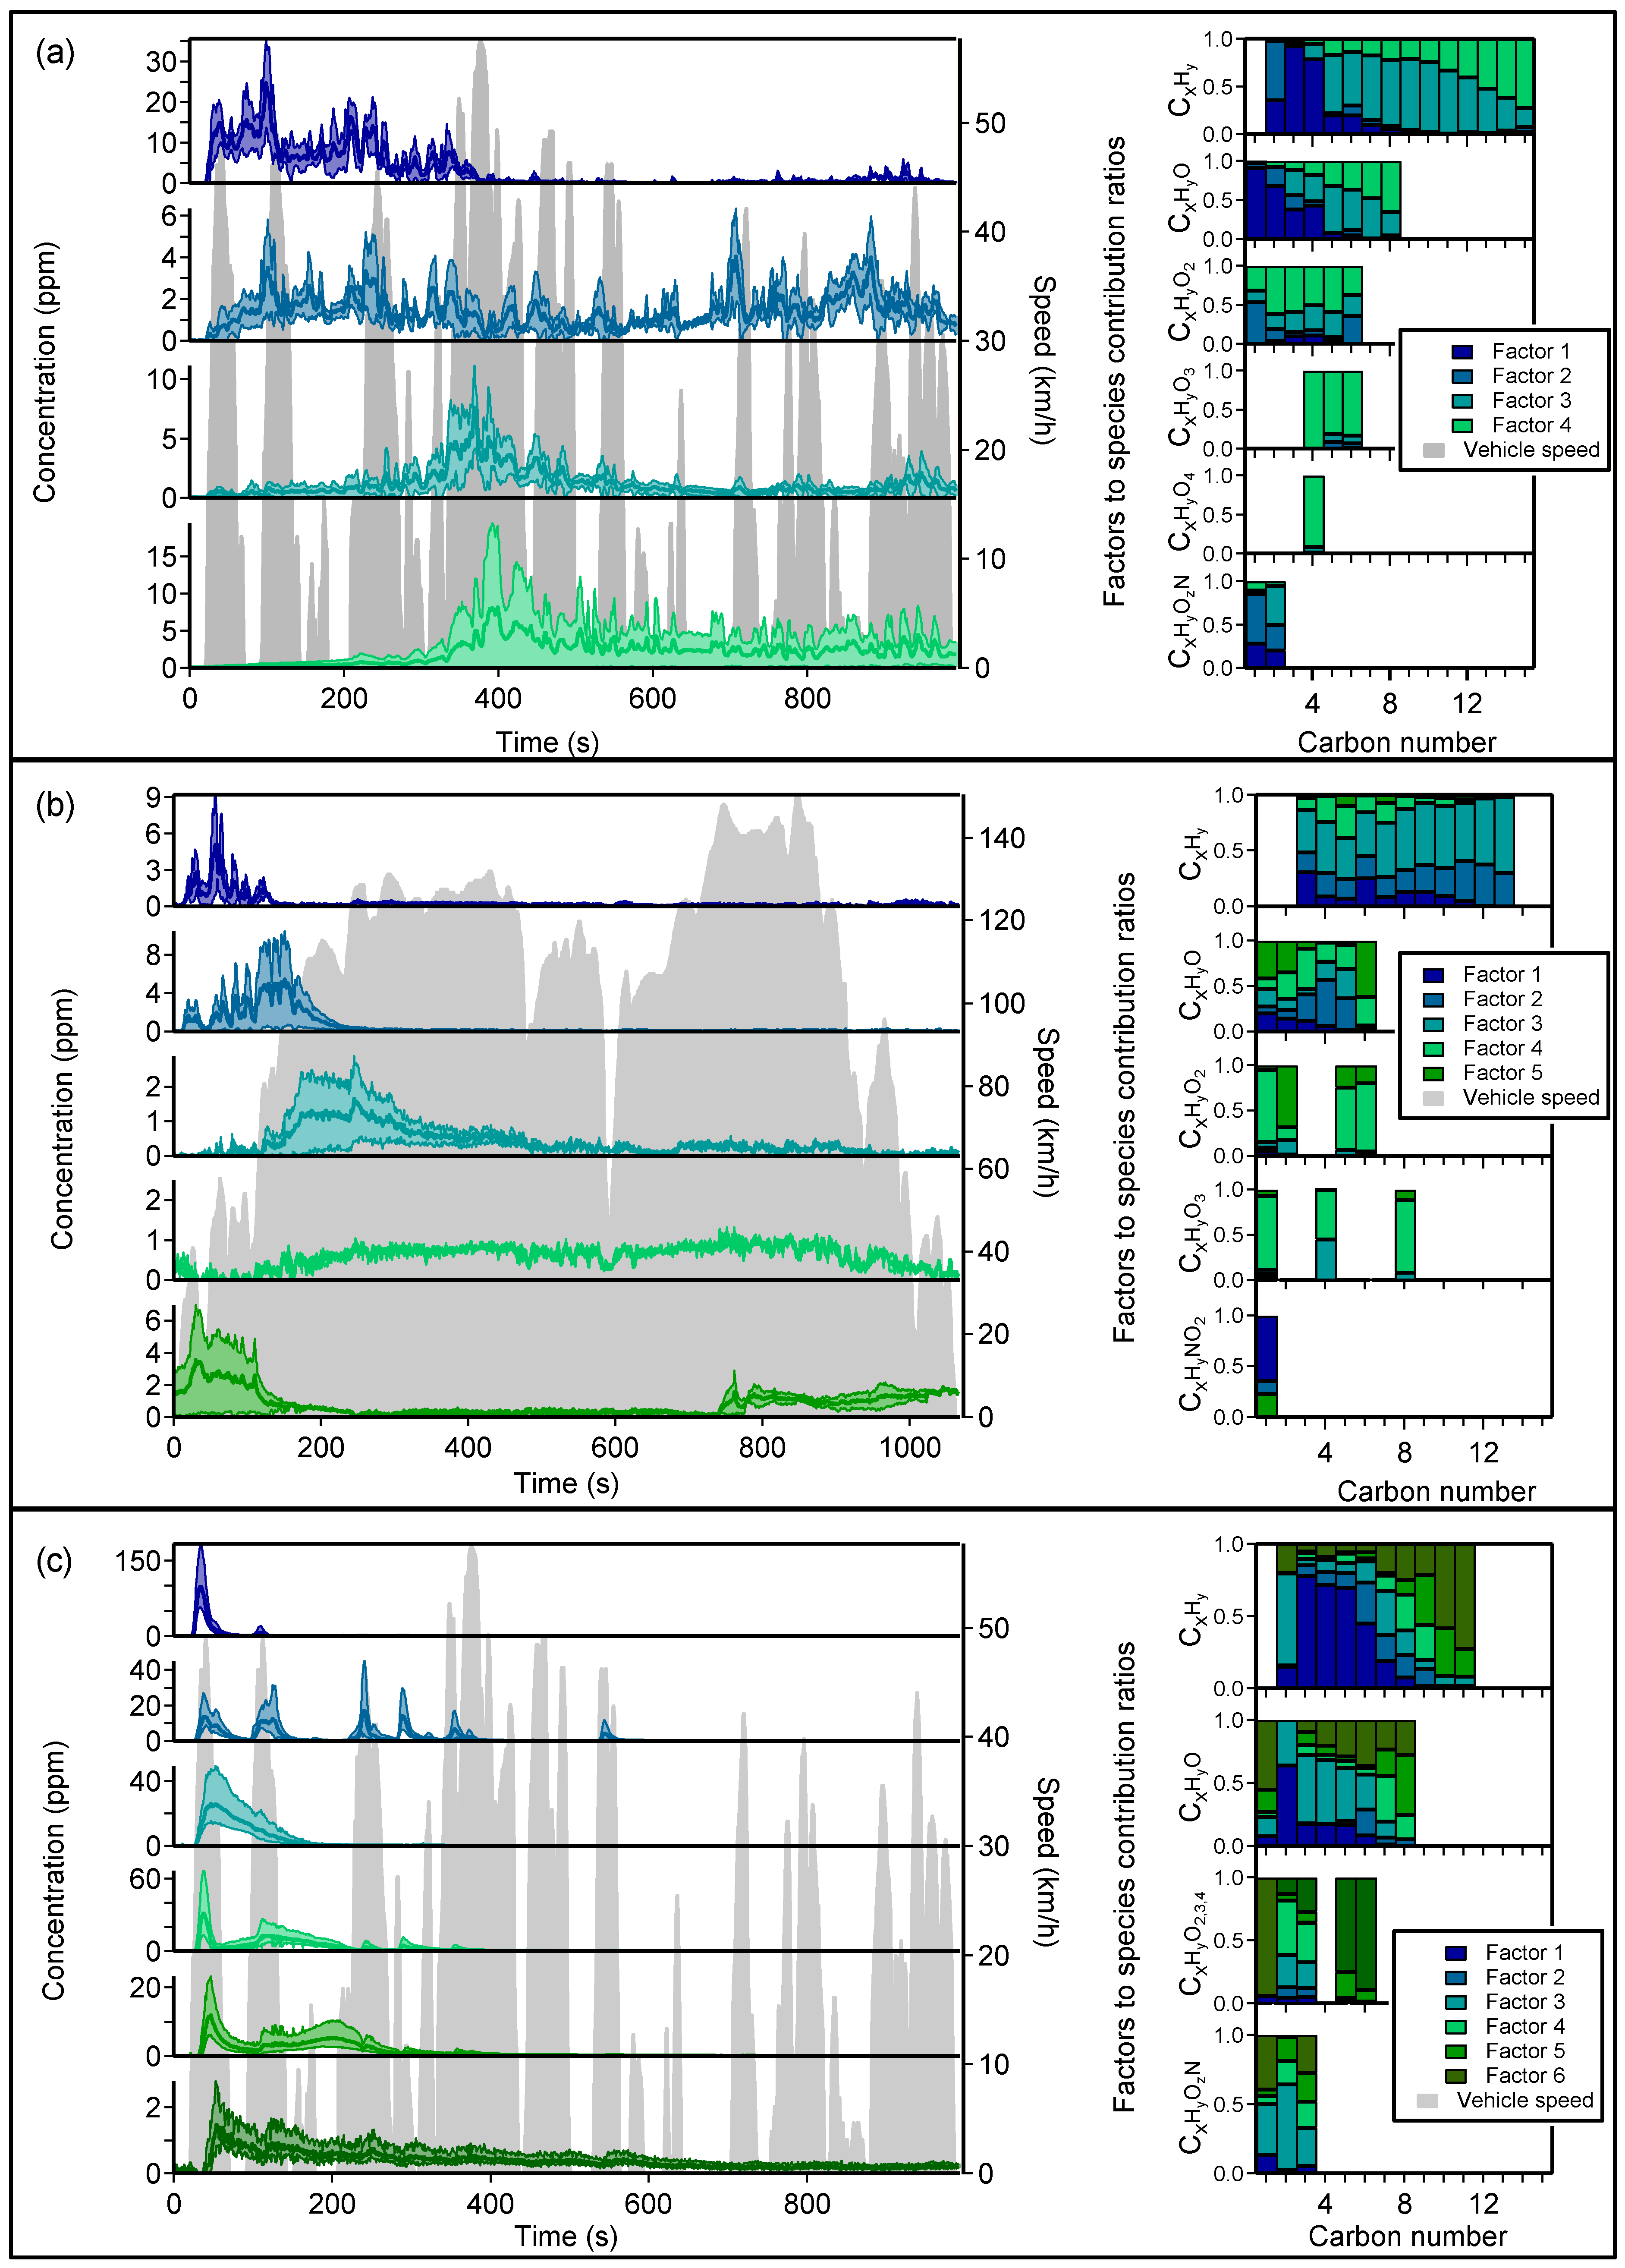
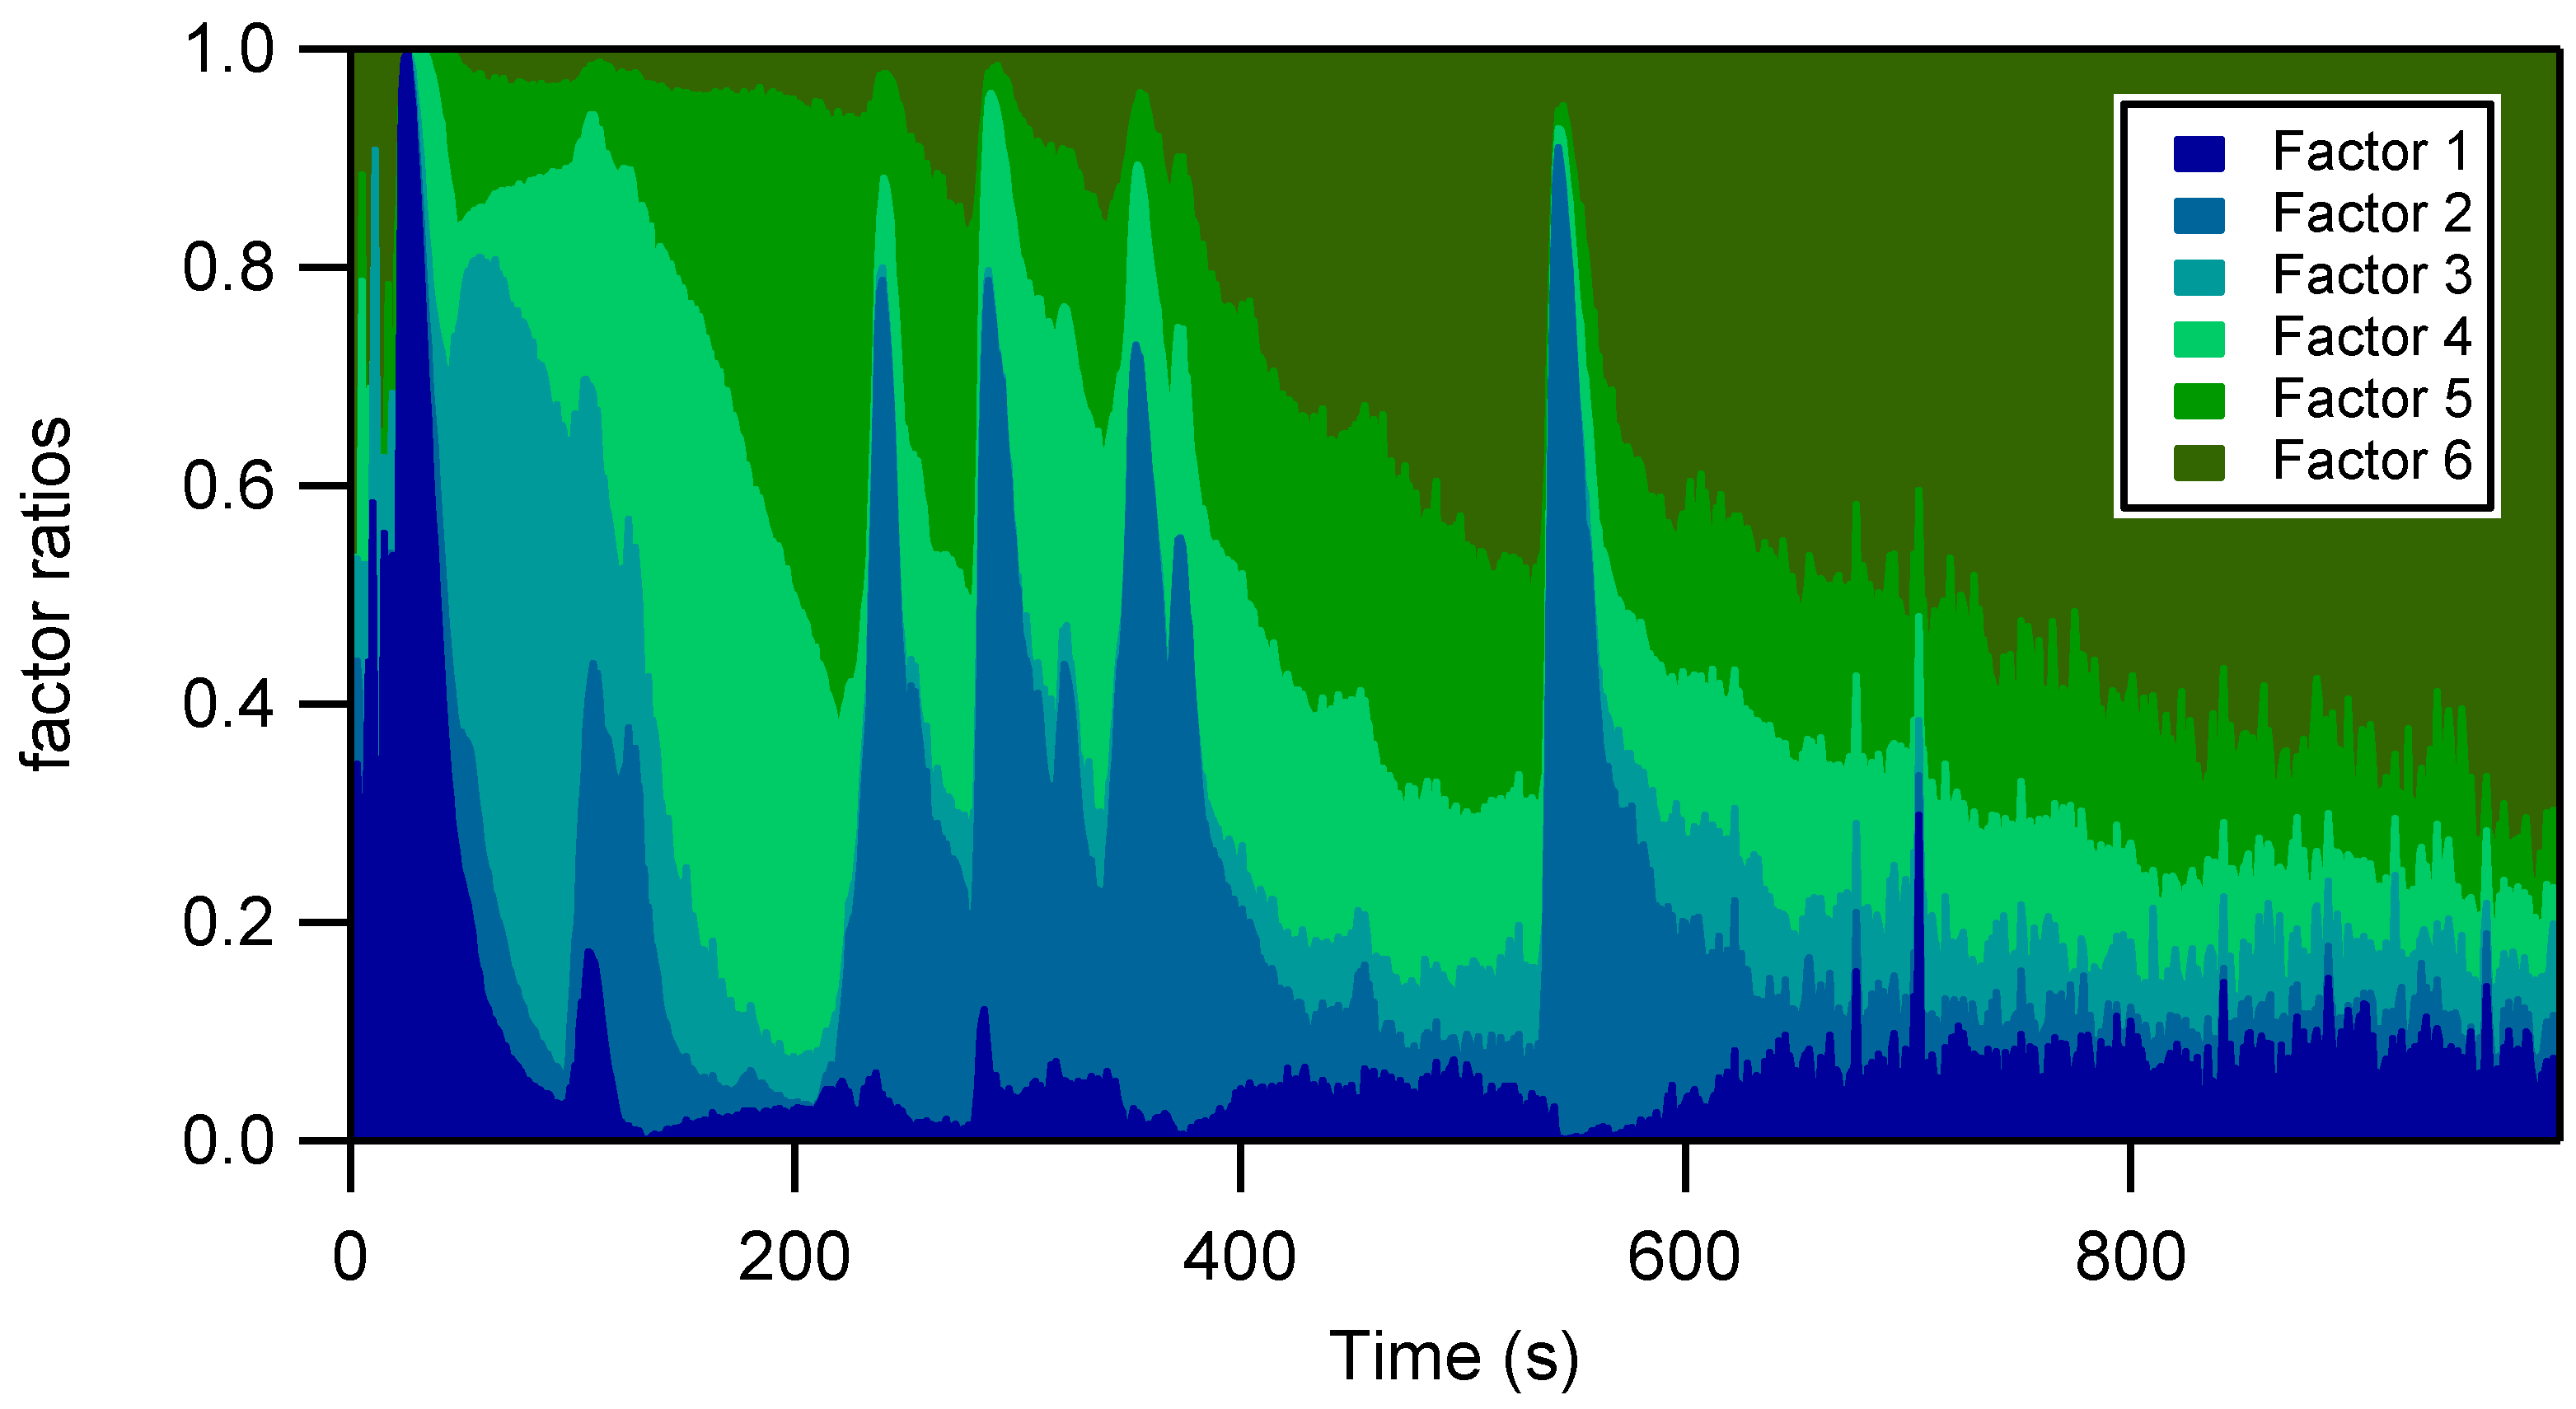
3.1. PMF Analysis
3.1.1. Diesel Vehicle
- Diesel cold urban cycle
- Diesel motorway cycle
3.1.2. GDI Vehicle
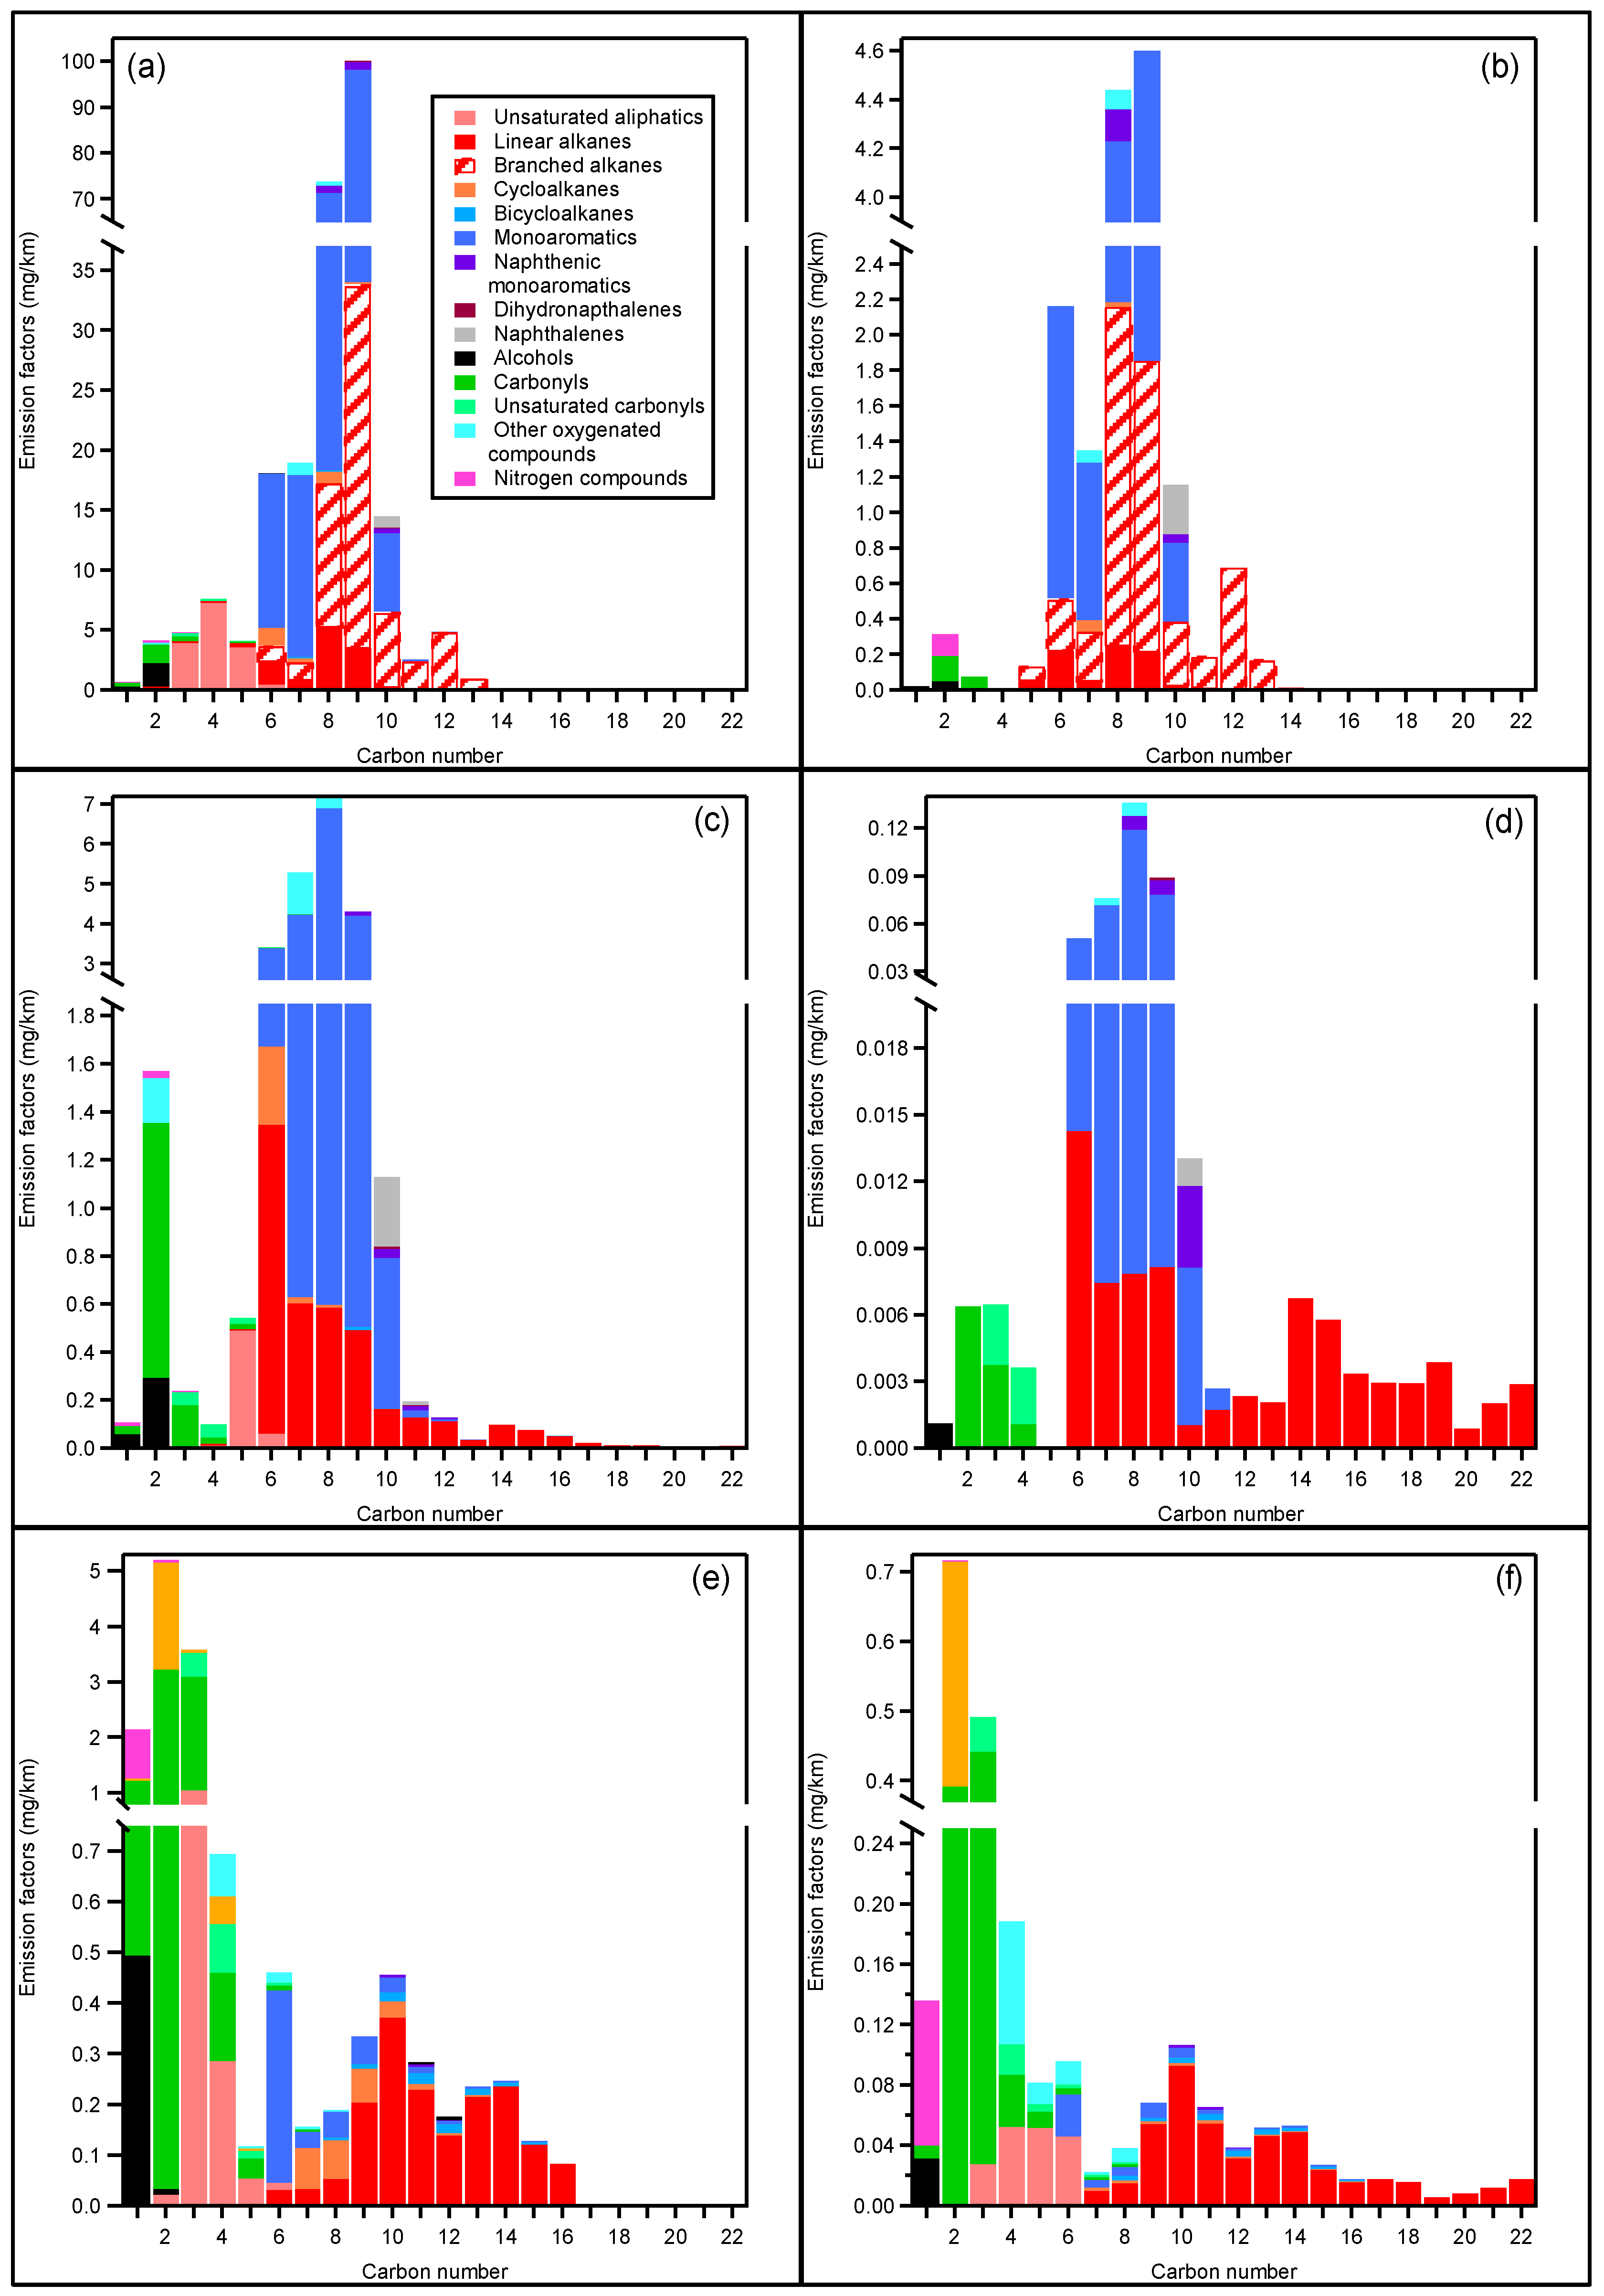
3.2. NMVOC EFs
3.2.1. Gasoline vehicle EFs
3.2.2. Diesel Vehicle EFs
3.2.3. IVOC Characterization
3.3. Comparison with COPERT Emission Inventories
4. Conclusions
Supplementary Materials
Author Contributions
Funding
Institutional Review Board Statement
Informed Consent Statement
Acknowledgments
Conflicts of Interest
Abbreviations
| ASOA | Anthropogenic secondary organic aerosol |
| ATD-GC-MS | Automated thermal desorption gas chromatography mass spectrometer |
| BC | Black carbon |
| BTEX | Benzene, toluene, ethylbenzene, and xylenes |
| CI-MS | Chemical ionization mass spectrometry |
| CO | Carbon monoxide |
| cps | Count per second |
| CU | Artemis cold urban |
| CVS | Constant volume sampler |
| DOC | Diesel oxidation catalyst |
| E/N | Reduced electric field |
| EASE | Environment, Planning, Safety, and Eco-design Laboratory |
| EFs | Emission factors |
| FBC-DPF | Fuel-borne catalyst diesel particulate filter |
| GDI | Gasoline direct injection |
| IVOCs | Intermediate volatility organic compounds |
| ME-2 | Multilinear engine 2 |
| MW | Artemis motorway |
| NMHCs | Non-methane hydrocarbons |
| NMVOCs | Non-methane volatile organic compounds |
| Nox | Nitrogen oxides |
| PFI | Port fuel injection |
| PM | Particulate matter |
| PMF | Positive matrix factorization |
| PN | Particulate number |
| PTR-ToF-MS | Proton transfer reaction time-of-flight mass spectrometer |
| S/N | Signal-to-noise ratio |
| SI | Supplementary information |
| SOA | Secondary organic aerosol |
| Td | Townsend |
| THC | Total hydrocarbon content |
| TWC | Three-way catalyst |
| VOCs | Volatile organic compounds |
References
- Cohen, A.J.; Brauer, M.; Burnett, R.; Anderson, H.R.; Frostad, J.; Estep, K.; Balakrishnan, K.; Brunekreef, B.; Dandona, L.; Dandona, R.; et al. Estimates and 25-Year Trends of the Global Burden of Disease Attributable to Ambient Air Pollution: An Analysis of Data from the Global Burden of Diseases Study 2015. Lancet 2017, 389, 1907–1918. [Google Scholar] [CrossRef] [Green Version]
- Citepa, Juillet 2021. Inventaire Des Émissions de Polluants Atmosphériques et de Gaz à Effet de Serre En France—Format Secten. Available online: https://www.citepa.org/wp-content/uploads/publications/secten/Citepa_Rapport-Secten_ed2021_v1_30072021.pdf (accessed on 4 April 2022).
- Baudic, A.; Gros, V.; Sauvage, S.; Locoge, N.; Sanchez, O.; Sarda-Estève, R.; Kalogridis, C.; Petit, J.-E.; Bonnaire, N.; Baisnée, D.; et al. Seasonal Variability and Source Apportionment of Volatile Organic Compounds (VOCs) in the Paris Megacity (France). Atmos. Chem. Phys. 2016, 16, 11961–11989. [Google Scholar] [CrossRef] [Green Version]
- Russell, A.; Epling, W.S. Diesel Oxidation Catalysts. Catal. Rev. 2011, 53, 337–423. [Google Scholar] [CrossRef]
- Wang, J.; Chen, H.; Hu, Z.; Yao, M.; Li, Y. A Review on the Pd-Based Three-Way Catalyst. Catal. Rev. 2015, 57, 79–144. [Google Scholar] [CrossRef]
- Guan, B.; Zhan, R.; Lin, H.; Huang, Z. Review of the State-of-the-Art of Exhaust Particulate Filter Technology in Internal Combustion Engines. J. Environ. Manag. 2015, 154, 225–258. [Google Scholar] [CrossRef]
- Platt, S.M.; El Haddad, I.; Pieber, S.M.; Zardini, A.A.; Suarez-Bertoa, R.; Clairotte, M.; Daellenbach, K.R.; Huang, R.-J.; Slowik, J.G.; Hellebust, S.; et al. Gasoline Cars Produce More Carbonaceous Particulate Matter than Modern Filter-Equipped Diesel Cars. Sci. Rep. 2017, 7, 4926. [Google Scholar] [CrossRef]
- Giechaskiel, B.; Joshi, A.; Ntziachristos, L.; Dilara, P. European Regulatory Framework and Particulate Matter Emissions of Gasoline Light-Duty Vehicles: A Review. Catalysts 2019, 9, 586. [Google Scholar] [CrossRef] [Green Version]
- Kostenidou, E.; Martinez-Valiente, A.; R’Mili, B.; Marques, B.; Temime-Roussel, B.; Durand, A.; André, M.; Liu, Y.; Louis, C.; Vansevenant, B.; et al. Technical Note: Emission Factors, Chemical Composition, and Morphology of Particles Emitted from Euro 5 Diesel and Gasoline Light-Duty Vehicles during Transient Cycles. Atmos. Chem. Phys. 2021, 21, 4779–4796. [Google Scholar] [CrossRef]
- Sartelet, K.; Zhu, S.; Moukhtar, S.; André, M.; André, J.M.; Gros, V.; Favez, O.; Brasseur, A.; Redaelli, M. Emission of Intermediate, Semi and Low Volatile Organic Compounds from Traffic and Their Impact on Secondary Organic Aerosol Concentrations over Greater Paris. Atmos. Environ. 2018, 180, 126–137. [Google Scholar] [CrossRef]
- Farina, S.C.; Adams, P.J.; Pandis, S.N. Modeling Global Secondary Organic Aerosol Formation and Processing with the Volatility Basis Set: Implications for Anthropogenic Secondary Organic Aerosol. J. Geophys. Res. 2010, 115, D09202. [Google Scholar] [CrossRef] [Green Version]
- Daellenbach, K.R.; Uzu, G.; Jiang, J.; Cassagnes, L.-E.; Leni, Z.; Vlachou, A.; Stefenelli, G.; Canonaco, F.; Weber, S.; Segers, A.; et al. Sources of Particulate-Matter Air Pollution and Its Oxidative Potential in Europe. Nature 2020, 587, 414–419. [Google Scholar] [CrossRef]
- Tuet, W.Y.; Chen, Y.; Xu, L.; Fok, S.; Gao, D.; Weber, R.J.; Ng, N.L. Chemical Oxidative Potential of Secondary Organic Aerosol (SOA) Generated from the Photooxidation of Biogenic and Anthropogenic Volatile Organic Compounds. Atmos. Chem. Phys. 2017, 17, 839–853. [Google Scholar] [CrossRef] [Green Version]
- Lovett, C.; Baasiri, M.; Atwi, K.; Sowlat, M.H.; Shirmohammadi, F.; Shihadeh, A.L.; Sioutas, C. Comparison of the Oxidative Potential of Primary (POA) and Secondary (SOA) Organic Aerosols Derived from α-Pinene and Gasoline Engine Exhaust Precursors. F1000Research 2018, 7, 1031. [Google Scholar] [CrossRef]
- Wang, S.; Ye, J.; Soong, R.; Wu, B.; Yu, L.; Simpson, A.J.; Chan, A.W.H. Relationship between Chemical Composition and Oxidative Potential of Secondary Organic Aerosol from Polycyclic Aromatic Hydrocarbons. Atmos. Chem. Phys. 2018, 18, 3987–4003. [Google Scholar] [CrossRef] [Green Version]
- Gentner, D.R.; Jathar, S.H.; Gordon, T.D.; Bahreini, R.; Day, D.A.; El Haddad, I.; Hayes, P.L.; Pieber, S.M.; Platt, S.M.; de Gouw, J.; et al. Review of Urban Secondary Organic Aerosol Formation from Gasoline and Diesel Motor Vehicle Emissions. Environ. Sci. Technol. 2017, 51, 1074–1093. [Google Scholar] [CrossRef]
- Drozd, G.T.; Zhao, Y.; Saliba, G.; Frodin, B.; Maddox, C.; Oliver Chang, M.-C.; Maldonado, H.; Sardar, S.; Weber, R.J.; Robinson, A.L.; et al. Detailed Speciation of Intermediate Volatility and Semivolatile Organic Compound Emissions from Gasoline Vehicles: Effects of Cold-Starts and Implications for Secondary Organic Aerosol Formation. Environ. Sci. Technol. 2019, 53, 1706–1714. [Google Scholar] [CrossRef]
- Gentner, D.R.; Isaacman, G.; Worton, D.R.; Chan, A.W.H.; Dallmann, T.R.; Davis, L.; Liu, S.; Day, D.A.; Russell, L.M.; Wilson, K.R.; et al. Elucidating Secondary Organic Aerosol from Diesel and Gasoline Vehicles through Detailed Characterization of Organic Carbon Emissions. Proc. Natl. Acad. Sci. USA 2012, 109, 18318–18323. [Google Scholar] [CrossRef] [Green Version]
- Zhao, Y.; Nguyen, N.T.; Presto, A.A.; Hennigan, C.J.; May, A.A.; Robinson, A.L. Intermediate Volatility Organic Compound Emissions from On-Road Gasoline Vehicles and Small Off-Road Gasoline Engines. Environ. Sci. Technol. 2016, 50, 4554–4563. [Google Scholar] [CrossRef]
- Zhao, Y.; Nguyen, N.T.; Presto, A.A.; Hennigan, C.J.; May, A.A.; Robinson, A.L. Intermediate Volatility Organic Compound Emissions from On-Road Diesel Vehicles: Chemical Composition, Emission Factors, and Estimated Secondary Organic Aerosol Production. Environ. Sci. Technol. 2015, 49, 11516–11526. [Google Scholar] [CrossRef]
- Lu, Q.; Murphy, B.N.; Qin, M.; Adams, P.J.; Zhao, Y.; Pye, H.O.T.; Efstathiou, C.; Allen, C.; Robinson, A.L. Simulation of Organic Aerosol Formation during the CalNex Study: Updated Mobile Emissions and Secondary Organic Aerosol Parameterization for Intermediate-Volatility Organic Compounds. Atmos. Chem. Phys. 2020, 20, 4313–4332. [Google Scholar] [CrossRef] [Green Version]
- Ratcliff, M.A.; Windom, B.; Fioroni, G.M.; St John, P.; Burke, S.; Burton, J.; Christensen, E.D.; Sindler, P.; McCormick, R.L. Impact of Ethanol Blending into Gasoline on Aromatic Compound Evaporation and Particle Emissions from a Gasoline Direct Injection Engine. Appl. Energy 2019, 250, 1618–1631. [Google Scholar] [CrossRef]
- Suarez-Bertoa, R.; Zardini, A.A.; Keuken, H.; Astorga, C. Impact of Ethanol Containing Gasoline Blends on Emissions from a Flex-Fuel Vehicle Tested over the Worldwide Harmonized Light Duty Test Cycle (WLTC). Fuel 2015, 143, 173–182. [Google Scholar] [CrossRef]
- Saliba, G.; Saleh, R.; Zhao, Y.; Presto, A.A.; Lambe, A.T.; Frodin, B.; Sardar, S.; Maldonado, H.; Maddox, C.; May, A.A.; et al. Comparison of Gasoline Direct-Injection (GDI) and Port Fuel Injection (PFI) Vehicle Emissions: Emission Certification Standards, Cold-Start, Secondary Organic Aerosol Formation Potential, and Potential Climate Impacts. Environ. Sci. Technol. 2017, 51, 6542–6552. [Google Scholar] [CrossRef]
- Martinet, S.; Liu, Y.; Louis, C.; Tassel, P.; Perret, P.; Chaumond, A.; André, M. Euro 6 Unregulated Pollutant Characterization and Statistical Analysis of After-Treatment Device and Driving-Condition Impact on Recent Passenger-Car Emissions. Environ. Sci. Technol. 2017, 51, 5847–5855. [Google Scholar] [CrossRef] [Green Version]
- Bogarra, M.; Herreros, J.M.; Hergueta, C.; Tsolakis, A.; York, A.P.E.; Millington, P.J. Influence of Three-Way Catalyst on Gaseous and Particulate Matter Emissions During Gasoline Direct Injection Engine Cold-Start. Johns Matthey Technol. Rev. 2017, 61, 329–341. [Google Scholar] [CrossRef]
- Weber, C.; Sundvor, I.; Figenbaum, E. Comparison of Regulated Emission Factors of Euro 6 LDV in Nordic Temperatures and Cold Start Conditions: Diesel- and Gasoline Direct-Injection. Atmos. Environ. 2019, 206, 208–217. [Google Scholar] [CrossRef]
- Suarez-Bertoa, R.; Astorga, C. Impact of Cold Temperature on Euro 6 Passenger Car Emissions. Environ. Pollut. 2018, 234, 318–329. [Google Scholar] [CrossRef]
- Cross, E.S.; Sappok, A.G.; Wong, V.W.; Kroll, J.H. Load-Dependent Emission Factors and Chemical Characteristics of IVOCs from a Medium-Duty Diesel Engine. Environ. Sci. Technol. 2015, 49, 13483–13491. [Google Scholar] [CrossRef]
- Jang, J.; Lee, Y.; Kwon, O. Comparison of Fuel Efficiency and Exhaust Emissions between the Aged and New DPF Systems of Euro 5 Diesel Passenger Car. Int. J. Automot. Technol. 2017, 18, 751–758. [Google Scholar] [CrossRef]
- Ko, J.; Son, J.; Myung, C.-L.; Park, S. Comparative Study on Low Ambient Temperature Regulated/Unregulated Emissions Characteristics of Idling Light-Duty Diesel Vehicles at Cold Start and Hot Restart. Fuel 2018, 233, 620–631. [Google Scholar] [CrossRef]
- Hagena, J.R.; Filipi, Z.; Assanis, D.N. Transient Diesel Emissions: Analysis of Engine Operation during a Tip-In. In Proceedings of the 2006 SAE World Congress, Detroit, MI, USA, 3–6 April 2006. 2006-01-1151. [Google Scholar]
- Brunet, J.; Genty, E.; Landkocz, Y.; Zallouha, M.A.; Billet, S.; Courcot, D.; Siffert, S.; Thomas, D.; De Weireld, G.; Cousin, R. Identification of By-Products Issued from the Catalytic Oxidation of Toluene by Chemical and Biological Methods. Comptes Rendus Chim. 2015, 18, 1084–1093. [Google Scholar] [CrossRef]
- Zhong, J.; Zeng, Y.; Chen, D.; Mo, S.; Zhang, M.; Fu, M.; Wu, J.; Su, Z.; Chen, P.; Ye, D. Toluene Oxidation over Co3+-Rich Spinel Co3O4: Evaluation of Chemical and by-Product Species Identified by in Situ DRIFTS Combined with PTR-TOF-MS. J. Hazard. Mater. 2020, 386, 121957. [Google Scholar] [CrossRef]
- Yanagisawa, N.; Shibata, K.; Enya, K.; Satou, K. Transient Behavior of VOCs Emission and Particle Size Distribution during Active Regeneration of Diesel Particulate Filter Equipped Diesel Engine; Society of Automotive Engineers of Japan, Inc.: Tokyo, Japan, 2011; 2011-01-2087. [Google Scholar]
- Schauer, J.J.; Kleeman, M.J.; Cass, G.R.; Simoneit, B.R.T. Measurement of Emissions from Air Pollution Sources. 2. C1 through C30 Organic Compounds from Medium Duty Diesel Trucks. Environ. Sci. Technol. 1999, 33, 1578–1587. [Google Scholar] [CrossRef]
- Schauer, J.J.; Kleeman, M.J.; Cass, G.R.; Simoneit, B.R.T. Measurement of Emissions from Air Pollution Sources. 5. C1−C32 Organic Compounds from Gasoline-Powered Motor Vehicles. Environ. Sci. Technol. 2002, 36, 1169–1180. [Google Scholar] [CrossRef]
- Alam, M.S.; Zeraati-Rezaei, S.; Xu, H.; Harrison, R.M. Characterization of Gas and Particulate Phase Organic Emissions (C9–C 37) from a Diesel Engine and the Effect of Abatement Devices. Environ. Sci. Technol. 2019, 53, 11345–11352. [Google Scholar] [CrossRef]
- Sekimoto, K.; Inomata, S.; Tanimoto, H.; Fushimi, A.; Fujitani, Y.; Sato, K.; Yamada, H. Characterization of Nitromethane Emission from Automotive Exhaust. Atmos. Environ. 2013, 81, 523–531. [Google Scholar] [CrossRef]
- Inomata, S.; Fujitani, Y.; Fushimi, A.; Tanimoto, H.; Sekimoto, K.; Yamada, H. Field Measurement of Nitromethane from Automotive Emissions at a Busy Intersection Using Proton-Transfer-Reaction Mass Spectrometry. Atmos. Environ. 2014, 96, 301–309. [Google Scholar] [CrossRef]
- Inomata, S.; Yamada, H.; Tanimoto, H. Investigation on VOC Emissions from Automobile Sources by Means of Online Mass Spectrometry. Curr. Pollut. Rep. 2016, 2, 188–199. [Google Scholar] [CrossRef] [Green Version]
- Lindinger, W.; Jordan, A. Proton-Transfer-Reaction Mass Spectrometry (PTR–MS): On-Line Monitoring of Volatile Organic Compounds at Pptv Levels. Chem. Soc. Rev. 1998, 27, 347. [Google Scholar] [CrossRef]
- Erickson, M.H.; Gueneron, M.; Jobson, B.T. Measuring Long Chain Alkanes in Diesel Engine Exhaust by Thermal Desorption PTR-MS. Atmos. Meas. Tech. 2014, 7, 225–239. [Google Scholar] [CrossRef] [Green Version]
- Gueneron, M.; Erickson, M.H.; VanderSchelden, G.S.; Jobson, B.T. PTR-MS Fragmentation Patterns of Gasoline Hydrocarbons. Int. J. Mass Spectrom. 2015, 379, 97–109. [Google Scholar] [CrossRef]
- Pieber, S.M.; Kumar, N.K.; Klein, F.; Comte, P.; Bhattu, D.; Dommen, J.; Bruns, E.A.; Kılıç, D.; El Haddad, I.; Keller, A.; et al. Gas-Phase Composition and Secondary Organic Aerosol Formation from Standard and Particle Filter-Retrofitted Gasoline Direct Injection Vehicles Investigated in a Batch and Flow Reactor. Atmos. Chem. Phys. 2018, 18, 9929–9954. [Google Scholar] [CrossRef] [Green Version]
- Jordan, A.; Haidacher, S.; Hanel, G.; Hartungen, E.; Märk, L.; Seehauser, H.; Schottkowsky, R.; Sulzer, P.; Märk, T.D. A High Resolution and High Sensitivity Proton-Transfer-Reaction Time-of-Flight Mass Spectrometer (PTR-TOF-MS). Int. J. Mass Spectrom. 2009, 286, 122–128. [Google Scholar] [CrossRef]
- Graus, M.; Müller, M.; Hansel, A. High Resolution PTR-TOF: Quantification and Formula Confirmation of VOC in Real Time. J. Am. Soc. Mass Spectrom. 2010, 21, 1037–1044. [Google Scholar] [CrossRef] [Green Version]
- Wang, L.; Slowik, J.G.; Tripathi, N.; Bhattu, D.; Rai, P.; Kumar, V.; Vats, P.; Satish, R.; Baltensperger, U.; Ganguly, D.; et al. Source Characterization of Volatile Organic Compounds Measured by Proton-Transfer-Reaction Time-of-Flight Mass Spectrometers in Delhi, India. Atmos. Chem. Phys. 2020, 20, 9753–9770. [Google Scholar] [CrossRef]
- Liu, Y.; Song, M.; Liu, X.; Zhang, Y.; Hui, L.; Kong, L.; Zhang, Y.; Zhang, C.; Qu, Y.; An, J.; et al. Characterization and Sources of Volatile Organic Compounds (VOCs) and Their Related Changes during Ozone Pollution Days in 2016 in Beijing, China. Environ. Pollut. 2020, 257, 113599. [Google Scholar] [CrossRef]
- Kari, E.; Faiola, C.L.; Isokääntä, S.; Miettinen, P.; Yli-Pirilä, P.; Buchholz, A.; Kivimäenpää, M.; Mikkonen, S.; Holopainen, J.K.; Virtanen, A. Time-Resolved Characterization of Biotic Stress Emissions from Scots Pines Being Fed upon by Pine Weevil by Means of PTR-ToF-MS. Boreal Environ. Res. 2019, 24, 26. [Google Scholar]
- Li, H.; Canagaratna, M.R.; Riva, M.; Rantala, P.; Zhang, Y.; Thomas, S.; Heikkinen, L.; Flaud, P.-M.; Villenave, E.; Perraudin, E.; et al. Atmospheric Organic Vapors in Two European Pine Forests Measured by a Vocus PTR-TOF: Insights into Monoterpene and Sesquiterpene Oxidation Processes. Atmos. Chem. Phys. 2021, 21, 4123–4147. [Google Scholar] [CrossRef]
- Rosati, B.; Teiwes, R.; Kristensen, K.; Bossi, R.; Skov, H.; Glasius, M.; Pedersen, H.B.; Bilde, M. Factor Analysis of Chemical Ionization Experiments: Numerical Simulations and an Experimental Case Study of the Ozonolysis of α-Pinene Using a PTR-ToF-MS. Atmos. Environ. 2019, 199, 15–31. [Google Scholar] [CrossRef]
- Paatero, P.; Tapper, U. Positive Matrix Factorization: A Non-Negative Factor Model with Optimal Utilization of Error Estimates of Data Values. Environmetrics 1994, 5, 111–126. [Google Scholar] [CrossRef]
- André, M. The ARTEMIS European Driving Cycles for Measuring Car Pollutant Emissions. Sci. Total Environ. 2004, 334–335, 73–84. [Google Scholar] [CrossRef]
- Alves, C.A.; Lopes, D.J.; Calvo, A.I.; Evtyugina, M.; Rocha, S.; Nunes, T. Emissions from Light-Duty Diesel and Gasoline in-Use Vehicles Measured on Chassis Dynamometer Test Cycles. Aerosol Air Qual. Res. 2015, 15, 99–116. [Google Scholar] [CrossRef] [Green Version]
- Alves, C.A.; Calvo, A.I.; Lopes, D.J.; Nunes, T.; Charron, A.; Goriaux, M.; Tassel, P.; Perret, P. Emissions of Euro 3–5 Passenger Cars Measured Over Different Driving Cycles. Int. J. Environ. Chem. Ecol. Geol. Geophys. Eng. 2013, 7, 4. [Google Scholar]
- Liu, Y.; Martinet, S.; Louis, C.; Pasquier, A.; Tassel, P.; Perret, P. Emission Characterization of In-Use Diesel and Gasoline Euro 4 to Euro 6 Passenger Cars Tested on Chassis Dynamometer Bench and Emission Model Assessment. Aerosol Air Qual. Res. 2017, 17, 2289–2299. [Google Scholar] [CrossRef] [Green Version]
- Tofware. Available online: https://www.tofwerk.com/software/tofware/ (accessed on 30 March 2022).
- Gentner, D.R.; Worton, D.R.; Isaacman, G.; Davis, L.C.; Dallmann, T.R.; Wood, E.C.; Herndon, S.C.; Goldstein, A.H.; Harley, R.A. Chemical Composition of Gas-Phase Organic Carbon Emissions from Motor Vehicles and Implications for Ozone Production. Environ. Sci. Technol. 2013, 47, 11837–11848. [Google Scholar] [CrossRef]
- Cappellin, L.; Karl, T.; Probst, M.; Ismailova, O.; Winkler, P.M.; Soukoulis, C.; Aprea, E.; Märk, T.D.; Gasperi, F.; Biasioli, F. On Quantitative Determination of Volatile Organic Compound Concentrations Using Proton Transfer Reaction Time-of-Flight Mass Spectrometry. Environ. Sci. Technol. 2012, 46, 2283–2290. [Google Scholar] [CrossRef]
- Pagonis, D.; Sekimoto, K.; de Gouw, J. A Library of Proton-Transfer Reactions of H 3 O + Ions Used for Trace Gas Detection. J. Am. Soc. Mass Spectrom. 2019, 30, 1330–1335. [Google Scholar] [CrossRef]
- Crippa, M.; Canonaco, F.; Slowik, J.G.; El Haddad, I.; DeCarlo, P.F.; Mohr, C.; Heringa, M.F.; Chirico, R.; Marchand, N.; Temime-Roussel, B.; et al. Primary and Secondary Organic Aerosol Origin by Combined Gas-Particle Phase Source Apportionment. Atmos. Chem. Phys. 2013, 13, 8411–8426. [Google Scholar] [CrossRef] [Green Version]
- de Gouw, J.; Warneke, C. Measurements of Volatile Organic Compounds in the Earth’s Atmosphere Using Proton-Transfer-Reaction Mass Spectrometry. Mass Spectrom. Rev. 2007, 26, 223–257. [Google Scholar] [CrossRef]
- Paatero, P. The Multilinear Engine—A Table-Driven, Least Squares Program for Solving Multilinear Problems, Including the n-Way Parallel Factor Analysis Model. J. Comput. Graph. Stat. 1999, 8, 854–888. [Google Scholar] [CrossRef]
- Datalystica. Available online: https://datalystica.com (accessed on 30 March 2022).
- Soukoulis, C.; Cappellin, L.; Aprea, E.; Costa, F.; Viola, R.; Märk, T.D.; Gasperi, F.; Biasioli, F. PTR-ToF-MS, A Novel, Rapid, High Sensitivity and Non-Invasive Tool to Monitor Volatile Compound Release During Fruit Post-Harvest Storage: The Case Study of Apple Ripening. Food Bioprocess Technol. 2013, 6, 2831–2843. [Google Scholar] [CrossRef]
- Roslund, P.; Aakko-Saksa, P.; Koponen, P.; Nuottimaki, J. Unregulated Emissions from Euro 5 Emission Level Cars. VTT Research Report No. VTT-R-04308-14. VTT Technical Research Centre of Finland, 2014. Available online: http://transsmart.fi/files/179/Unregulated_Emissions_from_Euro_5_Emission_Level_Cars_VTT-R-04308-14.pdf (accessed on 4 April 2022).
- Hayeck, N.; Temime-Roussel, B.; Gligorovski, S.; Mizzi, A.; Gemayel, R.; Tlili, S.; Maillot, P.; Pic, N.; Vitrani, T.; Poulet, I.; et al. Monitoring of Organic Contamination in the Ambient Air of Microelectronic Clean Room by Proton-Transfer Reaction/Time-of-Flight/Mass Spectrometry (PTR–ToF–MS). Int. J. Mass Spectrom. 2015, 392, 102–110. [Google Scholar] [CrossRef]
- Louis, C.; Liu, Y.; Tassel, P.; Perret, P.; Chaumond, A.; André, M. PAH, BTEX, Carbonyl Compound, Black-Carbon, NO2 and Ultrafine Particle Dynamometer Bench Emissions for Euro 4 and Euro 5 Diesel and Gasoline Passenger Cars. Atmos. Environ. 2016, 141, 80–95. [Google Scholar] [CrossRef]
- Bock, N.; Baum, M.M.; Anderson, M.B.; Pesta, A.; Northrop, W.F. Dicarboxylic Acid Emissions from Aftertreatment Equipped Diesel Engines. Environ. Sci. Technol. 2017, 51, 13036–13043. [Google Scholar] [CrossRef]
- Liang, Z.; Chen, L.; Alam, M.S.; Zeraati Rezaei, S.; Stark, C.; Xu, H.; Harrison, R.M. Comprehensive Chemical Characterization of Lubricating Oils Used in Modern Vehicular Engines Utilizing GC × GC-TOFMS. Fuel 2018, 220, 792–799. [Google Scholar] [CrossRef]
- Wang, Z.; Yang, H.; Liu, R.; Xie, S.; Liu, Y.; Dai, H.; Huang, H.; Deng, J. Probing Toluene Catalytic Removal Mechanism over Supported Pt Nano- and Single-Atom-Catalyst. J. Hazard. Mater. 2020, 392, 122258. [Google Scholar] [CrossRef]
- Reiter, M.S.; Kockelman, K.M. The Problem of Cold Starts: A Closer Look at Mobile Source Emissions Levels. Transp. Res. Part D Transp. Environ. 2016, 43, 123–132. [Google Scholar] [CrossRef] [Green Version]
- Bruehlmann, S.; Novak, P.; Lienemann, P.; Trottmann, M.; Gfeller, U.; Zwicky, C.N.; Bommer, B.; Huber, H.; Wolfensberger, M.; Heeb, N.V. Three-Way-Catalyst Induced Benzene Formation: A Precursor Study. Appl. Catal. B Environ. 2007, 70, 276–283. [Google Scholar] [CrossRef]
- Zervas, E.; Montagne, X.; Lahaye, J. Influence of Fuel and Air/Fuel Equivalence Ratio on the Emission of Hydrocarbons from a SI Engine. 2. Formation Pathways and Modelling of Combustion Processes. Fuel 2004, 83, 2313–2321. [Google Scholar] [CrossRef]
- Zhu, R. Tailpipe Emissions from Gasoline Direct Injection (GDI) and Port Fuel Injection (PFI) Vehicles at Both Low and High Ambient Temperatures. Environ. Pollut. 2016, 216, 223–234. [Google Scholar] [CrossRef]
- Angelos, Z. Impact of Diesel Fuel Properties on Fuel Consumption and Exhaust Emissions of a Euro 5 Compliance Passenger Car. Ph.D. Thesis, Aristotle University of Thessaloniki, Thessaloniki, Greece, 2015; p. 142. [Google Scholar]
- Copert, the Industry standard Emissions Calculator. Available online: https://www.emisia.com/utilities/copert/ (accessed on 30 March 2022).
- European Environment Agency. EMEP/EEA Air Pollutant Emission Inventory Guidebook 2019: Technical Guidance to Prepare National Emission Inventories; Publications Office: Luxembourg, 2019. [Google Scholar]
- Andre, M.; Sartelet, K.; Moukhtar, S.; Andre, J.M.; Redaelli, M. Diesel, Petrol or Electric Vehicles: What Choices to Improve Urban Air Quality in the Ile-de-France Region? A Simulation Platform and Case Study. Atmos. Environ. 2020, 241, 117752. [Google Scholar] [CrossRef]


| Diesel Euro 5 | Gasoline Euro 5 | |||
|---|---|---|---|---|
| Vehicle Name | D | PFI | GDI | |
| Size class | 2.0 HDI | 1.0 VVTI | 1.2 TCE 16 V | |
| Engine capacity (cm3) | 1997 | 998 | 1149 | |
| Weight (kg) | 1515 | 1030 | 1100 | |
| Odometer mileage (km) | 103000 | 27712 | 97089 | |
| Catalyst type | DOC | TWC | TWC | |
| Particulate filter type | FBC-DPF | - | - | |
| GC-MS dilution ratio | 2.3 | 2.3 | 8.4 | |
| PTR-ToF-MS dilution ratio | 7.8–15 | 7.8–8.4 | 18.5–23.4 | |
| Tests ambient temperature (°C) | 25 ± 2 | 23 ± 2 | 20 ± 2 | |
| Road loads | a0 (N) | 124.78 | 88.68 | 98.1 |
| a1 (N/(m/s)) | 0 | 0 | 0 | |
| a2 (N/(m/s)2) | 0.515 | 0.381 | 0.429 | |
| Emission Factors | ||||||
|---|---|---|---|---|---|---|
| Gasoline PFI + TWC | Gasoline DI + TWC | Diesel DOC + FBC DPF | ||||
| Compound Class | Cold Start (mg/km) | Motorway (µg/km) | Cold Start (mg/km) | Motorway (mg/km) | Cold Start (mg/km) | Motorway (µg/km) |
| Total NMVOC | 23.6 | 420 ± 25 | 251 ± 64 | 15.4 ± 8.2 | 14.9 ± 6.7 | 2230 ± 1050 |
| Total aromatics | 16.5 | 315 ± 9 | 155 ± 34 | 8.3 ± 4.8 | 0.6 ± 0.2 | 80 ± 45 |
| Monoaromatics | 16.0 | 290 | 150 ± 32 | 7.8 ± 4.6 | 0.6 ± 0.2 * | 70 ± 40 |
| Dihydronaphthalenes | 0.01 * | 2 ± 1 * | 0.5 ± 0.2 * | 0 * | 0 * | 0 * |
| Naphthenics monoaromatics | 0.17 * | 22 ± 7 * | 3.7 ± 1.2 * | 0.18 ± 0.08 * | 0.012 ± 0.007 * | 4 ± 2 * |
| Naphthalenes | 0.30 | 1 ± 1 * | 0.9 ± 0.7 * | 0.3 ± 0.1 * | 0 * | 6 ± 3 |
| Total aliphatics | 4.6 | 76 | 88.2 ± 27.1 | 6.5 ± 3.1 | 3.4 ± 1.3 | 600 ± 290 |
| Unsaturated aliphatics | 0.56 | 0 | 15 ± 6 | 0 | 1.4 ± 0.4 * | 90 ± 40 * |
| Alkanes | 3.6 | 76 | 70 ± 20 | 6.4 ± 3.0 | 1.7 ± 0.8 * | 470 ± 230 |
| Cycloalkanes | 0.42 | 0 | 3 ± 1 | 0.1 ± 0.1 | 0.28 ± 0.09 * | 15 ± 5 * |
| Bicycloalkanes | 0.04 * | 0 * | 0.2 ± 0.1 * | 0 * | 0.01 ± 0.04 * | 25 ± 16 * |
| Total oxygenated | 2.4 | 29 ± 16 | 7.7 ± 3.1 | 0.5 ± 0.3 | 10 ± 5 | 1450 ± 695 |
| Alcohols | 0.36 * | 1 ± 2 * | 2.4 ± 1.2 * | 0.07 ± 0.05 * | 0.5 ± 0.1 * | 31 ± 15 * |
| Carbonyls | 1.4 * | 11 ± 8 * | 2.6 ± 0.9 * | 0.2 ± 0.1 * | 6.2 ± 1.6 * | 770 ± 370 * |
| Unsaturated carbonyls | 0.15 * | 5 ± 2 * | 0.6 ± 0.2 * | 0 * | 0.5 ± 0.2 * | 80 ± 20 * |
| Acids | 0.03 * | 0 * | 0 * | 0 * | 2.9 ± 2.9 * | 460 ± 260 * |
| Others | 0.49 * | 12 ± 4 * | 2.1 ± 0.8 * | 0.2 ± 0.1 * | 0.1 ± 0.1 * | 110 ± 30 * |
| Total nitrogen | 0.065 | 0 | 0.27 ± 0.12 | 0.06 ± 0.03 | 0.9 ± 0.2 | 98 ± 16 |
| Nitroalkanes | 0.02 * | 0 * | 0.07 ± 0.02 * | 0 * | 0.9 ± 0.2 * | 98 ± 16 * |
| Nitriles | 0.04 * | 0 * | 0.2 ± 0.1 * | 0.06 ± 0.03 * | 0.03 ± 0.01 * | 0 * |
Publisher’s Note: MDPI stays neutral with regard to jurisdictional claims in published maps and institutional affiliations. |
© 2022 by the authors. Licensee MDPI, Basel, Switzerland. This article is an open access article distributed under the terms and conditions of the Creative Commons Attribution (CC BY) license (https://creativecommons.org/licenses/by/4.0/).
Share and Cite
Marques, B.; Kostenidou, E.; Valiente, A.M.; Vansevenant, B.; Sarica, T.; Fine, L.; Temime-Roussel, B.; Tassel, P.; Perret, P.; Liu, Y.; et al. Detailed Speciation of Non-Methane Volatile Organic Compounds in Exhaust Emissions from Diesel and Gasoline Euro 5 Vehicles Using Online and Offline Measurements. Toxics 2022, 10, 184. https://0-doi-org.brum.beds.ac.uk/10.3390/toxics10040184
Marques B, Kostenidou E, Valiente AM, Vansevenant B, Sarica T, Fine L, Temime-Roussel B, Tassel P, Perret P, Liu Y, et al. Detailed Speciation of Non-Methane Volatile Organic Compounds in Exhaust Emissions from Diesel and Gasoline Euro 5 Vehicles Using Online and Offline Measurements. Toxics. 2022; 10(4):184. https://0-doi-org.brum.beds.ac.uk/10.3390/toxics10040184
Chicago/Turabian StyleMarques, Baptiste, Evangelia Kostenidou, Alvaro Martinez Valiente, Boris Vansevenant, Thibaud Sarica, Ludovic Fine, Brice Temime-Roussel, Patrick Tassel, Pascal Perret, Yao Liu, and et al. 2022. "Detailed Speciation of Non-Methane Volatile Organic Compounds in Exhaust Emissions from Diesel and Gasoline Euro 5 Vehicles Using Online and Offline Measurements" Toxics 10, no. 4: 184. https://0-doi-org.brum.beds.ac.uk/10.3390/toxics10040184