
Influence of Urban Informal Settlements on Trace Element Accumulation in Road Dust and Their Possible Health Implications in Ekurhuleni Metropolitan Municipality, South Africa


Abstract
:1. Introduction
2. Materials and Methods
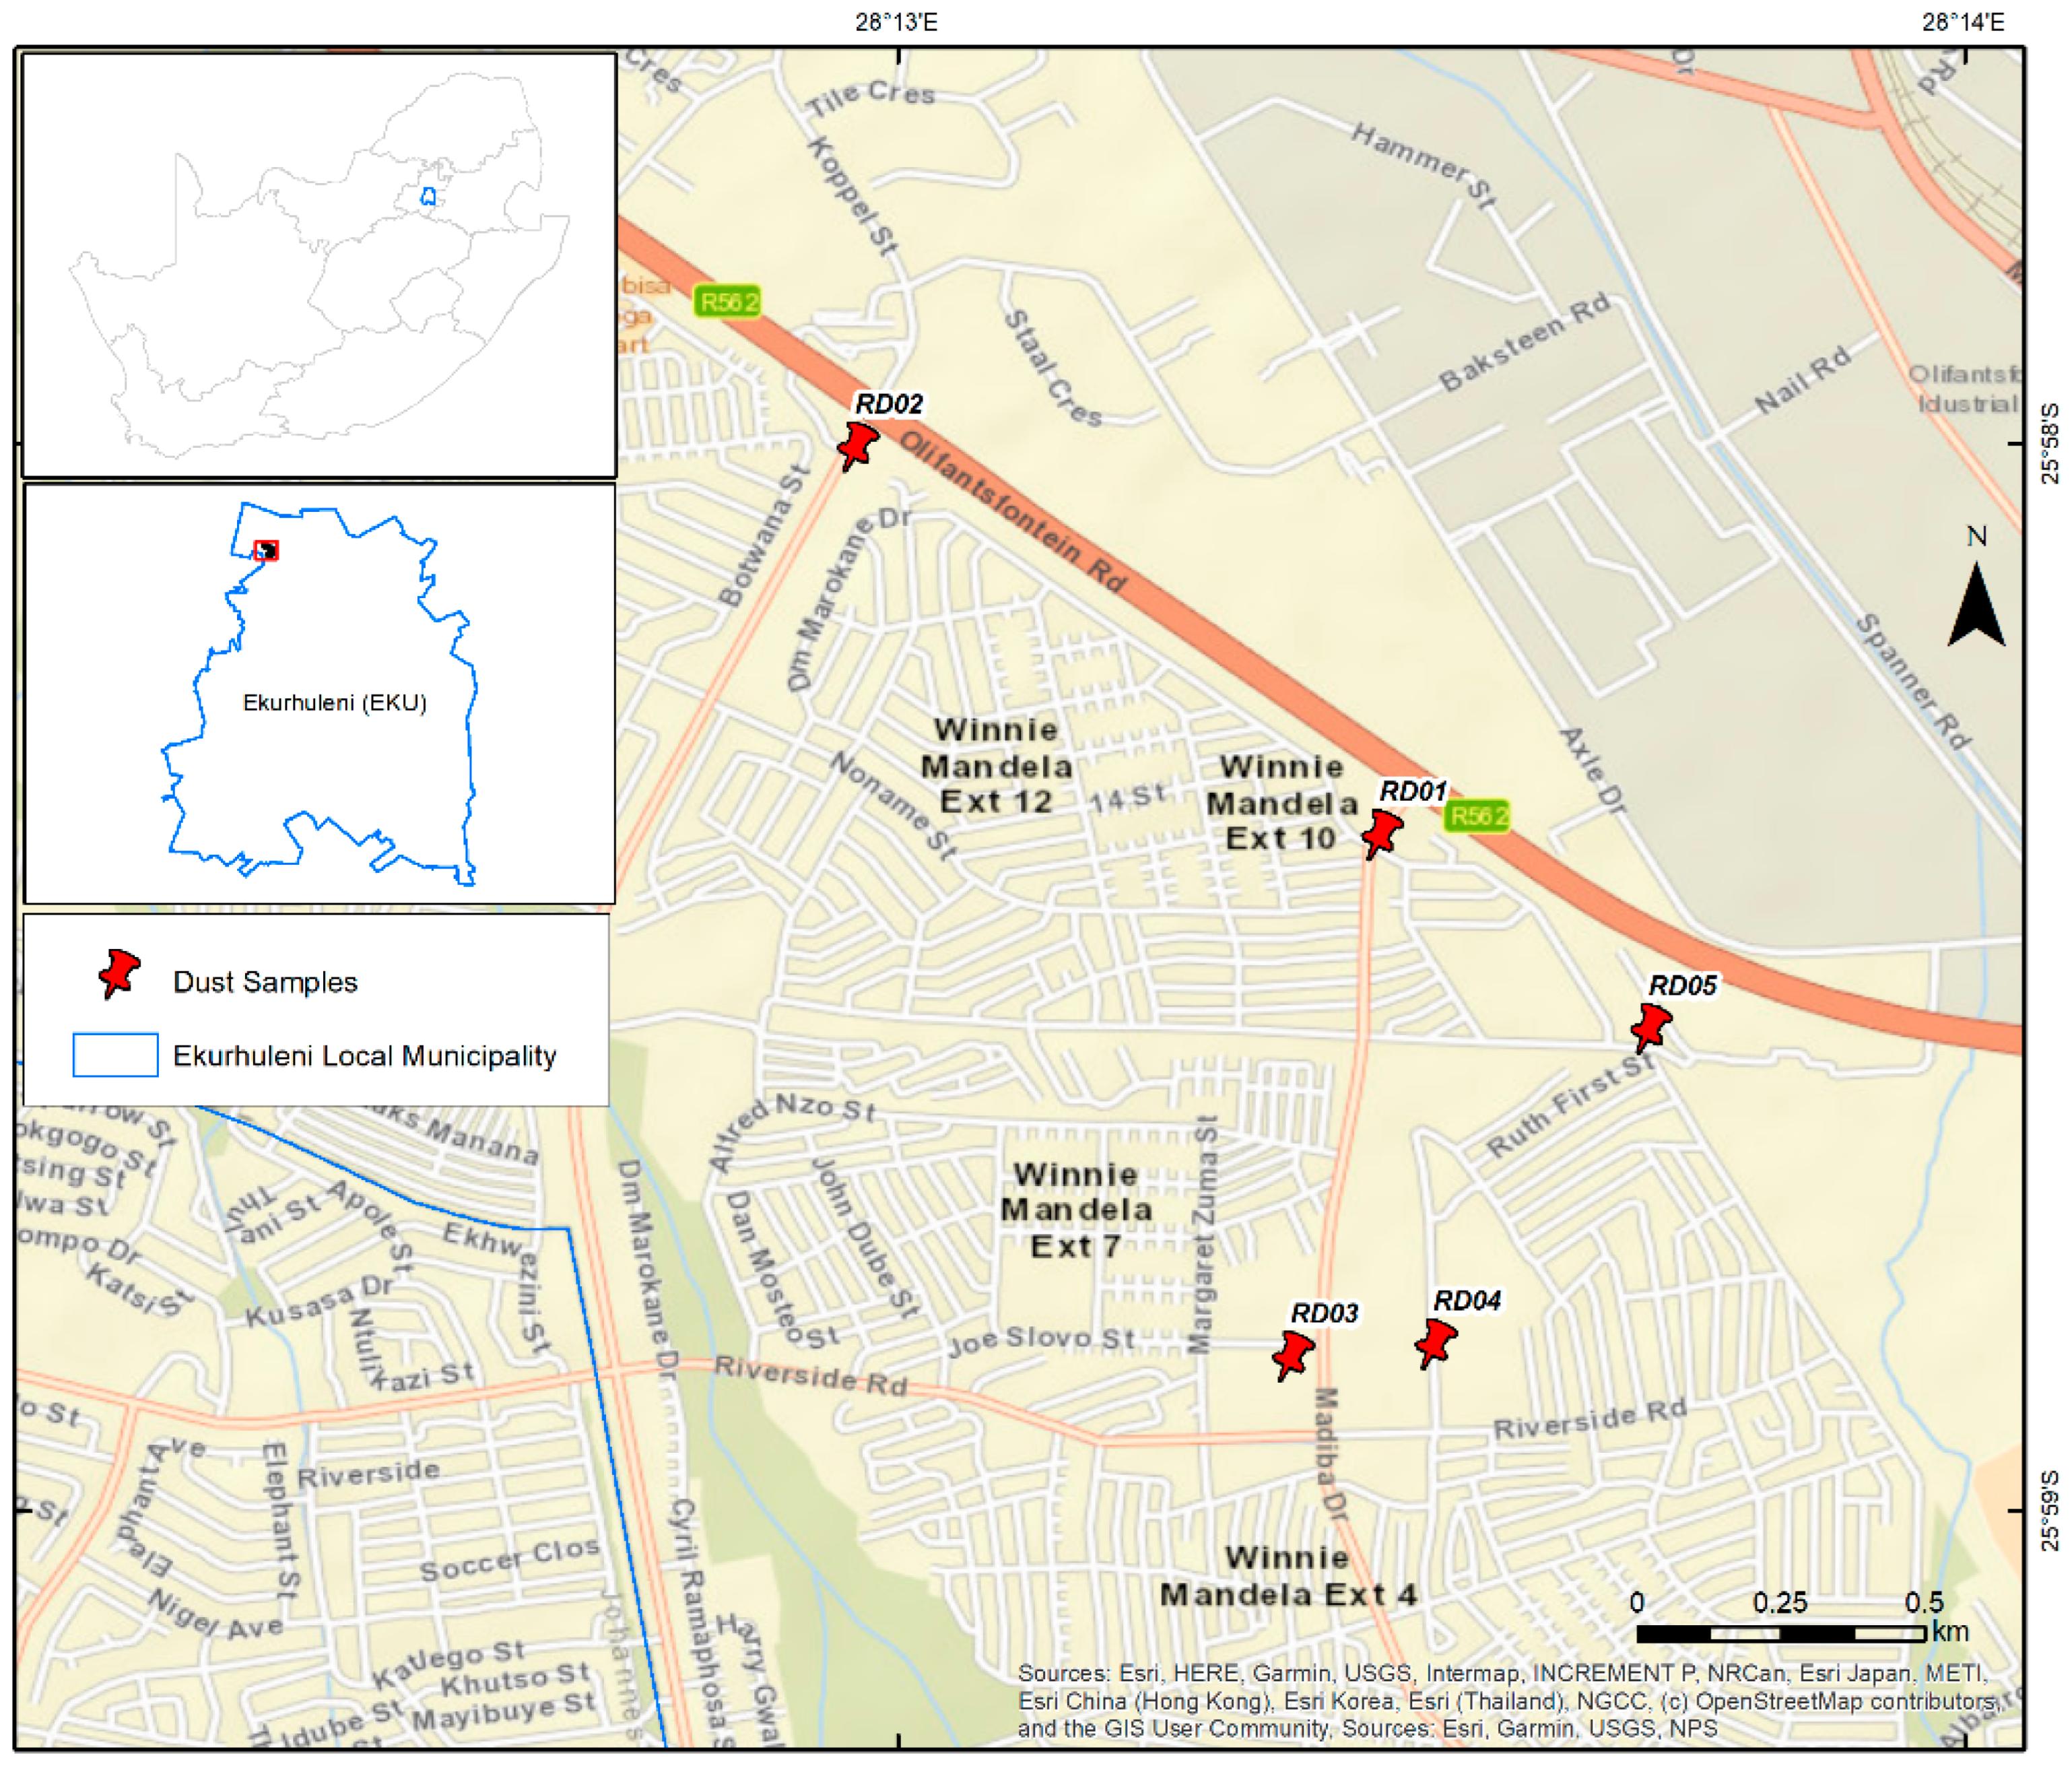
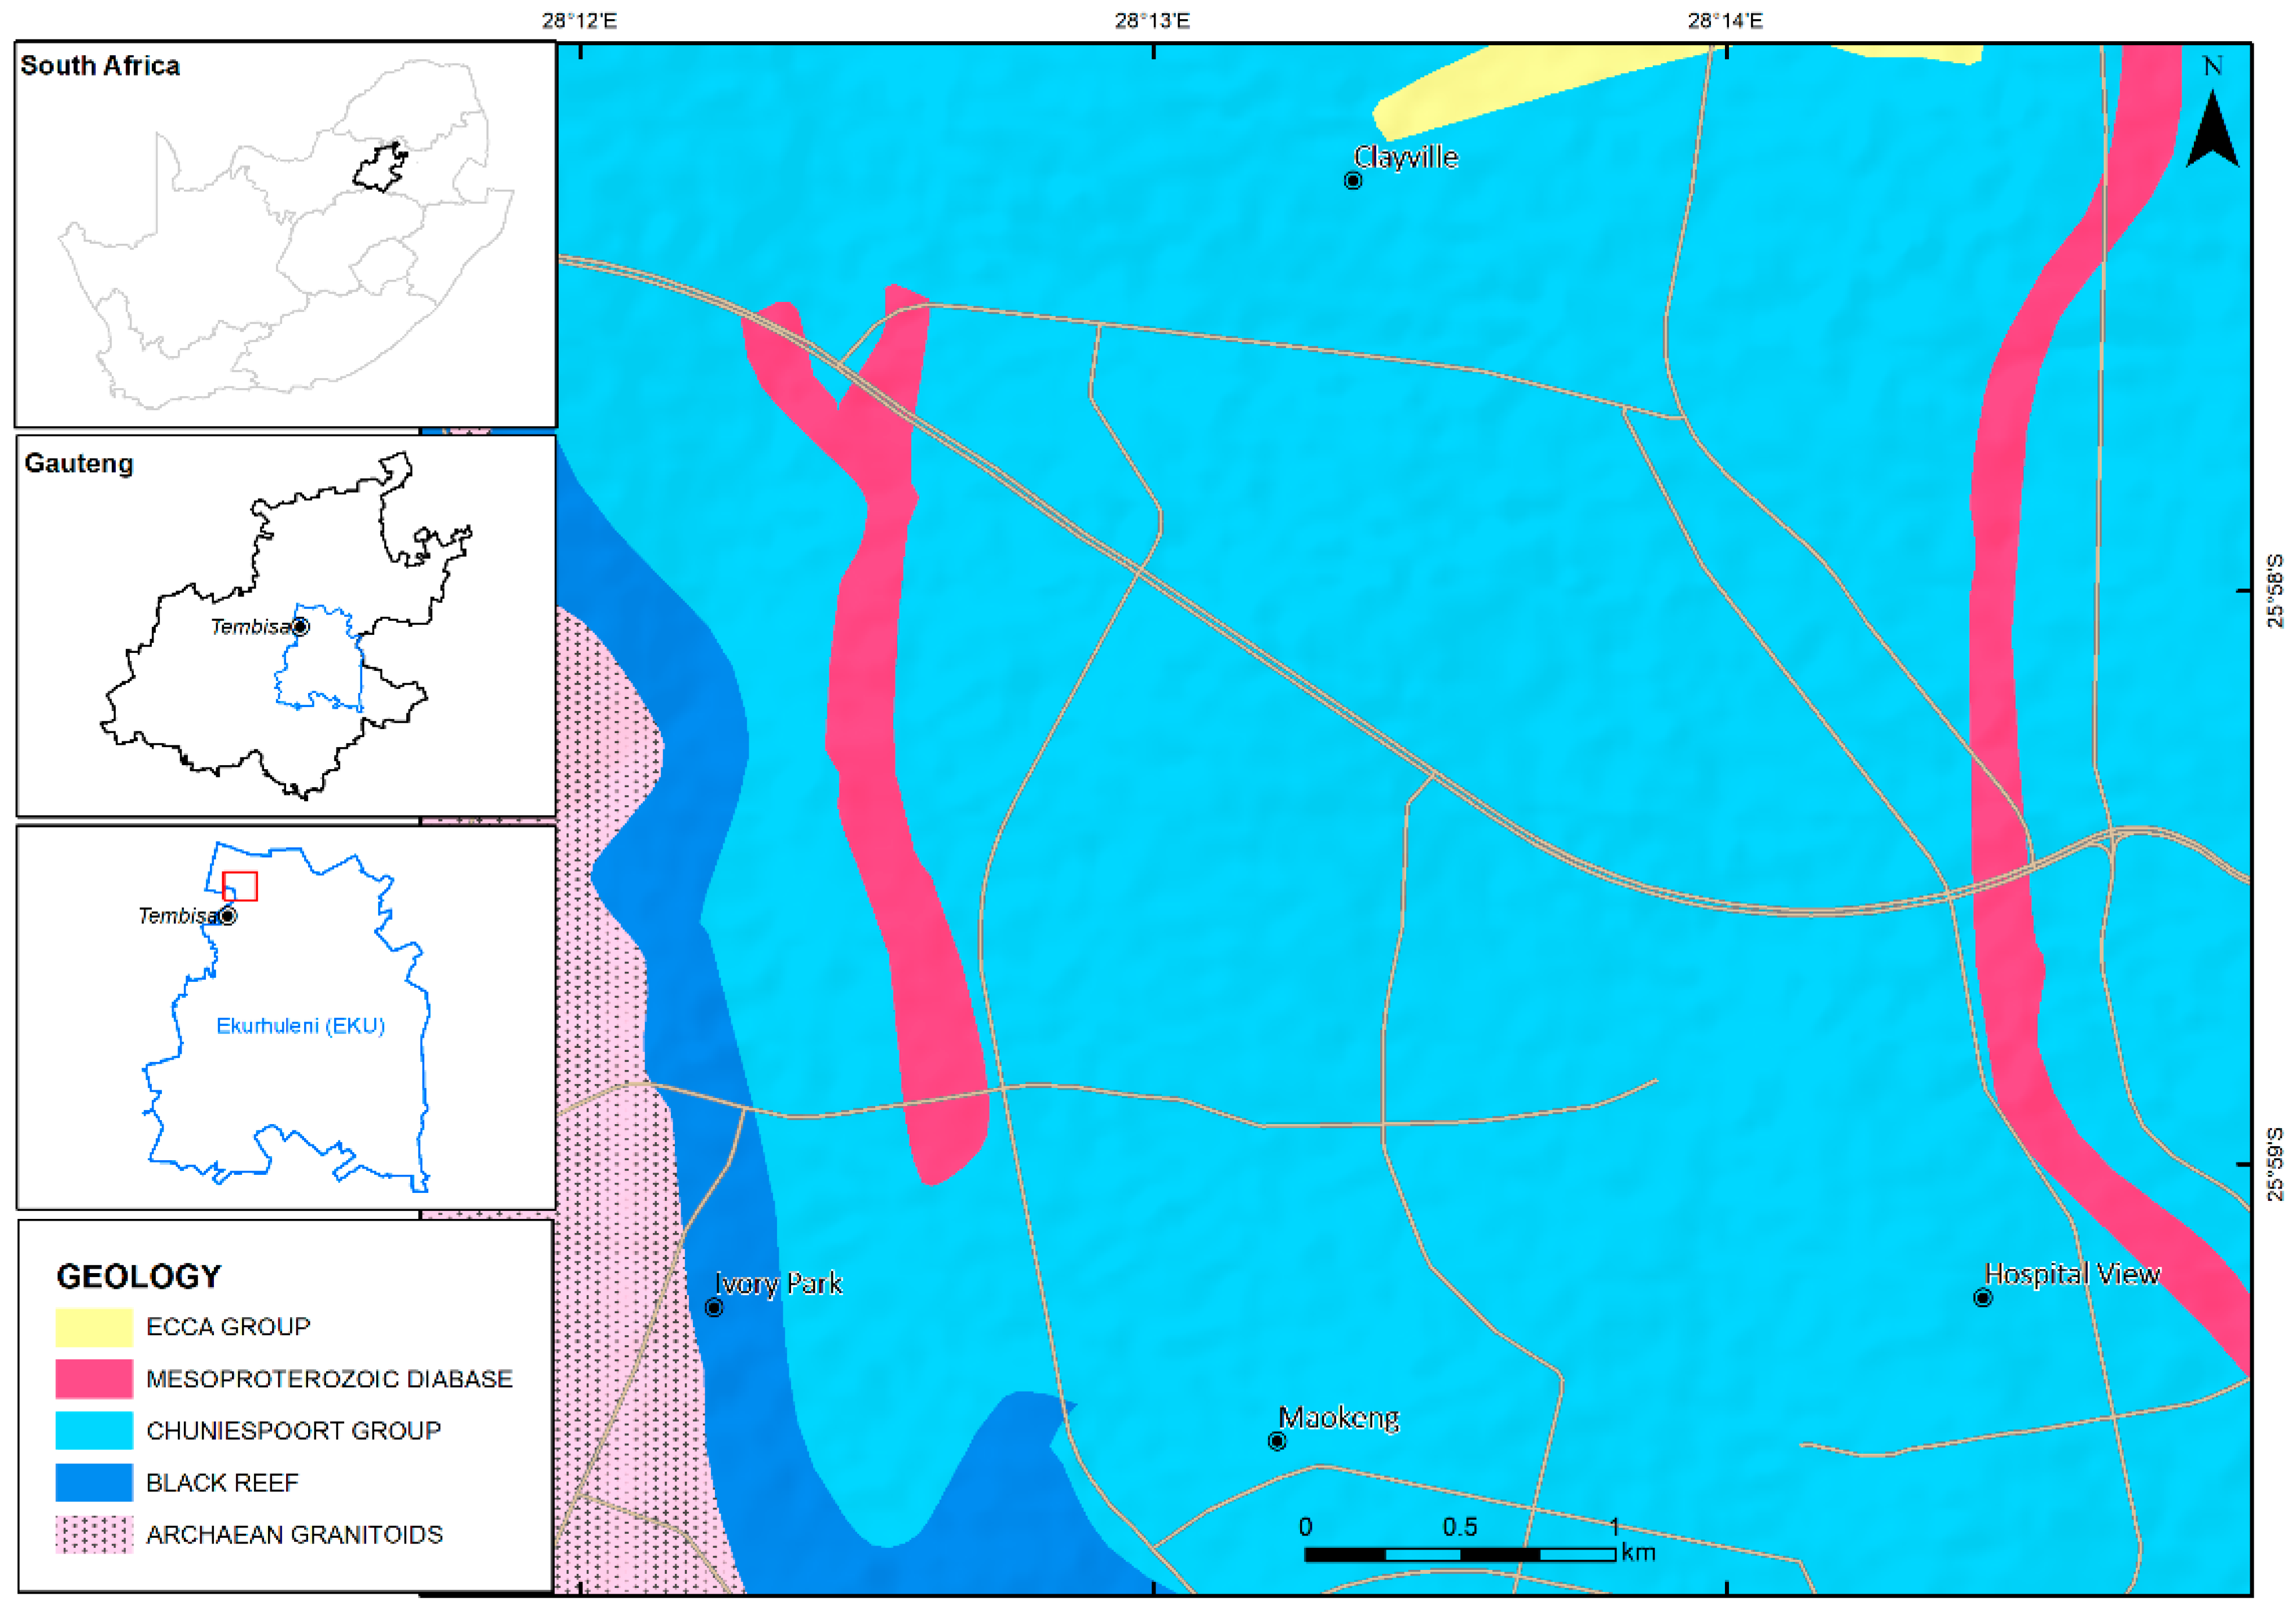
2.1. Study Area
2.2. Sample Collection and Chemical Analysis
2.3. Pollution Assessment of Trace Elements in Road Dust
2.3.1. Geo-Accumulation Index (Igeo)
2.3.2. Contamination Factor (CF) and Pollution Load Index (PLI)
2.3.3. Enrichment Factors (EF)
2.4. Human Health Risk Assessment of Trace Elements in Road Dust
2.4.1. Non-Cancer Risk Assessment

| Items | Parameter | Meaning | Unit | Value | References | |
|---|---|---|---|---|---|---|
| Children | Adult | |||||
| Basic parameter | C | Concentration of a metal | mg/kg | This study | This study | [9,23,26] |
| D | Daily dose | mg/kg | [9,23,26] | |||
| CF | Conversion factor | kg/mg | 1 × 10⁻⁶ | 1 × 10⁻⁶ | [9,23,26] | |
| Exposure behavioral parameter | ED | Exposure duration | years | 6 | 24 | [9,23,26] |
| BW | Body weight | kg | 15 | 55.9 | [9,23,26] | |
| EF | Exposure frequency | days/year | 350 | 350 | [9,23,26] | |
| AT | Average time (carcinogen) | days | 365 × 70 | 365 × 70 | [9,23,26] | |
| Average time (non-carcinogen) | days | 365 × ED | 365 × ED | [9,23,26] | ||
| Digestive tract/inhalation | InhR | Inhalation rate | m3/kg | 5 | 20 | [9,23,26] |
| IngR | Ingestion rate | mg/kg | 200 | 100 | [9,23,26] | |
| PEF | Particle emission factor | m3/kg | 1.32 × 10⁹ | 1.32 × 10⁹ | [9,23,26] | |
| Skin contact | SL | Skin adherence factor | mg/cm2 | 1 | 1 | [9,23,26] |
| SA | Skin surface area | cm2 | 1800 | 5000 | [9,23,26] | |
| ABS | Dermal absorption | - | 0.001 | 0.001 | [9,23,26] | |
2.4.2. Cancer Risk Assessment
2.5. Statistical Methods
3. Results and Discussion
3.1. Concentration of Major Elements in Road Dust
| Elements | RD01 | RD02 | RD03 | RD04 | RD05 | Min-Max | Mean | ±SD | ASV |
|---|---|---|---|---|---|---|---|---|---|
| Al2O3 | 7.22 | 8.43 | 6.21 | 5.9 | 6.72 | 5.9–8.43 | 6.9 | 0.99 | 15.4 |
| CaO | 4.23 | 3.62 | 1.97 | 1.09 | 2.66 | 1.09–4.23 | 2.71 | 1.26 | 3.1 |
| Fe2O3 | 3.41 | 3.52 | 3.68 | 4.11 | 4.67 | 3.41–4.67 | 3.88 | 0.52 | 4.02 |
| K2O | 1.43 | 2.44 | 1.27 | 1.45 | 1.22 | 1.22–2.44 | 1.56 | 0.5 | 3.24 |
| MgO | 1.18 | 1.15 | 0.72 | 0.32 | 1.33 | 0.32–1.33 | 0.94 | 0.41 | 2.44 |
| MnO | 0.42 | 0.24 | 0.66 | 1.03 | 0.51 | 0.24–1.03 | 0.57 | 0.3 | trace |
| Na2O | 0.98 | 1.89 | 0.71 | 0.76 | 0.62 | 0.62–1.89 | 0.99 | 0.52 | 1.3 |
| P2O5 | 0.12 | 0.37 | 0.11 | 0.08 | 0.12 | 0.08–0.37 | 0.16 | 0.12 | 0.14 |
| SiO2 | 69.17 | 65.37 | 75.07 | 79.92 | 74.25 | 65.37–79.92 | 72.76 | 5.62 | 58.11 |
| TiO2 | 0.36 | 0.35 | 0.46 | 0.35 | 0.48 | 0.35–0.48 | 0.4 | 0.06 | 0.65 |
| LOI | 11.3 | 10.52 | 7.47 | 4.98 | 6.61 | 4.98–11.3 | 8.18 | 2.67 | - |
3.2. Concentration of Trace Elements in Road Dust
3.3. Pollution Assessment and Identification of Sources of Trace Elements in Road Dust
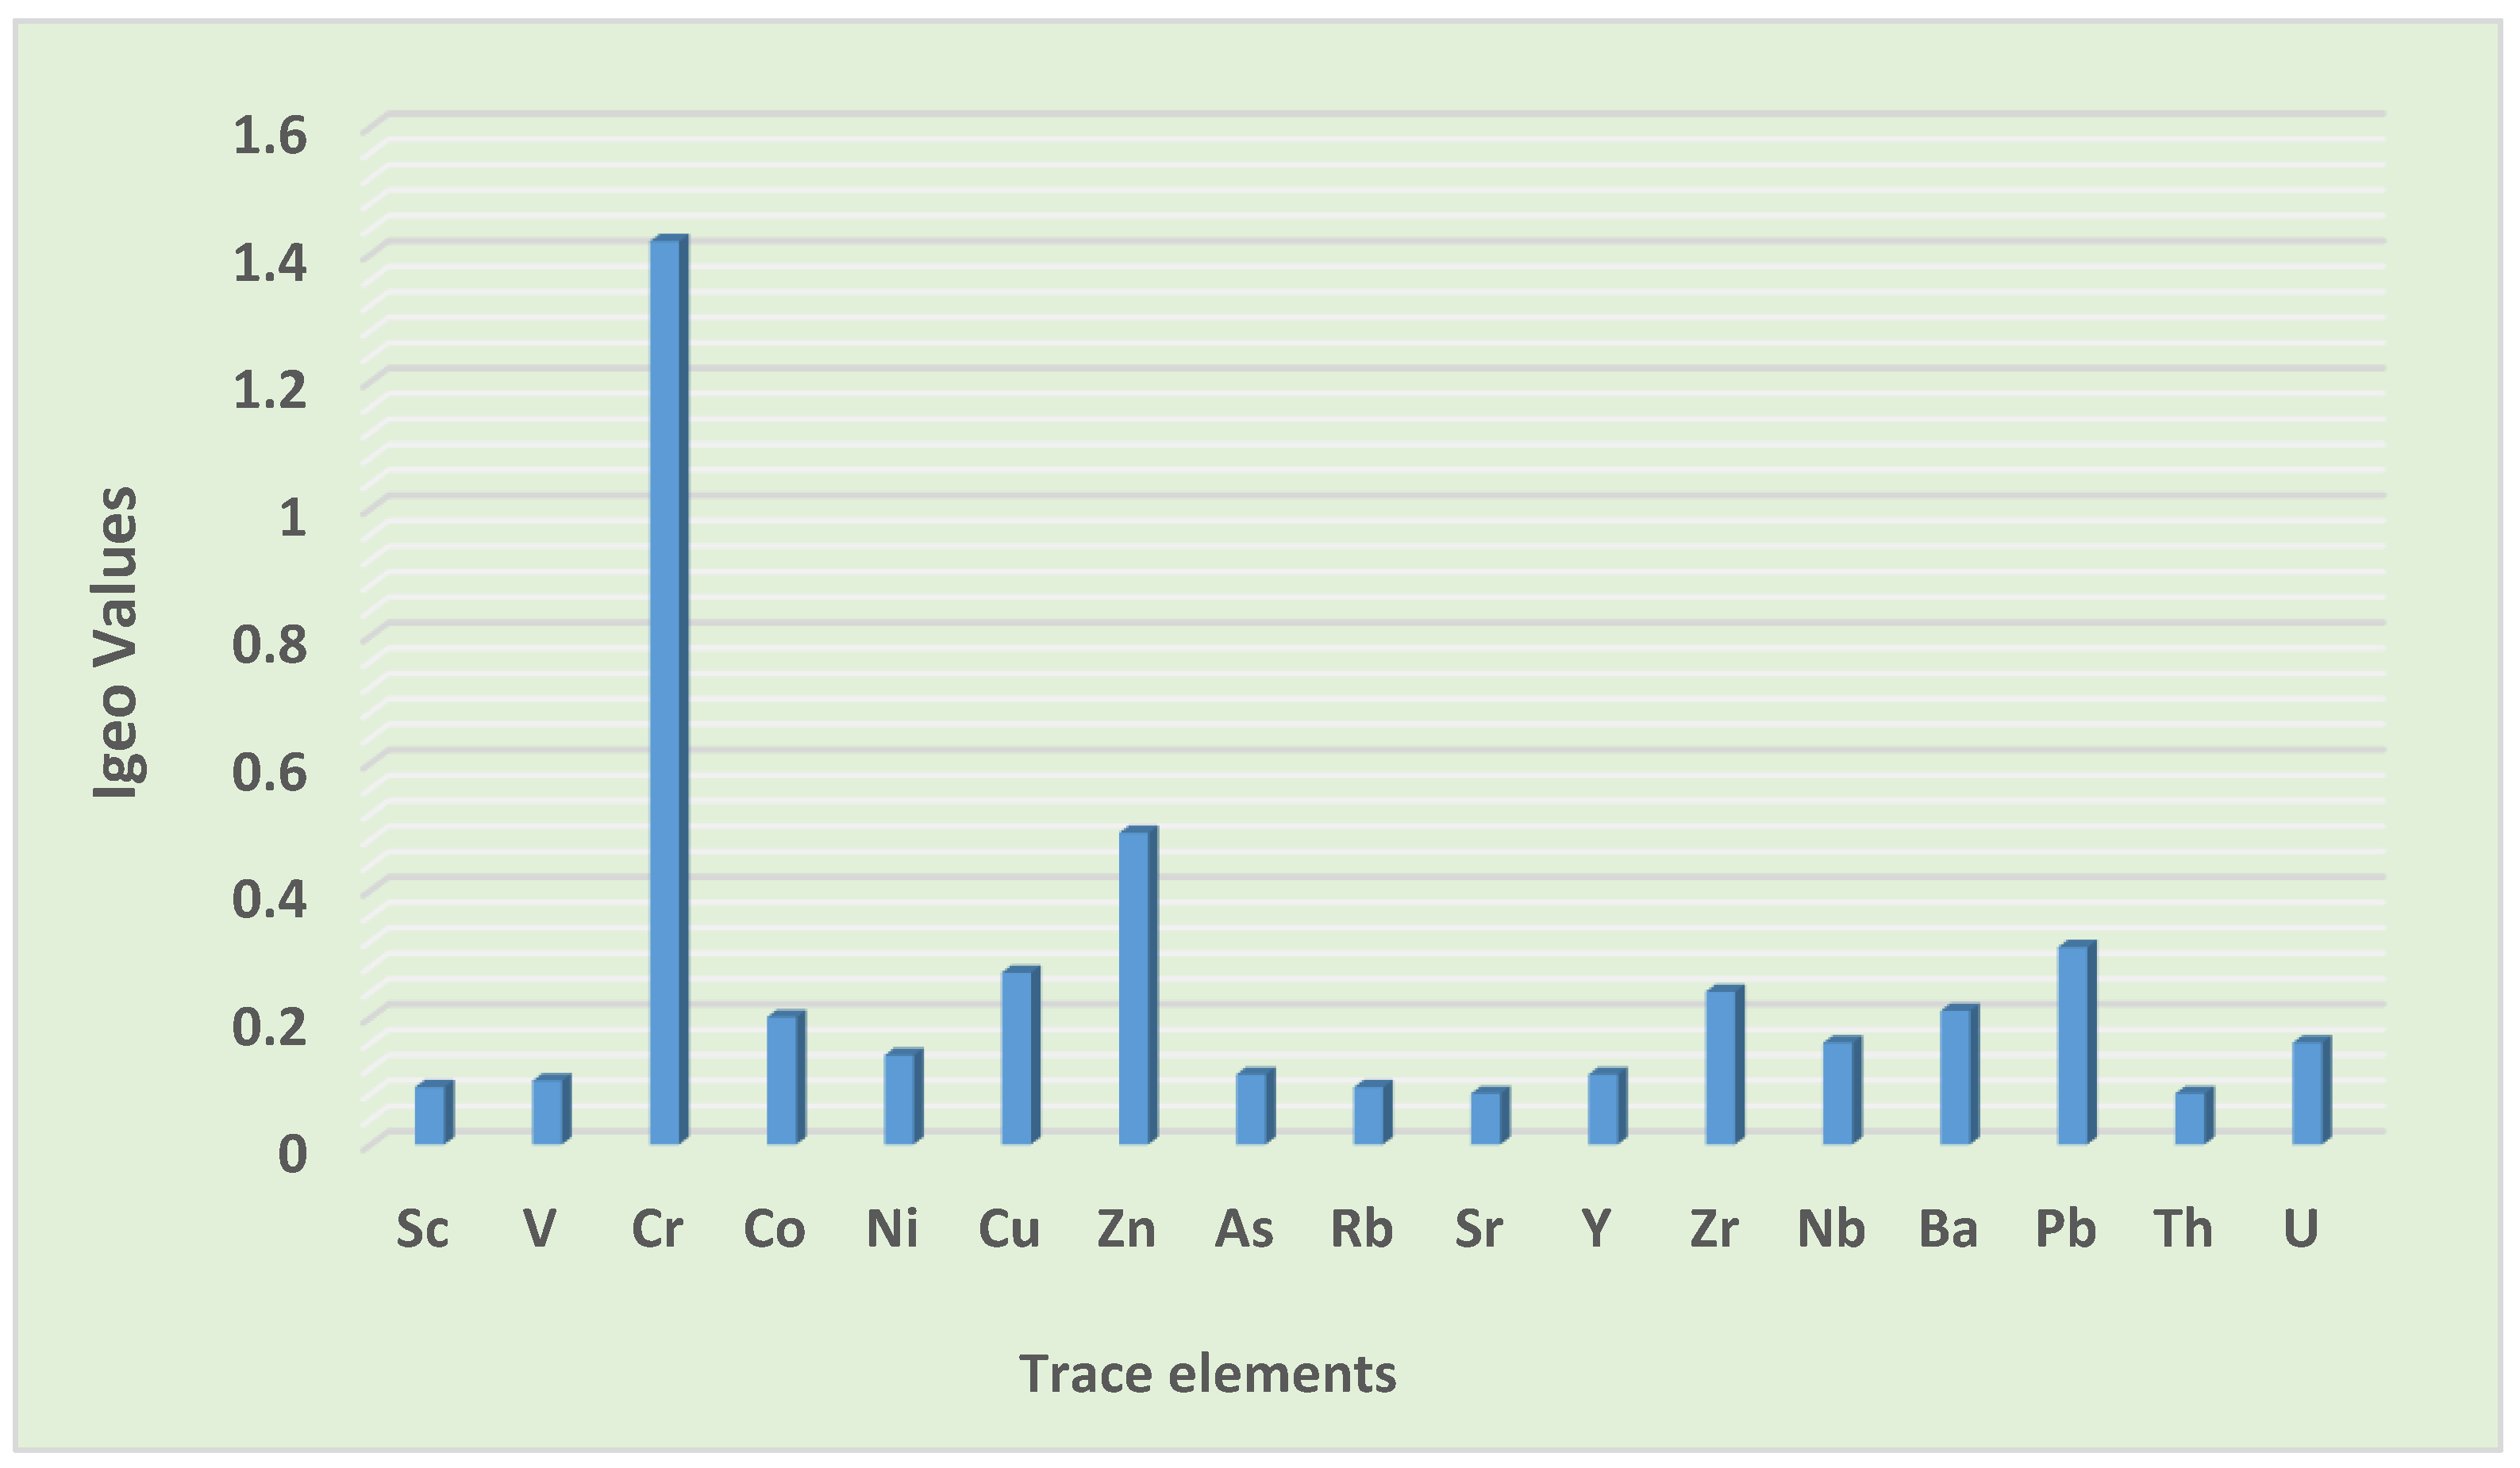
3.3.1. Geo-Accumulation Index (Igeo)
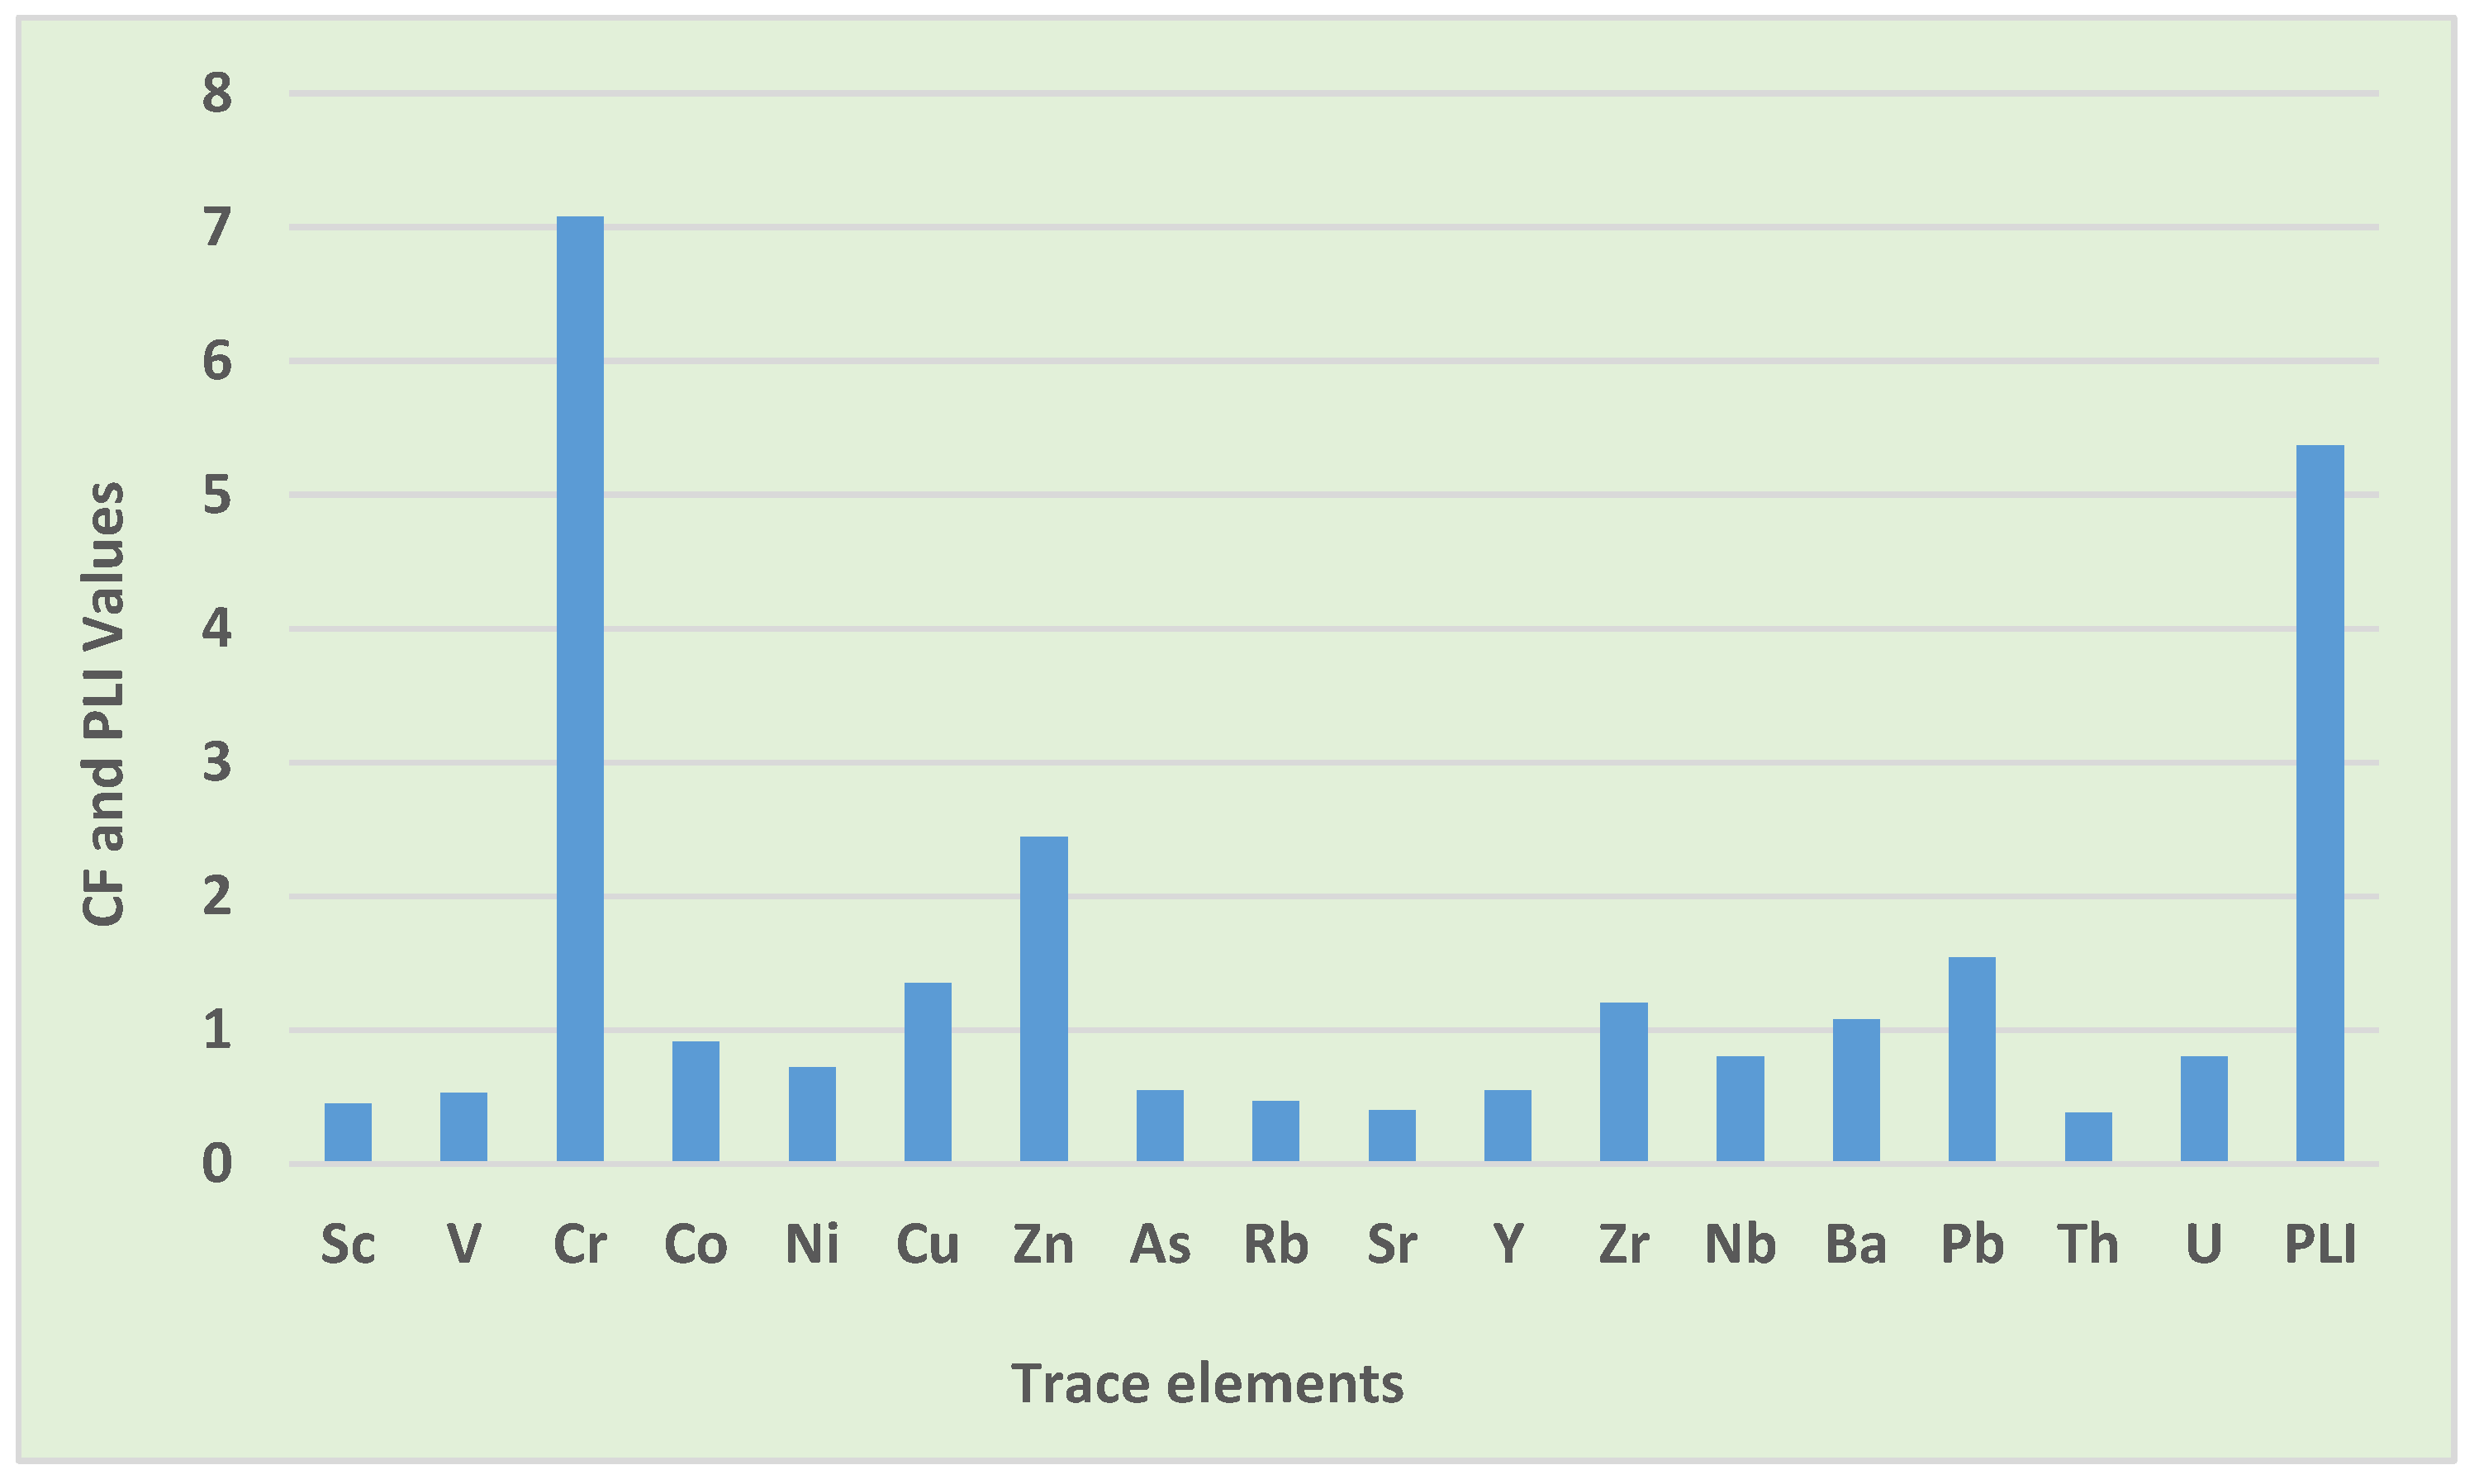
3.3.2. Contamination Factor (CF) and Pollution Load Index (PLI)
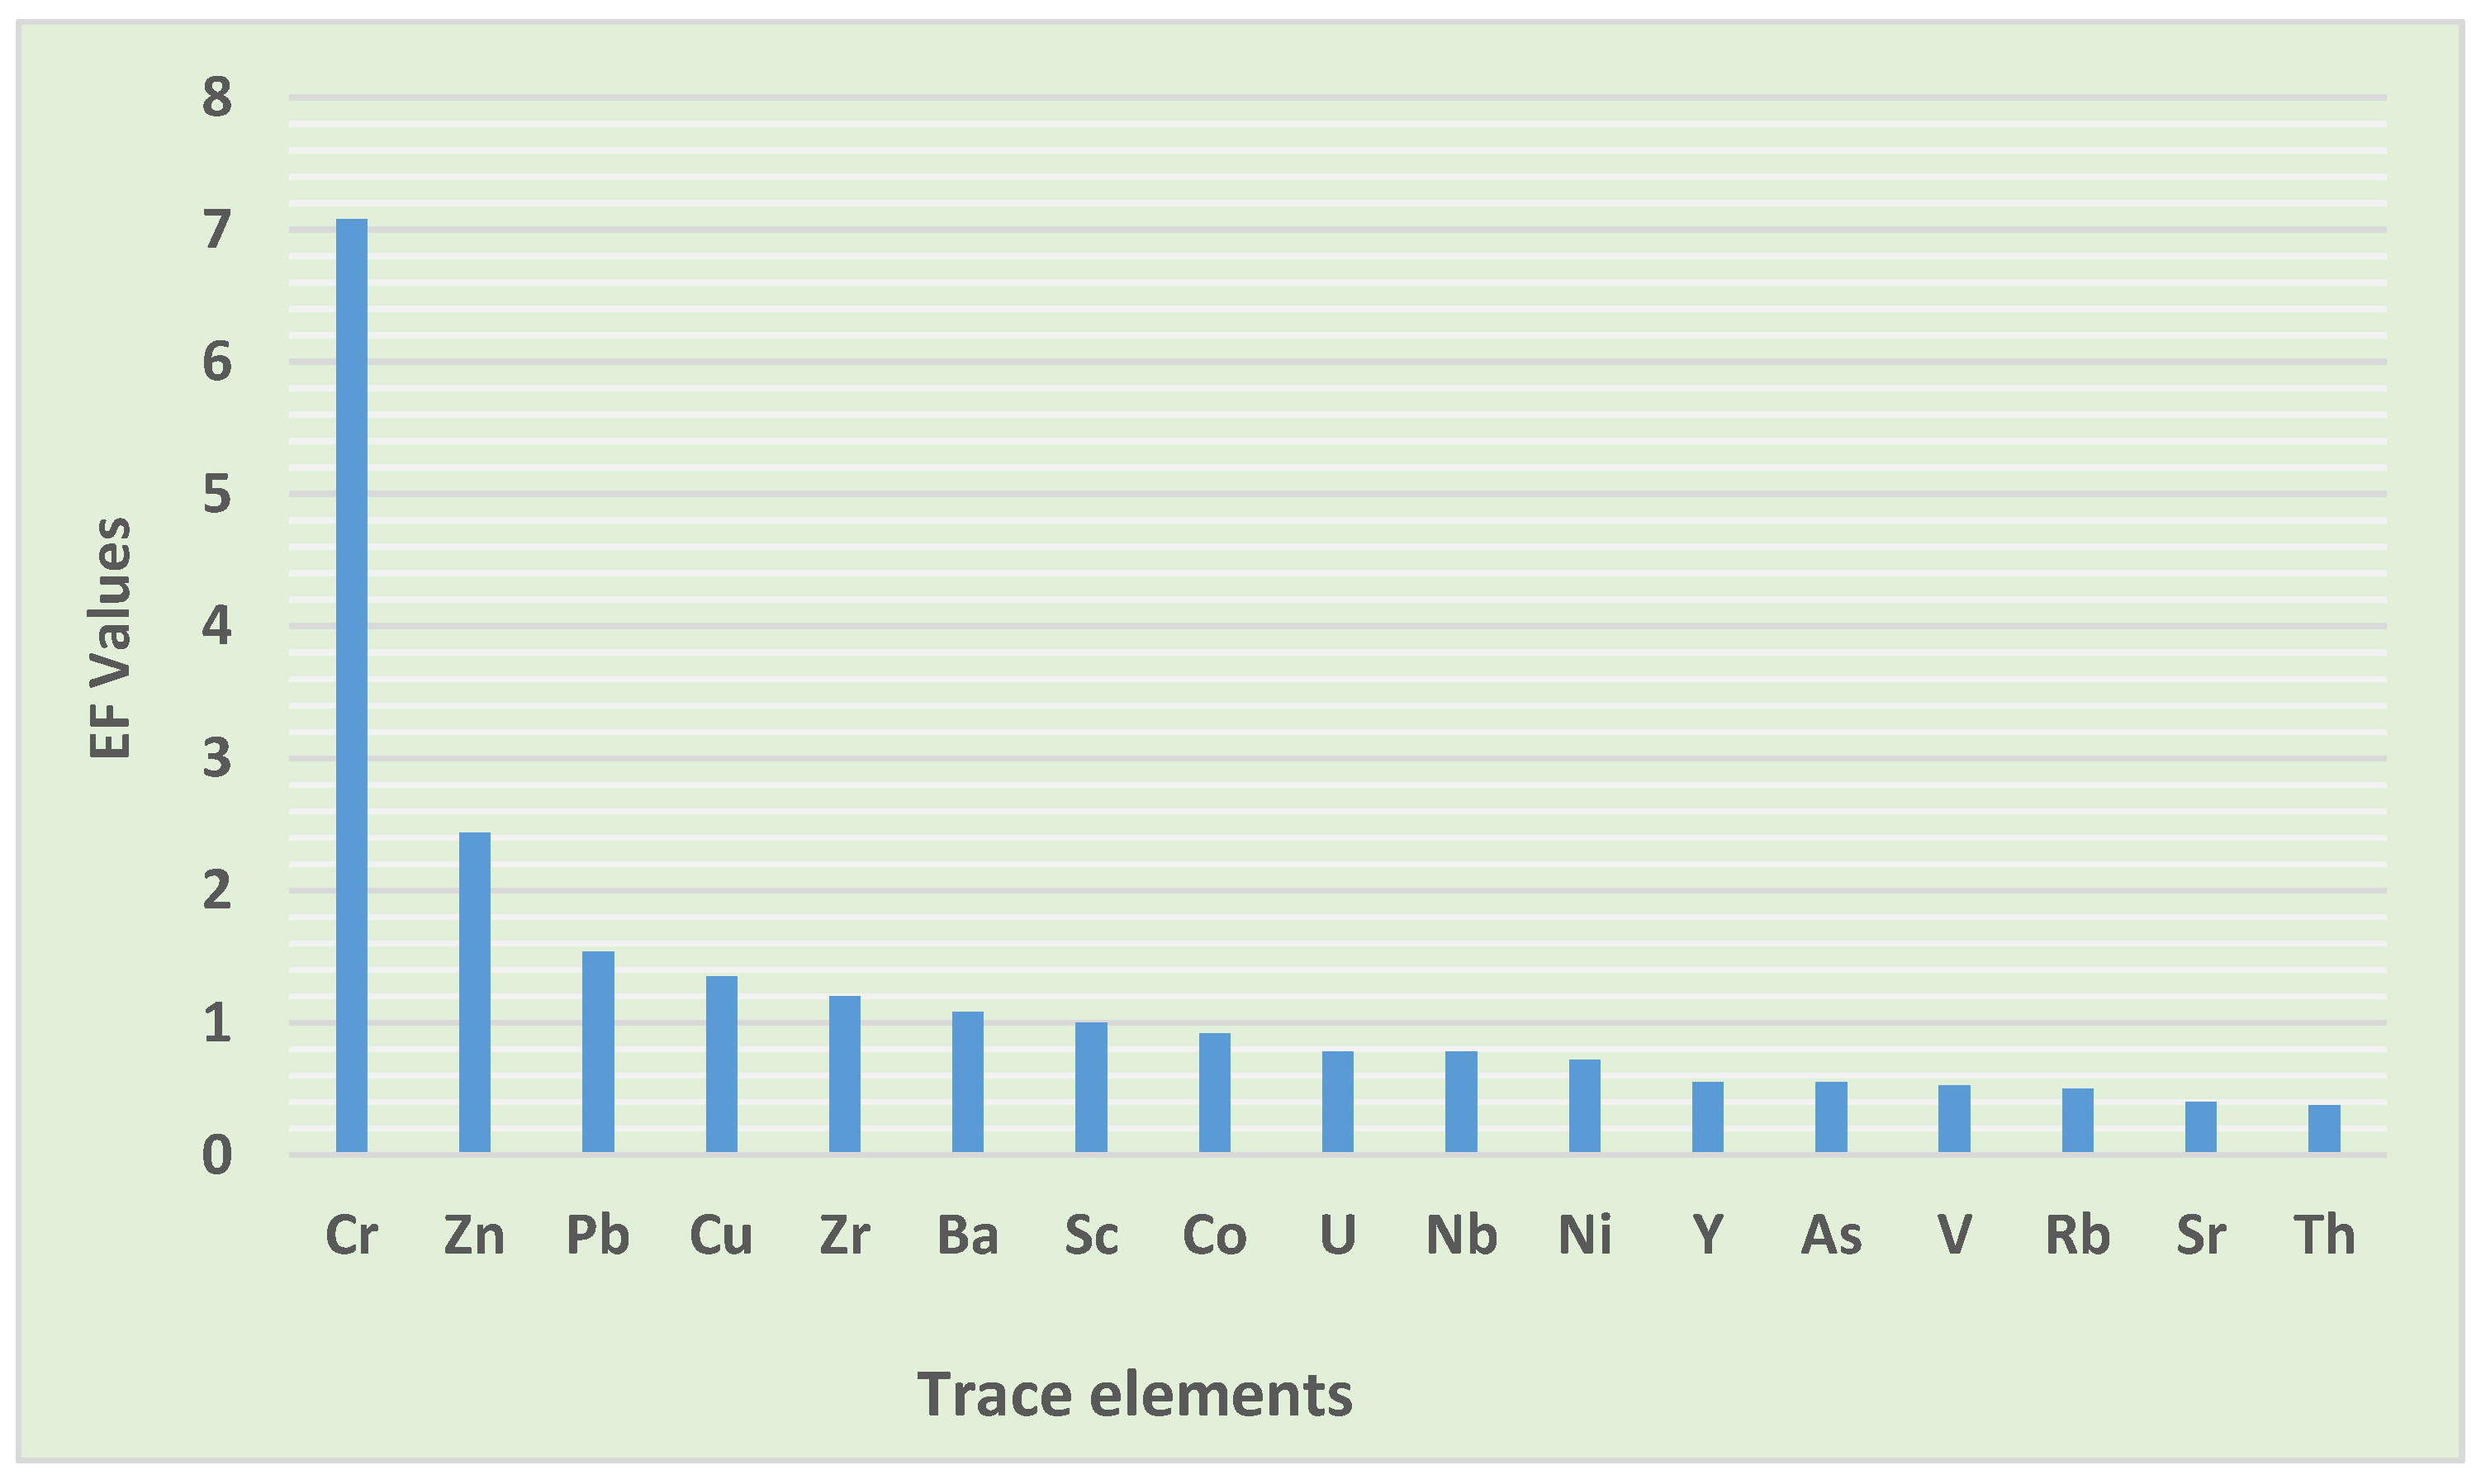
3.3.3. Enrichment Factor (EF)
3.3.4. Pearson Correlation Coefficient Analysis
3.3.5. Statistical Analysis of Trace Elements
3.4. Non-Carcinogenic and Carcinogenic Health Risk Assessments of Trace Elements in Road Dust
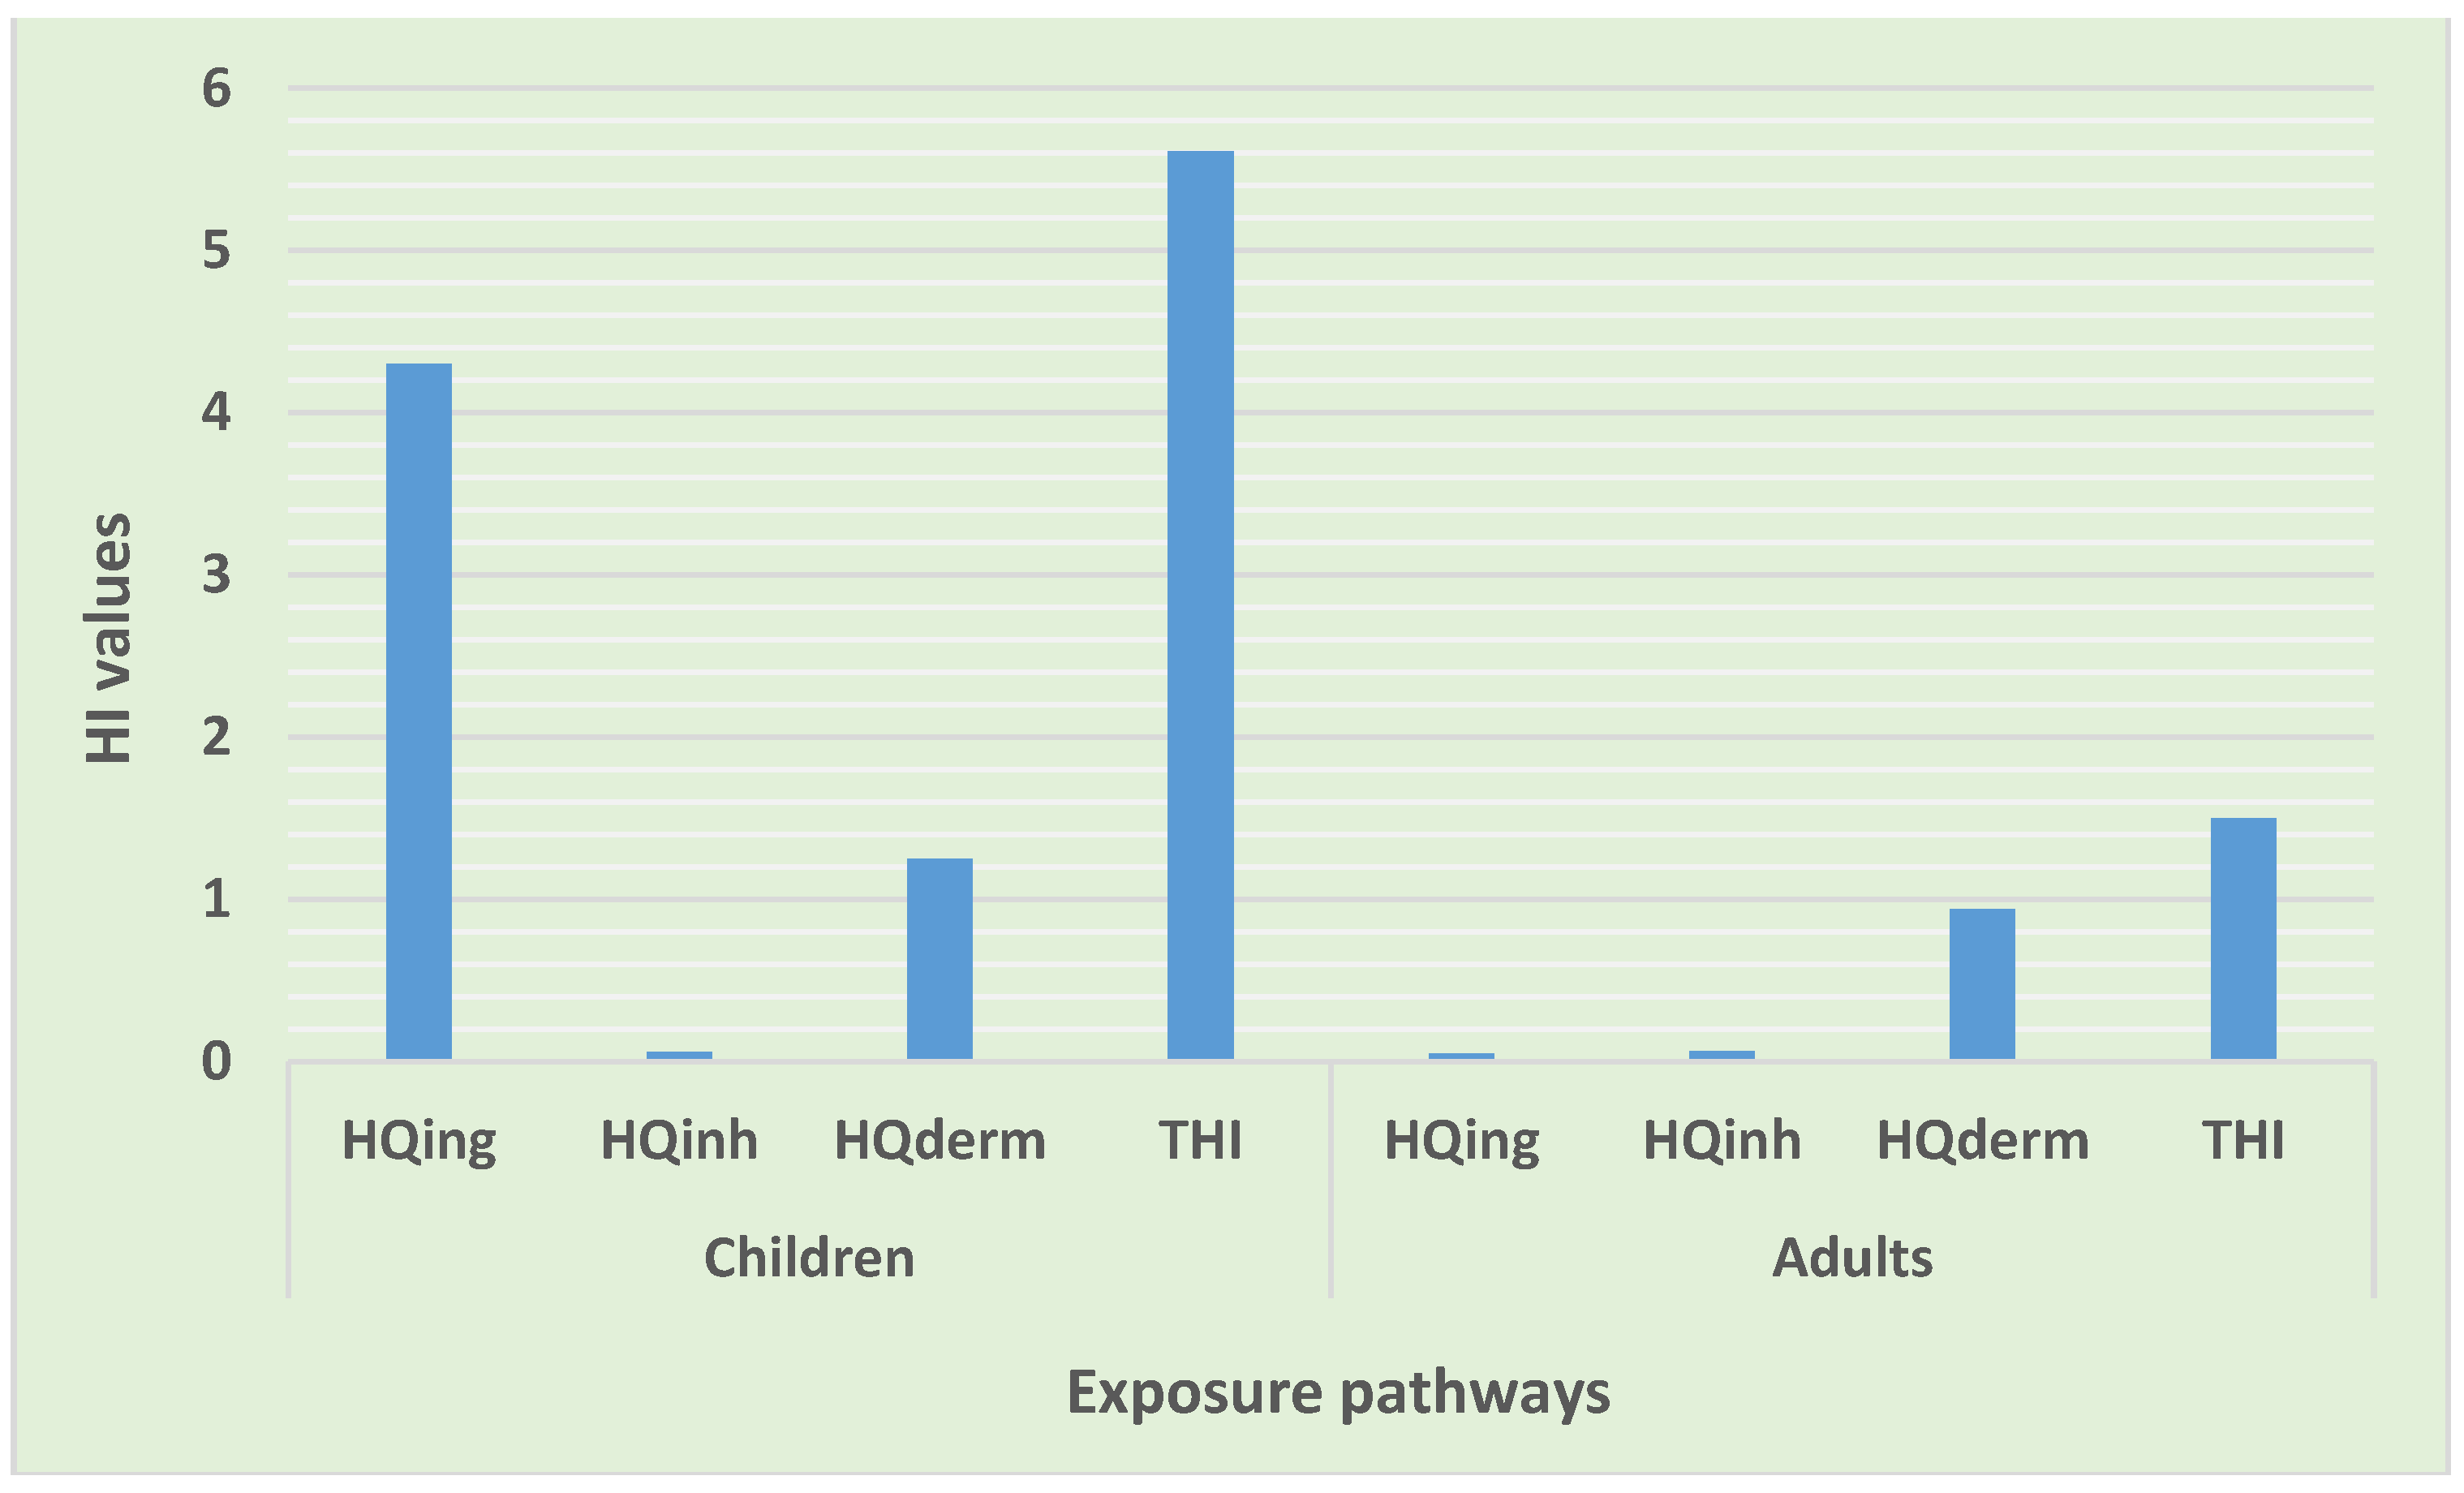
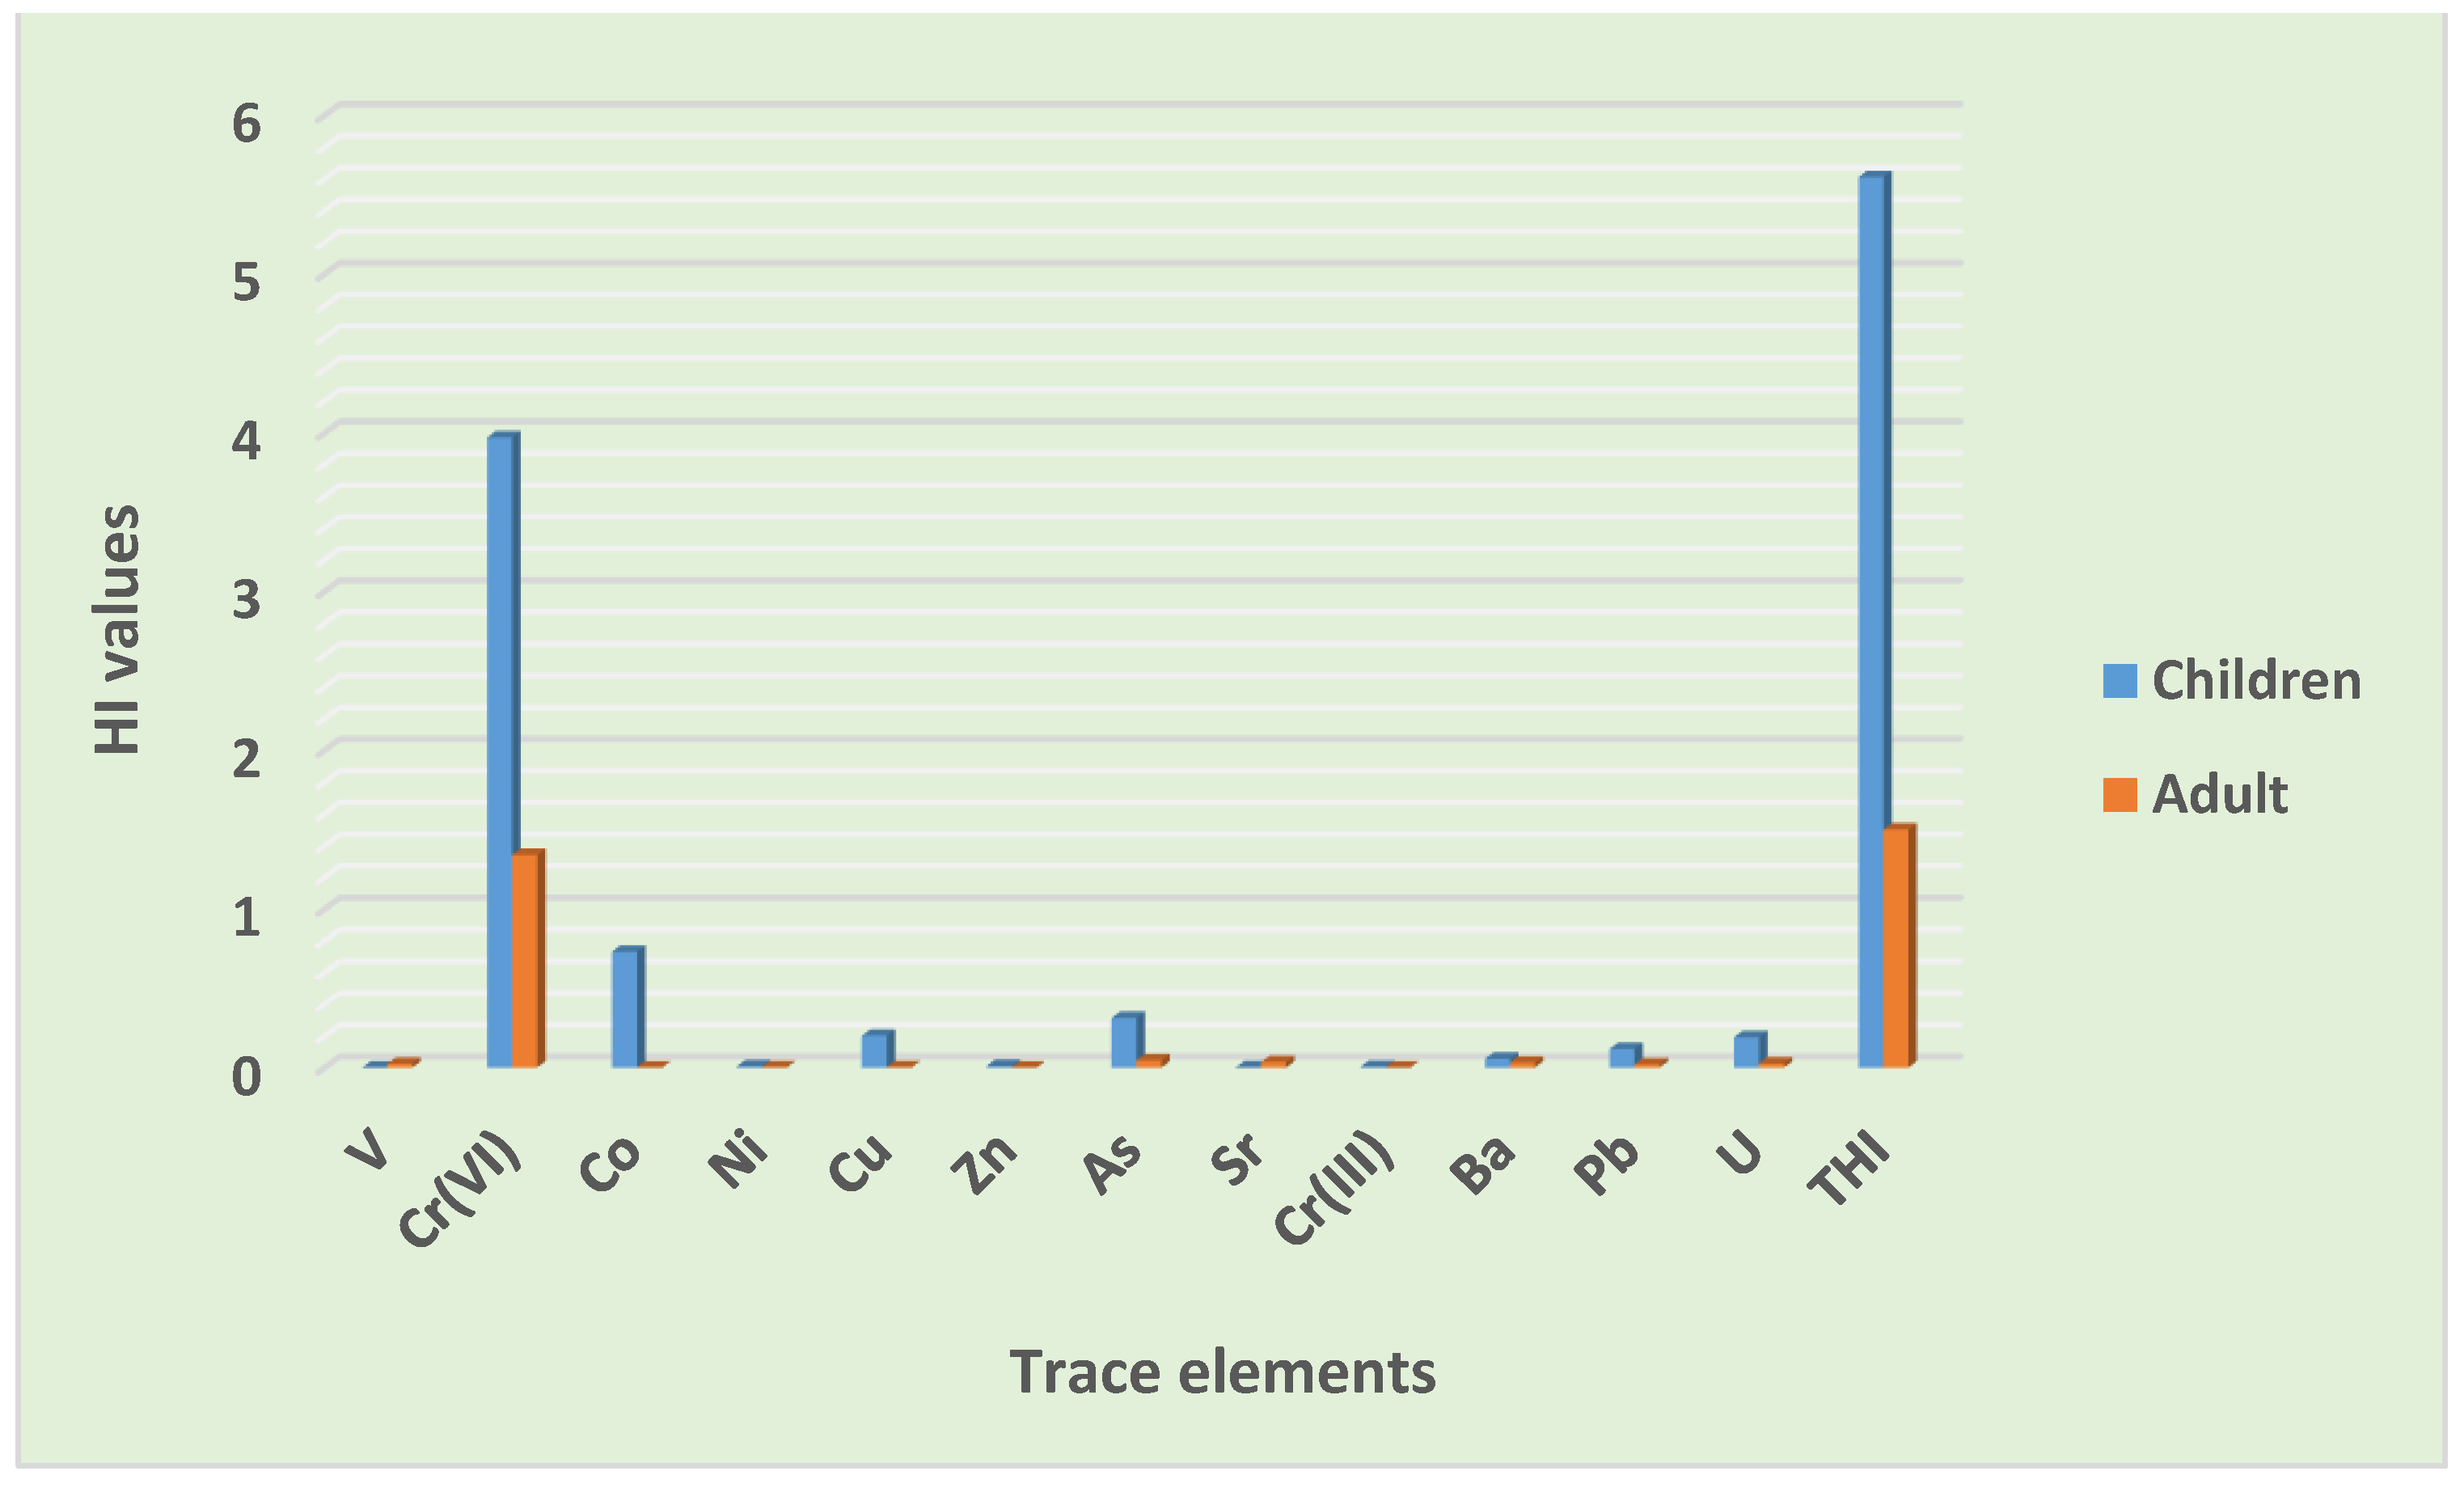
3.4.1. Non-Carcinogenic Risk Assessment
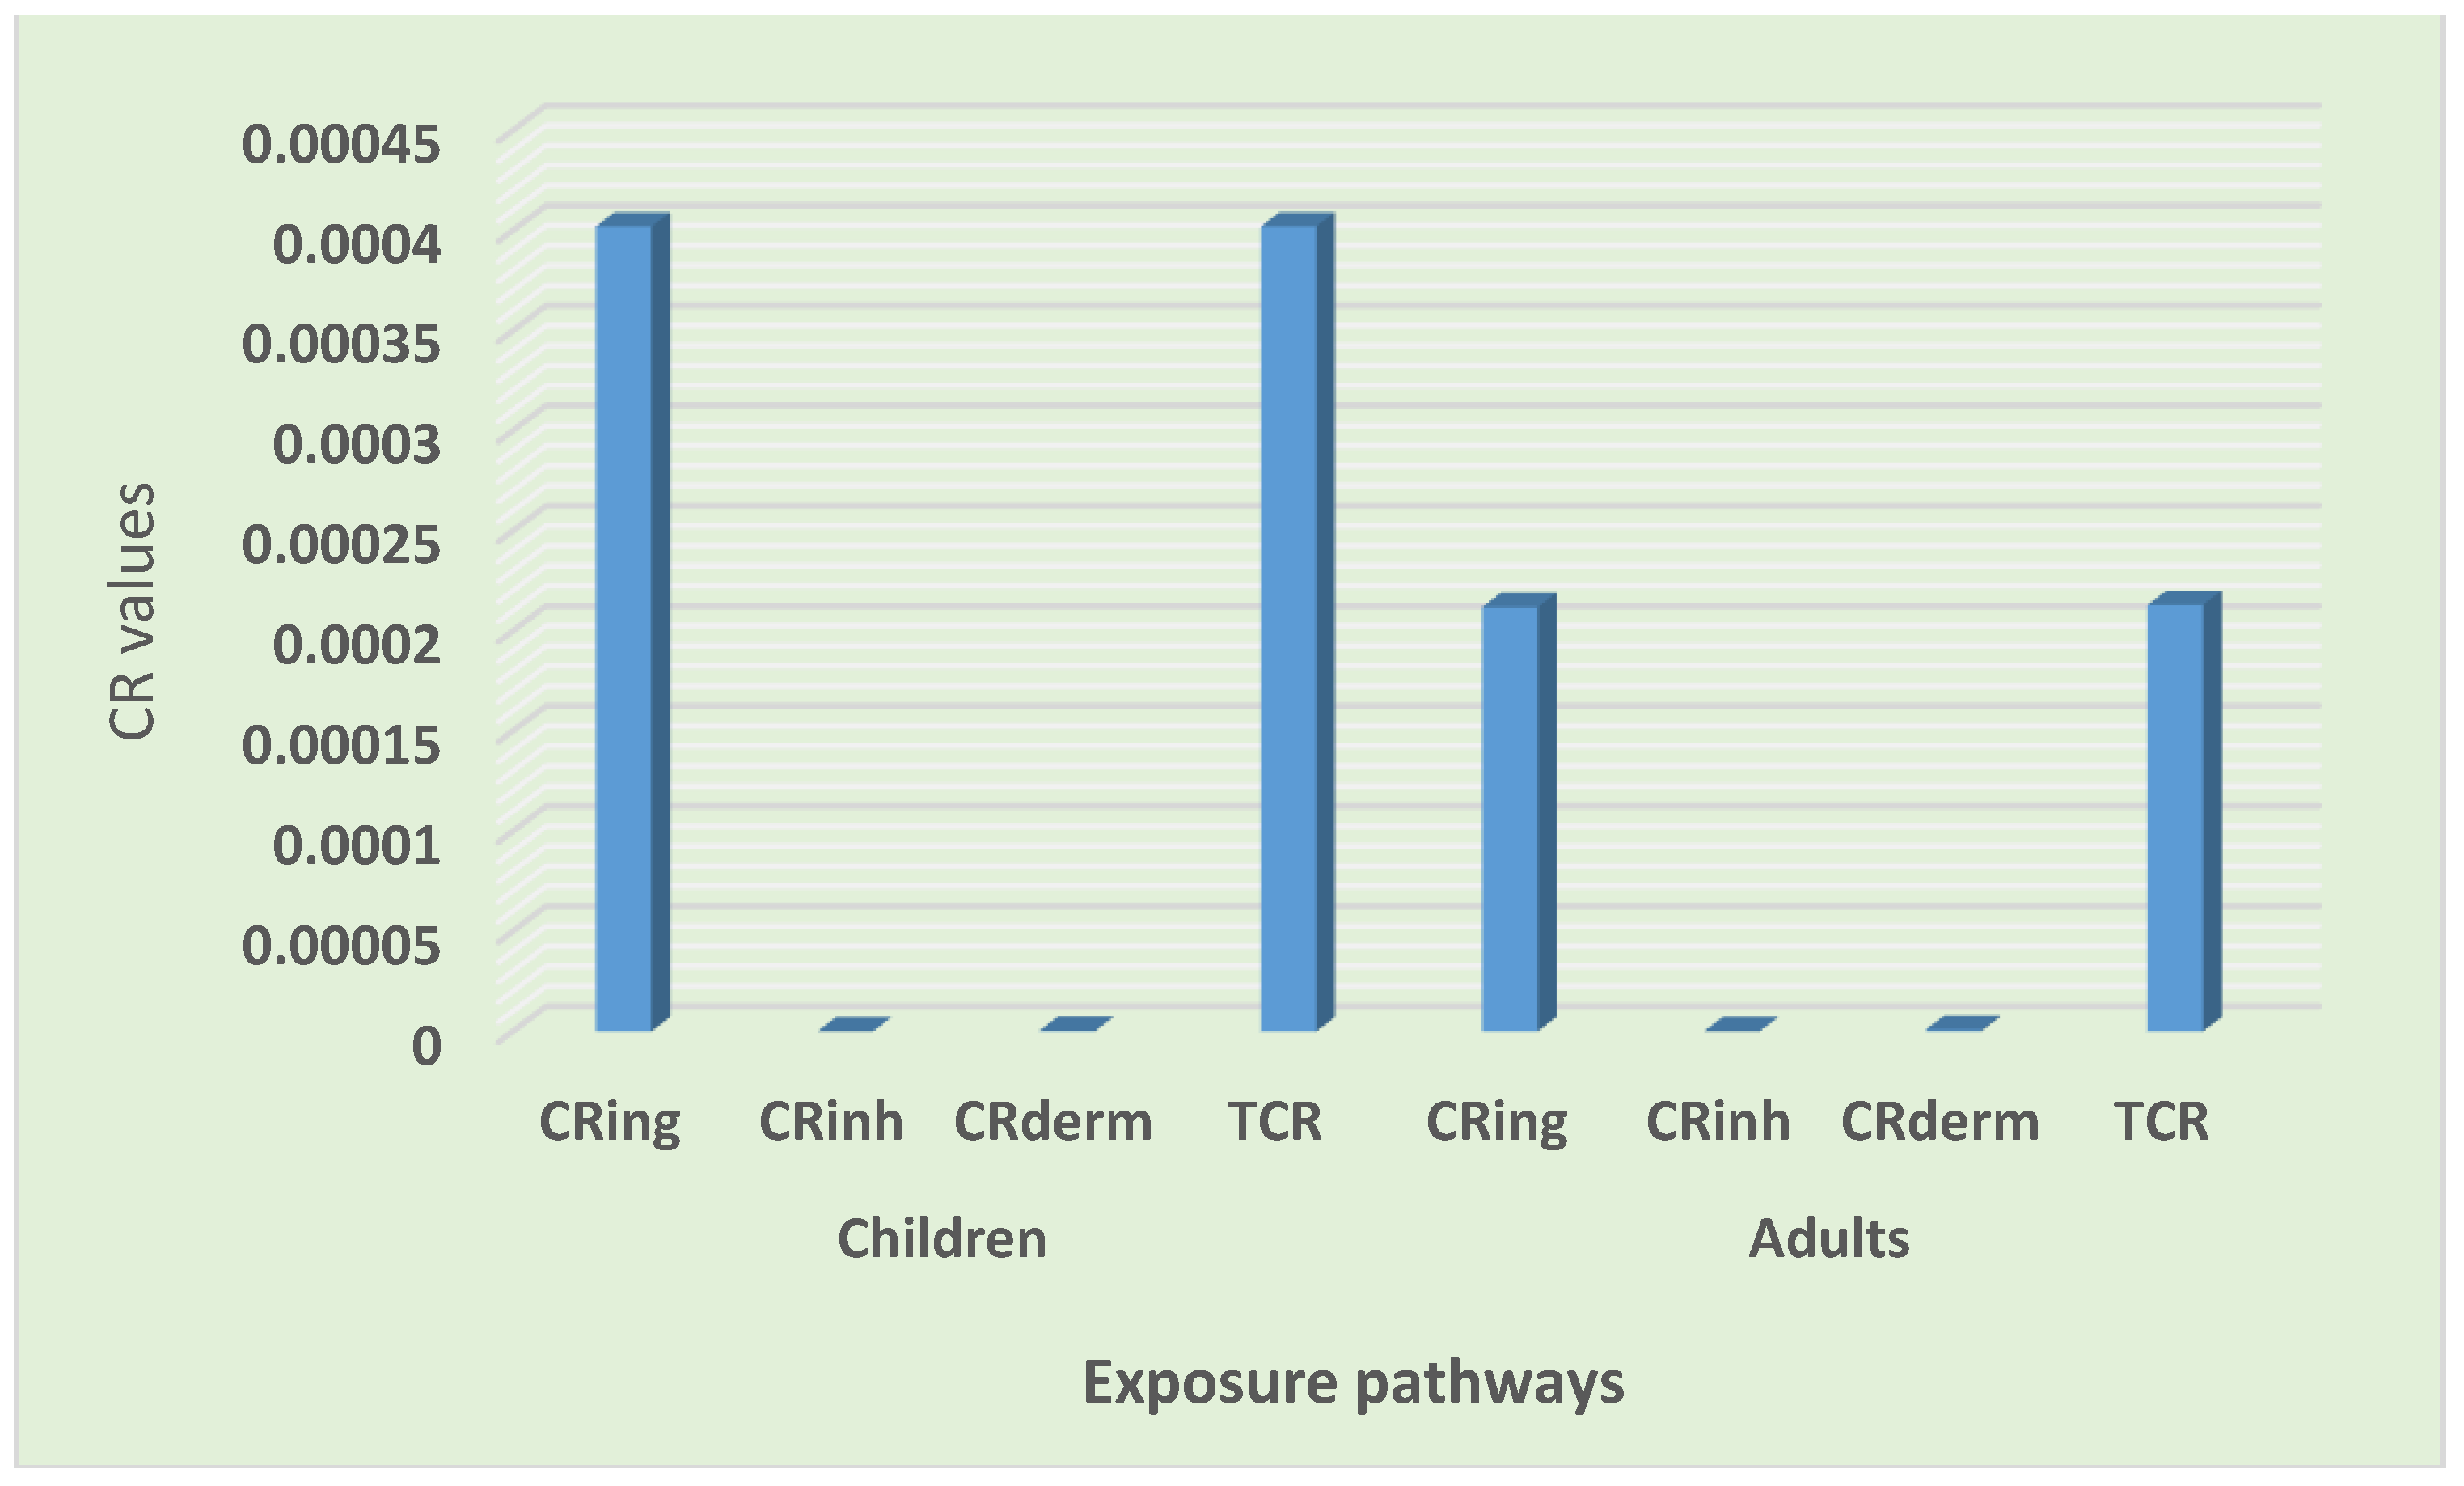
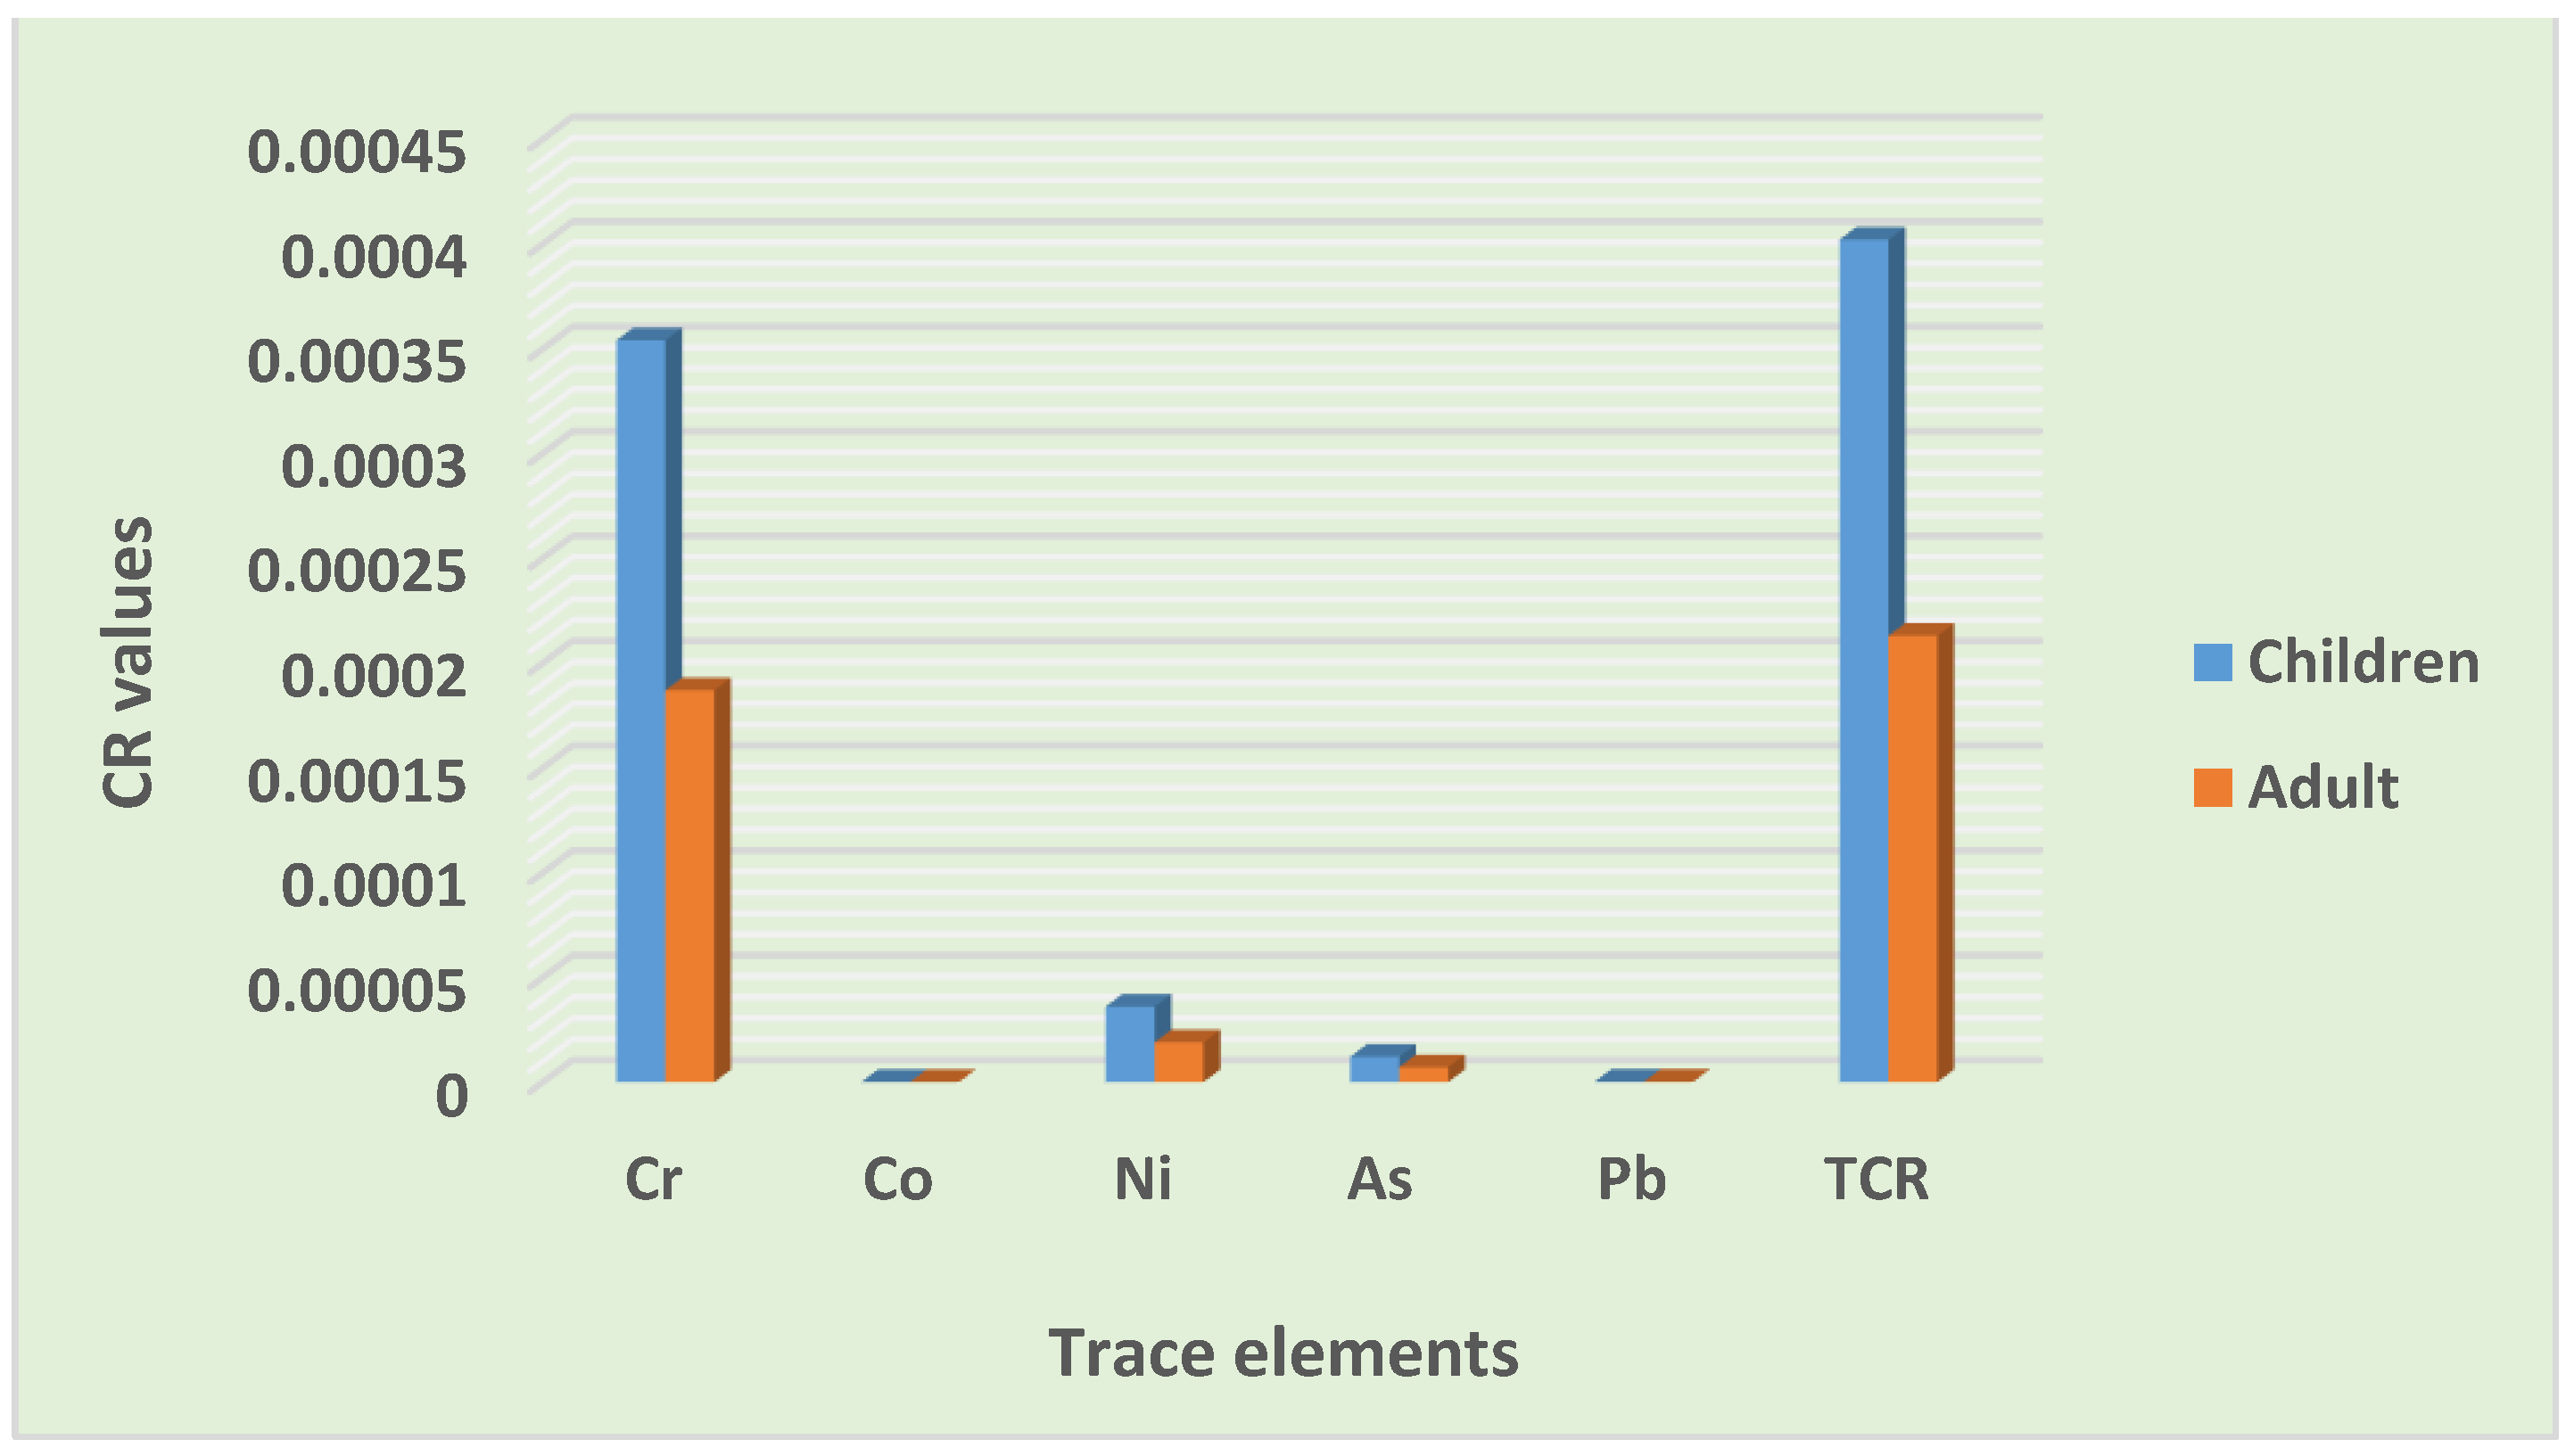
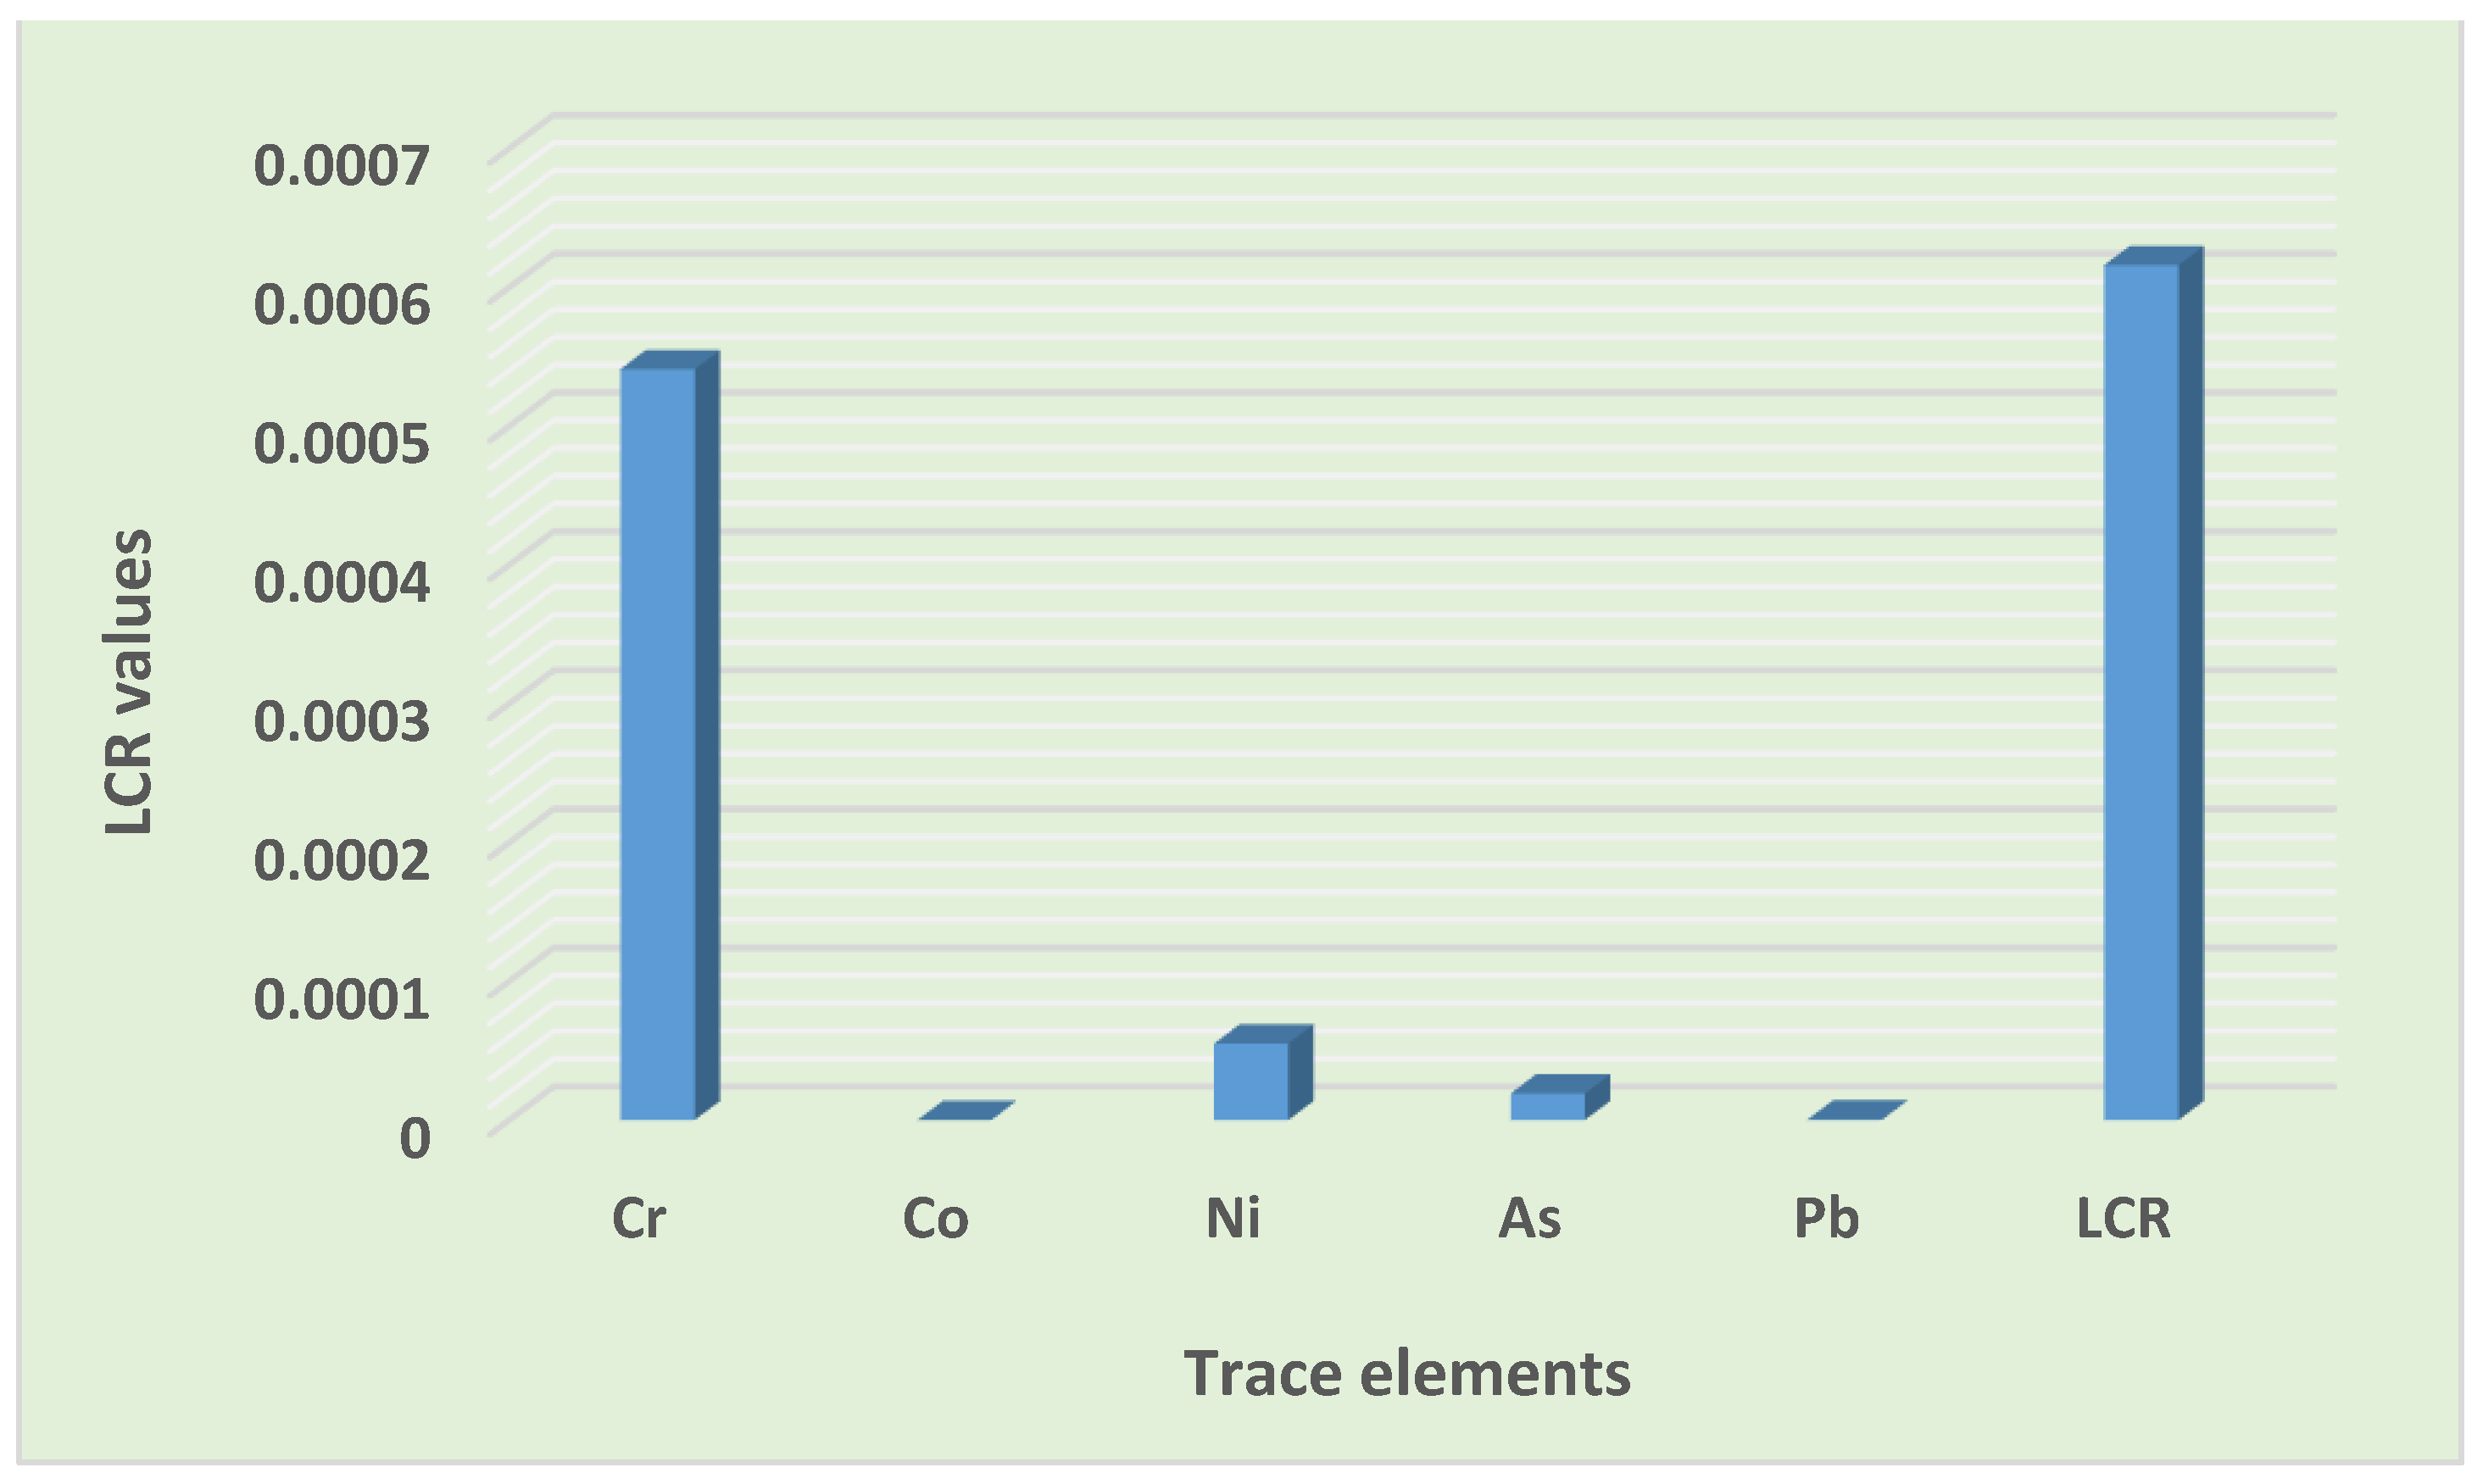
3.4.2. Carcinogenic Risk (CR) Assessment
3.5. Health Implications Associated with Trace Elements Exposure in Road Dust
4. Conclusions
Author Contributions
Funding
Institutional Review Board Statement
Informed Consent Statement
Data Availability Statement
Acknowledgments
Conflicts of Interest
References
- Msimang, Z. A Study of the Negative Impacts of Informal Settlements on the Environment. A Case Study of Jika Joe, Pietermaritzburg. Master’s Thesis, University of KwaZulu-Natal, Berea, Durban, South Africa, 2017. [Google Scholar]
- Weimann, A.; Oni, T. A Systematised Review of the Health Impact of Urban Informal Settlements and Implications for Upgrading Interventions in South Africa, a Rapidly Urbanising Middle-Income Country. Int. J. Environ. Res. Public Health 2019, 16, 3608. [Google Scholar] [CrossRef] [PubMed] [Green Version]
- Menshawya, A.; Alya, S.S.; Salmana, A.M. Sustainable upgrading of informal settlements in the developing world, case study: Ezzbet Abd El Meniem Riyadh, Alexandria, Egypt. Procedia Eng. 2011, 21, 168–177. [Google Scholar] [CrossRef] [Green Version]
- Charlesworth, S.M.; De Miguel, E.; Ordóñez, A. A review of the distribution of particulate trace elements in urban terrestrial environments and its application to considerations of risk. Environ. Geochem. Health 2011, 33, 103–123. [Google Scholar] [CrossRef] [Green Version]
- Odat, O. Calculating Pollution Indices of Heavy Metal along Irbid/Zarqa Highway-Jordan. Int. J. Appl. Sci. Technol. 2013, 3, 72–76. [Google Scholar]
- Yang, J.; Teng, Y.; Song, L.; Zuo, R. Tracing Sources and Contamination Assessments of Heavy Metals in Road and Foliar Dusts in a Typical Mining City, China. PLoS ONE 2016, 11, e0168528. [Google Scholar] [CrossRef] [Green Version]
- Sampson, C. Trace Elements in Christchurch Road Dust. Master’s Thesis, University of Canterbury, Christchurch, New Zealand, 2017. [Google Scholar]
- Cai, K.; Li, C. Street Dust Heavy Metal Pollution Source Apportionment and Sustainable Management in A Typical City—Shijiazhuang, China. Int. J. Environ. Res. Public Health 2019, 16, 2625. [Google Scholar] [CrossRef] [Green Version]
- Qadeera, A.; Saqibb, Z.A.; Ajmalb, Z.; Xinga, C.; Khalila, S.K.; Usman, M.; Huanga, Y.; Bashir, S.; Ahmad, Z.; Ahmede, S.; et al. Concentrations, pollution indices and health risk assessment of heavy metals in road dust from two urbanized cities of Pakistan: Comparing two sampling methods for heavy metals concentration. Sustain. Cities Soc. 2020, 52, 101953. [Google Scholar] [CrossRef]
- Victoria, A.; Cobbina, S.J.; Dampare, S.B.; Duwiejuah, A.B. Heavy Metals Concentration in Road Dust in the Bolgatanga Municipality, Ghana. J. Environ. Pollut. Hum. Health 2014, 2, 74–80. [Google Scholar]
- Ray, R.R. Adverse hematological effects of hexavalent chromium: An overview. Interdiscip. Toxicol. 2016, 9, 55–65. [Google Scholar] [CrossRef] [Green Version]
- Okereafor, U.; Makhatha, M.; Mekuto, L.; Uche-Okereafor, N.; Sebola, T.; Mavumengwana, V. Toxic Metal Implications on Agricultural Soils, Plants, Animals, Aquatic life and Human Health. Int. J. Environ. Res. Public Health 2020, 17, 2204. [Google Scholar] [CrossRef] [Green Version]
- Tissington, K. Legislation, Policy, Programmes and Practice: A Resource Guide to Housing in South Africa 1994–2010. Socio-Economic Rights Institute (SERI), South Africa. 2011. Available online: http:www.urbanlandmark.org.za/downloads/SERI_Housing_Resource_Guide_Feb11.pdf (accessed on 28 March 2022).
- RoadLab. Detailed Design of the Midrand K109 Road Located between K27 and Dale Road, Midrand Area, Gauteng Province. 2014. Available online: https://nalisustainabilitysolutions.co.za (accessed on 3 January 2022).
- Kowalska, J.B.; Mazurek, R.; Gasiorek, M.; Zaleski, T. Pollution indices as useful tools for the comprehensive evaluation of the degree of soil contamination—A review. Environ. Geochem. Health 2018, 40, 2395–2420. [Google Scholar] [CrossRef] [PubMed] [Green Version]
- Timothy, N.; Williams, E.T. Environmental Pollution by Heavy Metal: An Overview. Int. J. Environ. Chem. 2019, 3, 72–82. [Google Scholar] [CrossRef]
- Ma, J.; Singhirunnusorn, W. Distribution and Health Risk Assessment ofHeavy Metals in Surface Dusts of Maha Sarakham Municipality. Procedia Soc. Behav. Sci. 2012, 50, 280–293. [Google Scholar] [CrossRef] [Green Version]
- Addo, M.A.; Darko, E.O.; Gordon, C.; Nyarko, B.J.B.; Gbadago, J.K. Heavy Metal Concentrations in Road Deposited Dust at Ketu-South District, Ghana. Int. J. Sci. Technol. 2012, 2, 28–39. [Google Scholar]
- Taofeek, Y.A.; Tolulope, T.O. Evaluation of some Heavy Metals in Soils along a Major Road in Ogbomoso, South West Nigeria. J. Environ. Earth 2012, 2, 71–79. [Google Scholar]
- Sebaiwa, M.M. Characterization of Dust Fallout around the City of Tshwane (Cot), Gauteng, South Africa. Master’s Thesis, University of South Africa, Pretoria, South Africa, 2016. [Google Scholar]
- Ghanavati, N.; Nazarpour, A.; Watts, M.J. Status, source, ecological and health risk assessment of toxic metals and polycyclic aromatic hydrocarbons (PAHs) in street dust of Abadan, Iran. Catena 2019, 177, 246–259. [Google Scholar] [CrossRef]
- USEPA (United States Environmental Protection Agency). Soil Screening Guidance: Technical Background Document. Office of Soild Waste and Emergency Response. Washington, DC. 1996. Available online: https:www.epa.gov/superfund/superfund-soil-screening-guidance#:~:text=The%20Soil%20Screening%2 (accessed on 23 June 2021).
- Gabarrón, M.; Faz, A.; Martínez-Martínez, S.; Zornoza, R.; Acosta, J.A. Assessment of metals behaviour in industrial soil using sequential extraction, multivariable analysis and a geostatistical approach. J. Geochem. Explor. 2017, 172, 174–183. [Google Scholar] [CrossRef]
- Chonokhuu, S.; Batbold, C.; Chuluunpurev, B.; Battsengel, E.; Dorjsuren, B.; Byambaa, B. Contamination and health risk assessment of heavy metals in soil of major cities in Mongolia. Int. J. Environ. Res. Public Health 2019, 16, 2552. [Google Scholar] [CrossRef] [Green Version]
- Zgłobicki, W.; Telecka, M. Heavy Metals in Urban Street Dust: Health Risk Assessment (Lublin City, E Poland). Appl. Sci. 2021, 11, 4092. [Google Scholar] [CrossRef]
- USEPA (United States Environmental Protection Agency). Supplemental Guidance for Developing Soil Screening Levels for Superfund Sites. Office of Emergency and Remedial Response. Washington DC. 2002. Available online: https:epa.gov/superfund/superfund-soil-screening-guidance (accessed on 25 June 2021).
- Ferreira-Baptista, L.; De Miguel, E. Geochemistry and risk assessment of street dust in Luanda, Angola: A tropical urban environment. Atmos. Environ. 2005, 39, 4501–4512. [Google Scholar] [CrossRef] [Green Version]
- Li, H.; Qian, X.; Hu, W.; Wang, Y.; Gao, H. Chemical speciation and human health risk of trace metals in urban street dusts from a metropolitan city, Nanjing, SE China. Sci. Total Environ. 2013, 456, 212–221. [Google Scholar] [CrossRef] [PubMed]
- Lu, X.; Wu, X.; Wang, Y.; Chen, H.; Gao, P.; Fu, Y. Risk assessment of toxic metals in street dust from a medium-sized industrial city of China. Ecotoxicol. Environ. Saf. 2014, 106, 154–163. [Google Scholar] [CrossRef]
- USEPA (United States Environmental Protection Agency). Role of the Baseline Risk Assessment in Superfund Remedy Selection Decisions. April 22—Memorandum. Office of Solid Waste and Emergency Response. OSWER Directive. 1991. Available online: https://www.epa.gov/risk/role-baseline-risk-assessment-superfund-remedy-selection-descisions (accessed on 22 June 2021).
- Candeias, C.; Vicente, E.; Tomé, M.; Rocha, F.; Ávila, P.; Célia, A. Geochemical, Mineralogical and Morphological Characterisations of Road Dust and Associated Health Risks. Int. J. Environ. Res. Public Health 2020, 17, 1563. [Google Scholar] [CrossRef] [PubMed] [Green Version]
- USEPA (United State Environmental Agency). Summary Review of Health Effects Associated with Elemental and Inorganic Phosphorus Compounds: Health Issue Assessment; Office of Research and Development: USA Environmental Protection Agency: Washington, DC, USA, 1990. Available online: https://nepis.epa/EPA/html/DLwait.htm?url=/Exe/ZPDF.cgi/30001IQN.PDF?Dockey=30001IQN.PDF (accessed on 23 October 2021).
- Li, X.; Liu, B.; Zhang, Y.; Wang, J.; Ullah, H.; Zhou, M.; Peng, L.; He, A.; Zhang, X.; Yan, X.; et al. Spatial Distributions, Sources, Potential Risks of Multi-Trace Metal/Metalloids in Street Dusts from Barbican Downtown Embracing by Xi’an Ancient City Wall (NW, China). Int. J. Environ. Res. Public Health 2019, 16, 2992. [Google Scholar] [CrossRef] [Green Version]
- Clarke, F.W.; Washington, H.S. The Composition of the Earth’s Crust; USA Government Printing Office: Washington, DC, USA, 1924; Volume 127, p. 117.
- Turekian, K.K.; Wedepohl, K.H. Distribution of the elements in some major units of the earth crust. Geol. Soc. Am. Bull. 1961, 72, 175–192. [Google Scholar] [CrossRef]
- Department of Environmental Affairs (DEA). The Framework for the Management of Contaminated Land, South Africa. 2010. Available online: http://sawic.environment.gov.za/documents/562.pdf (accessed on 11 April 2022).
- Kamunda, C.; Mathuthu, M.; Madhuku, M. Health Risk Assessment of Heavy Metals in Soils from Witwatersrand Gold Mining Basin, South Africa. Int. J. Environ. Res. Public Health 2016, 13, 663. [Google Scholar] [CrossRef]
- Chen, H.Y.; Chang, H.L.R. Development of low temperature three-way catalysts for future fuel efficient vehicles. Johns. Matthey Technol. Rev. 2015, 59, 64–67. [Google Scholar] [CrossRef]
- Adamiec, E. Chemical fractionation and mobility of traffic-related elements in road environments. Environ. Geochem. Health 2017, 39, 1457–1468. [Google Scholar] [CrossRef] [Green Version]
- Moryani, H.T.; Kong, S.; Du, J.; Bao, J. Health Risk Assessment of Heavy Metals Accumulated on PM2.5 Fractioned Road Dust from Two Cities of Pakistan. Int. J. Environ. Res. Public Health 2020, 17, 7124. [Google Scholar] [CrossRef]
- Cui, W.; Meng, Q.; Feng, Q.; Zhou, L.; Cui, Y.; Li, W. Occurrence and release of cadmium, chromium and lead from stone coal combustion. Int. J. Coal Sci. Technol. 2019, 6, 586–594. [Google Scholar] [CrossRef] [Green Version]
- Shi, D.; Lu, X.; Wang, Q. Evaluating Health Hazards of Harmful Metals in Roadway Dust Particles Finer than 100 μm. Pol. J. Environ. Stud. 2017, 27, 2729–2737. [Google Scholar]
- Sager, M. Urban Soils and Road Dust—Civilization Effects and Metal Pollution—A Review. Environments 2020, 7, 98. [Google Scholar] [CrossRef]
- Salah, E.; Turki, A.; Noori, S. Heavy Metals Concentration in Urban Soils of Fallujah City, Iraq. J. Environ. Earth Sci. 2013, 3, 100–113. [Google Scholar]
- Rahman, M.S.; Khan, M.D.H.; Jolly, Y.N.; Kabir, J.; Akter, S.; Salam, A. Assessing risk to human health for heavy metal contamination through street dust in the Southeast Asian Megacity: Dhaka, Bangladesh. Sci. Total Environ. 2019, 660, 1610–1622. [Google Scholar] [CrossRef] [PubMed]
- Moskovchenko, D.; Pozhitkov, R.; Ukarkhanova, D. Geochemistry of Street Dust in Tyumen, Russia: Influence of Traffic Load. Environ. Sci. Pollut. Res. Int. 2022, 4, 223. [Google Scholar] [CrossRef]
- Kianpor, M.; Payandeh, K.; Ghanavati, N. Environmental Assessment of Some Heavy Metals Pollution in Street Dust in the Industrial Areas of Ahvaz. Jundishapur J. Health Sci. 2019, 1, 87212. [Google Scholar] [CrossRef] [Green Version]
- Sager, M.; Chon, H.T.; Marton, L. Spatial variation of contaminant elements of roadside dust samples from Budapest (Hungary) and Seoul (Republic of Korea), including Pt, Pd and Ir. Environ. Geochem. Health 2015, 37, 181–193. [Google Scholar] [CrossRef] [PubMed]
- Trujillo-González, J.M.; Torres-Mora, M.A.; Keesstra, S.; Brevik, E.C.; Jiménez-Ballesta, R. Heavy metal accumulation related to population density in road dust samples taken from urban sites under different land uses. Sci. Total Environ. 2016, 553, 636–642. [Google Scholar] [CrossRef]
- Tan, B.; Wang, H.; Wang, X.; Ma, C.; Zhou, J.; Dai, X. Health Risks and Source Analysis of Heavy Metal Pollution from Dust in Tianshui, China. Minerals 2021, 11, 502. [Google Scholar] [CrossRef]
- Dat, N.D.; Nguyen, V.; Vo, T.; Bui, X.; Bui, M.; Nguyen, L.S.P.; Nguyen, X.; Tran, A.T.; Nguyen, T.; Ju, Y.; et al. Contamination, source attribution, and potential health risks of heavy metals in street dust of a metropolitan area in Southern Vietnam. Environ. Sci. Pollut. Res. 2021, 28, 50405–50419. [Google Scholar] [CrossRef]
- Al-Dabbas, M.A.; Mahdi, K.H.; Al-Khafaji, R.; Obayes, K.H. Heavy metals characteristics of settled particles of streets dust from Diwaniyah City-Qadisiyah Governorate-Southern Iraq. IOP Conf. Ser. J. Phys. 2018, 1003, 012023. [Google Scholar] [CrossRef]
- Rybak, J.; Wróbel, M.; Bihałowicz, J.S.; Rogula-Kozłowska, W. Selected Metals in Urban Road Dust: Upper and Lower Silesia Case Study. Atmosphere 2020, 11, 290. [Google Scholar] [CrossRef] [Green Version]
- Taiwo, A.M.; Musa, M.O.; Oguntoke, O.; Afolabi, T.A.; Sadiq, A.Y.; Akanji, M.A.; Shehu, M.R. Spatial distribution, pollution index, receptor modelling and health risk assessment of metals in road dust from Lagos metropolis, Southwestern Nigeria. Environ. Adv. 2020, 2, 100012. [Google Scholar] [CrossRef]
- Khan, M.D.H.; Talukder, A.; Rahman, M.S. Spatial distribution and contamination assessment of heavy metals in urban road dusts from Dhaka city, Bangladesh. IOSR J. Appl. Chem. 2018, 11, 90–99. [Google Scholar]
- Mmolawa, K.B.; Likuku, A.S.; Gaboutloeloe, G.K. Assesment of heavy meatal pollution in soil along a major roadside areas in Botswana. Afr. J. Environ. Sci. Technol. 2011, 5, 186–196. [Google Scholar]
- Hassaan, M.A.; El Nemr, A.; Madkour, F.F. Environmental Assessment of Heavy Metal Pollution and Human Health Risk. Am. J. Water Sci. Eng. 2016, 2, 14–19. [Google Scholar]
- Maeaba, W.; Prasad, S.; Chandra, S. First assessment of metals contamination in road dust and roadside soil of Suva City, Fiji. Arch. Environ. Contamin. Toxicol. 2019, 77, 249–262. [Google Scholar] [CrossRef] [Green Version]
- Weissmannova, H.D.; Mihocova, S.; Chovanec, P.; Pavlovsky, J. Potential ecological risk and human health risk assessment of heavy metal pollution in industrial affected soils by coal mining and metallurgy in Ostrava, Czech Republic. Int. J. Environ. Res. Public Health 2019, 16, 4495. [Google Scholar] [CrossRef] [Green Version]
- Yalala, B.N. Characterization, Bioavailability and Health Risk Assessment of Mercury in Dust Impacted by Gold Mining. Ph.D. Thesis, University of the Witwatersrand, Johannesburg, South Africa, 2015. [Google Scholar]
- Shinggu, D.Y.; Ogugbuaja, V.O.; Toma, I.; Barminas, J.T. Determination of heavy metal pollutants in street dust of Yola, Adamawa State, Nigeria. Afr. J. Pure Appl. Chem. 2009, 4, 17–21. [Google Scholar]
- United State Environmental Protection Agency (USEPA). Assessment. Risk Assessment Guidance for Superfund (Rags), Volume I: Human Health Evaluation Manual (Part E, Supplemental Guidance for Dermal Risk Assessment) Interim. 2009. Available online: https://www.epa.gov/sites/default/files/2015-09/documents/rags_a.pdf (accessed on 10 April 2022).
- United State Environmental Protection Agency (USEPA). Regional Screening Levels (RSLs). 2021. Available online: https://www.epa.gov/risk/regional-screening-levels-rsls-generic-tables (accessed on 10 April 2022).
- United State Environmental Protection Agency (USEPA). Framework for Determining a Mutagenic Mode of Action for Carcinogenicity: Review Draft. 2007. Available online: http://www.epa.gov/osa/mmoaframework/pdfs/MMOA-ERD-FINAL-83007.pdf (accessed on 12 April 2022).
- RAIS-The Risk Assessment Information System. 2016. Available online: https://rais.ornl.gov/tools/tox_profiles.html (accessed on 10 April 2022).
- Jin, Y.; O’Connora, D.; Ok, Y.S.; Tsang, D.C.W.; Liu, A.; Houa, D. Assessment of sources of heavy metals in soil and dust at children’s playgrounds in Beijing using GIS and multivariate statistical analysis. Environ. Int. 2019, 124, 320–328. [Google Scholar] [CrossRef]
- Kravchenko, J.; Darrah, T.H.; Miller, R.K.; Lyerly, H.K.; Vengosh, A. A review of the health impacts of barium from natural and anthropogenic exposure. Environ. Geochem. Health 2014, 36, 797–814. [Google Scholar] [CrossRef] [PubMed]
- Liippo, K.K.; Anttila, S.L.; Taikina-Aho, O.; Ruokonen, E.L.; Toivonen, S.T.; Tuomi, T. Hypersensitivity pneumonitis and exposure to Zirconium silicate in a young ceramic tile worker. Am. Rev. Respir. Dis. 1993, 148, 1089–1092. [Google Scholar] [CrossRef] [PubMed]
- Aremu, M.O. Environment, Health and Nutrition: Global Perspective; Basu, S.K., Datta, B., Eds.; A.P.H. Publishing Inc.: New Delhi, India, 2008; pp. 79–96. [Google Scholar]


| Sample ID. | Description | GPS Coordinates | |
|---|---|---|---|
| Latitude | Longitude | ||
| RD01 | At one of the major roads (Madiba drive) | 25°58′22.1″ S | 28°13′27.1″ E |
| RD02 | At the southward drive, near the park | 25°58′00.3″ S | 28°12′57.6″ E |
| RD03 | At the community taxi rank | 25°58′51.4″ S | 28°13′22.1″ E |
| RD04 | Next to primary school gate | 25°58′50.7″ S | 28°13′30.1″ E |
| RD05 | Within the community shopping centre or mall | 25°58′33.0″ S | 28°13′42.2″ E |
| Elements | LOD | RD01 | RD02 | RD03 | RD04 | RD05 | Min-Max | Mean | ±SD | ASV | SASSV |
|---|---|---|---|---|---|---|---|---|---|---|---|
| As | 1 | 9 | 10 | 4 | 4 | 9 | 4–10 | 7.2 | 2.9 | 13 | 23 |
| Ba | 17 | 563 | 636 | 546 | 729 | 654 | 546–729 | 625.6 | 73.9 | 580 | n.a |
| Co | 3 | 16 | 15 | 17 | 20 | 19 | 15–20 | 17.4 | 2.1 | 19 | 300 |
| Cr | 4 | 493 | 283 | 694 | 1088 | 629 | 283–1088 | 637.4 | 297 | 90 | 6.5 |
| Cu | 4 | 125 | 42 | 45 | 43 | 50 | 42–125 | 61 | 35.9 | 45 | 1100 |
| Nb | 1 | 9 | 8 | 9 | 8 | 9 | 8–9 | 8.6 | 0.5 | 11 | n.a |
| Ni | 4 | 37 | 32 | 53 | 80 | 43 | 32–80 | 49 | 19 | 68 | 620 |
| Pb | 2 | 32 | 17 | 30 | 41 | 34 | 17–41 | 30.8 | 8.8 | 20 | 110 |
| Rb | 2 | 61 | 82 | 59 | 72 | 56 | 56–82 | 66 | 10.8 | 140 | n.a |
| Sc | 3 | 7 | 8 | 4 | 5 | 5 | 4–8 | 5.8 | 1.6 | 13 | n.a |
| Sr | 2 | 156 | 153 | 99 | 81 | 112 | 81–156 | 120.2 | 33.2 | 300 | n.a |
| Th | 3 | 6 | 6 | 5 | 2.9 | 3 | 2.9–6 | 4.58 | 1.5 | 12 | n.a |
| U | 3 | 2.9 | 2.9 | 2.9 | 2.9 | 2.9 | 2.9–2.9 | 2.9 | 0 | 3.7 | n.a |
| V | 5 | 57 | 55 | 76 | 75 | 82 | 55–82 | 69 | 12.2 | 130 | 150 |
| Y | 1 | 15 | 14 | 14 | 14 | 15 | 14–15 | 14.4 | 0.5 | 26 | n.a |
| Zn | 2 | 700 | 131 | 147 | 67 | 114 | 67–700 | 231.8 | 263.4 | 95 | 9200 |
| Zr | 1 | 164 | 167 | 221 | 172 | 227 | 164–227 | 190.2 | 31.1 | 160 | n.a |
| Trace Elements (mg/kg) | City and Country | |||||||||
|---|---|---|---|---|---|---|---|---|---|---|
| Ekurhuleni (South Africa) | Dhaka City (Bangladesh) | Tyumen (Russia) | Viana do Castelo (Portugal) | Barbican Downtown (China) | Luanda (Angola) | Ahvaz (Iran) | Seoul (Korea) | Xian (China) | Villavicencio (Columbia) | |
| As | 7.2 | - | 5.7 | 35 | 11.7 | 5 | 6 | 24.9 | - | - |
| Ba | 625.6 | - | 317.1 | 390 | 748.2 | 351 | - | 570 | - | - |
| Co | 17.4 | - | 39.6 | - | 13.7 | 2.9 | 13 | 17.9 | 34.1 | - |
| Cr | 637.4 | - | 507.9 | 210 | 175.2 | 26 | 57 | 130 | 175.3 | 9.4 |
| Cu | 61 | 59.3 | 57.4 | 260 | 50.9 | 42 | 45 | 351 | 48.9 | 126.3 |
| Nb | 8.6 | - | 6.6 | - | 11.9 | 131 | - | - | - | - |
| Ni | 49 | - | 632.1 | 16 | 21 | 10 | 58 | 62 | 28.3 | 5.3 |
| Pb | 30.8 | 59.6 | 33.9 | 86 | 93.5 | 1.7 | 86 | 214 | 97.6 | 87.5 |
| Rb | 66 | 88.1 | 27.1 | 240 | 44.2 | - | - | - | - | - |
| Sc | 5.8 | - | 10.1 | - | - | 1.3 | - | - | - | - |
| Sr | 120.2 | 289.9 | 147.3 | 190 | 186.5 | 172 | - | - | - | - |
| Th | 4.6 | - | 1.9 | - | - | 1 | - | - | - | - |
| U | 2.9 | - | 1.1 | 3.6 | - | - | - | - | - | - |
| V | 69 | - | 66.4 | 15 | 69.3 | 20 | 184 | 35 | 55.8 | - |
| Y | 14.4 | - | 7.3 | - | 18.6 | - | - | - | - | - |
| Zn | 231.8 | 189 | 160.8 | 1180 | 272 | 317 | 999 | 1476 | 164.9 | 133.3 |
| Zr | 190.2 | 165.6 | 60.7 | 360 | 120.1 | - | - | - | - | - |
| References | Current study | [45] | [46] | [31] | [33] | [27] | [47] | [48] | [42] | [49] |
| Igeo Values of Heavy Metals in Road Samples | ||||
|---|---|---|---|---|
| Elements | Min | Max | Mean | Classification |
| Cr | 0.63 | 2.42 | 1.42 | Moderately contaminated |
| Zn | 0.14 | 1.47 | 0.49 | Uncontaminated to moderately contaminated |
| Pb | 0.17 | 0.41 | 0.31 | Uncontaminated to moderately contaminated |
| Cu | 0.19 | 0.55 | 0.27 | Uncontaminated to moderately contaminated |
| Zr | 0.12 | 0.28 | 0.24 | Uncontaminated to moderately contaminated |
| Ba | 0.19 | 0.24 | 0.21 | Uncontaminated to moderately contaminated |
| Co | 0.16 | 0.21 | 0.2 | Uncontaminated to moderately contaminated |
| U | 0.16 | 0.16 | 0.16 | Uncontaminated to moderately contaminated |
| Nb | 0.14 | 0.16 | 0.16 | Uncontaminated to moderately contaminated |
| Ni | 0.09 | 0.23 | 0.14 | Uncontaminated to moderately contaminated |
| Y | 0.1 | 0.11 | 0.11 | Uncontaminated to moderately contaminated |
| As | 0.06 | 0.15 | 0.11 | Uncontaminated to moderately contaminated |
| V | 0.08 | 0.13 | 0.1 | Uncontaminated to moderately contaminated |
| Sc | 0.06 | 0.12 | 0.09 | Uncontaminated to moderately contaminated |
| Rb | 0.08 | 0.12 | 0.09 | Uncontaminated to moderately contaminated |
| Sr | 0.05 | 0.1 | 0.08 | Uncontaminated to moderately contaminated |
| Th | 0.05 | 0.09 | 0.08 | Uncontaminated to moderately contaminated |
| CFs and PLI Values of Trace Elements in Road Dust Samples | ||||
|---|---|---|---|---|
| Elements | Min | Max | Mean | Classification |
| Cr | 3.14 | 12.08 | 7.08 | Very high contamination |
| Zn | 0.7 | 7.37 | 2.44 | Moderate contamination |
| Pb | 0.85 | 2.05 | 1.54 | Moderate contamination |
| Cu | 0.93 | 2.78 | 1.35 | Moderate contamination |
| Zr | 1.02 | 1.42 | 1.2 | Moderate contamination |
| Ba | 0.94 | 1.26 | 1.08 | Moderate contamination |
| Co | 0.79 | 1.05 | 0.91 | Low contamination |
| U | 0.78 | 0.78 | 0.8 | Low contamination |
| Nb | 0.72 | 0.81 | 0.8 | Low contamination |
| Ni | 0.47 | 1.18 | 0.72 | Low contamination |
| As | 0.31 | 0.77 | 0.55 | Low contamination |
| Y | 0.54 | 0.58 | 0.55 | Low contamination |
| V | 0.42 | 0.63 | 0.53 | Low contamination |
| Rb | 0.4 | 0.58 | 0.47 | Low contamination |
| Sc | 0.31 | 0.61 | 0.45 | Low contamination |
| Sr | 0.27 | 0.52 | 0.4 | Low contamination |
| Th | 0.02 | 0.5 | 0.38 | Low contamination |
| PLI | 0.68 | 72.9 | 5.37 | Very highly polluted |
| Elements | EF Average Mean Values | Enrichment Category |
|---|---|---|
| Cr | 7.08 | Significant enrichment |
| Zn | 2.44 | Moderate enrichment |
| Pb | 1.54 | Minimal enrichment |
| Cu | 1.35 | Minimal enrichment |
| Zr | 1.2 | Minimal enrichment |
| Ba | 1.08 | Minimal enrichment |
| Sc | 1 | Minimal enrichment |
| Co | 0.92 | Minimal enrichment |
| U | 0.78 | Minimal enrichment |
| Nb | 0.78 | Minimal enrichment |
| Ni | 0.72 | Minimal enrichment |
| Y | 0.55 | Minimal enrichment |
| As | 0.55 | Minimal enrichment |
| V | 0.53 | Minimal enrichment |
| Rb | 0.5 | Minimal enrichment |
| Sr | 0.4 | Minimal enrichment |
| Th | 0.38 | Minimal enrichment |
| Elements | Sc | V | Cr | Co | Ni | Cu | Zn | As | Rb | Sr | Y | Zr | Nb | Ba | Pb | Th | U |
|---|---|---|---|---|---|---|---|---|---|---|---|---|---|---|---|---|---|
| Sc | 1 | ||||||||||||||||
| V | −0.91 | 1 | |||||||||||||||
| Cr | −0.72 | 0.67 | 1 | ||||||||||||||
| Co | −0.70 | 0.83 | 0.89 | 1 | |||||||||||||
| Ni | −0.63 | 0.56 | 0.97 | 0.81 | 1 | ||||||||||||
| Cu | 0.37 | −0.49 | −0.27 | −0.34 | −0.37 | 1 | |||||||||||
| Zn | 0.42 | −0.57 | −0.35 | −0.46 | −0.43 | 0.99 | 1 | ||||||||||
| As | 0.78 | −0.55 | −0.82 | −0.55 | −0.86 | 0.36 | 0.37 | 1 | |||||||||
| Rb | 0.63 | −0.58 | −0.20 | −0.32 | 0.01 | −0.33 | −0.28 | 0.16 | 1 | ||||||||
| Sr | 0.88 | −0.85 | −0.90 | −0.85 | −0.89 | 0.59 | 0.65 | 0.85 | 0.24 | 1 | |||||||
| Y | 0.11 | 0.04 | −0.23 | 0.04 | −0.43 | 0.67 | 0.61 | 0.56 | −0.63 | 0.38 | 1 | ||||||
| Zr | −0.75 | 0.81 | 0.14 | 0.36 | 0.02 | −0.40 | −0.42 | −0.24 | −0.70 | −0.47 | 0.16 | 1 | |||||
| Nb | −0.39 | 0.30 | −0.15 | −0.04 | −0.34 | 0.47 | 0.46 | 0.06 | −0.93 | 0.09 | 0.67 | 0.61 | 1 | ||||
| Ba | −0.03 | 0.29 | 0.54 | 0.67 | 0.59 | −0.48 | −0.56 | −0.12 | 0.43 | −0.46 | −0.21 | −0.21 | −0.70 | 1 | |||
| Pb | −0.66 | 0.65 | 0.89 | 0.87 | 0.77 | 0.11 | 0.00 | −0.59 | −0.51 | −0.70 | 0.23 | 0.18 | 0.19 | 0.38 | 1 | ||
| Th | 0.66 | −0.86 | −0.78 | −0.97 | −0.70 | 0.47 | 0.58 | 0.42 | 0.28 | 0.82 | −0.05 | −0.44 | 0.08 | −0.71 | −0.75 | 1 | |
| U | 0.00 | 0.00 | 0.00 | 0.00 | 0.00 | 0.00 | 0.00 | 0.00 | 0.00 | 0.00 | 0.00 | 0.00 | 0.00 | 0.00 | 0.00 | 0.00 | 1 |
| Analysis of Variance in Road Dust | ||||||
|---|---|---|---|---|---|---|
| Source of Variation | SS | df | MS | F | p-Value | F Crit |
| Between Groups | 3,245,171 | 16 | 202,823 | 21 | 5.09 × 10⁻²⁰ | 1.79 |
| Within Groups | 668,540 | 68 | 9832 | |||
| Total | 3,913,712 | 84 | ||||
| Elements | RfD (mg/kg/d) | SF (mg/kg/d) | References | ||||
|---|---|---|---|---|---|---|---|
| RfDing | RfDinh | RfDderm | SFing | SFinh | SFderm | ||
| As | 3.00 × 10⁻⁴ | 3.00 × 10⁻⁴ | 1.20 × 10⁻⁴ | 1.50 × 100 | 1.51 × 101 | 3.66 × 100 | [50,62] |
| Ba | 2.0 × 10⁻¹ | 1.43 × 10⁻⁴ | 4.90 × 10⁻³ | - | - | - | [27,63] |
| Co | 3.0 × 10⁻⁴ | 2.00 × 10⁻² | 5.40 × 10⁻³ | - | 8.40 × 10⁻¹ | - | [23,62,63,64] |
| Cr(VI) | 3.00 × 10⁻³ | 2.86 × 10⁻⁶ | 6.00 × 10⁻⁵ | 5.00 × 1−1 | 4.10 × 10⁻¹ | - | [23,50,62] |
| Cr(III) | 1.5 | - | - | - | - | - | [63] |
| Cu | 4.00 × 10⁻² | 4.00 × 10⁻² | 1.20 × 10⁻² | - | - | - | [23,62,65] |
| Nb | - | - | - | - | - | - | - |
| Ni | 1.1 × 10⁻² | 6.00 × 10⁻⁶ | 1.60 × 10⁻² | 1.70 × 100 | 9.80 × 100 | - | [23,62,63,65] |
| Pb | 3.50 × 10⁻³ | 3.50 × 10⁻³ | 5.25 × 10⁻⁴ | 8.50 × 10⁻³ | 4.20 × 10⁻² | - | [23,62,63,65] |
| Rb | - | - | - | - | - | - | - |
| Sc | - | - | - | - | - | - | - |
| Sr | 6.00 × 10⁻¹ | - | 1.20 × 10⁻¹ | - | - | - | [27,63] |
| Th | - | - | - | - | - | - | - |
| U | 2.0 × 10⁻⁴ | - | 5.10 × 10⁻⁴ | - | - | - | [27,63] |
| V | 5.0 × 10⁻³ | 7.00 × 10⁻³ | 7.00 × 10⁻³ | - | - | - | [50,62,63] |
| Y | - | - | - | - | - | - | - |
| Zn | 3.00 × 10⁻¹ | 3.00 × 10⁻¹ | 6.00 × 10⁻² | - | - | - | [23,63,65] |
| Zr | - | - | - | - | - | - | - |
| Pathways | Average Daily Dose (ADD) for Trace Elements in Road Dust (mg/kg/day) | Total ADD | |||||||||||||||||
|---|---|---|---|---|---|---|---|---|---|---|---|---|---|---|---|---|---|---|---|
| Sc | V | CrVI | CrIII | Co | Ni | Cu | Zn | As | Rb | Sr | Y | Zr | Nb | Ba | Pb | Th | U | ||
| Children | |||||||||||||||||||
| ADDing | 7.43 × 10⁻⁵ | 8.80 × 10⁻⁴ | 8.10 × 10⁻³ | 8.10 × 10⁻³ | 2.20 × 10⁻⁴ | 6.30 × 10⁻⁴ | 7.80 × 10⁻⁴ | 2.90 × 10⁻³ | 9.20 × 10⁻⁵ | 8.43 × 10⁻⁴ | 1.53 × 10⁻³ | 1.84 × 10⁻⁴ | 2.43 × 10⁻³ | 1.11 × 10⁻⁴ | 8.00 × 10⁻³ | 3.90 × 10⁻⁴ | 5.85 × 10⁻⁵ | 3.70 × 10⁻⁵ | 3.54 × 10⁻² |
| ADDinh | 1.40 × 10⁻⁹ | 1.70 × 10⁻⁸ | 1.54 × 10⁻⁷ | 1.54 × 10⁻⁷ | 4.21 × 10⁻⁹ | 1.20 × 10⁻⁸ | 1.50 × 10⁻⁸ | 5.61 × 10⁻⁸ | 1.74 × 10⁻⁹ | 1.60 × 10⁻⁸ | 2.91 × 10⁻⁸ | 3.50 × 10⁻⁹ | 4.60 × 10⁻⁸ | 2.08 × 10⁻⁹ | 1.51 × 10⁻⁷ | 7.46 × 10⁻⁹ | 1.10 × 10⁻⁹ | 7.02 × 10⁻¹⁰ | 6.72 × 10⁻⁷ |
| ADDderm | 6.67 × 10⁻⁹ | 7.94 × 10⁻⁶ | 7.33 × 10⁻⁵ | 7.33 × 10⁻⁵ | 2.00 × 10⁻⁶ | 5.64 × 10⁻⁶ | 7.02 × 10⁻⁶ | 2.67 × 10⁻⁵ | 8.30 × 10⁻⁷ | 7.59 × 10⁻⁶ | 1.40 × 10⁻⁵ | 1.66 × 10⁻⁶ | 2.20 × 10⁻⁶ | 9.90 × 10⁻⁷ | 7.20 × 10⁻⁵ | 3.54 × 10⁻⁶ | 5.27 × 10⁻⁷ | 3.34 × 10⁻⁷ | 3.00 × 10⁻⁴ |
| ADD | 7.43 × 10⁻⁵ | 8.88 × 10⁻⁴ | 8.17 × 10⁻³ | 8.17 × 10⁻³ | 2.22 × 10⁻⁴ | 6.36 × 10⁻⁴ | 7.87 × 10⁻⁴ | 2.93 × 10⁻³ | 9.28 × 10⁻⁵ | 8.51 × 10⁻⁴ | 1.54 × 10⁻³ | 1.86 × 10⁻⁴ | 2.43 × 10⁻³ | 1.12 × 10⁻⁴ | 8.07 × 10⁻³ | 3.94 × 10⁻⁴ | 5.90 × 10⁻⁵ | 3.73 × 10⁻⁵ | 3.57 × 10⁻² |
| Adults | |||||||||||||||||||
| ADDing | 9.94 × 10⁻⁶ | 1.20 × 10⁻⁴ | 1.10 × 10⁻³ | 1.10 × 10⁻³ | 2.98 × 10⁻⁵ | 8.40 × 10⁻⁵ | 1.00 × 10⁻⁴ | 4.00 × 10⁻⁴ | 1.23 × 10⁻⁵ | 1.13 × 10⁻⁴ | 2.06 × 10⁻⁴ | 2.47 × 10⁻⁵ | 3.26 × 10⁻⁴ | 1.47 × 10⁻⁵ | 1.07 × 10⁻³ | 5.28 × 10⁻⁵ | 7.86 × 10⁻⁶ | 4.97 × 10⁻⁶ | 4.78 × 10⁻³ |
| ADDinh | 1.50 × 10⁻⁹ | 1.80 × 10⁻⁸ | 1.66 × 10⁻⁷ | 1.66 × 10⁻⁷ | 4.52 × 10⁻⁹ | 1.30 × 10⁻⁸ | 1.60 × 10⁻⁸ | 6.02 × 10⁻⁸ | 1.90 × 10⁻⁹ | 1.71 × 10⁻⁸ | 3.12 × 10⁻⁸ | 3.74 × 10⁻⁹ | 4.94 × 10⁻⁸ | 2.23 × 10⁻⁹ | 1.62 × 10⁻⁷ | 8.00 × 10⁻⁹ | 1.20 × 10⁻⁹ | 7.54 × 10⁻¹⁰ | 7.23 × 10⁻⁷ |
| ADDderm | 4.97 × 10⁻⁷ | 5.92 × 10⁻⁶ | 5.50 × 10⁻⁵ | 5.50 × 10⁻⁵ | 1.49 × 10⁻⁶ | 4.20 × 10⁻⁶ | 5.23 × 10⁻⁶ | 1.99 × 10⁻⁵ | 6.17 × 10⁻⁷ | 5.66 × 10⁻⁶ | 1.03 × 10⁻⁵ | 1.23 × 10⁻⁶ | 1.63 × 10⁻⁵ | 7.40 × 10⁻⁷ | 5.40 × 10⁻⁵ | 2.64 × 10⁻⁶ | 3.93 × 10⁻⁷ | 2.49 × 10⁻⁷ | 2.39 × 10⁻⁴ |
| ADD | 1.04 × 10⁻⁵ | 1.26 × 10⁻⁴ | 1.16 × 10⁻³ | 1.16 × 10⁻³ | 3.13 × 10⁻⁵ | 8.82 × 10⁻⁵ | 1.05 × 10⁻⁴ | 4.20 × 10⁻⁴ | 1.29 × 10⁻⁵ | 1.19 × 10⁻⁴ | 2.16 × 10⁻⁴ | 2.59 × 10⁻⁵ | 3.42 × 10⁻⁴ | 1.54 × 10⁻⁵ | 1.12 × 10⁻³ | 5.54 × 10⁻⁵ | 8.25 × 10⁻⁶ | 5.22 × 10⁻⁶ | 5.02 × 10⁻³ |
| Pathways | Non−cancer risk values for trace elements in road dust (mg/kg/day) | Total HI | |||||||||||||||||
| Children | |||||||||||||||||||
| HQing | - | 1.80 × 10⁻¹ | 2.70 × 100 | 5.40 × 10⁻³ | 7.30 × 10⁻¹ | 6.00 × 10⁻³ | 1.95 × 10⁻² | 9.67 × 10⁻³ | 3.06 × 10⁻¹ | - | 2.55 × 10⁻³ | - | - | - | 4.00 × 10⁻² | 1.11 × 10⁻¹ | - | 1.90 × 10⁻¹ | 4.30 × 100 |
| HQinh | - | 2.43 × 10⁻⁶ | 5.38 × 10⁻² | - | 2.10 × 10⁻⁷ | 2.00 × 10⁻³ | 3.75 × 10⁻⁷ | 1.87 × 10⁻⁷ | 5.80 × 10⁻⁶ | - | - | - | - | - | 1.05 × 10⁻³ | 2.13 × 10⁻⁶ | - | - | 5.69 × 10⁻² |
| HQderm | - | 1.13 × 10⁻³ | 1.22 × 100 | - | 3.70 × 10⁻⁴ | 3.52 × 10⁻⁴ | 5.85 × 10⁻⁴ | 4.45 × 10⁻⁴ | 6.92 × 10⁻³ | - | - | - | - | - | 1.47 × 10⁻² | 6.74 × 10⁻³ | - | 6.55 × 10⁻⁴ | 1.25 × 100 |
| HI | - | 1.81 × 10⁻¹ | 3.97 × 100 | 5.40 × 10⁻³ | 7.30 × 10⁻¹ | 8.35 × 10⁻³ | 2.01 × 10⁻² | 1.01 × 10⁻² | 3.13 × 10⁻¹ | - | 2.55 × 10⁻³ | - | - | - | 5.58 × 10⁻² | 1.18 × 10⁻¹ | - | 1.91 × 10⁻¹ | 5.61 × 100 |
| Adults | |||||||||||||||||||
| HQing | - | 2.40 × 10⁻² | 3.67 × 10⁻¹ | 7.30 × 10⁻⁴ | 1.49 × 10⁻³ | 8.00 × 10⁻⁴ | 2.50 × 10⁻³ | 1.33 × 10⁻³ | 4.10 × 10⁻² | - | 3.43 × 10⁻³ | - | - | - | 2.00 × 10⁻² | 1.51 × 10⁻² | - | 2.50 × 10⁻² | 5.02 × 10⁻¹ |
| HQinh | - | 2.57 × 10⁻⁶ | 5.80 × 10⁻² | - | 2.26 × 10⁻⁷ | 2.17 × 10⁻³ | 4.00 × 10⁻⁷ | 2.01 × 10⁻⁷ | 6.33 × 10⁻⁶ | - | − | - | - | - | 1.13 × 10⁻³ | 2.28 × 10⁻⁶ | - | - | 6.13 × 10⁻² |
| HQderm | - | 8.46 × 10⁻⁴ | 9.17 × 10⁻¹ | - | 2.76 × 10⁻⁴ | 2.62 × 10⁻⁴ | 4.36 × 10⁻⁴ | 3.32 × 10⁻⁴ | 5.14 × 10⁻³ | - | 8.58 × 10⁻⁵ | - | - | - | 1.10 × 10⁻² | 5.03 × 10⁻³ | - | 4.88 × 10⁻⁴ | 9.41 × 10⁻¹ |
| HI | - | 2.48 × 10⁻² | 1.34 × 100 | 7.30 × 10⁻⁴ | 1.77 × 10⁻³ | 3.23 × 10⁻³ | 2.94 × 10⁻³ | 1.66 × 10⁻³ | 4.61 × 10⁻² | - | 3.52 × 10⁻³ | - | - | - | 3.21 × 10⁻² | 2.01 × 10⁻² | - | 2.55 × 10⁻² | 1.50 × 100 |
| Pathways | Cancer Average Daily Dose (ADD) for Trace Elements in Road Dust (mg/kg/day) | Total ADD | |||||||||||||||||
|---|---|---|---|---|---|---|---|---|---|---|---|---|---|---|---|---|---|---|---|
| Sc | V | CrVI | CrIII | Co | Ni | Cu | Zn | As | Rb | Sr | Y | Zr | Nb | Ba | Pb | Th | U | ||
| Children | |||||||||||||||||||
| ADDing | 7.43 × 10⁻⁵ | 8.80 × 10⁻⁴ | 8.10 × 10⁻³ | 8.10 × 10⁻³ | 2.20 × 10⁻⁴ | 6.30 × 10⁻⁴ | 7.80 × 10⁻⁴ | 2.90 × 10⁻³ | 9.20 × 10⁻⁵ | 8.43 × 10⁻⁴ | 1.53 × 10⁻³ | 1.84 × 10⁻⁴ | 2.43 × 10⁻³ | 1.11 × 10⁻⁴ | 8.00 × 10⁻³ | 3.90 × 10⁻⁴ | 5.85 × 10⁻⁵ | 3.70 × 10⁻⁵ | 3.54 × 10⁻² |
| ADDinh | 1.40 × 10⁻⁹ | 1.70 × 10⁻⁸ | 1.54 × 10⁻⁷ | 1.54 × 10⁻⁷ | 4.21 × 10⁻⁹ | 1.20 × 10⁻⁸ | 1.50 × 10⁻⁸ | 5.61 × 10⁻⁸ | 1.74 × 10⁻⁹ | 1.60 × 10⁻⁸ | 2.91 × 10⁻⁸ | 3.50 × 10⁻⁹ | 4.60 × 10⁻⁸ | 2.09 × 10⁻⁹ | 1.51 × 10⁻⁷ | 7.46 × 10⁻⁹ | 1.10 × 10⁻⁹ | 7.02 × 10⁻¹⁰ | 6.72 × 10⁻⁷ |
| ADDderm | 6.67 × 10⁻⁹ | 7.94 × 10⁻⁶ | 7.33 × 10⁻⁵ | 7.33 × 10⁻⁵ | 2.00 × 10⁻⁶ | 5.64 × 10⁻⁶ | 7.02 × 10⁻⁶ | 2.67 × 10⁻⁵ | 8.30 × 10⁻⁷ | 7.59 × 10⁻⁶ | 1.40 × 10⁻⁵ | 1.66 × 10⁻⁶ | 2.20 × 10⁻⁶ | 9.90 × 10⁻⁷ | 7.20 × 10⁻⁵ | 3.54 × 10⁻⁶ | 5.27 × 10⁻⁷ | 3.34 × 10⁻⁷ | 3.00 × 10⁻⁴ |
| Total | 7.43 × 10⁻⁵ | 8.88 × 10⁻⁴ | 8.17 × 10⁻³ | 8.17 × 10⁻³ | 2.22 × 10⁻⁴ | 6.36 × 10⁻⁴ | 7.87 × 10⁻⁴ | 2.93 × 10⁻³ | 9.28 × 10⁻⁵ | 8.51 × 10⁻⁴ | 1.54 × 10⁻³ | 1.86 × 10⁻⁴ | 2.43 × 10⁻³ | 1.12 × 10⁻⁴ | 8.07 × 10⁻³ | 3.94 × 10⁻⁴ | 5.90 × 10⁻⁵ | 3.73 × 10⁻⁵ | 3.57 × 10⁻² |
| Adults | |||||||||||||||||||
| ADDing | 9.94 × 10⁻⁶ | 1.20 × 10⁻⁴ | 1.10 × 10⁻³ | 1.10 × 10⁻³ | 2.98 × 10⁻⁵ | 8.40 × 10⁻⁵ | 1.00 × 10⁻⁴ | 4.00 × 10⁻⁴ | 1.23 × 10⁻⁵ | 1.13 × 10⁻⁴ | 2.06 × 10⁻⁴ | 2.47 × 10⁻⁵ | 3.26 × 10⁻⁴ | 1.47 × 10⁻⁵ | 1.07 × 10⁻³ | 5.28 × 10⁻⁵ | 7.86 × 10⁻⁶ | 4.97 × 10⁻⁶ | 4.78 × 10⁻³ |
| ADDinh | 1.50 × 10⁻⁹ | 1.80 × 10⁻⁸ | 1.66 × 10⁻⁷ | 1.66 × 10⁻⁷ | 4.52 × 10⁻⁹ | 1.30 × 10⁻⁸ | 1.60 × 10⁻⁸ | 6.02 × 10⁻⁸ | 1.90 × 10⁻⁹ | 1.71 × 10⁻⁸ | 3.12 × 10⁻⁸ | 3.74 × 10⁻⁹ | 4.94 × 10⁻⁸ | 2.23 × 10⁻⁹ | 1.62 × 10⁻⁷ | 8.00 × 10⁻⁹ | 1.20 × 10⁻⁹ | 7.54 × 10⁻¹⁰ | 7.23 × 10⁻⁷ |
| ADDderm | 4.97 × 10⁻⁷ | 5.92 × 10⁻⁶ | 5.50 × 10⁻⁵ | 5.50 × 10⁻⁵ | 1.49 × 10⁻⁶ | 4.20 × 10⁻⁶ | 5.23 × 10⁻⁶ | 1.99 × 10⁻⁵ | 6.17 × 10⁻⁷ | 5.66 × 10⁻⁶ | 1.03 × 10⁻⁵ | 1.23 × 10⁻⁶ | 1.63 × 10⁻⁵ | 7.40 × 10⁻⁷ | 5.40 × 10⁻⁵ | 2.64 × 10⁻⁶ | 3.93 × 10⁻⁷ | 2.49 × 10⁻⁷ | 2.39 × 10⁻⁴ |
| Total | 1.04 × 10⁻⁵ | 1.26 × 10⁻⁴ | 1.16 × 10⁻³ | 1.16 × 10⁻³ | 3.13 × 10⁻⁵ | 8.82 × 10⁻⁵ | 1.05 × 10⁻⁴ | 4.20 × 10⁻⁴ | 1.29 × 10⁻⁵ | 1.19 × 10⁻⁴ | 2.16 × 10⁻⁴ | 2.59 × 10⁻⁵ | 3.42 × 10⁻⁴ | 1.54 × 10⁻⁵ | 1.12 × 10⁻³ | 5.54 × 10⁻⁵ | 8.25 × 10⁻⁶ | 5.22 × 10⁻⁶ | 5.02 × 10⁻³ |
| LADD | 8.47 × 10⁻⁵ | 1.01 × 10⁻³ | 9.33 × 10⁻³ | 9.33 × 10⁻³ | 2.53 × 10⁻⁴ | 7.24 × 10⁻⁴ | 8.92 × 10⁻⁴ | 3.35 × 10⁻³ | 1.06 × 10⁻⁴ | 9.69 × 10⁻⁴ | 1.76 × 10⁻³ | 2.12 × 10⁻⁴ | 2.77 × 10⁻³ | 1.27 × 10⁻⁴ | 9.20 × 10⁻³ | 4.49 × 10⁻⁴ | 6.73 × 10⁻⁵ | 4.26 × 10⁻⁵ | 4.07 × 10⁻² |
| Pathways | Cancer Risk Values for Trace Elements in Road Dust (mg/kg/day) | Total CR | ||||
|---|---|---|---|---|---|---|
| Cr | Co | Ni | As | Pb | ||
| Children | ||||||
| CRing | 3.54 × 10⁻⁴ | - | 3.60 × 10⁻⁵ | 1.18 × 10⁻⁵ | 2.86 × 10⁻⁷ | 4.02 × 10⁻⁴ |
| CRinh | 5.41 × 10⁻⁹ | 3.03 × 10⁻¹⁰ | 9.99 × 10⁻⁹ | 2.26 × 10⁻¹⁰ | 2.68 × 10⁻¹¹ | 1.60 × 10⁻⁸ |
| CRderm | - | - | - | 2.59 × 10⁻⁷ | - | 2.59 × 10⁻⁷ |
| CR | 3.54 × 10⁻⁴ | 3.03 × 10⁻¹⁰ | 3.60 × 10⁻⁵ | 1.21 × 10⁻⁵ | 2.86 × 10⁻⁷ | 4.02 × 10⁻⁴ |
| Adults | ||||||
| CRing | 1.87 × 10⁻⁴ | - | 1.90 × 10⁻⁵ | 6.34 × 10⁻⁶ | 1.54 × 10⁻⁷ | 2.12 × 10⁻⁴ |
| CRinh | 2.33 × 10⁻⁸ | 1.30 × 10⁻⁹ | 4.28 × 10⁻⁸ | 9.69 × 10⁻¹⁰ | 1.15 × 10⁻¹⁰ | 6.85 × 10⁻⁸ |
| CRderm | - | - | - | 7.76 × 10⁻⁷ | - | 7.76 × 10⁻⁷ |
| CR | 1.87 × 10⁻⁴ | 1.30 × 10⁻⁹ | 1.90 × 10⁻⁵ | 7.12 × 10⁻⁶ | 1.54 × 10⁻⁷ | 2.13 × 10⁻⁴ |
| LCR | 5.41 × 10⁻⁴ | 1.60 × 10⁻⁹ | 5.51 × 10⁻⁵ | 1.92 × 10⁻⁵ | 4.40 × 10⁻⁷ | 6.16 × 10⁻⁴ |
Publisher’s Note: MDPI stays neutral with regard to jurisdictional claims in published maps and institutional affiliations. |
© 2022 by the authors. Licensee MDPI, Basel, Switzerland. This article is an open access article distributed under the terms and conditions of the Creative Commons Attribution (CC BY) license (https://creativecommons.org/licenses/by/4.0/).
Share and Cite
Mugudamani, I.; Oke, S.A.; Gumede, T.P. Influence of Urban Informal Settlements on Trace Element Accumulation in Road Dust and Their Possible Health Implications in Ekurhuleni Metropolitan Municipality, South Africa. Toxics 2022, 10, 253. https://0-doi-org.brum.beds.ac.uk/10.3390/toxics10050253
Mugudamani I, Oke SA, Gumede TP. Influence of Urban Informal Settlements on Trace Element Accumulation in Road Dust and Their Possible Health Implications in Ekurhuleni Metropolitan Municipality, South Africa. Toxics. 2022; 10(5):253. https://0-doi-org.brum.beds.ac.uk/10.3390/toxics10050253
Chicago/Turabian StyleMugudamani, Innocent, Saheed A. Oke, and Thandi Patricia Gumede. 2022. "Influence of Urban Informal Settlements on Trace Element Accumulation in Road Dust and Their Possible Health Implications in Ekurhuleni Metropolitan Municipality, South Africa" Toxics 10, no. 5: 253. https://0-doi-org.brum.beds.ac.uk/10.3390/toxics10050253