
Revelation of Different Nanoparticle-Uptake Behavior in Two Standard Cell Lines NIH/3T3 and A549 by Flow Cytometry and Time-Lapse Imaging

 and
and 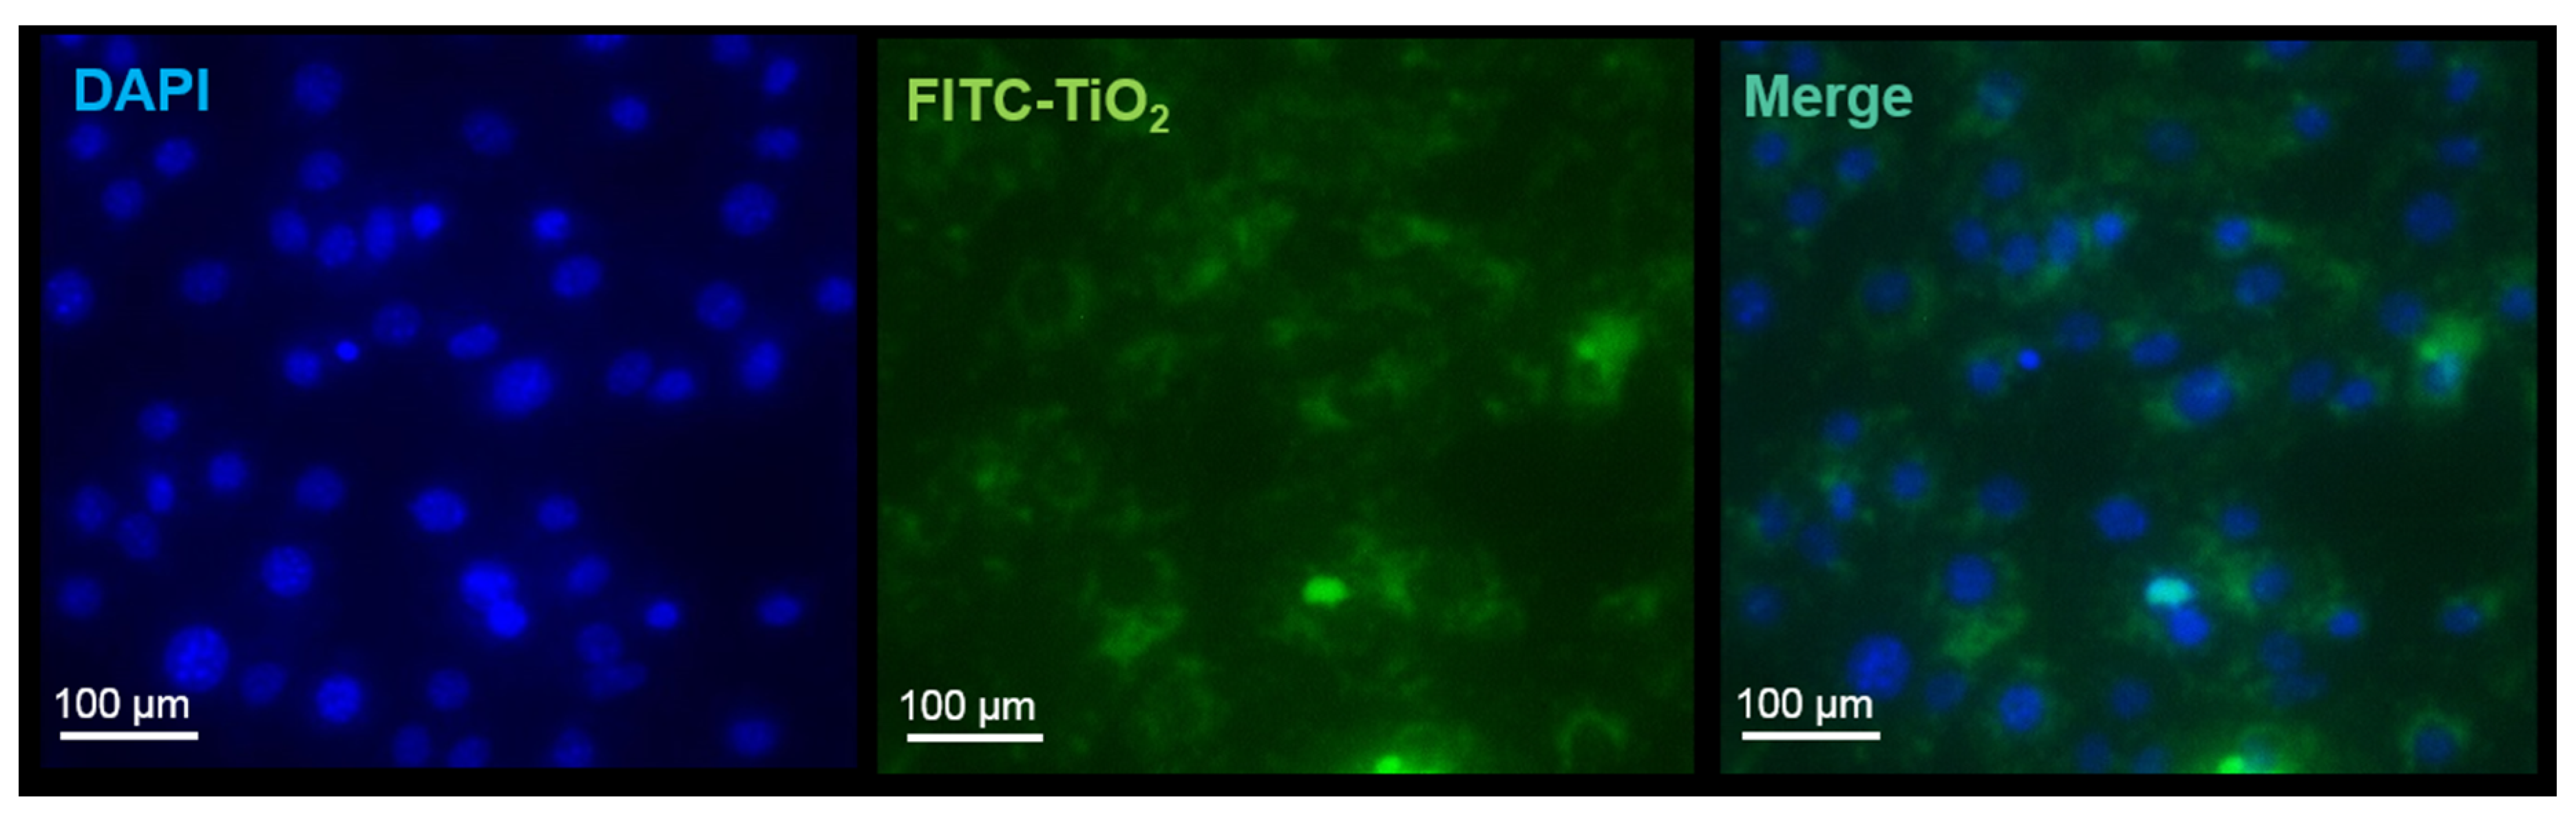
Abstract
:1. Introduction
2. Materials and Methods
2.1. Cell Culture
2.2. Nanoparticles
2.3. FITC-Labeling of Titanium Dioxide Nanoparticles
2.4. Exposure to Cells with Titanium Dioxide Nanoparticles
2.5. Flow Cytometry and Sample Preparation
2.6. Time-Lapse and Fluorescence Microscopic Analysis
3. Results
3.1. Nanoparticle Labeling with FITC
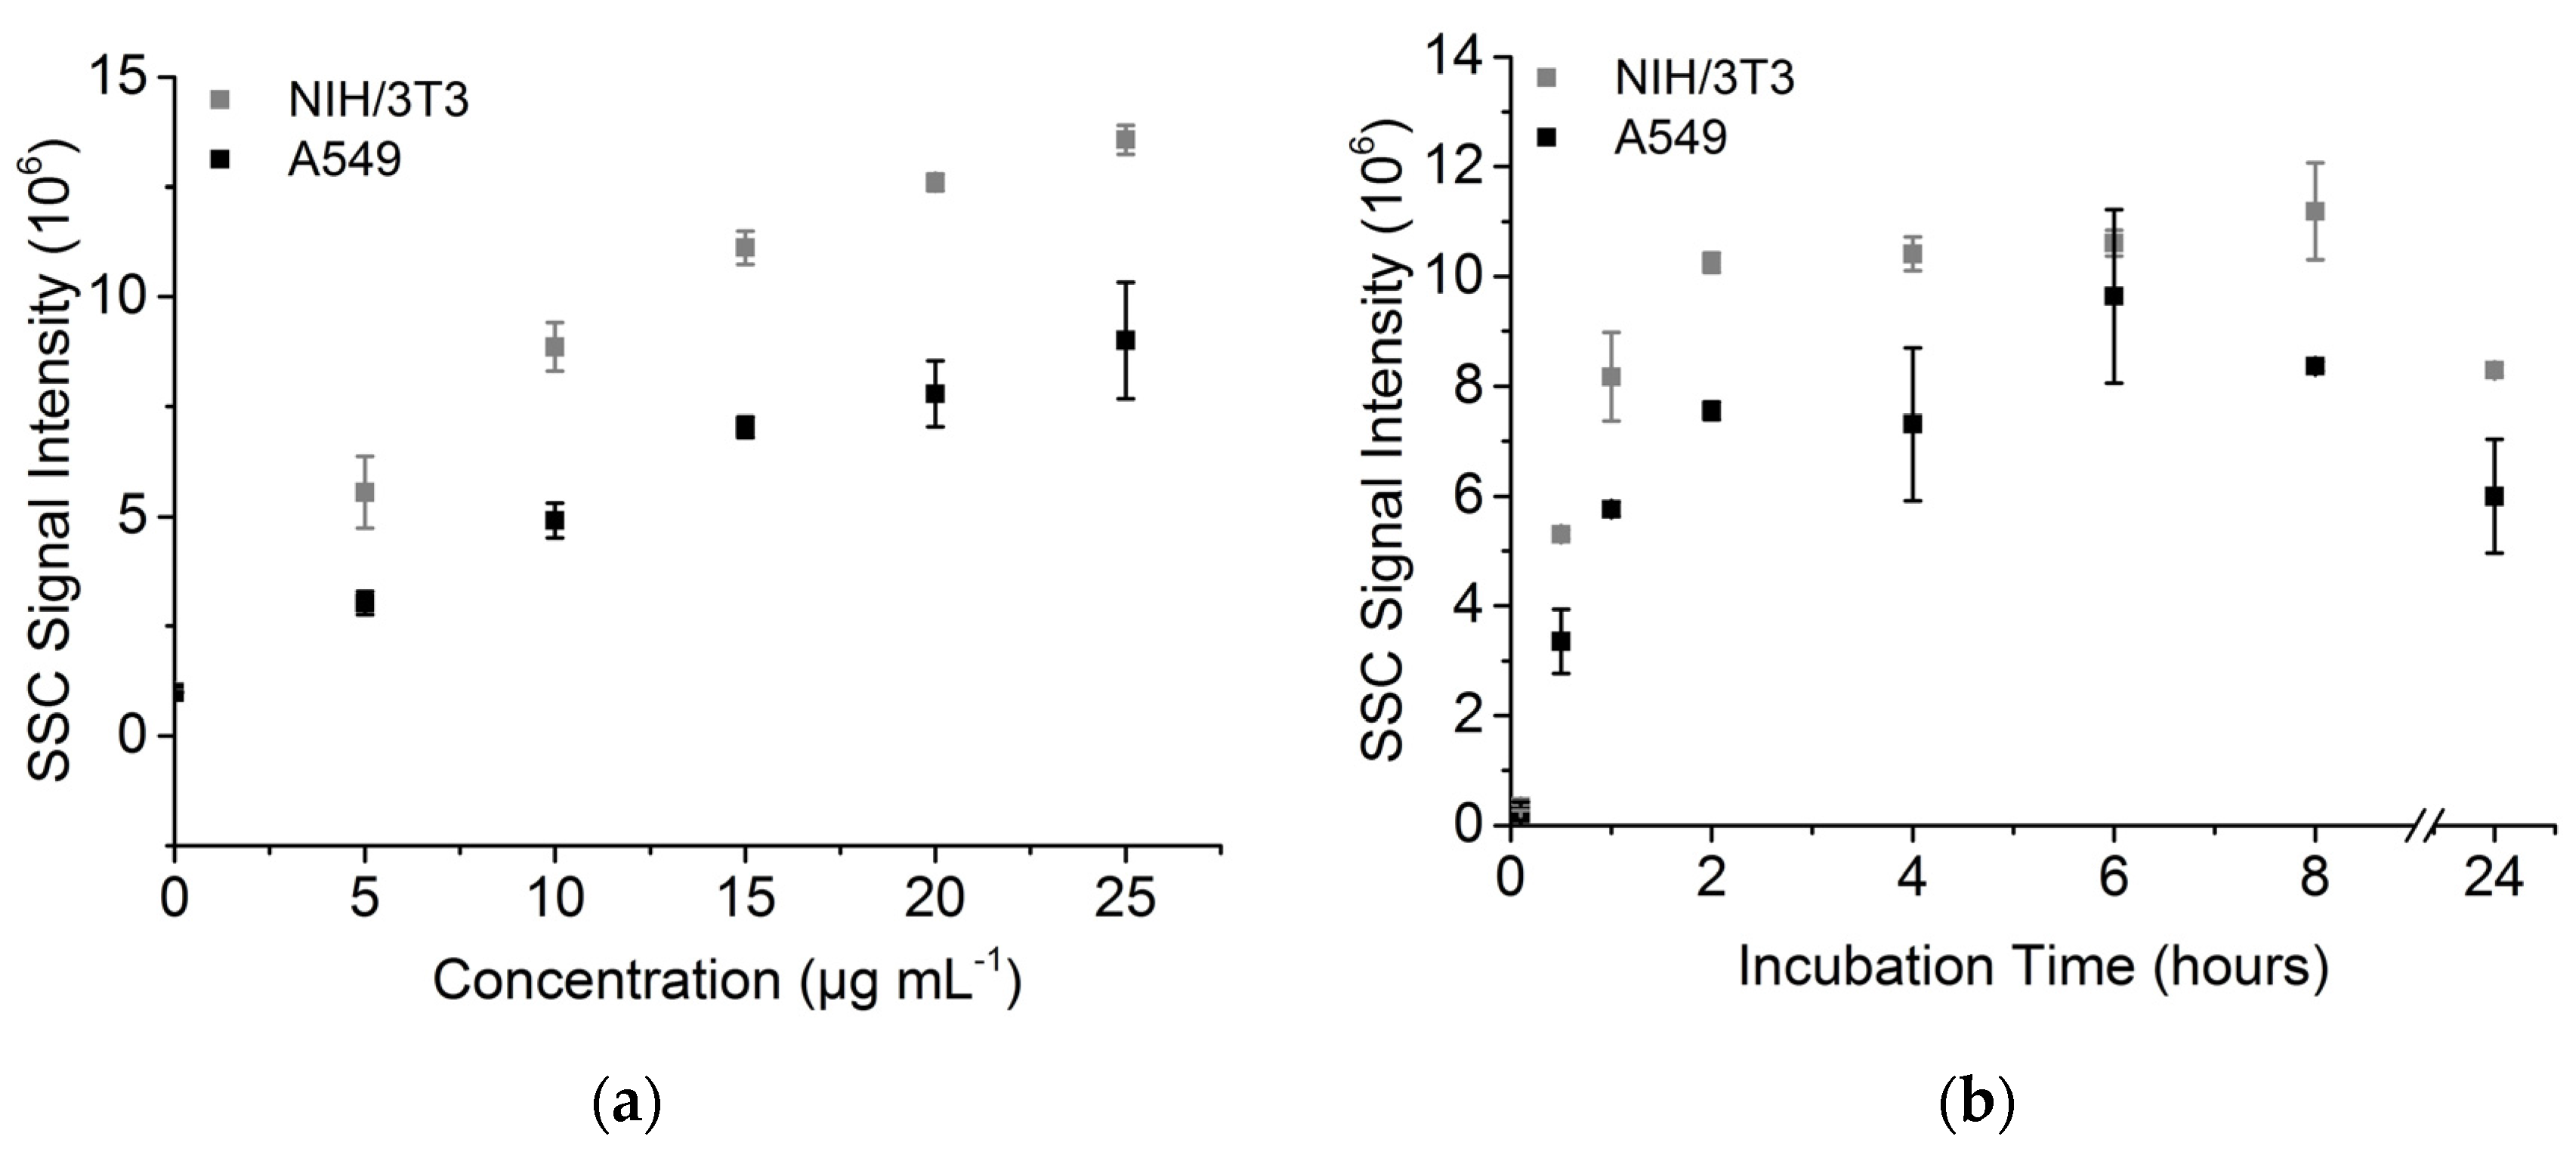
3.2. Nanoparticle Uptake Measured by Side Scatter Signal
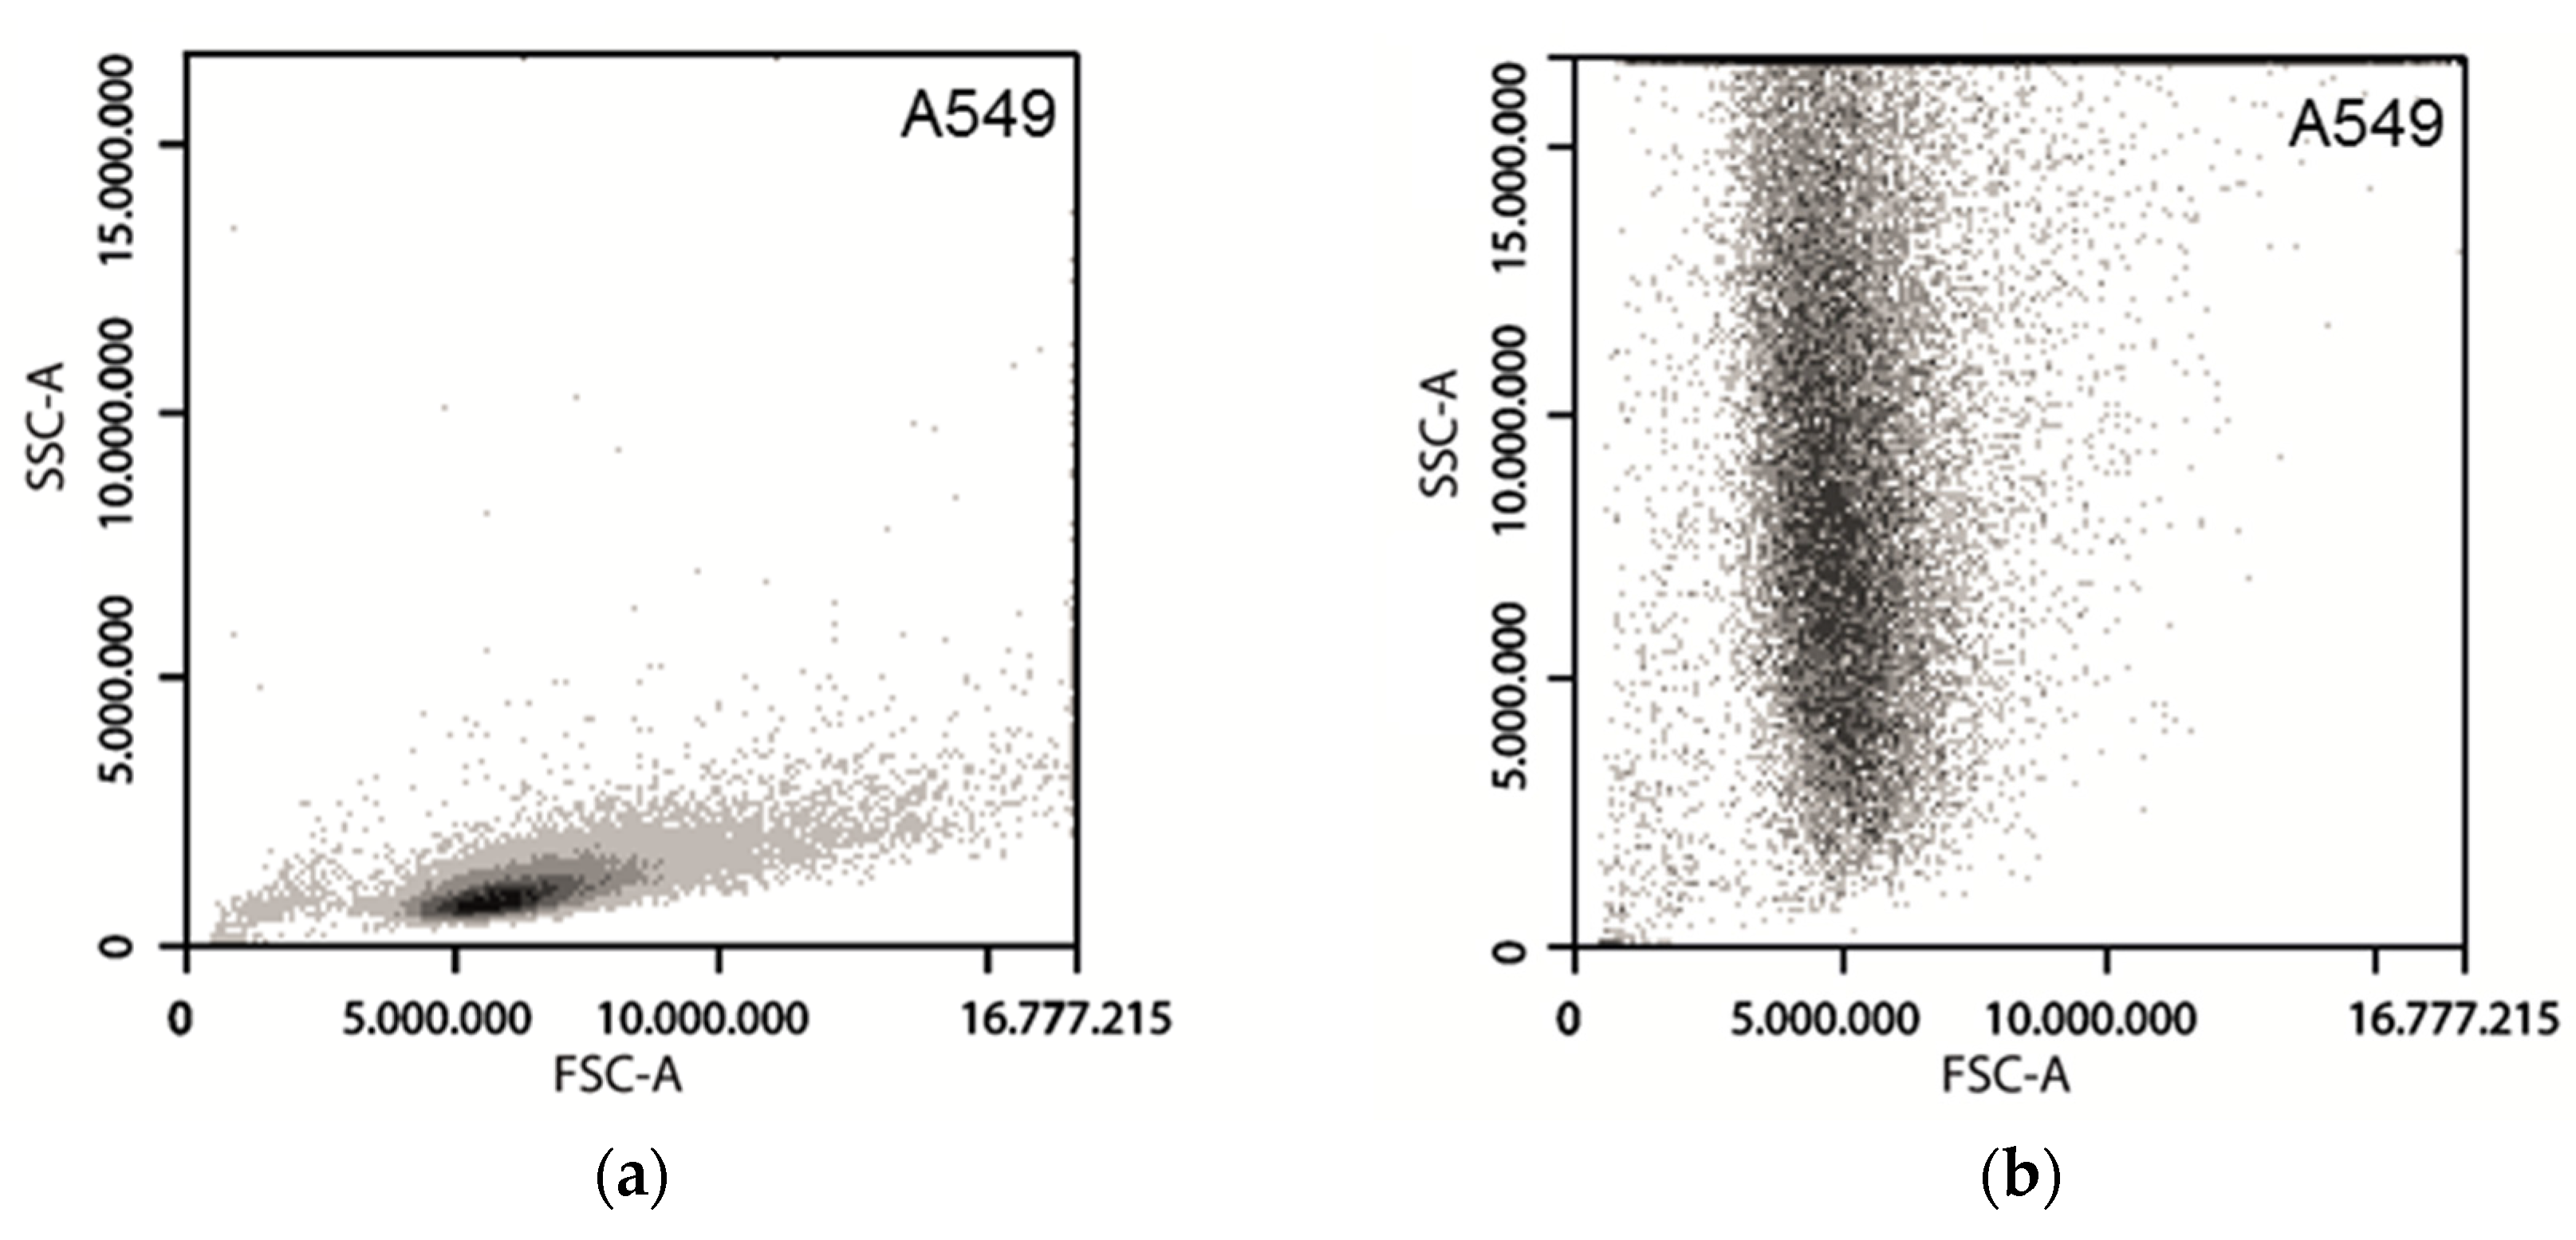
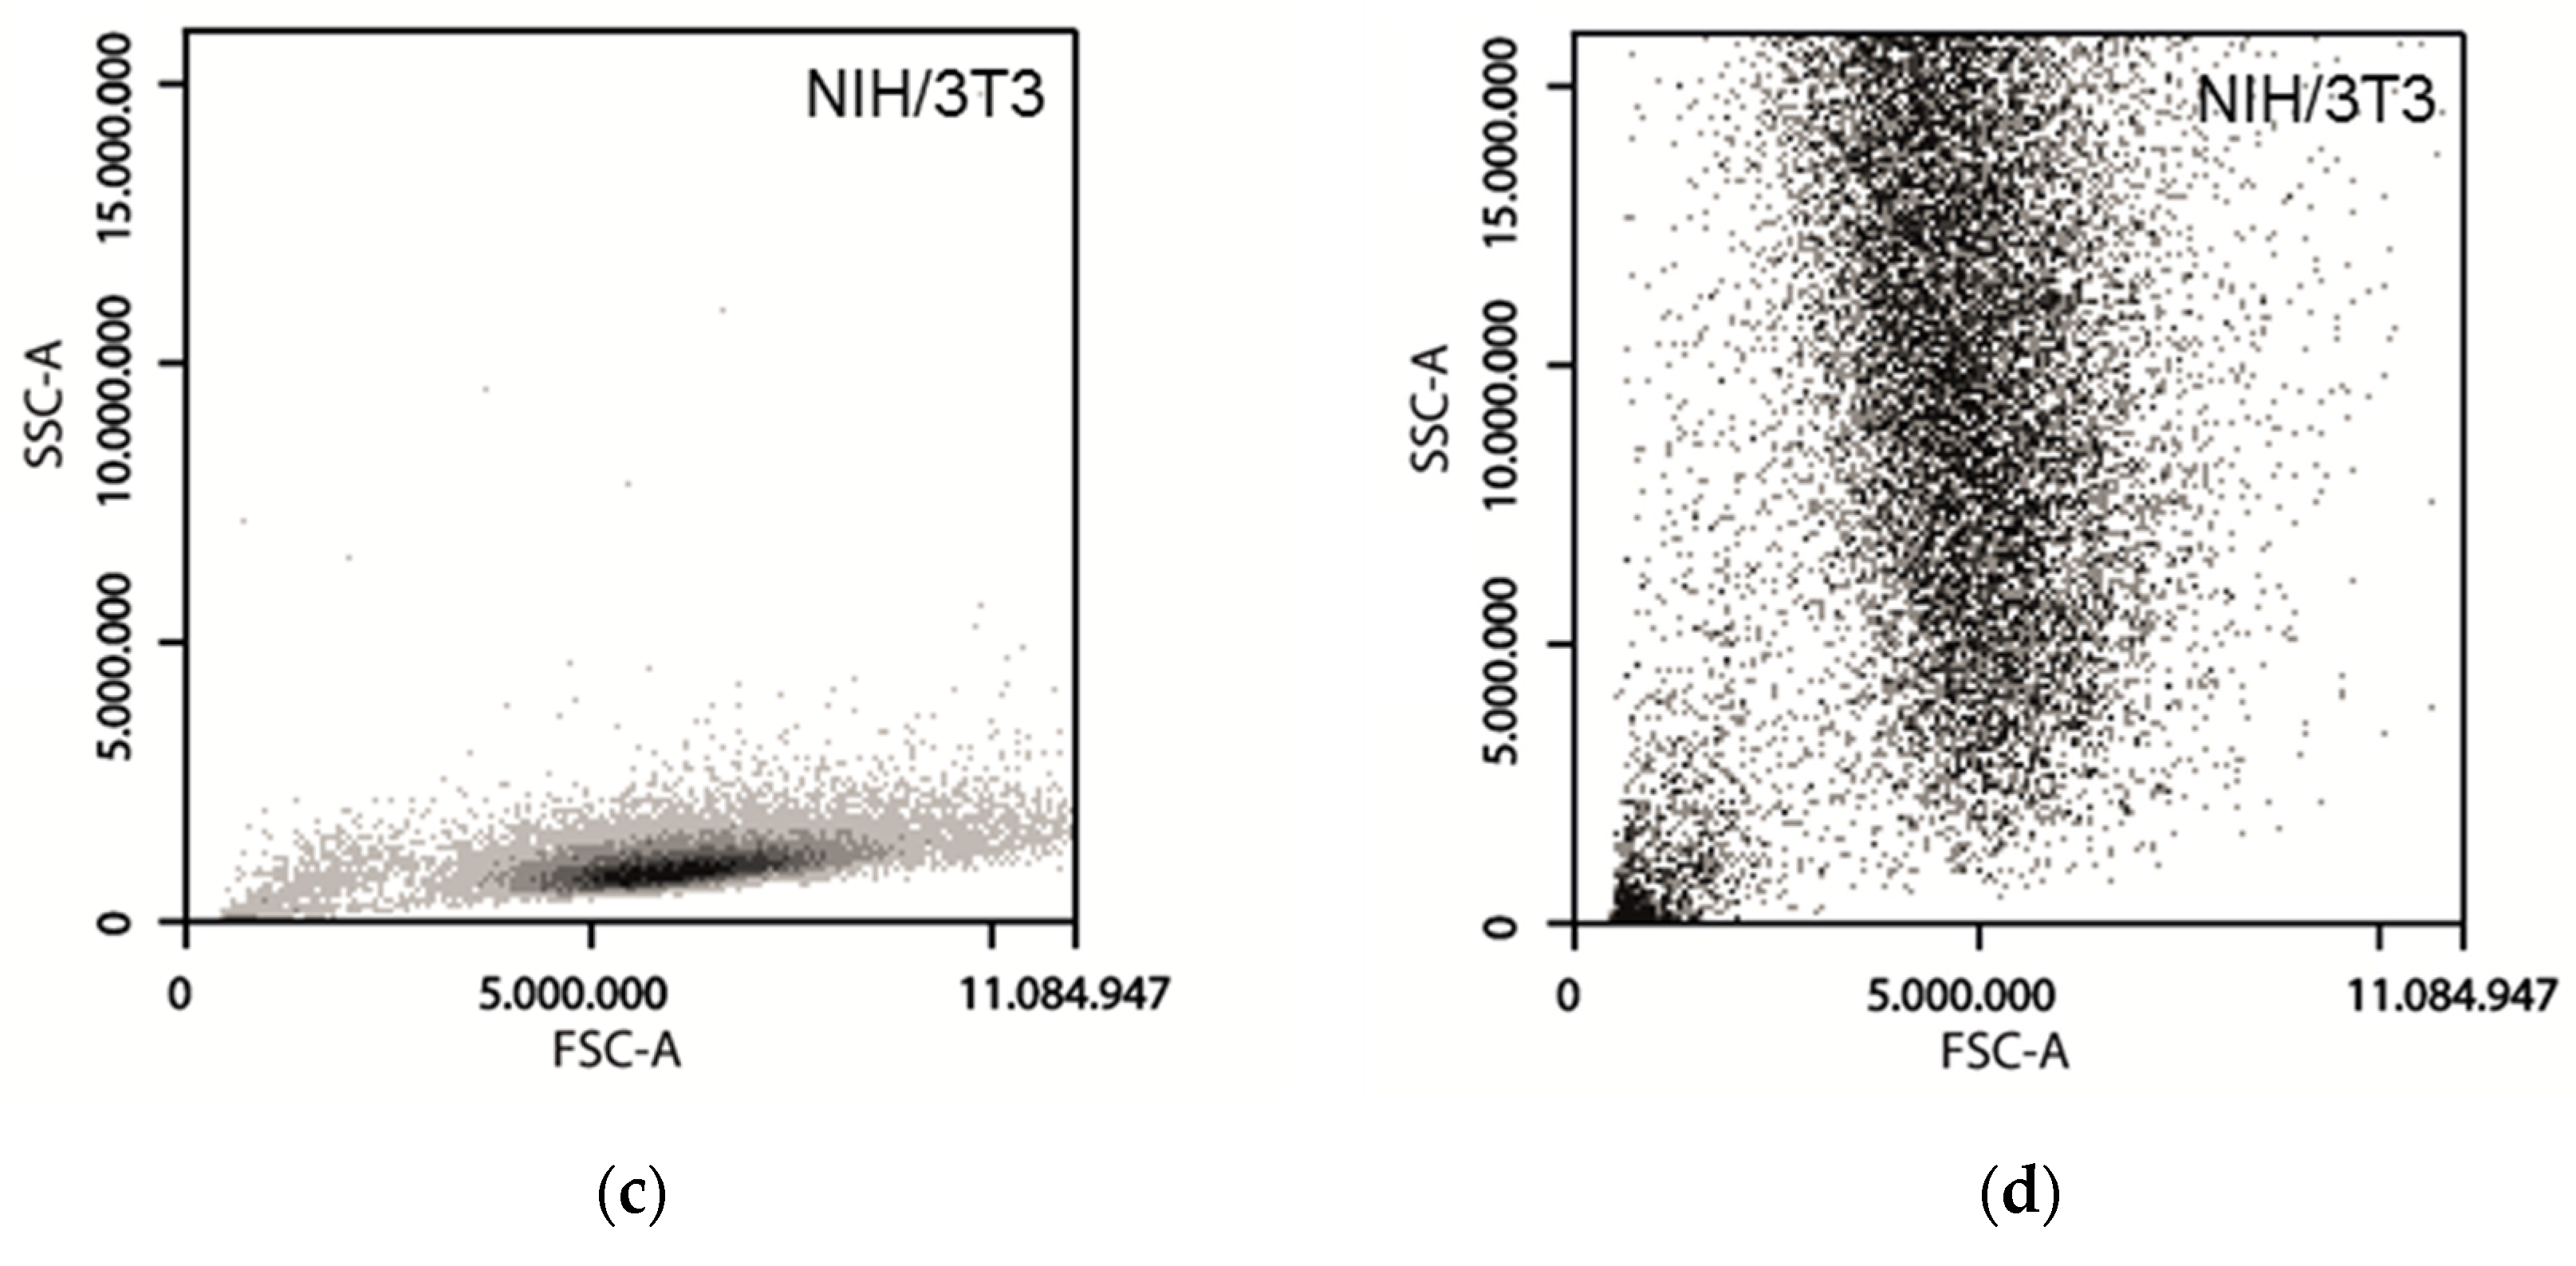
3.3. Forward Scattering of Investigated Cell Lines
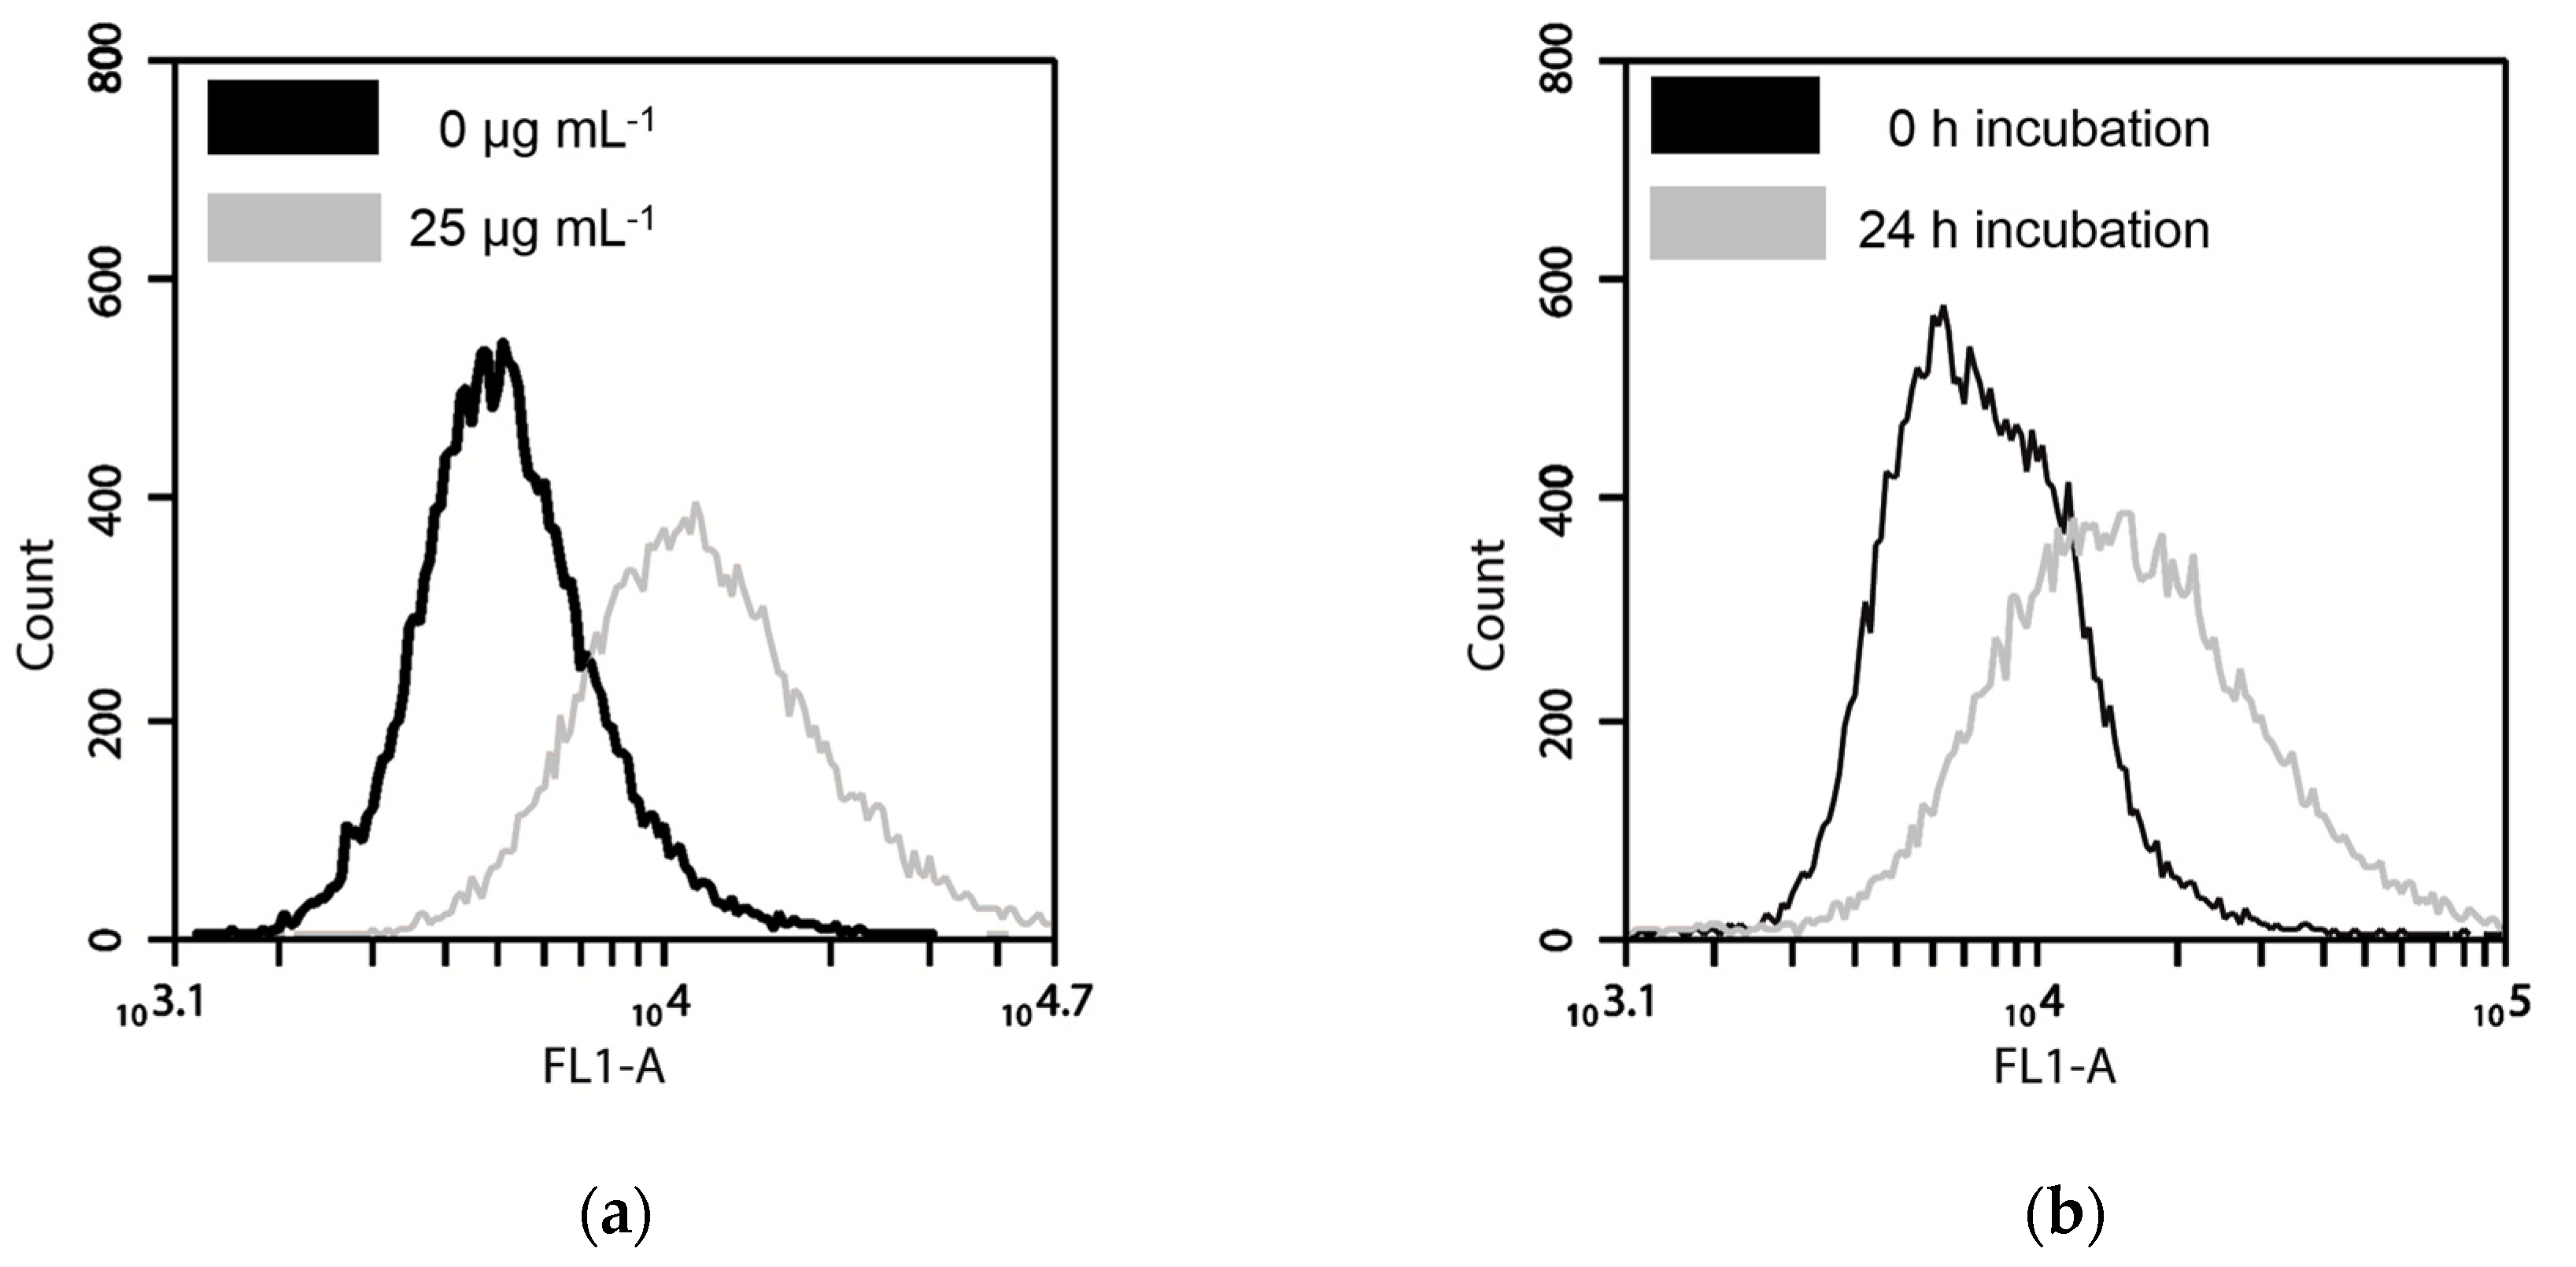
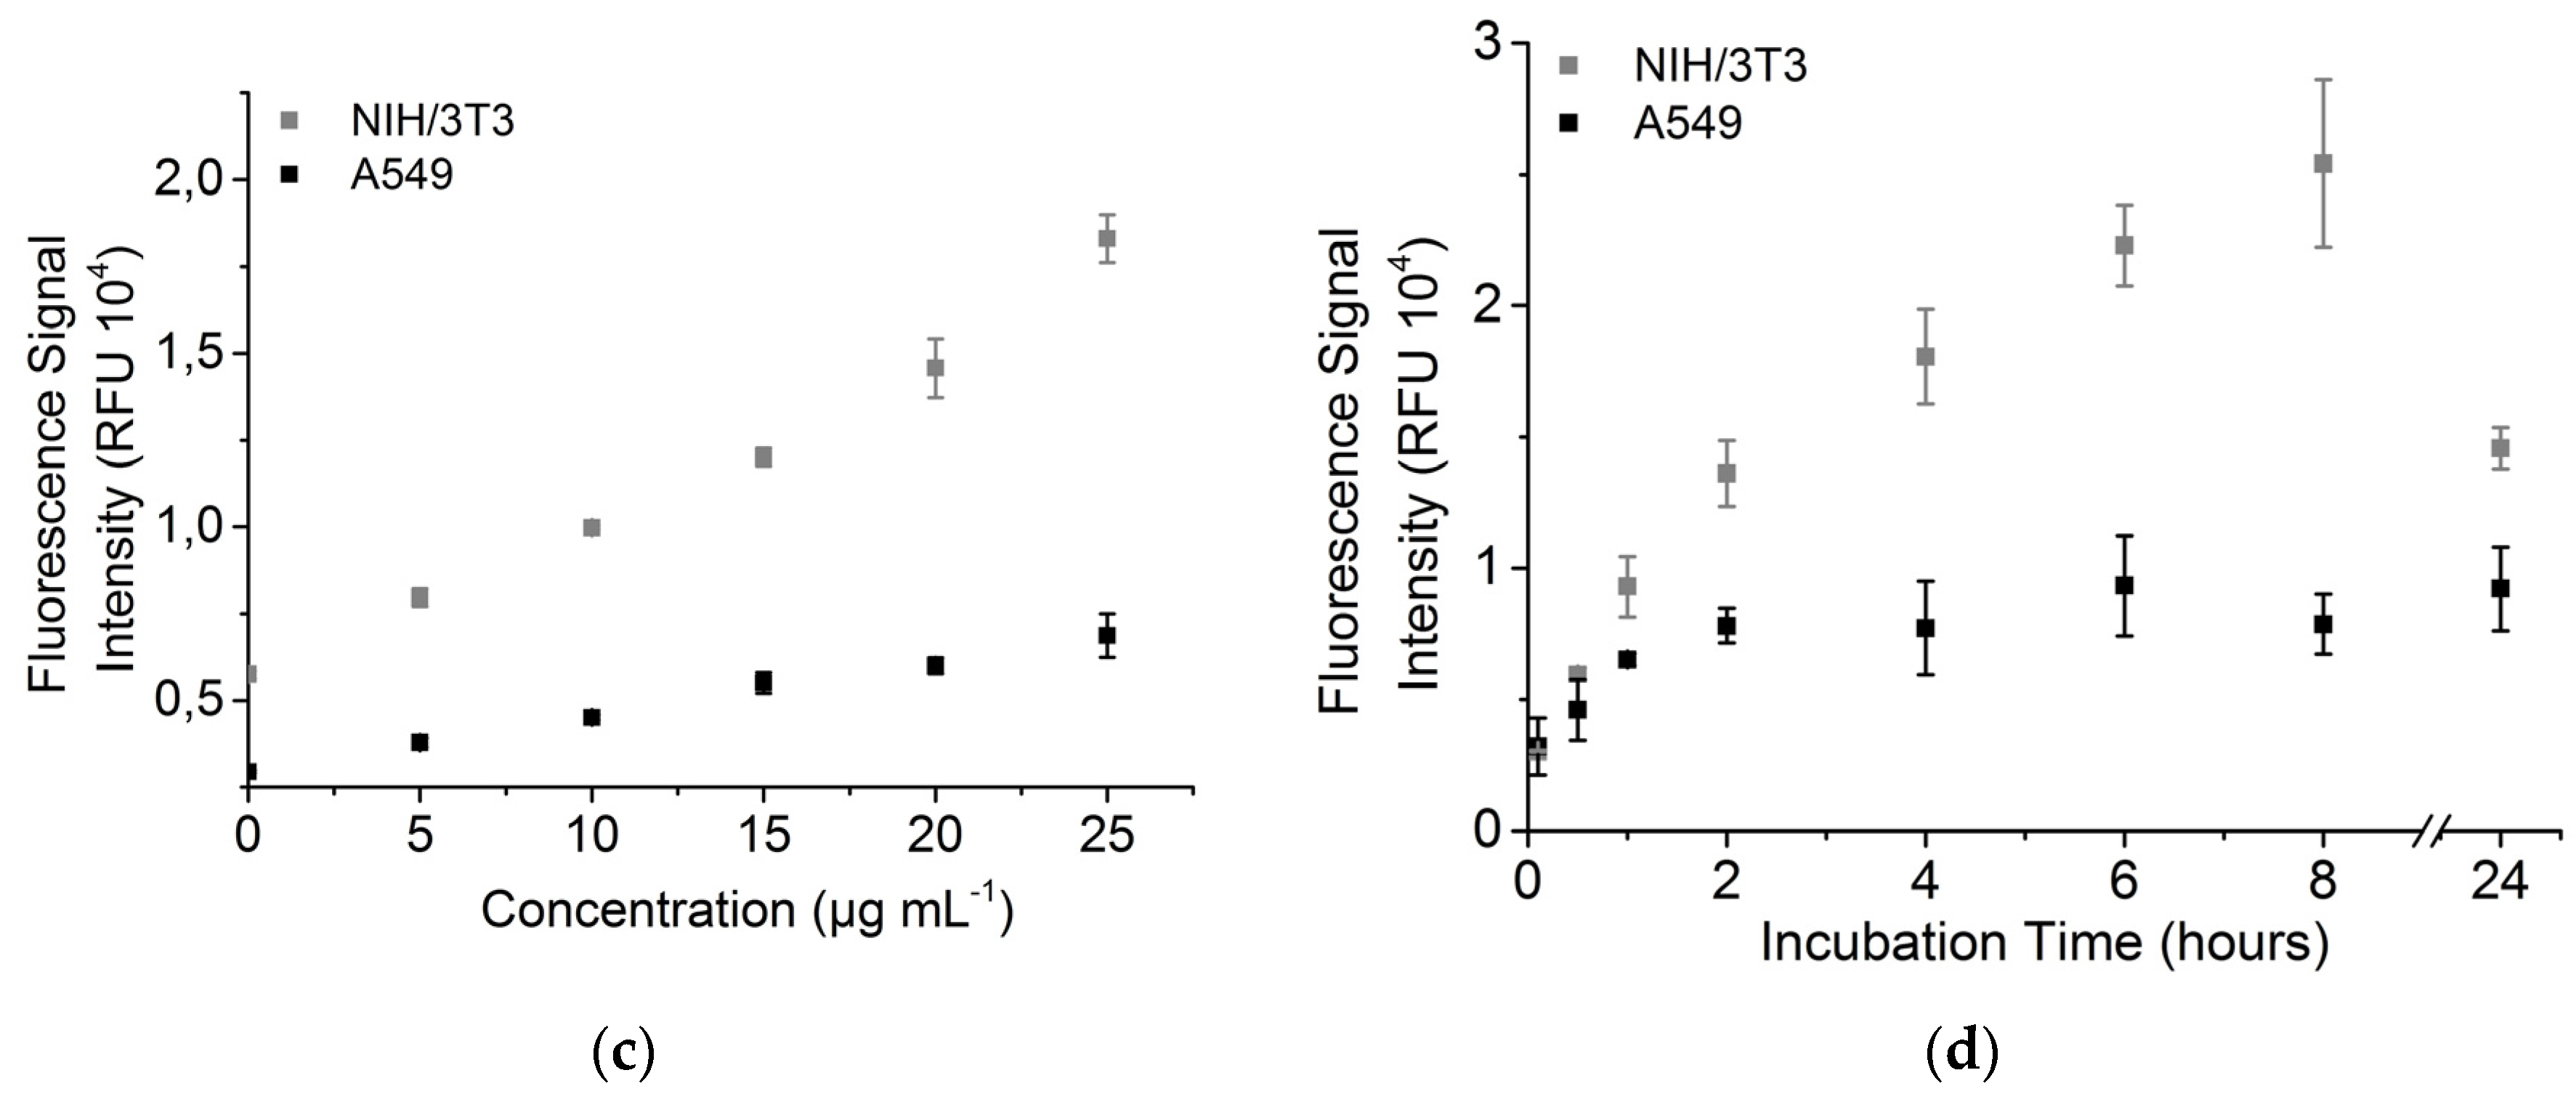
3.4. Nanoparticle Uptake Measured by Fluorescence
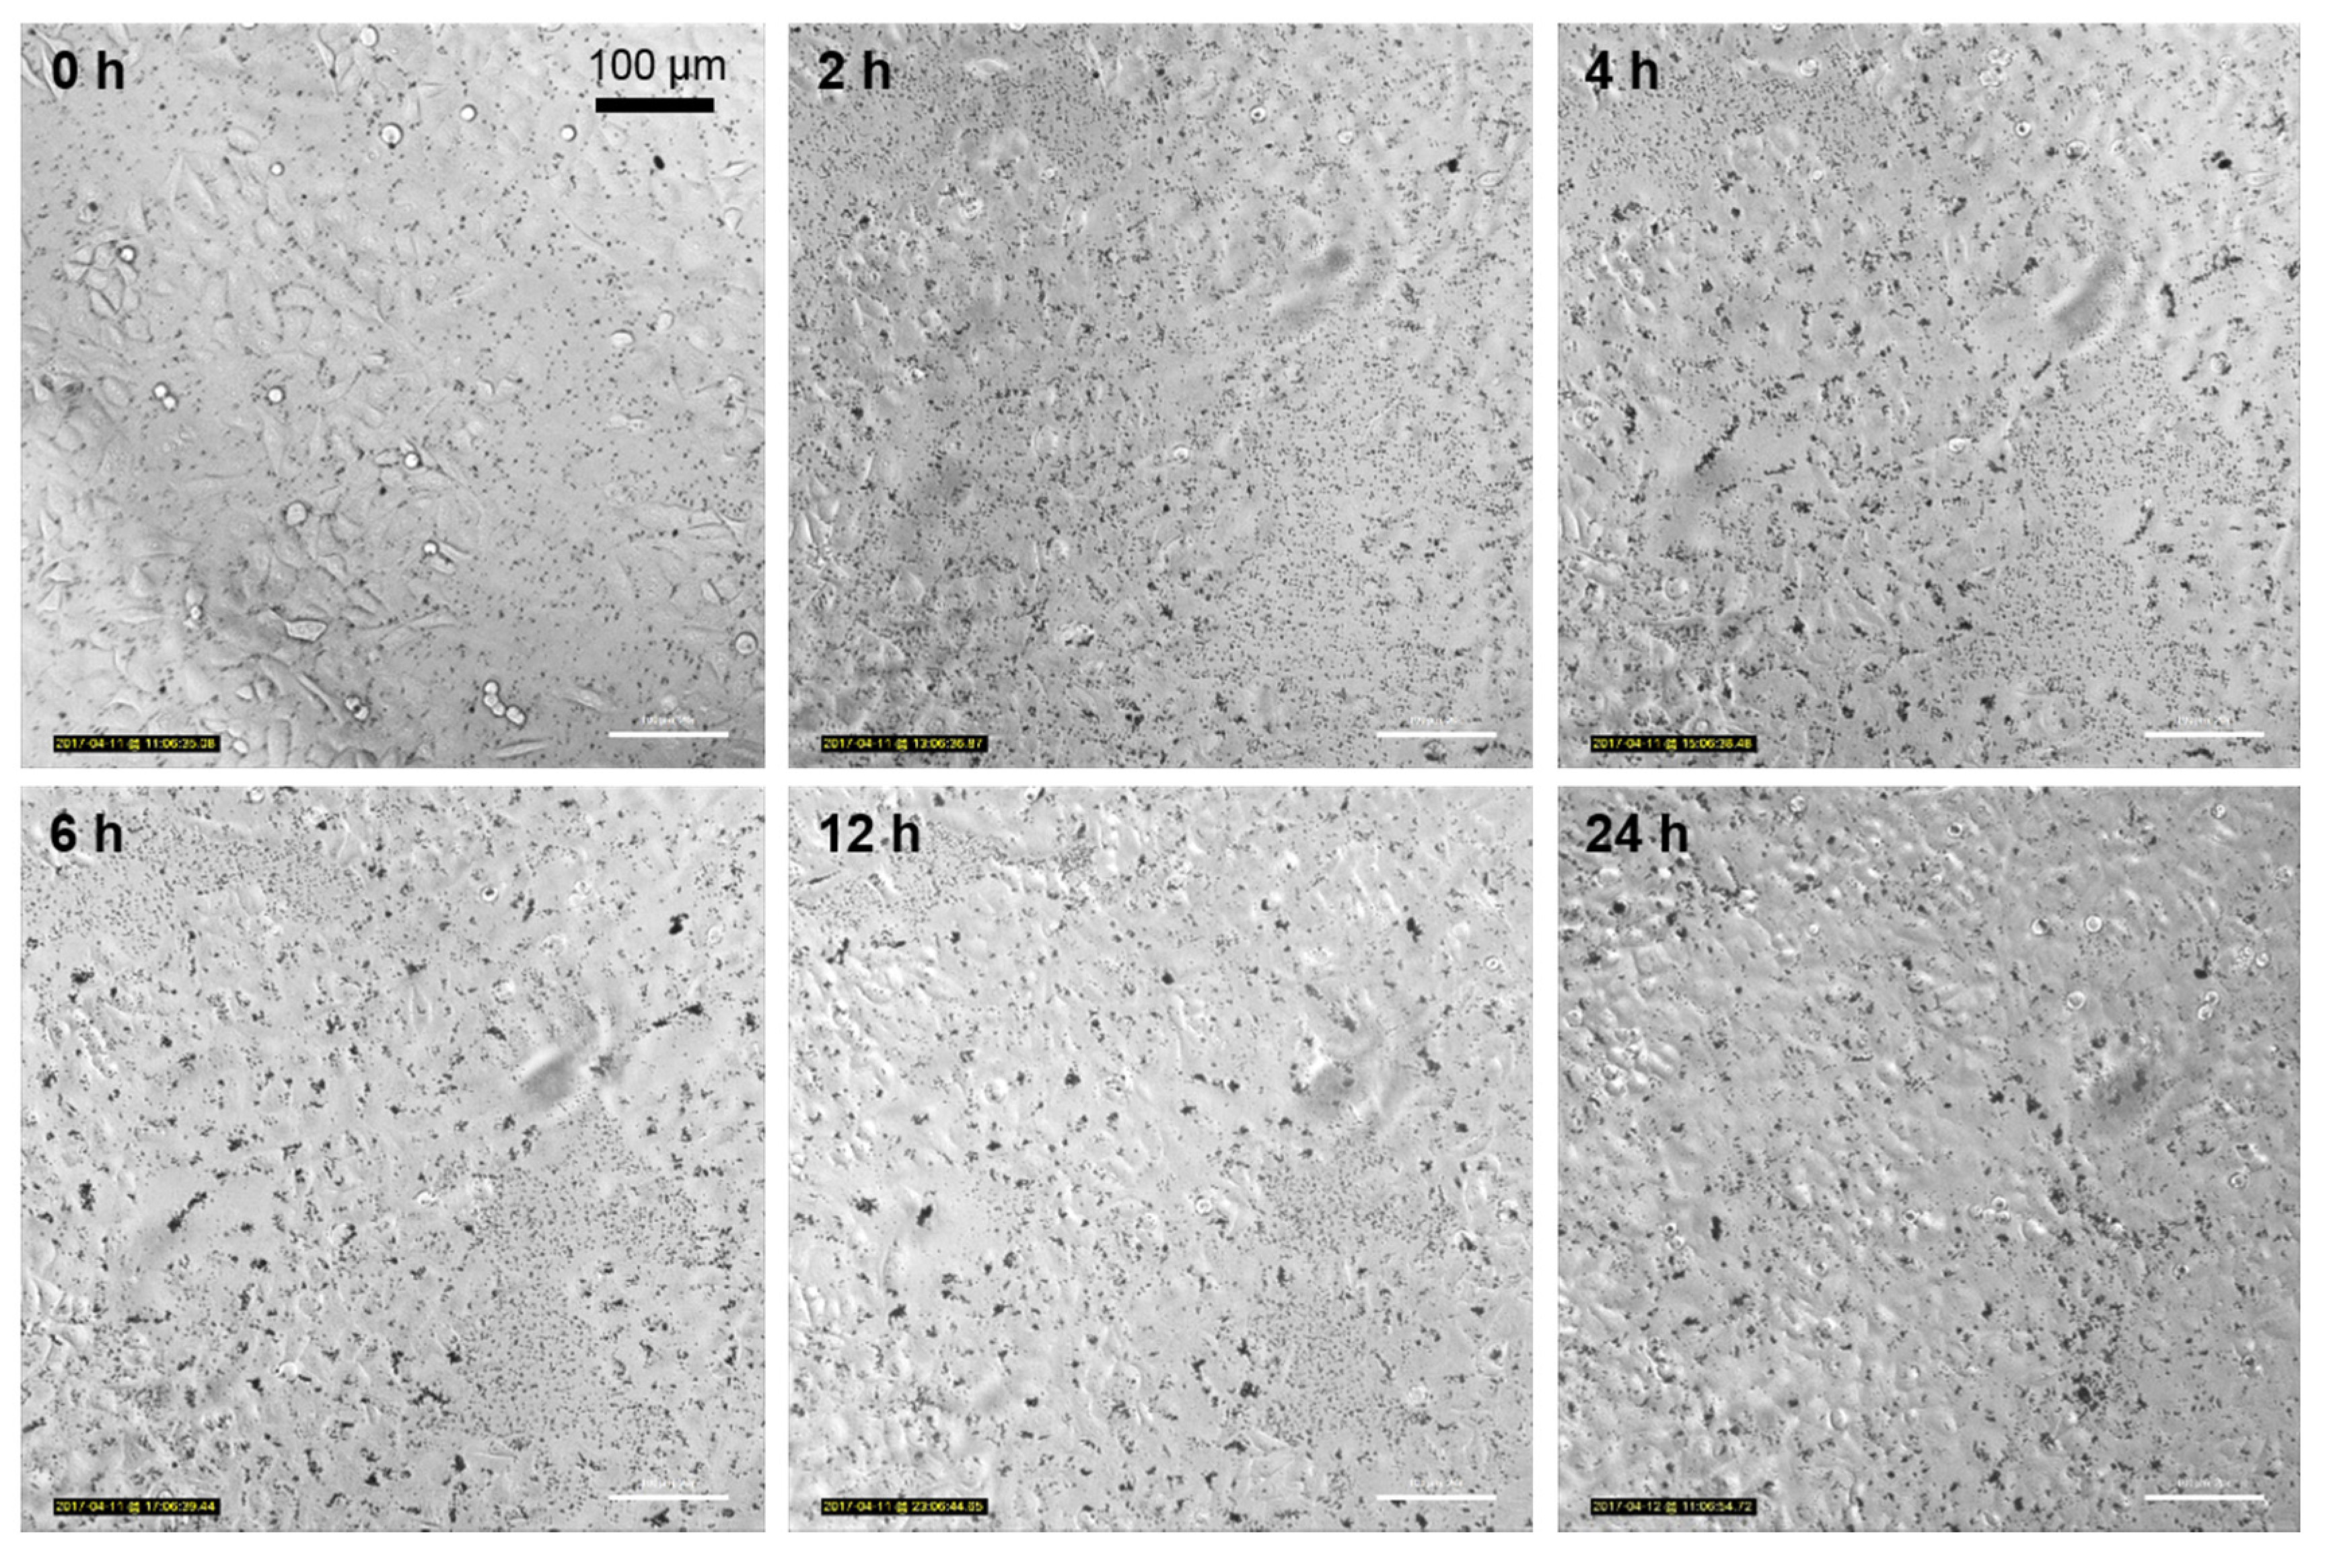
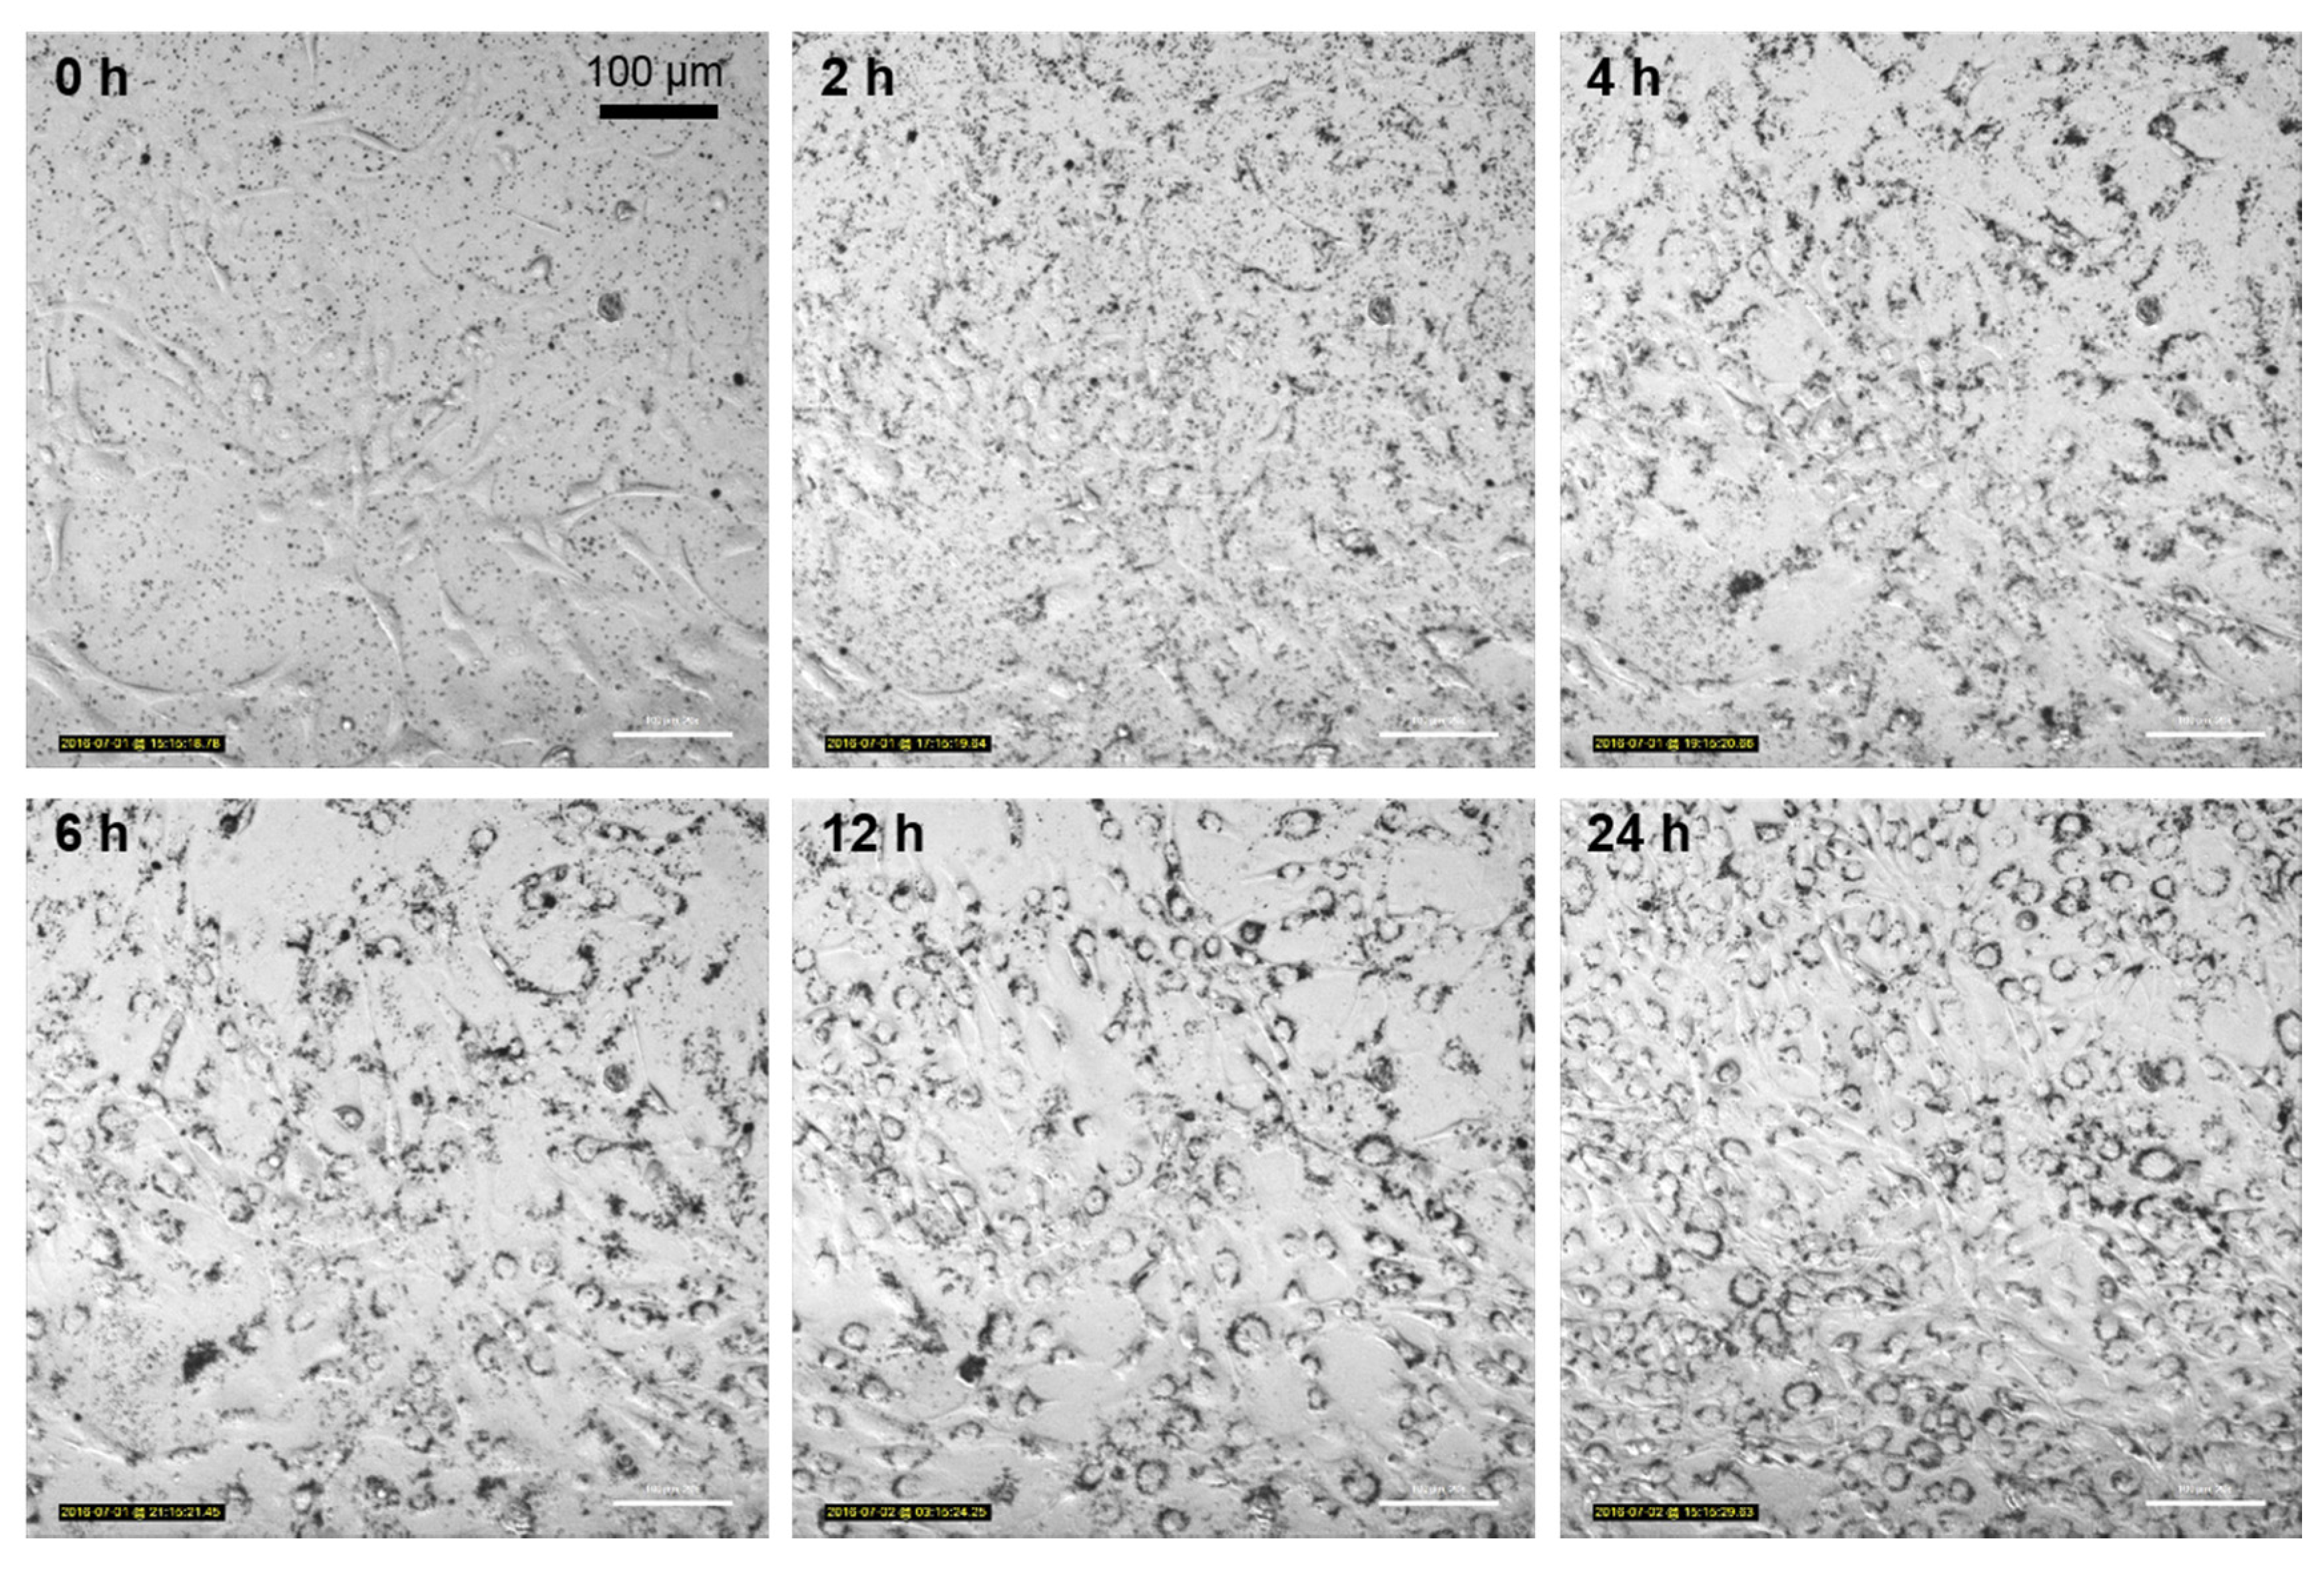
3.5. Nanoparticle Uptake Kinetics Monitored by Microscopy
3.6. Interference with PI Signal
4. Conclusions
Supplementary Materials
Acknowledgments
Author Contributions
Conflicts of Interest
References
- Seleci, D.A.; Seleci, M.; Jochums, A.; Walter, J.G.; Stahl, F.; Scheper, T. Aptamer mediated niosomal drug delivery. RSC Adv. 2016, 6, 87910–87918. [Google Scholar] [CrossRef]
- Astashkina, A.; Mann, B.; Grainger, D.W. A critical evaluation of in vitro cell culture models for high-throughput drug screening and toxicity. Pharmacol. Ther. 2012, 134, 82–106. [Google Scholar] [CrossRef] [PubMed]
- Degelau, A.; Freitag, R.; Linz, F.; Middendorf, C.; Scheper, T.; Bley, T.; Muller, S.; Stoll, P.; Reardon, K.F. Immuno- and flow cytometric analytical methods for biotechnological research and process monitoring. J. Biotechnol. 1992, 25, 115–144. [Google Scholar] [CrossRef]
- Moretti, P.; Behr, L.; Walter, J.G.; Kasper, C.; Stahl, F.; Scheper, T. Characterization and improvement of cell line performance via flow cytometry and cell sorting. Eng. Life Sci. 2010, 10, 130–138. [Google Scholar]
- Meyer, M.; Scheper, T.; Walter, J.-G. Aptamers: Versatile probes for flow cytometry. Appl. Microbiol. Biotechnol. 2013, 97, 7097–7109. [Google Scholar] [CrossRef] [PubMed]
- Graham, L.; Orenstein, J.M. Processing tissue and cells for transmission electron microscopy in diagnostic pathology and research. Nat. Protoc. 2007, 2, 2439–2450. [Google Scholar] [CrossRef] [PubMed]
- Fulwyler, M.J. Electronic separation of biological cells by volume. Science 1965, 150, 910–911. [Google Scholar] [CrossRef] [PubMed]
- Zucker, R.M.; Daniel, K.M.; Massaro, E.J.; Karafas, S.J.; Degn, L.L.; Boyes, W.K. Detection of silver nanoparticles in cells by flow cytometry using light scatter and far-red fluorescence. Cytom. A 2013, 83, 962–972. [Google Scholar] [CrossRef] [PubMed]
- Suzuki, H.; Toyooka, T.; Ibuki, Y. Simple and easy method to evaluate uptake potential of nanoparticles in mammalian cells using a flow cytometric light scatter analysis. Environ. Sci. Technol. 2007, 41, 3018–3024. [Google Scholar] [CrossRef] [PubMed]
- Kumar, A.; Pandey, A.K.; Singh, S.S.; Shanker, R.; Dhawan, A. A flow cytometric method to assess nanoparticle uptake in bacteria. Cytom. A 2011, 79, 707–712. [Google Scholar] [CrossRef] [PubMed]
- Toduka, Y.; Toyooka, T.; Ibuki, Y. Flow cytometric evaluation of nanoparticles using side-scattered light and ROS-mediated fluorescence-correlation with genotoxicity. Environ. Sci. Technol. 2012, 46, 7629–7636. [Google Scholar] [CrossRef] [PubMed]
- Zucker, R.M.; Massaro, E.J.; Sanders, K.M.; Degn, L.L.; Boyes, W.K. Detection of TiO2 nanoparticles in cells by flow cytometry. Cytom. A 2010, 77, 677–685. [Google Scholar] [CrossRef] [PubMed]
- Dobrovolskaia, M.A.; McNeil, S.E. Immunological properties of engineered nanomaterials. Nat. Nanotechnol. 2007, 2, 469–478. [Google Scholar] [CrossRef] [PubMed]
- Lindström, S. Flow Cytometry and Microscopy as Means of Studying Single Cells: A Short Introductional Overview. Methods Mol. Biol. 2012, 853, 13–15. [Google Scholar] [PubMed]
- Hamilton, R.F.; Wu, N.; Porter, D.; Buford, M.; Wolfarth, M.; Holian, A. Particle length-dependent titanium dioxide nanomaterials toxicity and bioactivity. Part. Fibre Toxicol. 2009, 6, 35. [Google Scholar] [CrossRef] [PubMed]
- Sager, T.M.; Kommineni, C.; Castranova, V. Pulmonary response to intratracheal instillation of ultrafine versus fine titanium dioxide: Role of particle surface area. Part. Fibre Toxicol. 2008, 5, 17. [Google Scholar] [CrossRef] [PubMed] [Green Version]
- Nel, A.; Xia, T.; Mädler, L.; Li, N. Toxic potential of materials at the nanolevel. Science 2006, 311, 622–627. [Google Scholar] [CrossRef] [PubMed]
- Stone, V.; Donaldson, K. Nanotoxicology: Signs of stress. Nat. Nanotechnol. 2006, 1, 23–24. [Google Scholar] [CrossRef] [PubMed]
- Friehs, E.; AlSalka, Y.; Jonczyk, R.; Lavrentieva, A.; Jochums, A.; Walter, J.-G.; Stahl, F.; Scheper, T.; Bahnemann, D. Toxicity, phototoxicity and biocidal activity of nanoparticles employed in photocatalysis. J. Photochem. Photobiol. C Photochem. Rev. 2016, 29, 1–28. [Google Scholar] [CrossRef]
- Lindner, M.; Bahnemann, D.W.; Hirthe, B.; Griebler, W.-D. Solar Water Detoxification: Novel TiO2 Powders as Highly Active Photocatalysts. J. Sol. Energy Eng. 1997, 119, 120. [Google Scholar] [CrossRef]
- Feng, X.; Zhang, S.; Wu, H.; Lou, X. A novel folic acid-conjugated TiO2-SiO2 photosensitizer for cancer targeting in photodynamic therapy. Colloids Surf. B Biointerfaces 2015, 125, 197–205. [Google Scholar] [CrossRef] [PubMed]
- Tedja, R.; Marquis, C.; Lim, M.; Amal, R. Biological impacts of TiO2 on human lung cell lines A549 and H1299: Particle size distribution effects. J. Nanopart. Res. 2011, 13, 3801–3813. [Google Scholar] [CrossRef]
- McGann, L.E.; Walterson, M.L.; Hogg, L.M. Light scattering and cell volumes in osmotically stressed and frozen-thawed cells. Cytometry 1988, 9, 33–38. [Google Scholar] [CrossRef] [PubMed]
- Lanz, E.; Gregor, M.; Slavik, J.; Kotyk, A. Use of FITC as a Fluorescent Probe for Intracellular pH Measurement. J. Fluoresc. 1997, 7, 317–319. [Google Scholar] [CrossRef]
- Zhu, M.; Nie, G.; Meng, H.; Xia, T.; Nel, A.; Zhao, Y. Physicochemical properties determine nanomaterial cellular uptake, transport, and fate. Acc. Chem. Res. 2013, 46, 622–631. [Google Scholar] [CrossRef] [PubMed]
- Stearns, R.C.; Paulauskis, J.D.; Godleski, J.J. Endocytosis of ultrafine particles by A549 cells. Am. J. Respir. Cell Mol. Biol. 2001, 24, 108–115. [Google Scholar] [CrossRef] [PubMed]
- Caballero-Díaz, E.; Pfeiffer, C.; Kastl, L.; Rivera-Gil, P.; Simonet, B.; Valcárcel, M.; Jiménez-Lamana, J.; Laborda, F.; Parak, W.J. The toxicity of silver nanoparticles depends on their uptake by cells and thus on their surface chemistry. Part. Part. Syst. Charact. 2013, 30, 1079–1085. [Google Scholar] [CrossRef]
- Saltan, N.; Kutlu, H.M.; Hür, D.; Işcan, A.; Say, R. Interaction of cancer cells with magnetic nanoparticles modified by methacrylamido-folic acid. Int. J. Nanomed. 2011, 6, 477–484. [Google Scholar]
- Hazel, A.L.; Pedley, T.J. Vascular Endothelial Cells Minimize the Total Force on Their Nuclei. Biophys. J. 2000, 78, 47–54. [Google Scholar] [CrossRef]
- Kim, D.-H.; Li, B.; Si, F.; Phillip, J.M.; Wirtz, D.; Sun, S.X. Volume regulation and shape bifurcation in the cell nucleus. J. Cell Sci. 2015, 128, 3375–3385. [Google Scholar] [CrossRef] [PubMed]
- Sambale, F.; Lavrentieva, A.; Stahl, F.; Blume, C.; Stiesch, M.; Kasper, C.; Bahnemann, D.; Scheper, T. Three dimensional spheroid cell culture for nanoparticle safety testing. J. Biotechnol. 2015, 205, 120–129. [Google Scholar] [CrossRef] [PubMed]
- Neumeyer, A.; Bukowski, M.; Veith, M.; Lehr, C.M.; Daum, N. Propidium iodide labeling of nanoparticles as a novel tool for the quantification of cellular binding and uptake. Nanomed. Nanotechnol. Biol. Med. 2011, 7, 410–419. [Google Scholar] [CrossRef] [PubMed]
- Zanin, H.; Hollanda, L.M.; Ceragioli, H.J.; Ferreira, M.S.; Machado, D.; Lancellotti, M.; Catharino, R.R.; Baranauskas, V.; Lobo, A.O. Carbon nanoparticles for gene transfection in eukaryotic cell lines. Mater. Sci. Eng. C 2014, 39, 359–370. [Google Scholar] [CrossRef] [PubMed]


© 2017 by the authors. Licensee MDPI, Basel, Switzerland. This article is an open access article distributed under the terms and conditions of the Creative Commons Attribution (CC BY) license (http://creativecommons.org/licenses/by/4.0/).
Share and Cite
Jochums, A.; Friehs, E.; Sambale, F.; Lavrentieva, A.; Bahnemann, D.; Scheper, T. Revelation of Different Nanoparticle-Uptake Behavior in Two Standard Cell Lines NIH/3T3 and A549 by Flow Cytometry and Time-Lapse Imaging. Toxics 2017, 5, 15. https://0-doi-org.brum.beds.ac.uk/10.3390/toxics5030015
Jochums A, Friehs E, Sambale F, Lavrentieva A, Bahnemann D, Scheper T. Revelation of Different Nanoparticle-Uptake Behavior in Two Standard Cell Lines NIH/3T3 and A549 by Flow Cytometry and Time-Lapse Imaging. Toxics. 2017; 5(3):15. https://0-doi-org.brum.beds.ac.uk/10.3390/toxics5030015
Chicago/Turabian StyleJochums, André, Elsa Friehs, Franziska Sambale, Antonina Lavrentieva, Detlef Bahnemann, and Thomas Scheper. 2017. "Revelation of Different Nanoparticle-Uptake Behavior in Two Standard Cell Lines NIH/3T3 and A549 by Flow Cytometry and Time-Lapse Imaging" Toxics 5, no. 3: 15. https://0-doi-org.brum.beds.ac.uk/10.3390/toxics5030015