
Cytotoxicity of Seaweed Compounds, Alone or Combined to Reference Drugs, against Breast Cell Lines Cultured in 2D and 3D


Abstract
:
1. Introduction
1.1. Carotenoids—Astaxanthin (Asta)
1.2. Polysaccharides—Fucoidan (Fc) and Laminarin (Lm)
1.3. Sterols—Fucosterol (Fct)
1.4. Phlorotannins–Phloroglucinol (Phg)
2. Materials and Methods
2.1. Cell Lines and Baseline Culture Conditions
2.2. Chemicals and Solutions
2.3. Cell Exposures
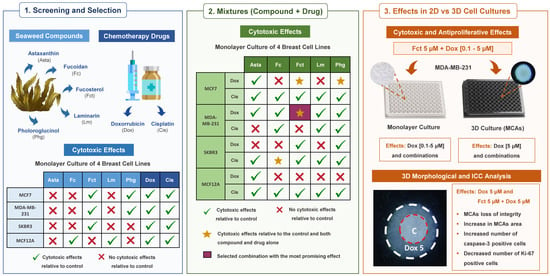
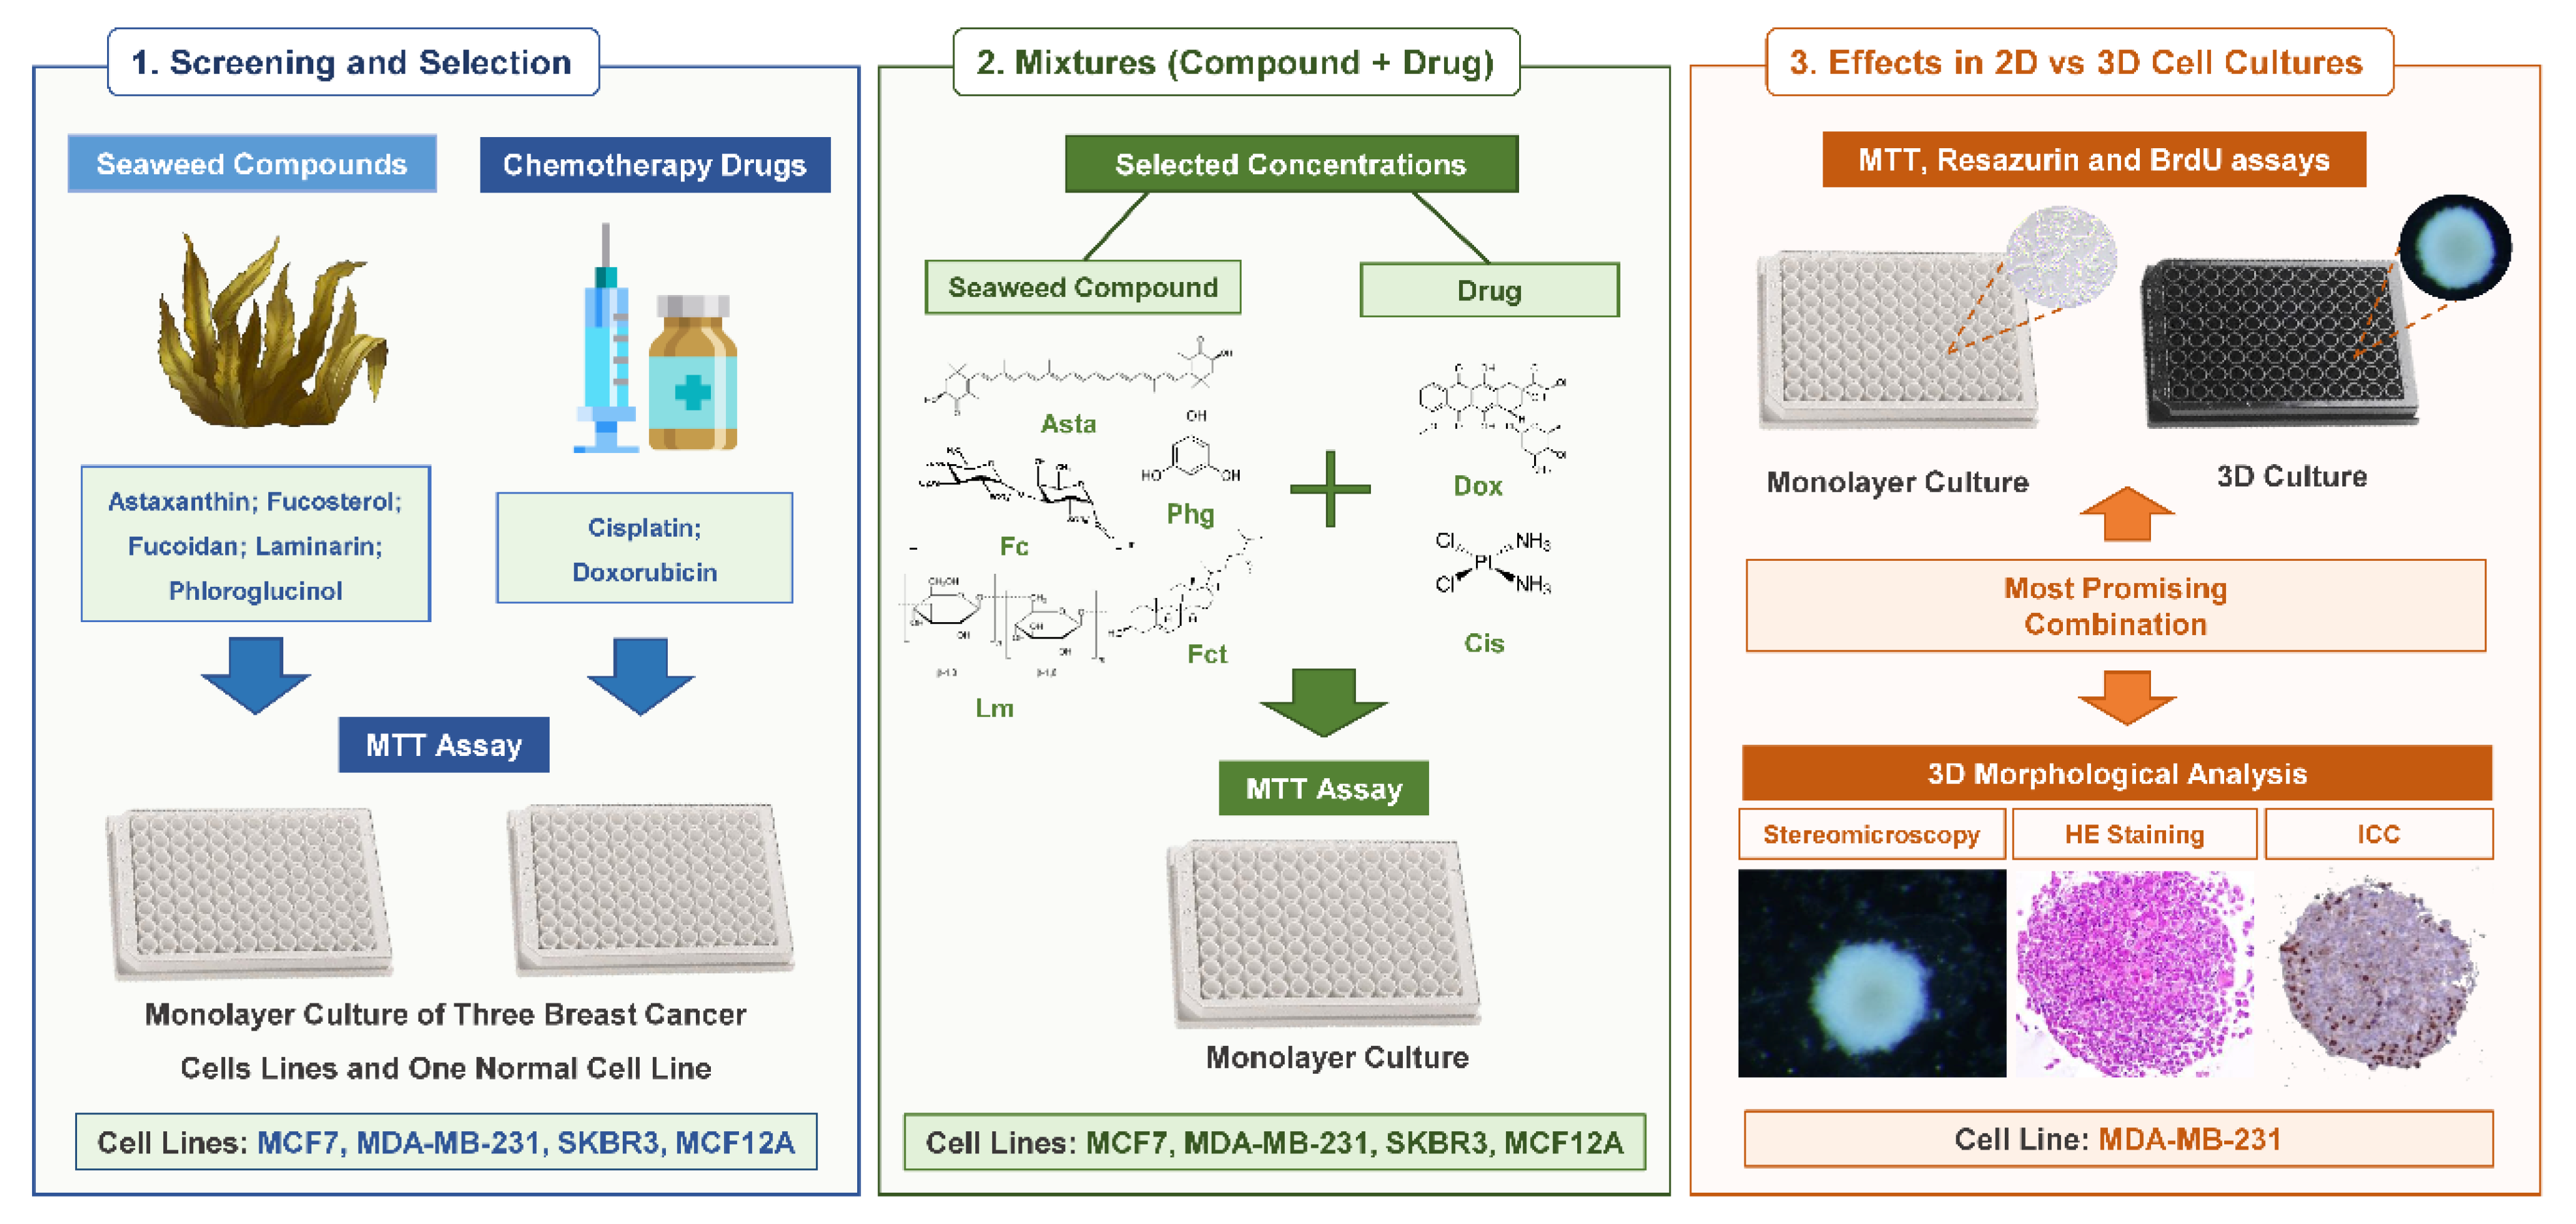
2.3.1. Study Design
2.3.2. Exposures (Single or Combination) in Monolayer
2.3.3. Exposures (Single or Combined) in 3D Cultures—Multicellular Aggregates (MCAs)
2.4. Cell Viability Assessment
2.4.1. MTT Assay
2.4.2. Resazurin Assay
2.5. Cell Proliferation Assessment—BrdU Assay
2.6. Cell Morphology Assessment
2.6.1. Monolayer
2.6.2. 3D–MCA Measurements
2.6.3. Histological Analysis
MCA Histological Processing
Hematoxylin-Eosin (HE) Staining
Immunocytochemistry (ICC)
2.7. Statistical Analysis
3. Results
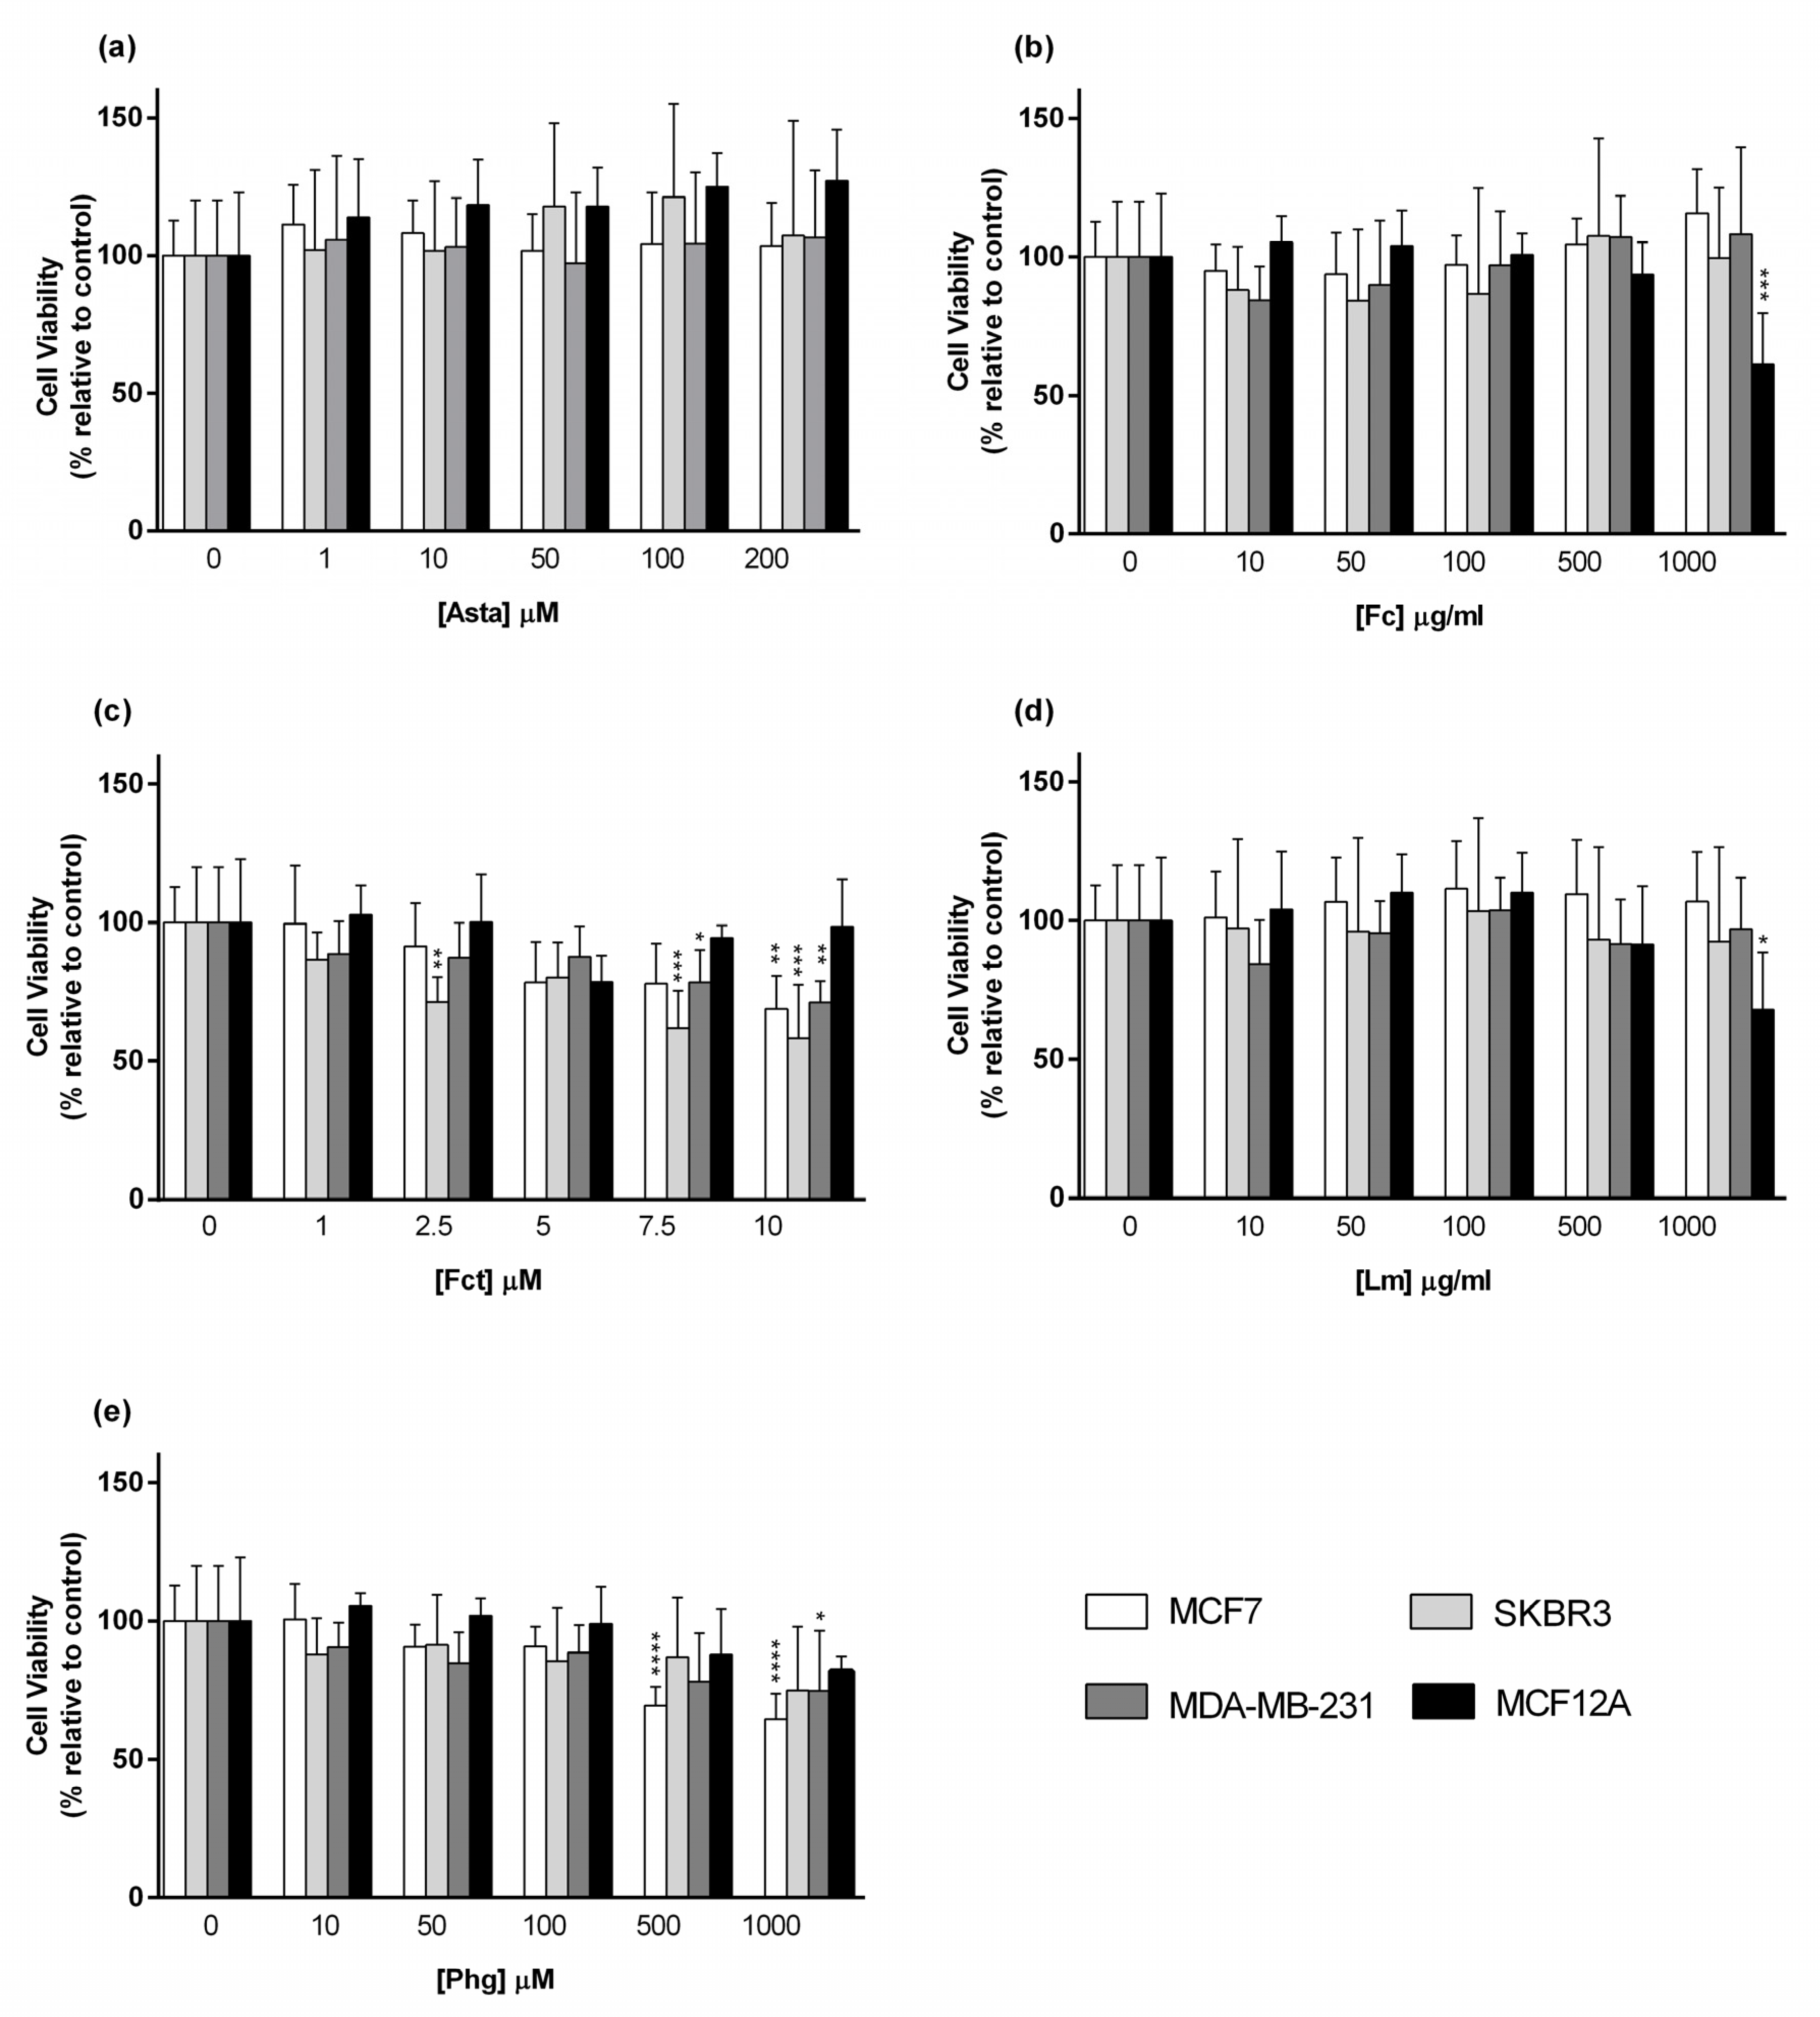
3.1. Cytotoxic Effect of Seaweed Bioactive Compounds
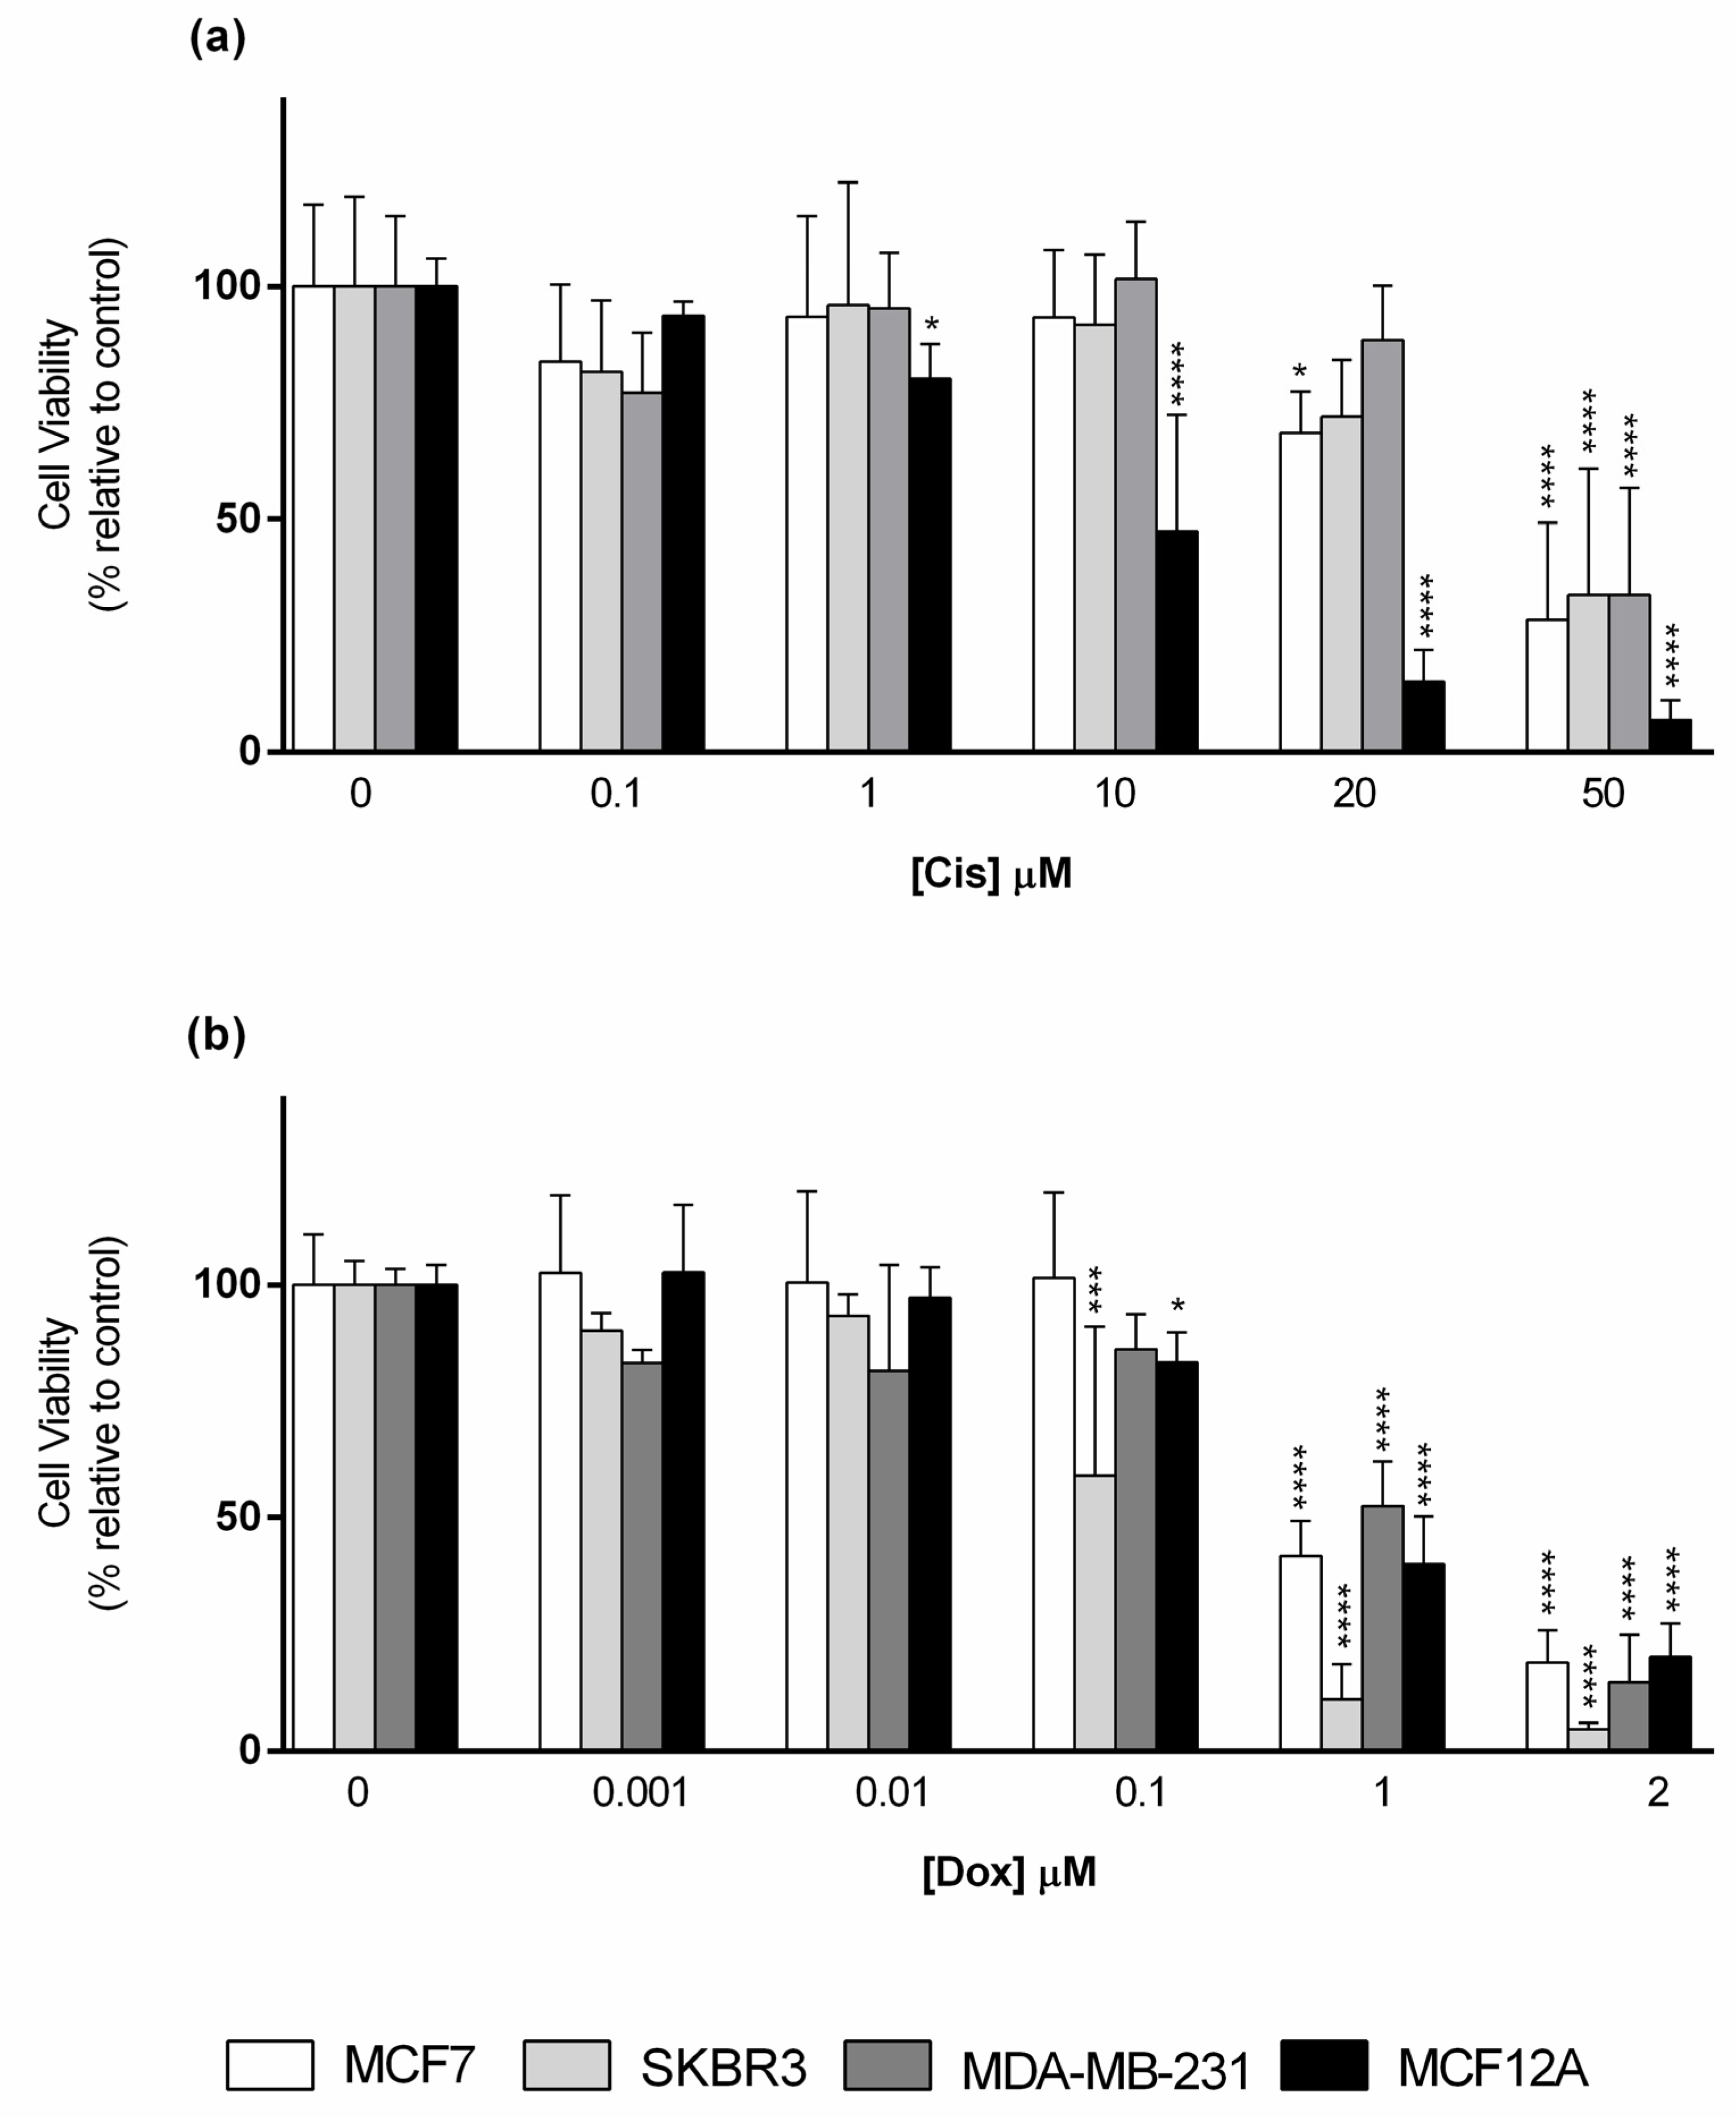
3.2. Cytotoxic Effect of the Reference Drugs–Cisplatin and Doxorubicin
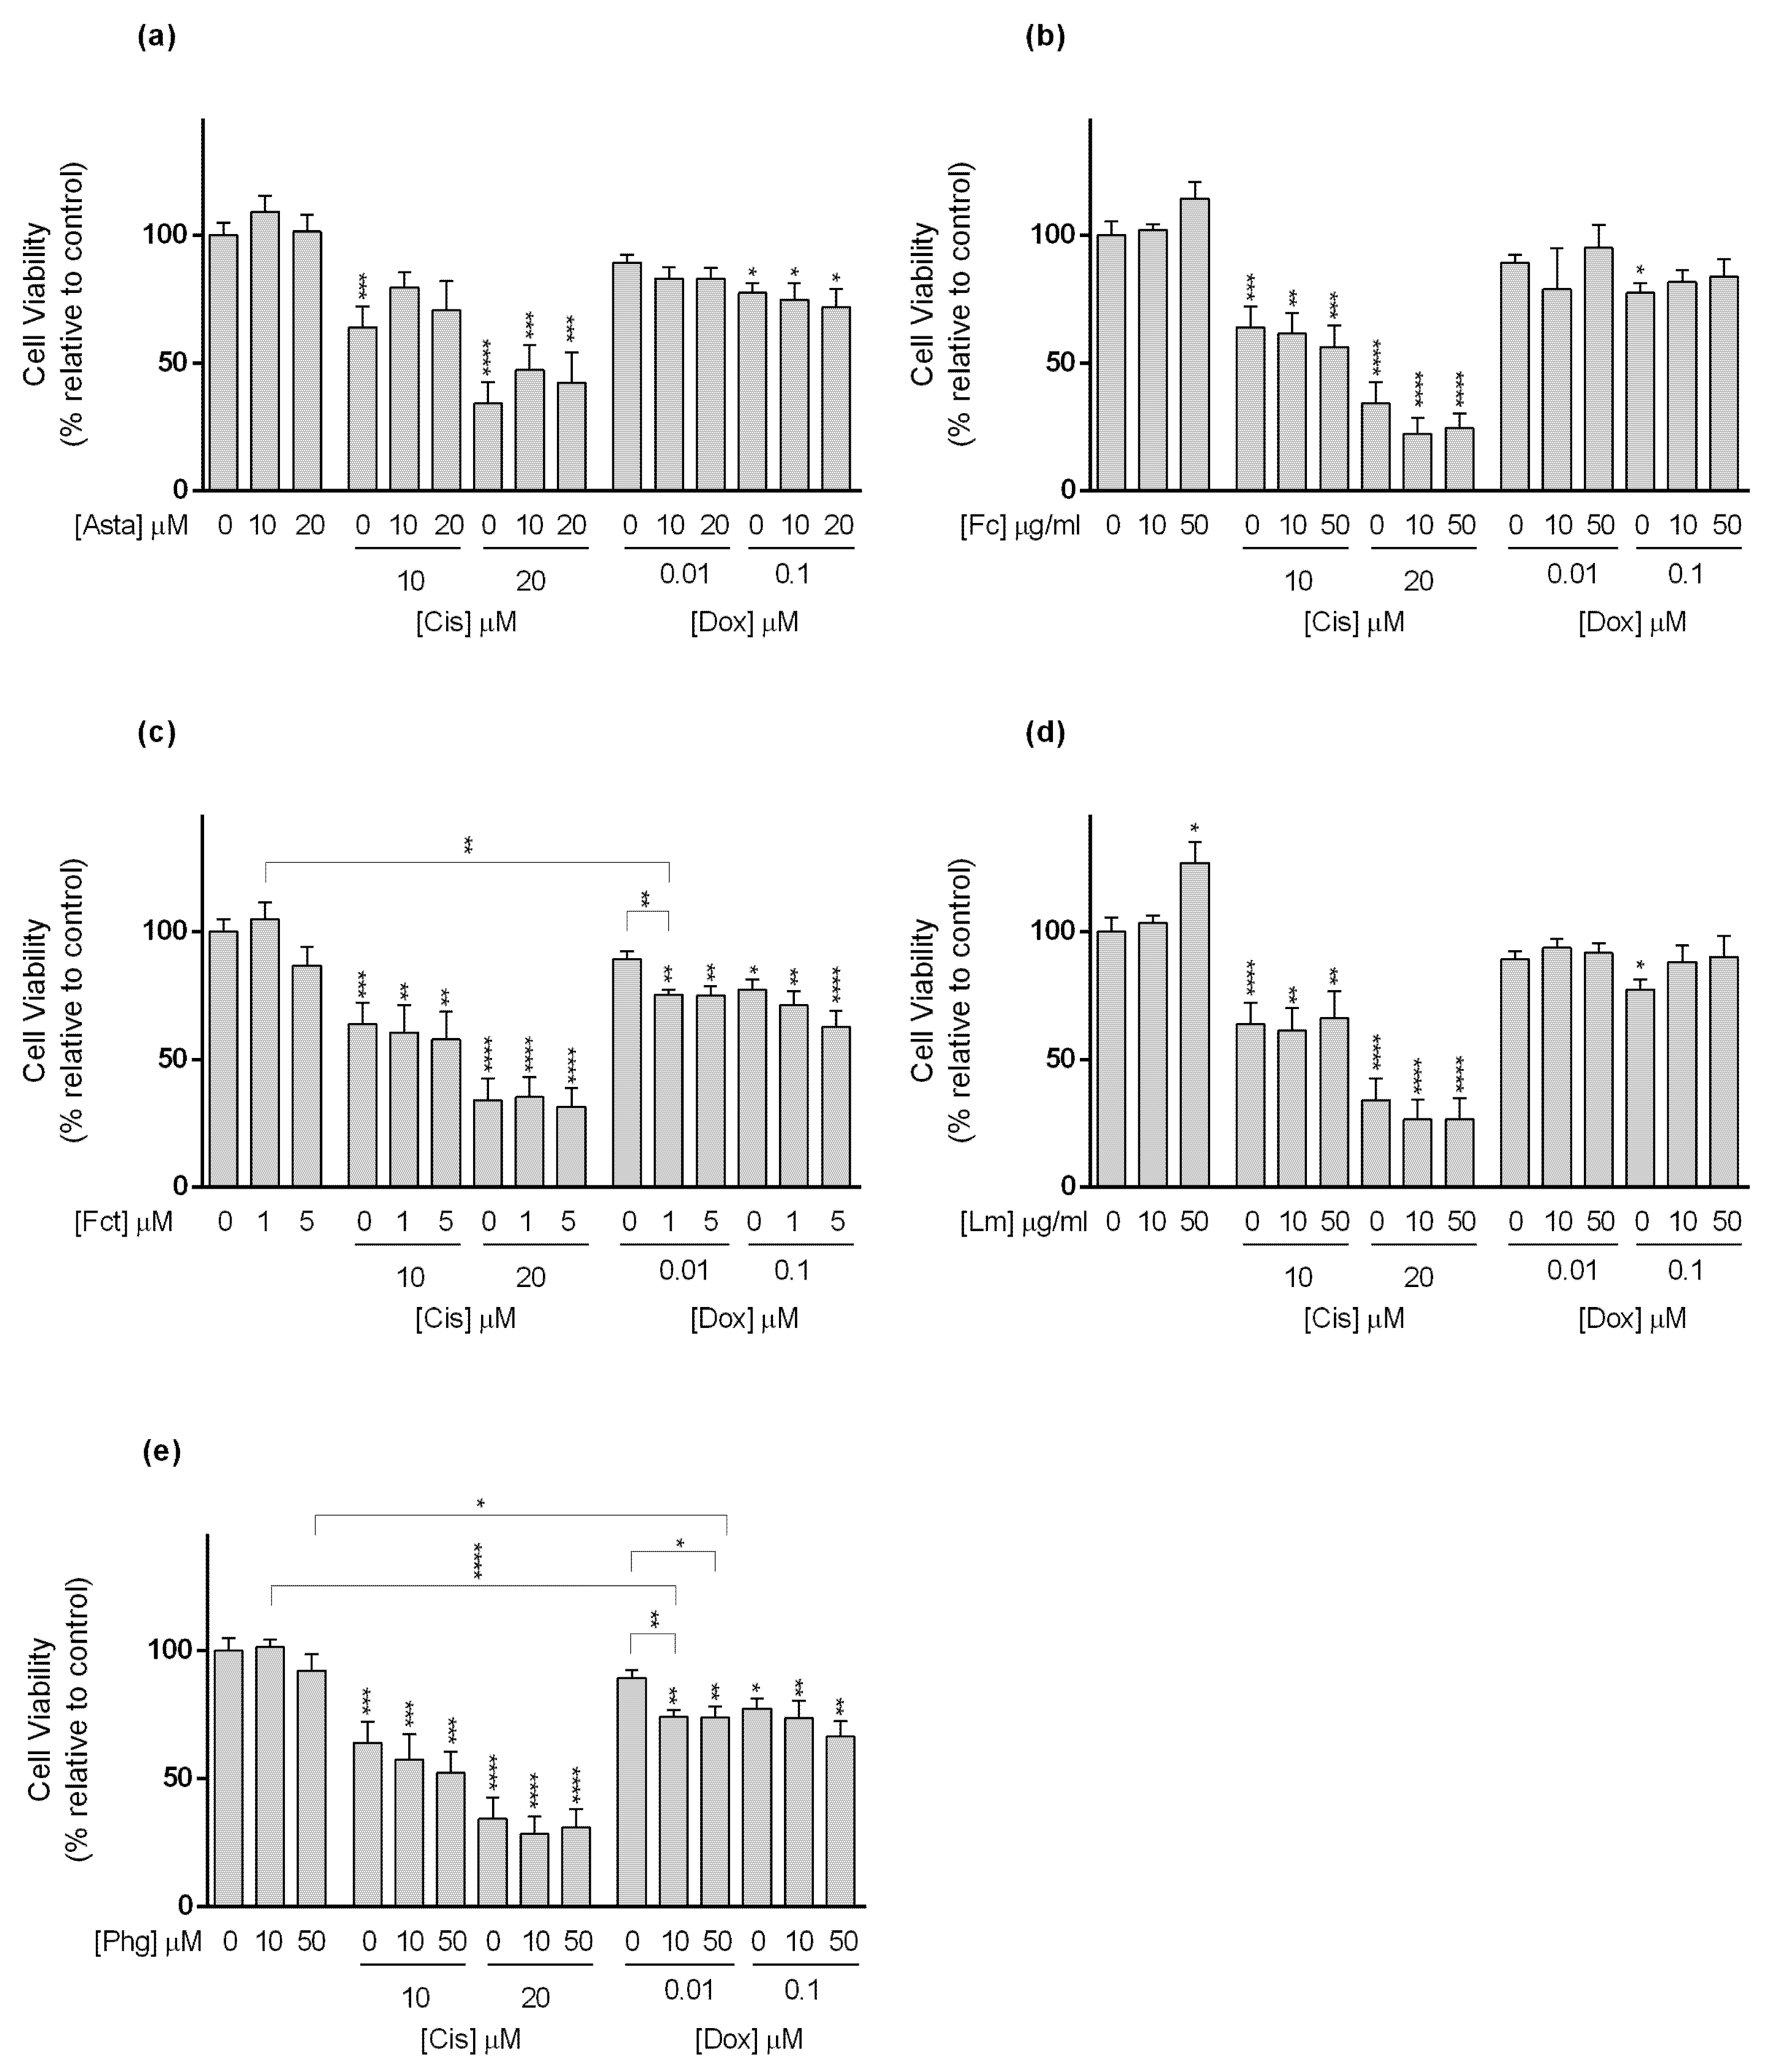
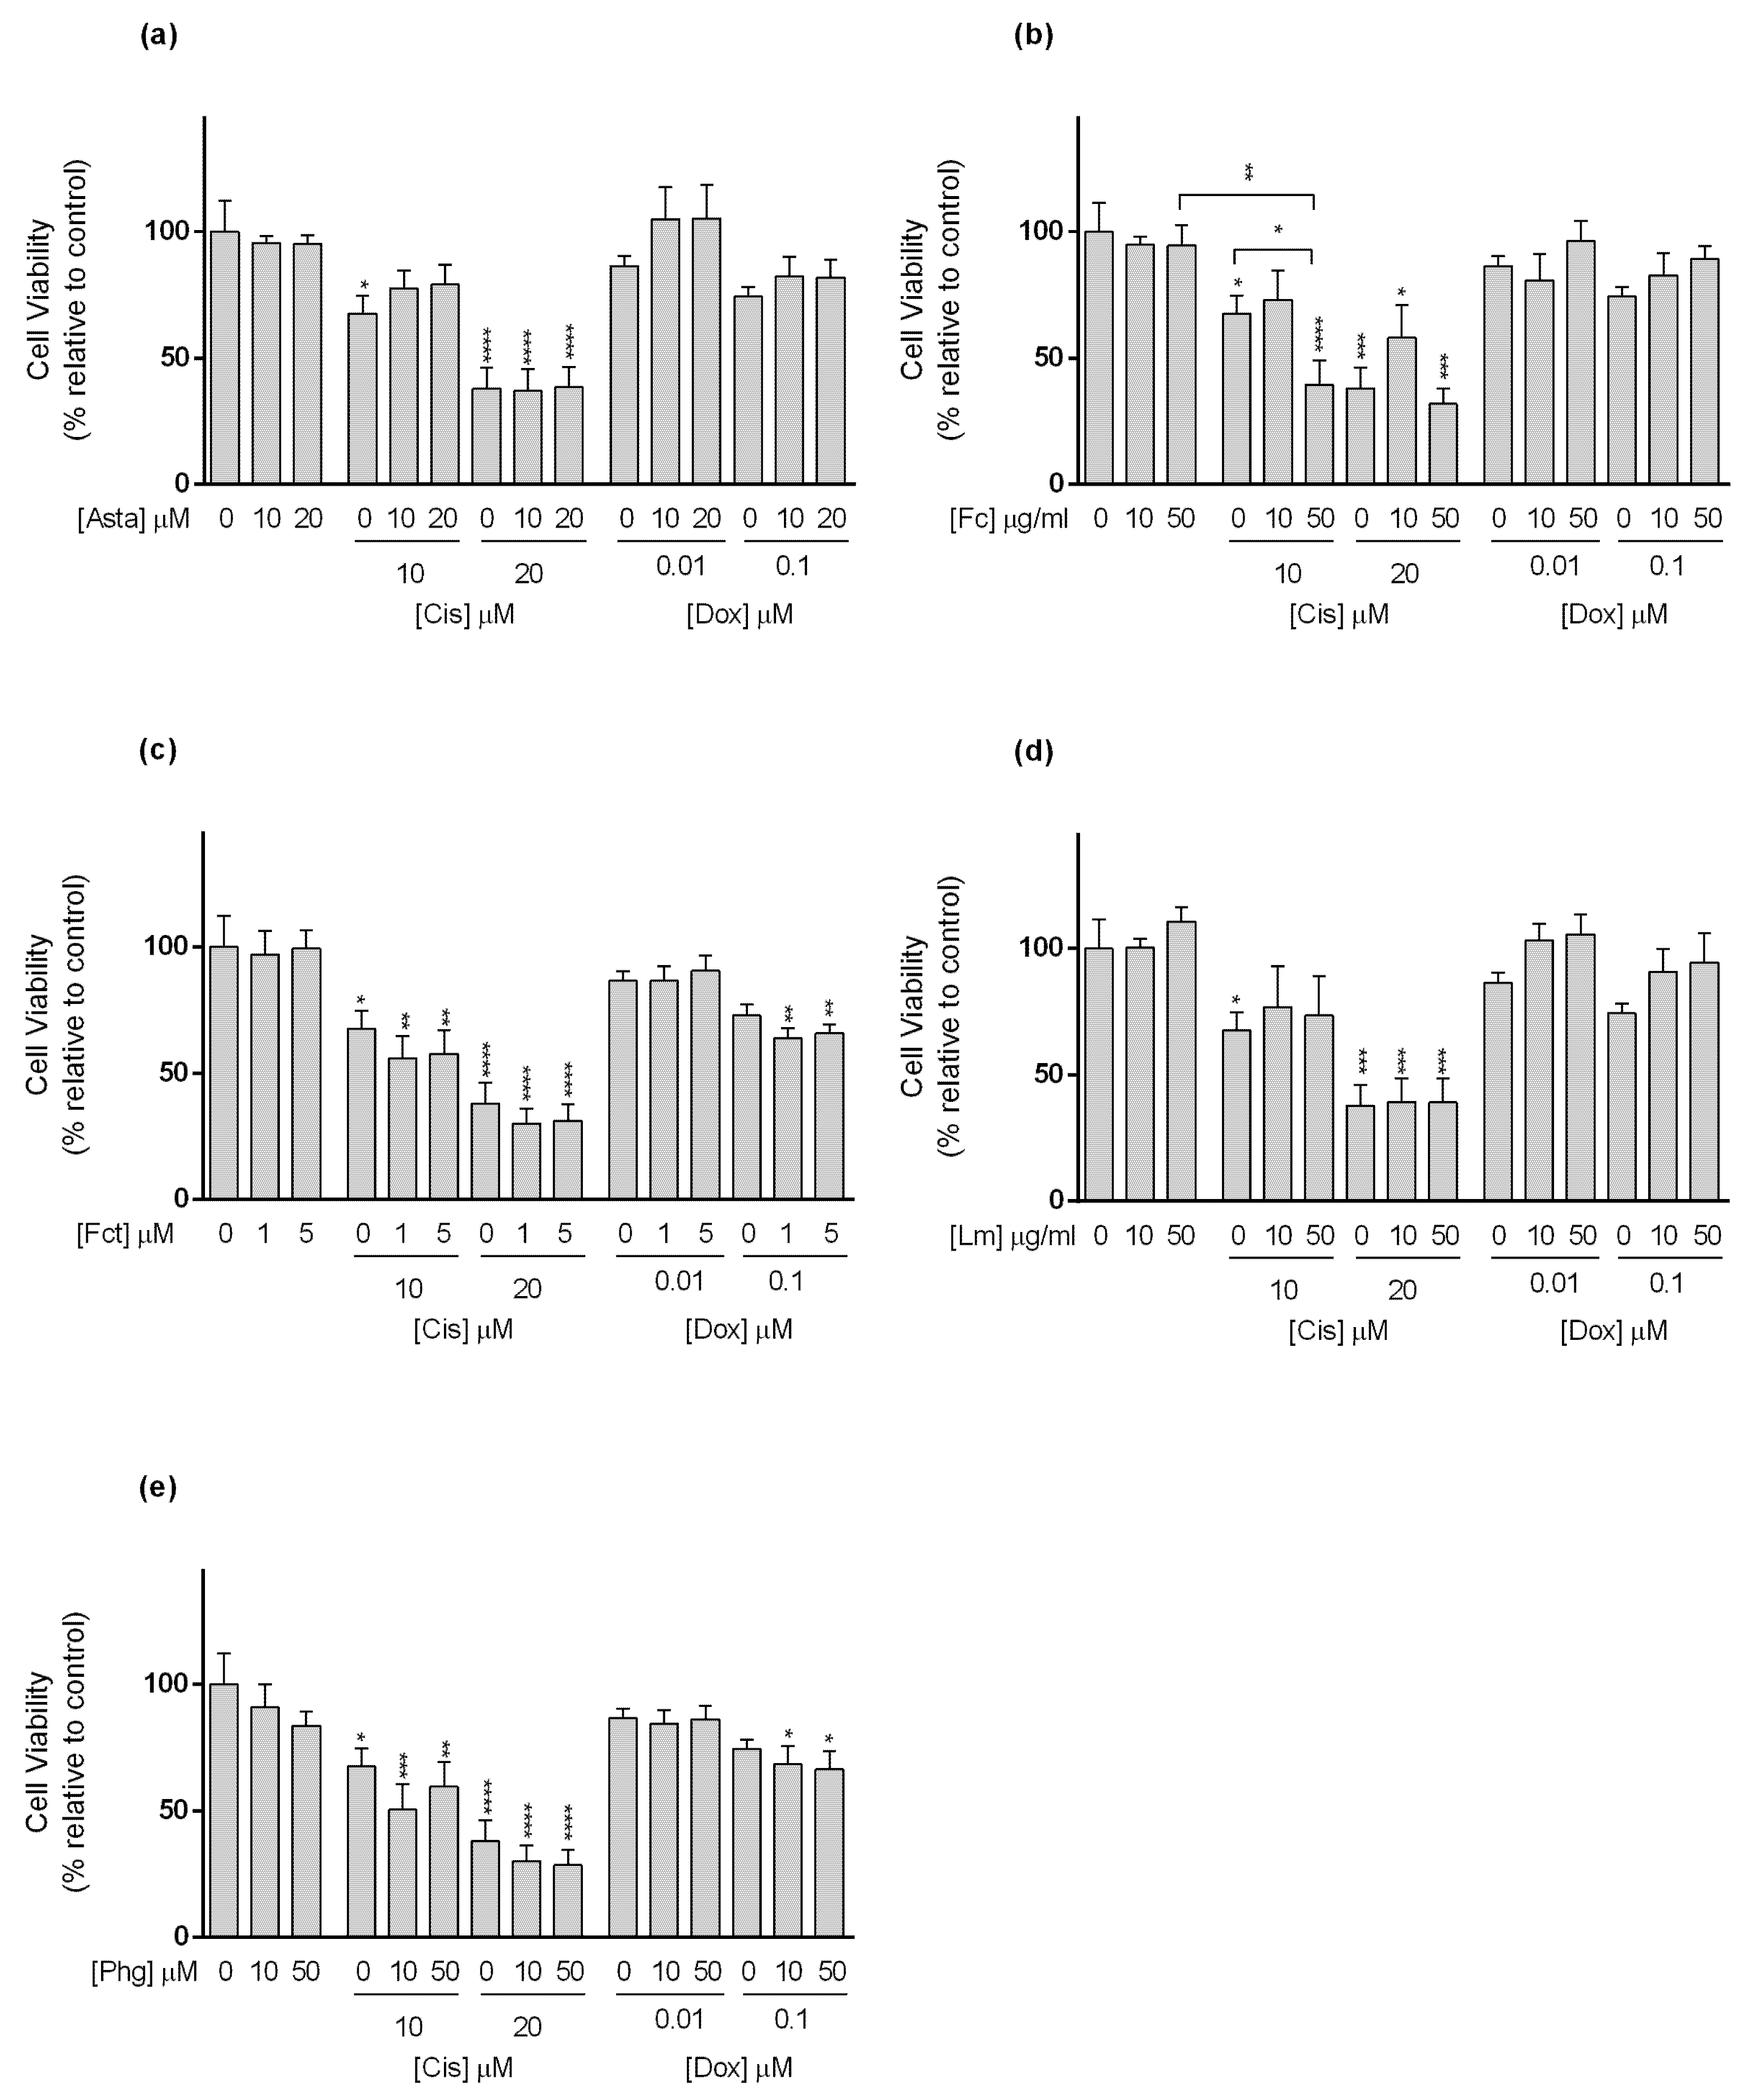
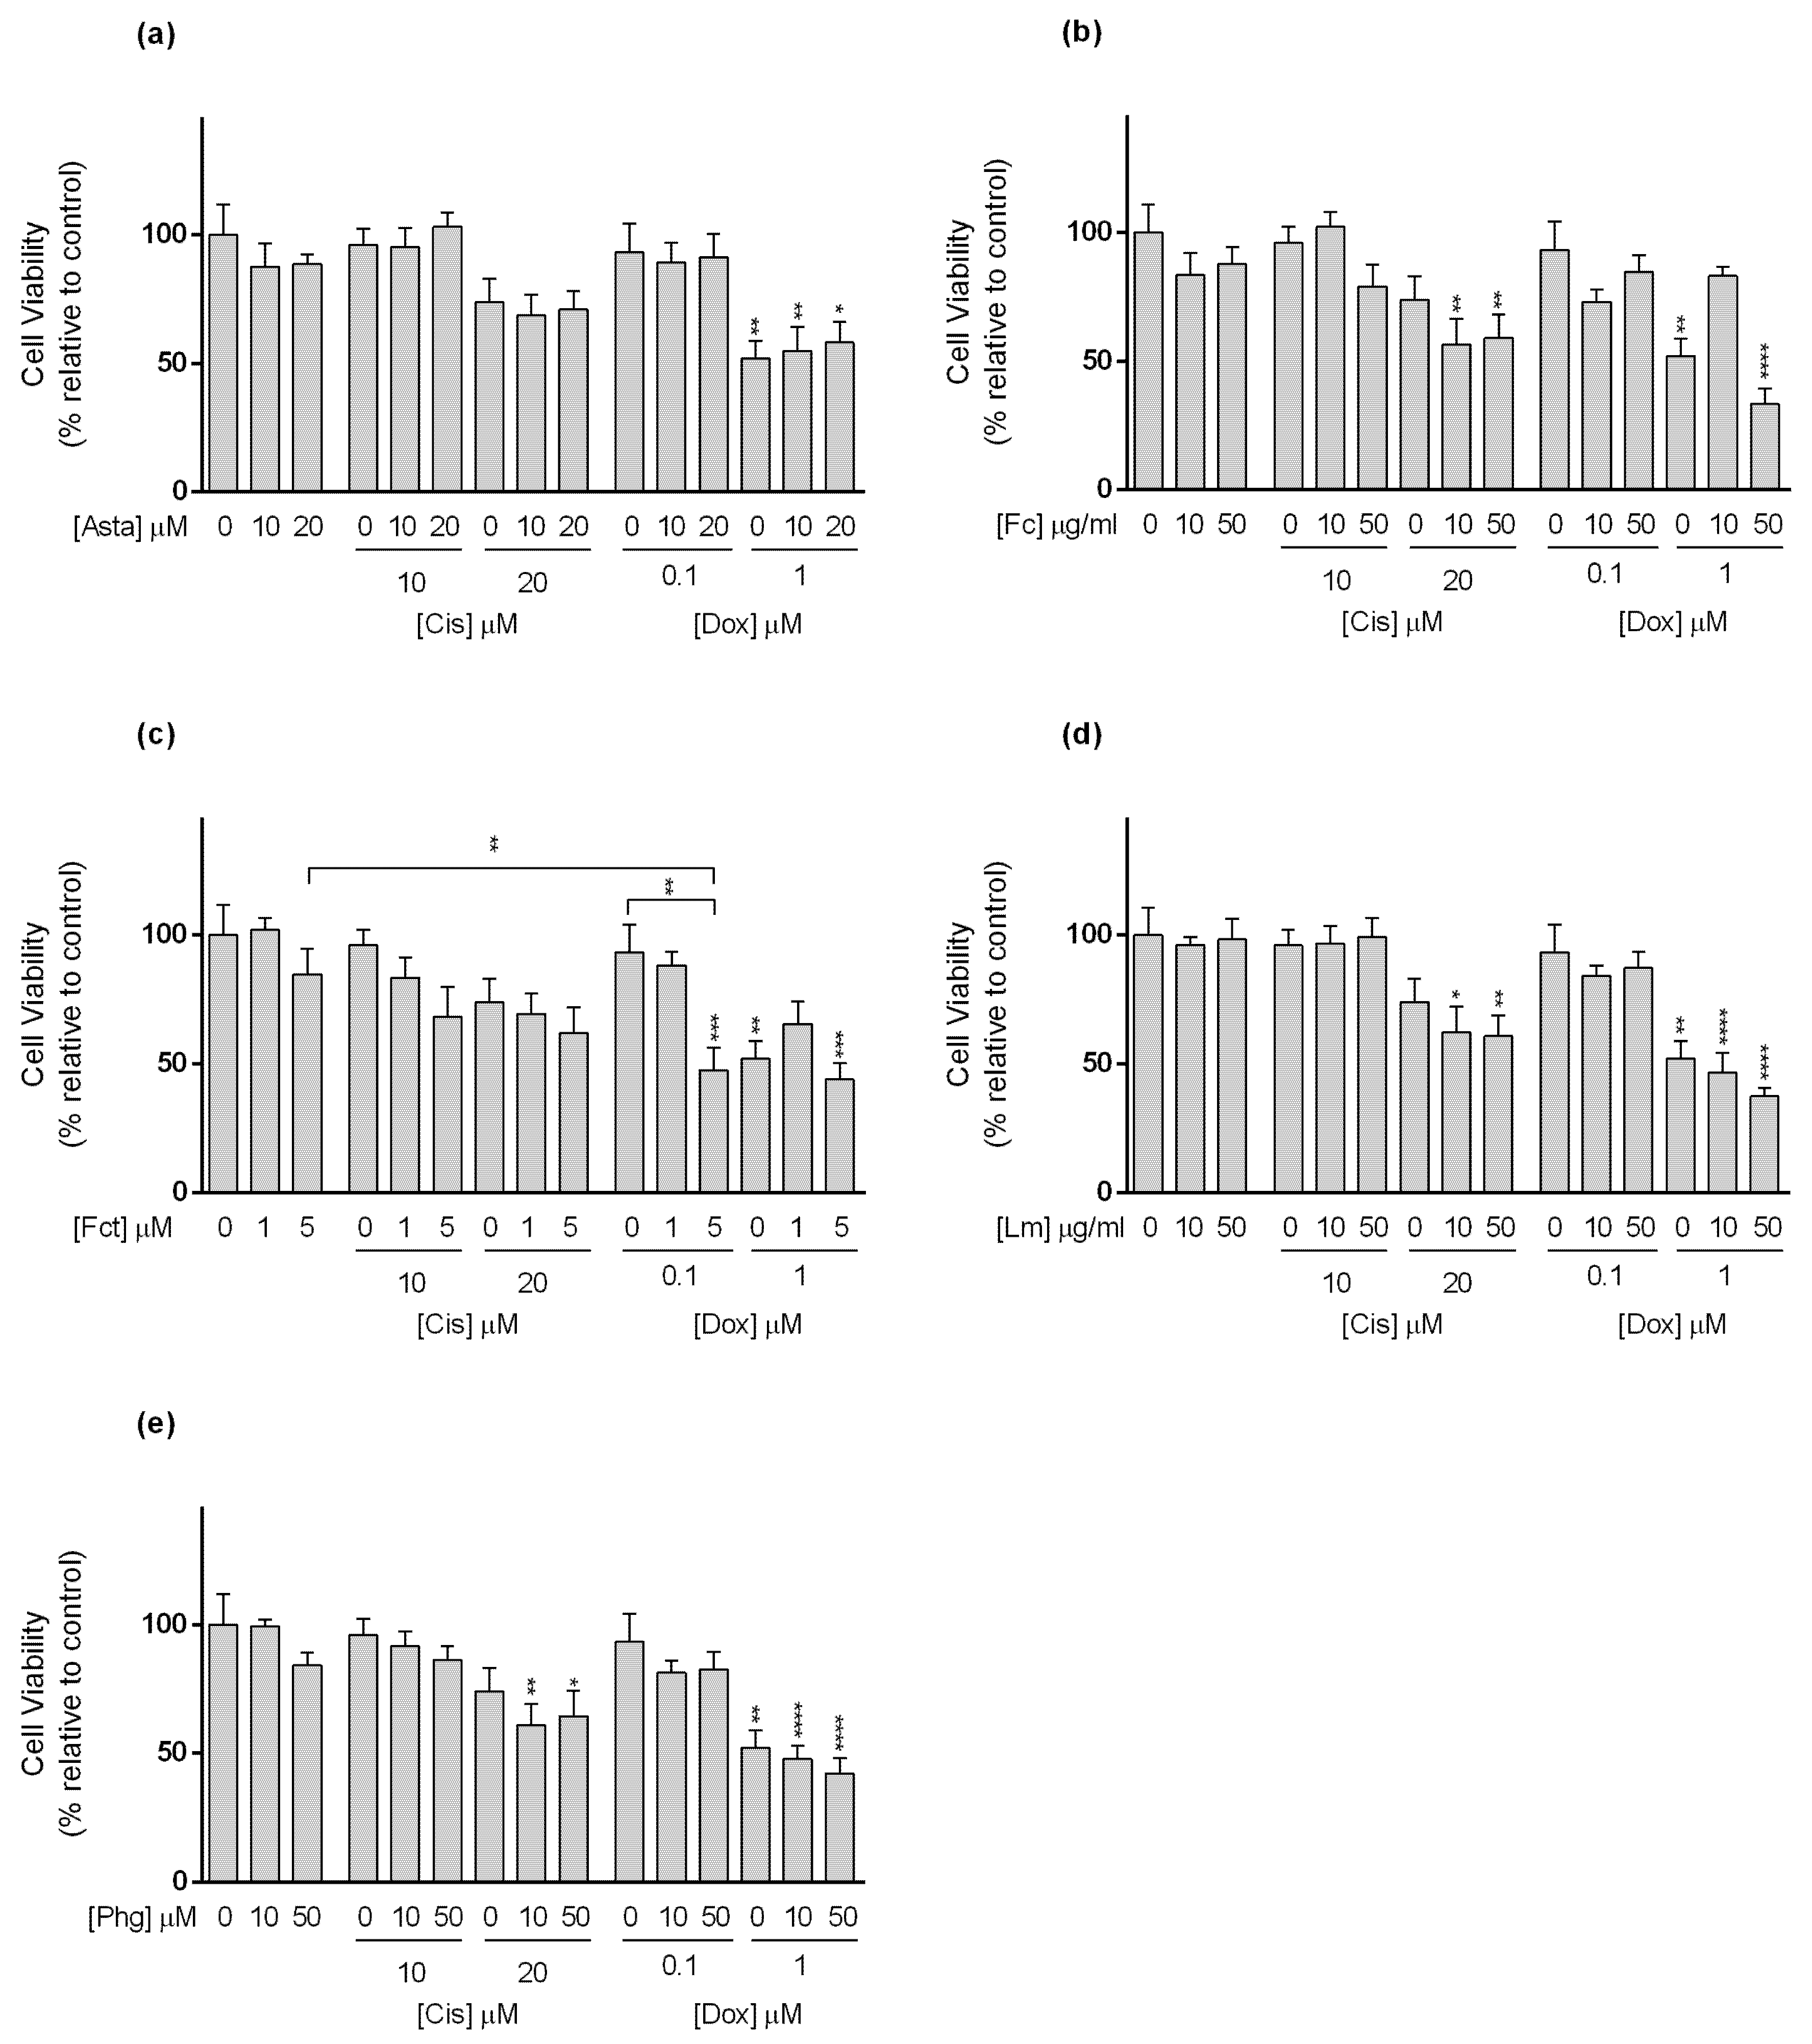
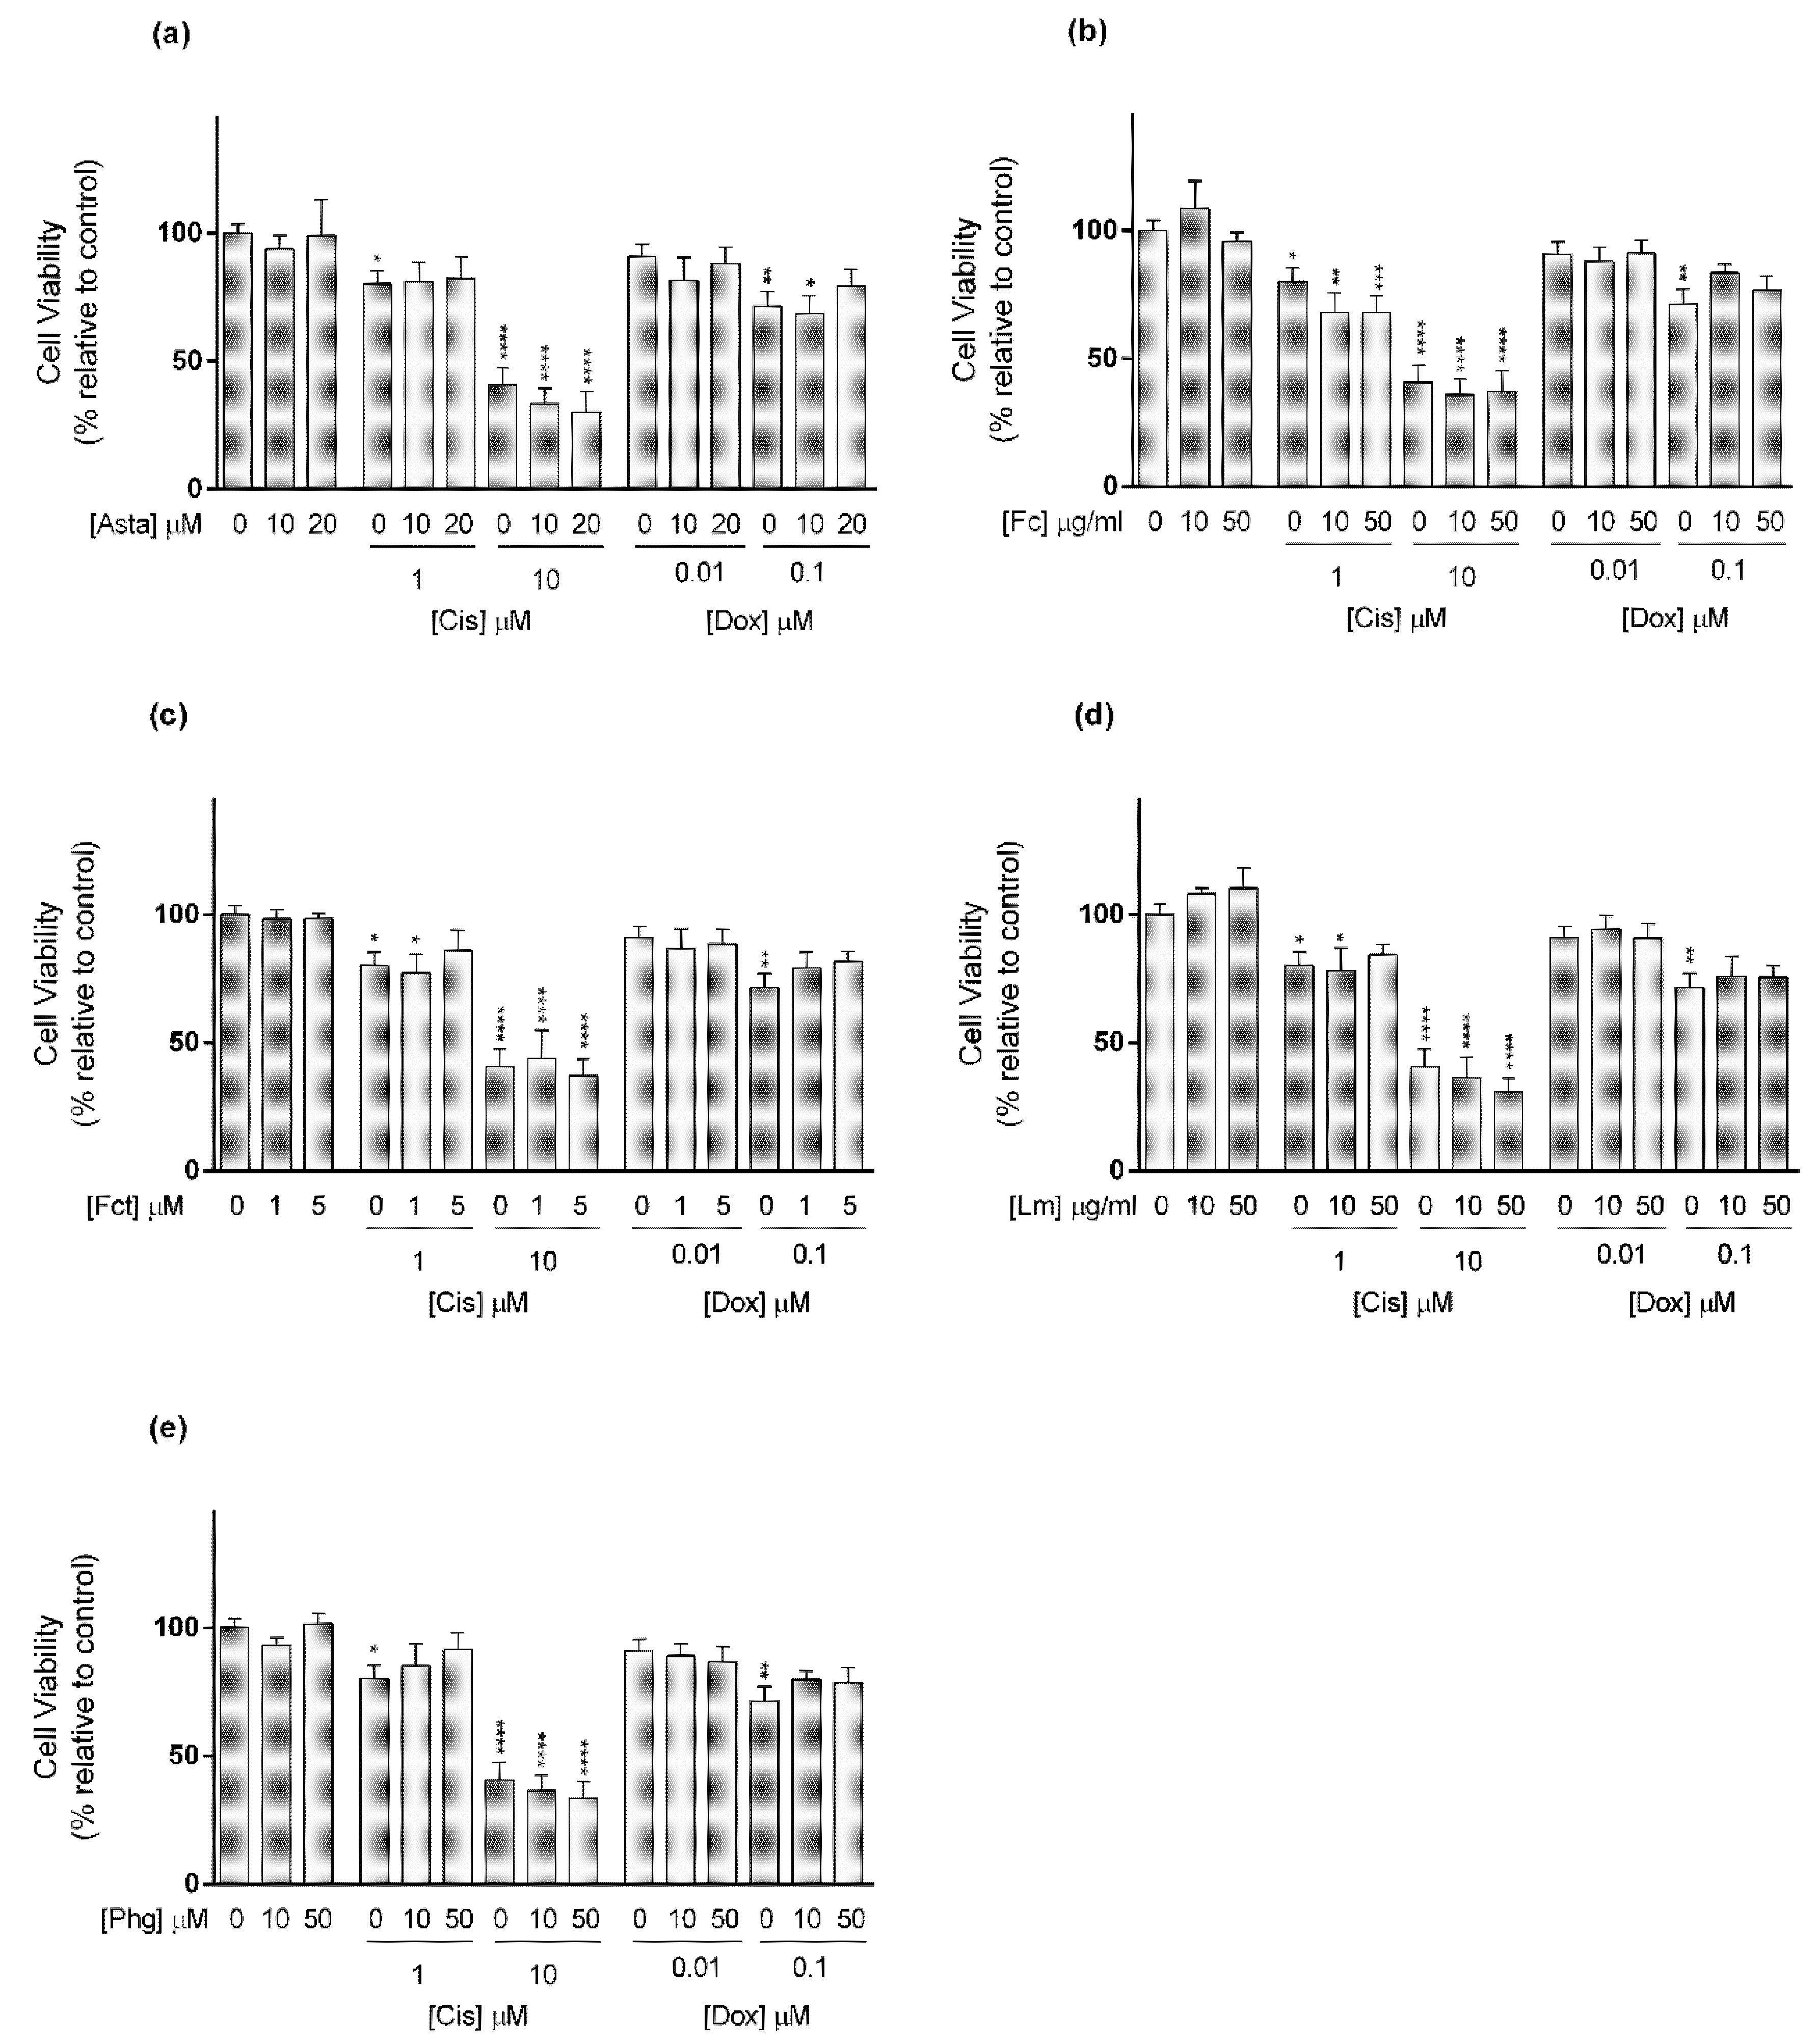
3.3. Cytotoxic Effect of Selected Combinations of Seaweed Bioactive Compound Plus Reference Drug
3.4. Comparative Study of One Promising Combination—Monolayer vs. 3D Cultures
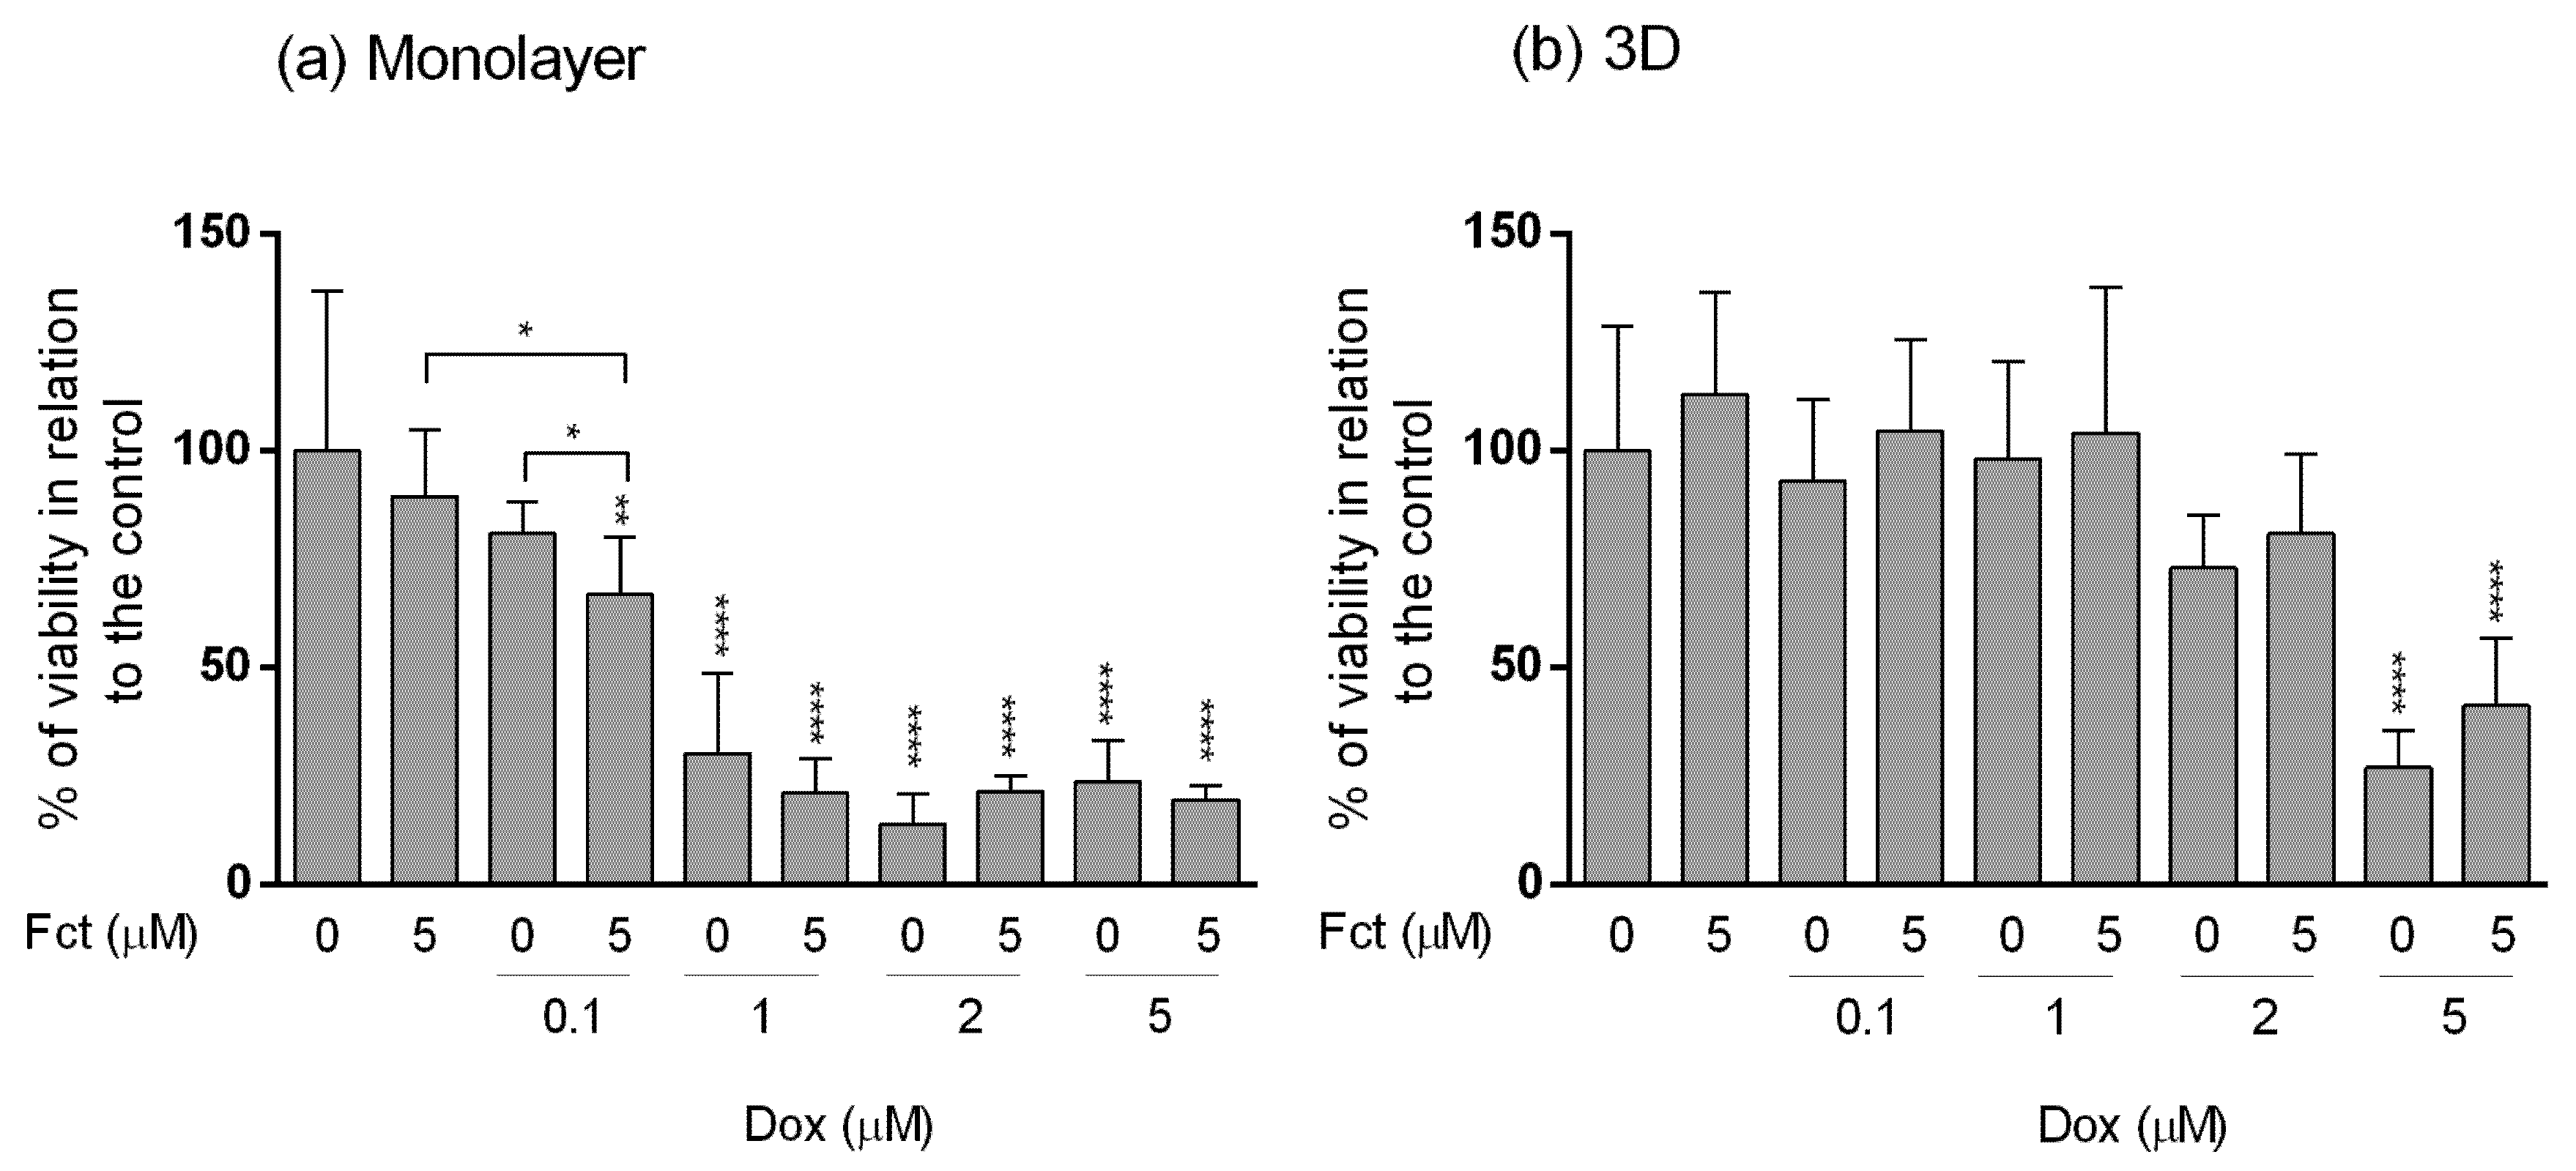
3.4.1. MTT Assay
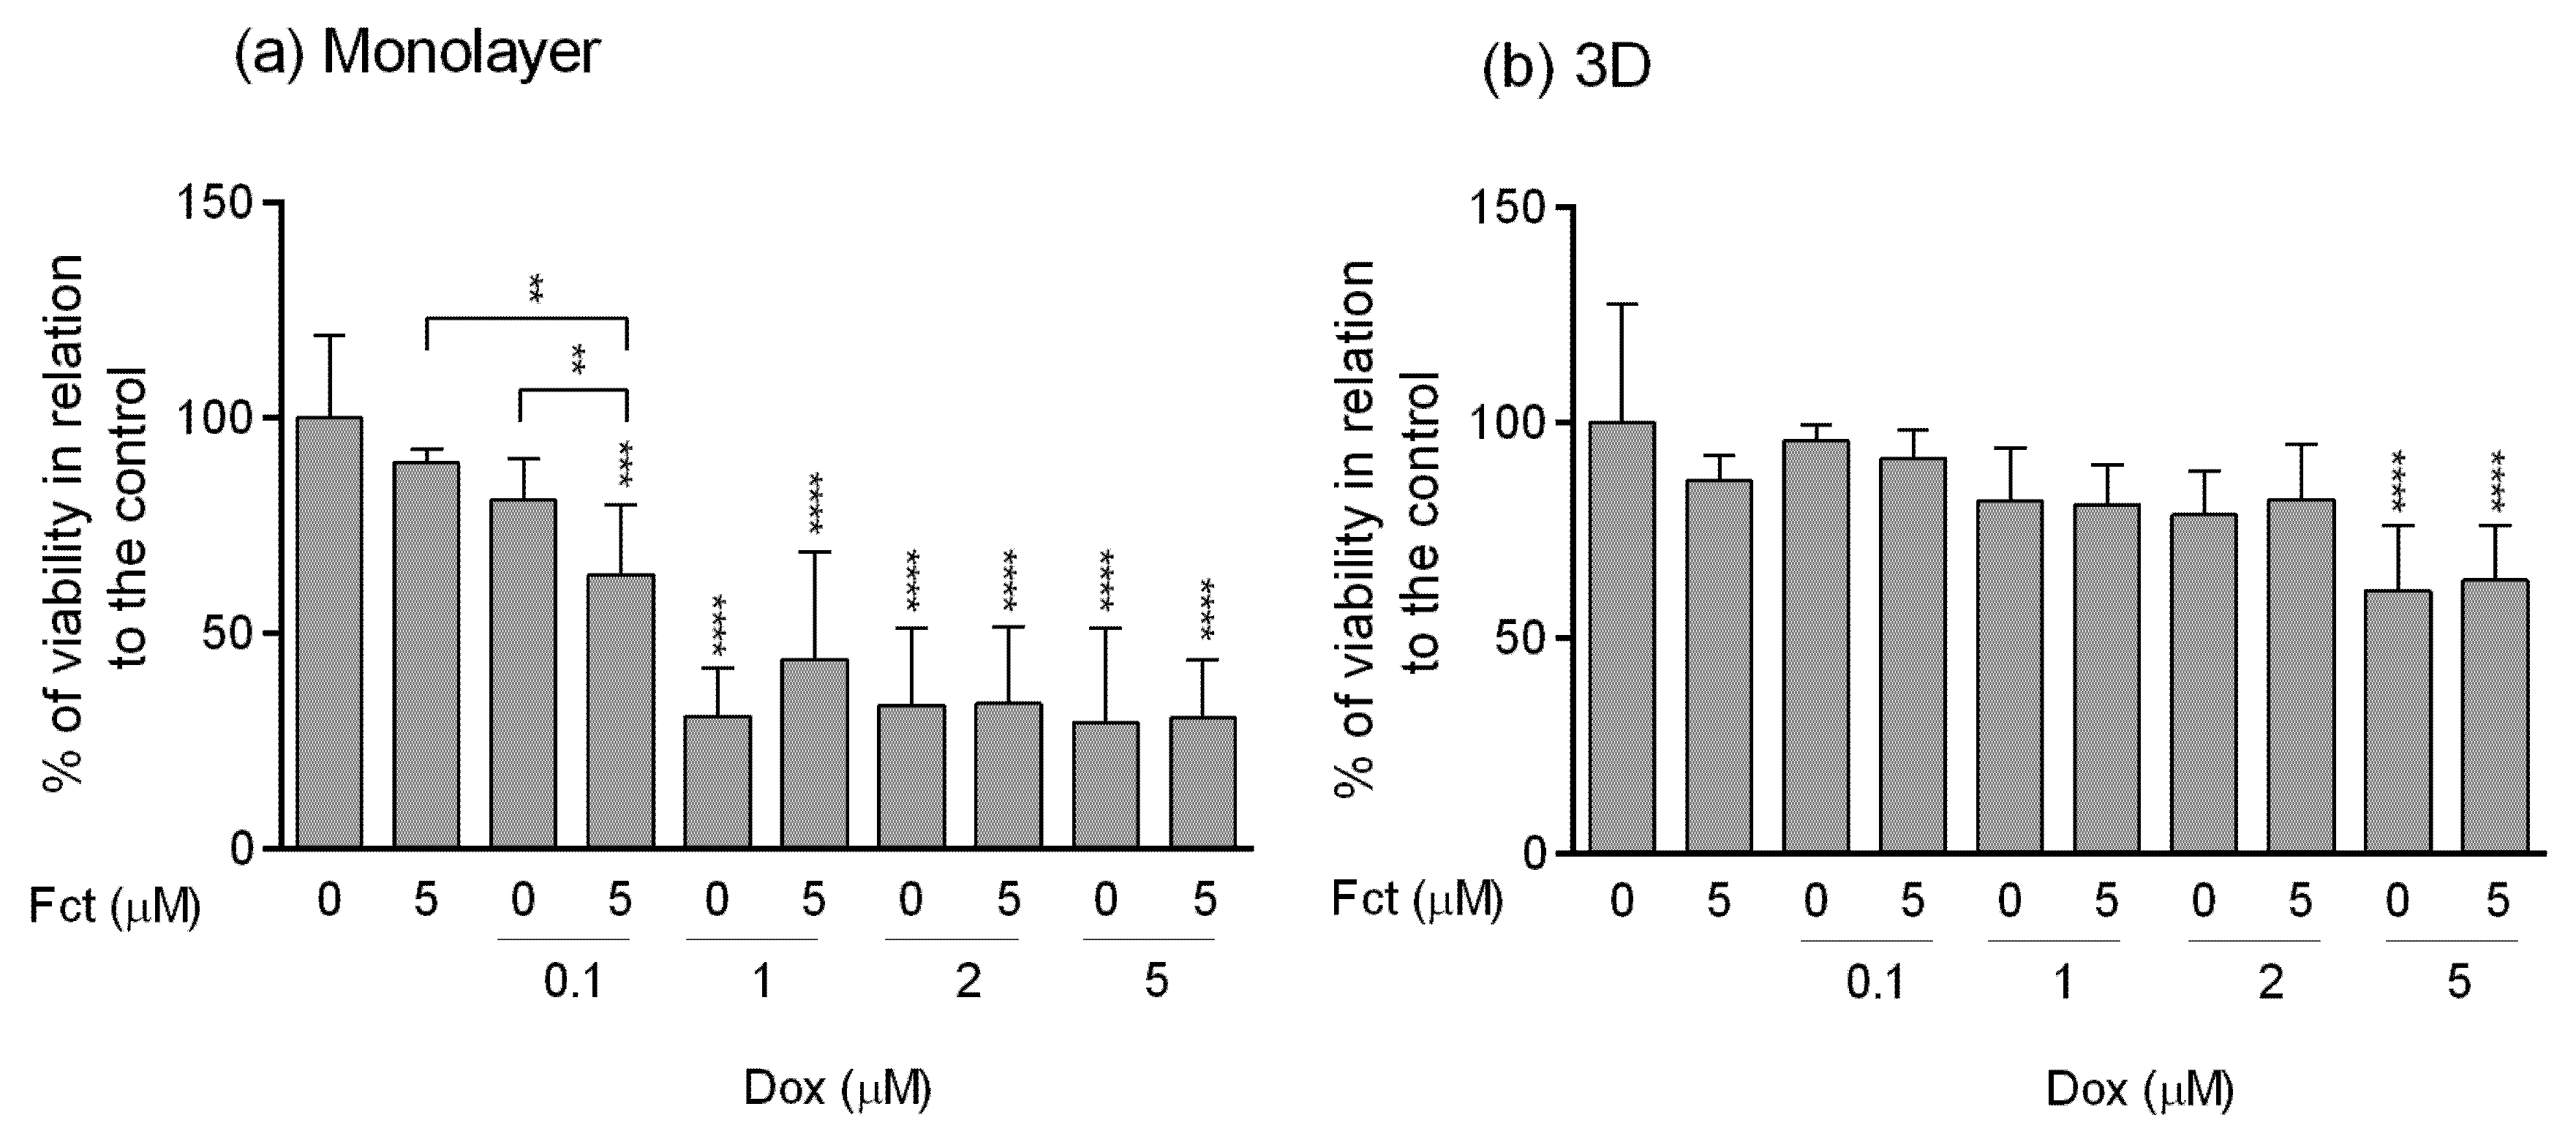
3.4.2. Resazurin Assay
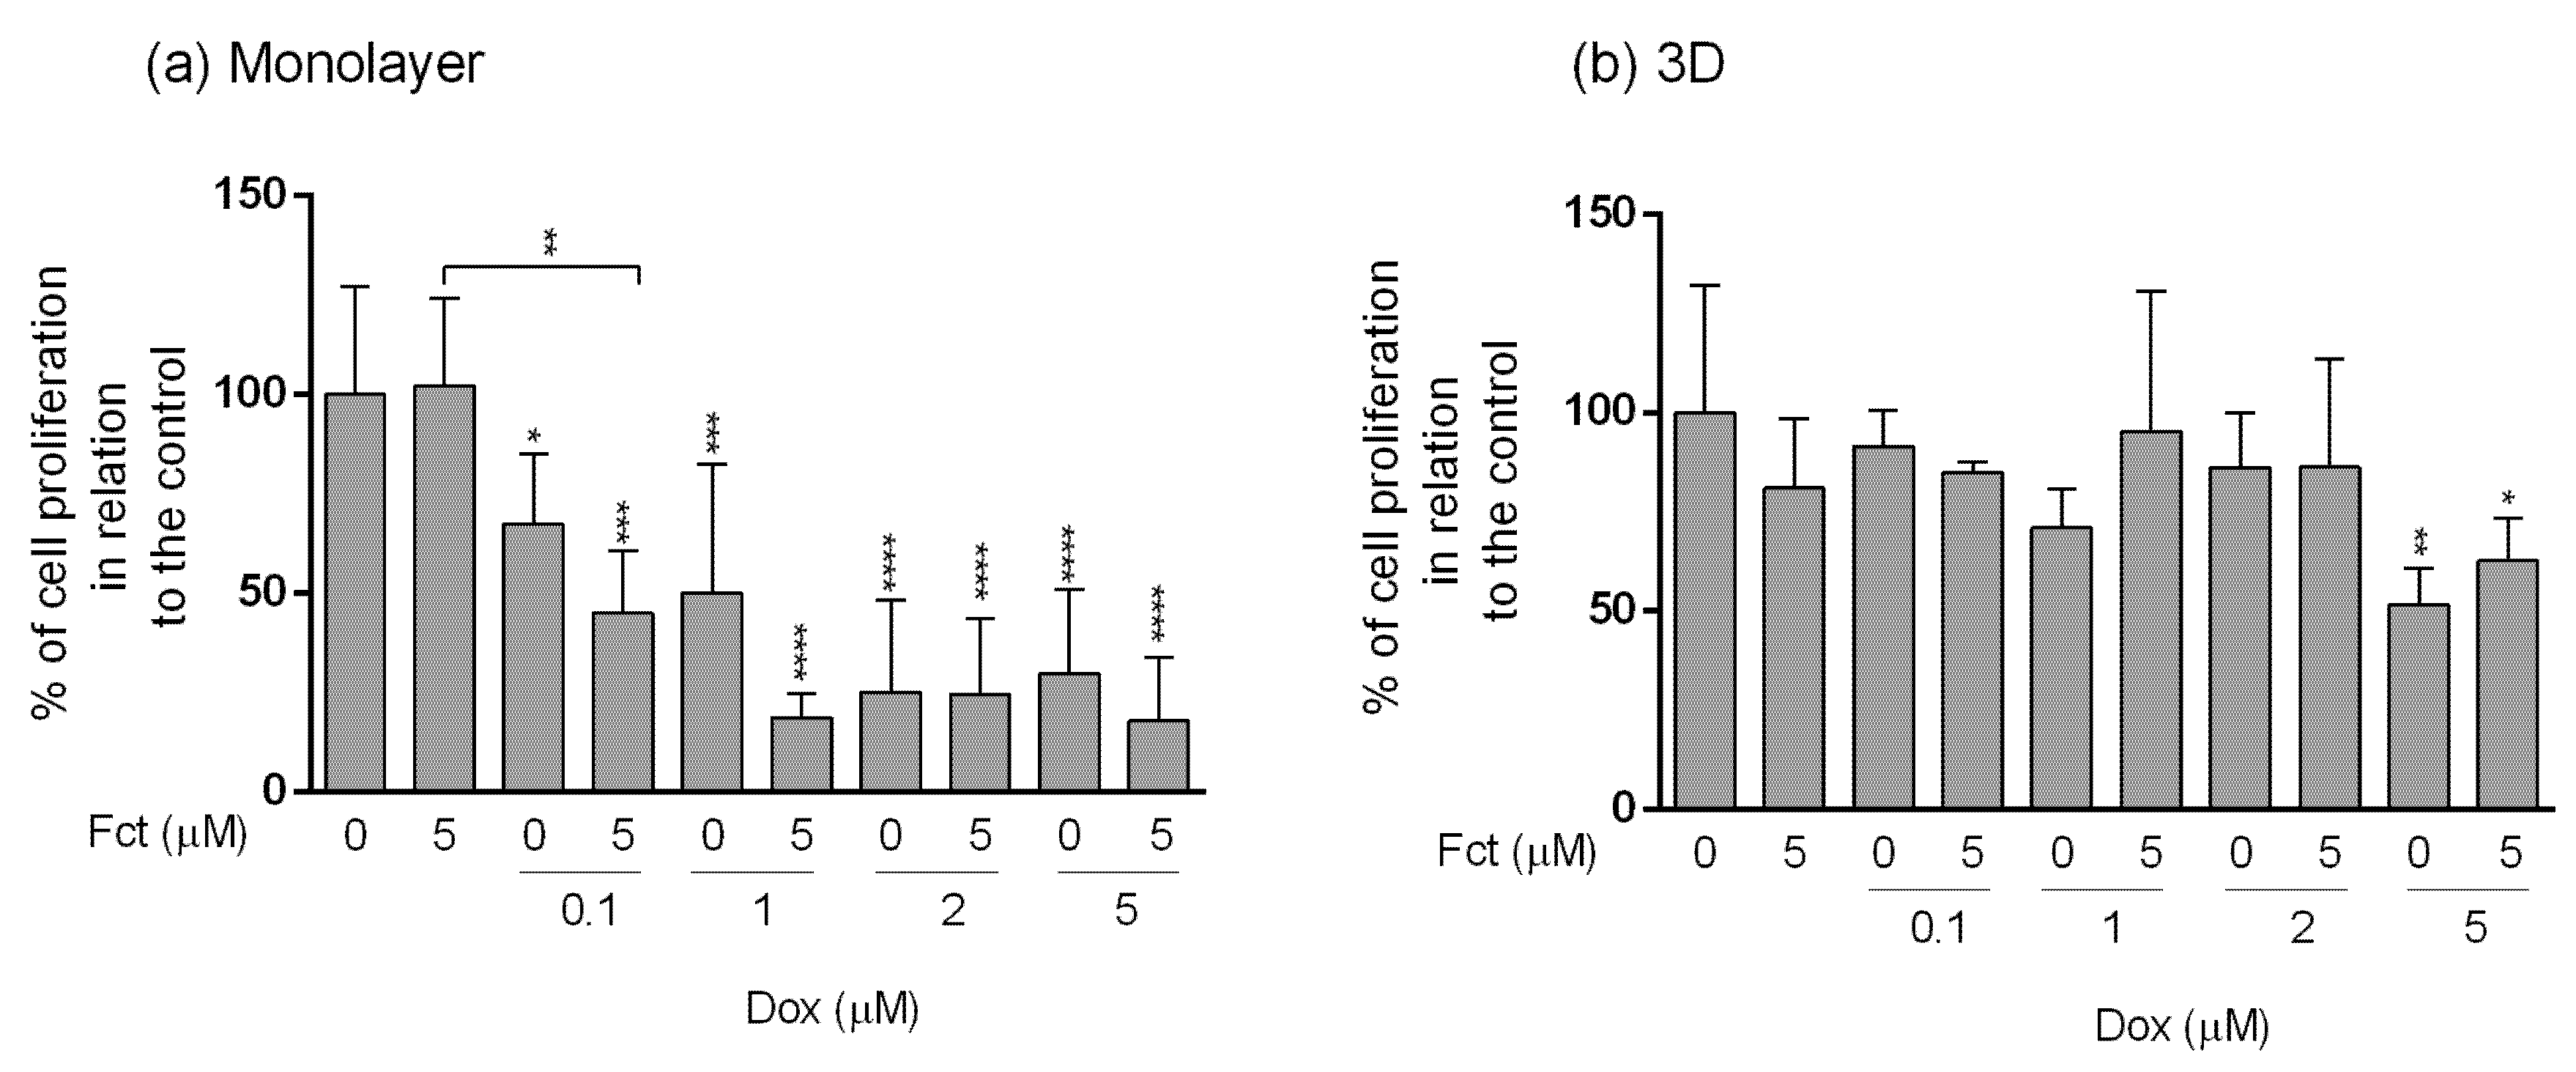
3.4.3. Assessment of Cell Proliferation
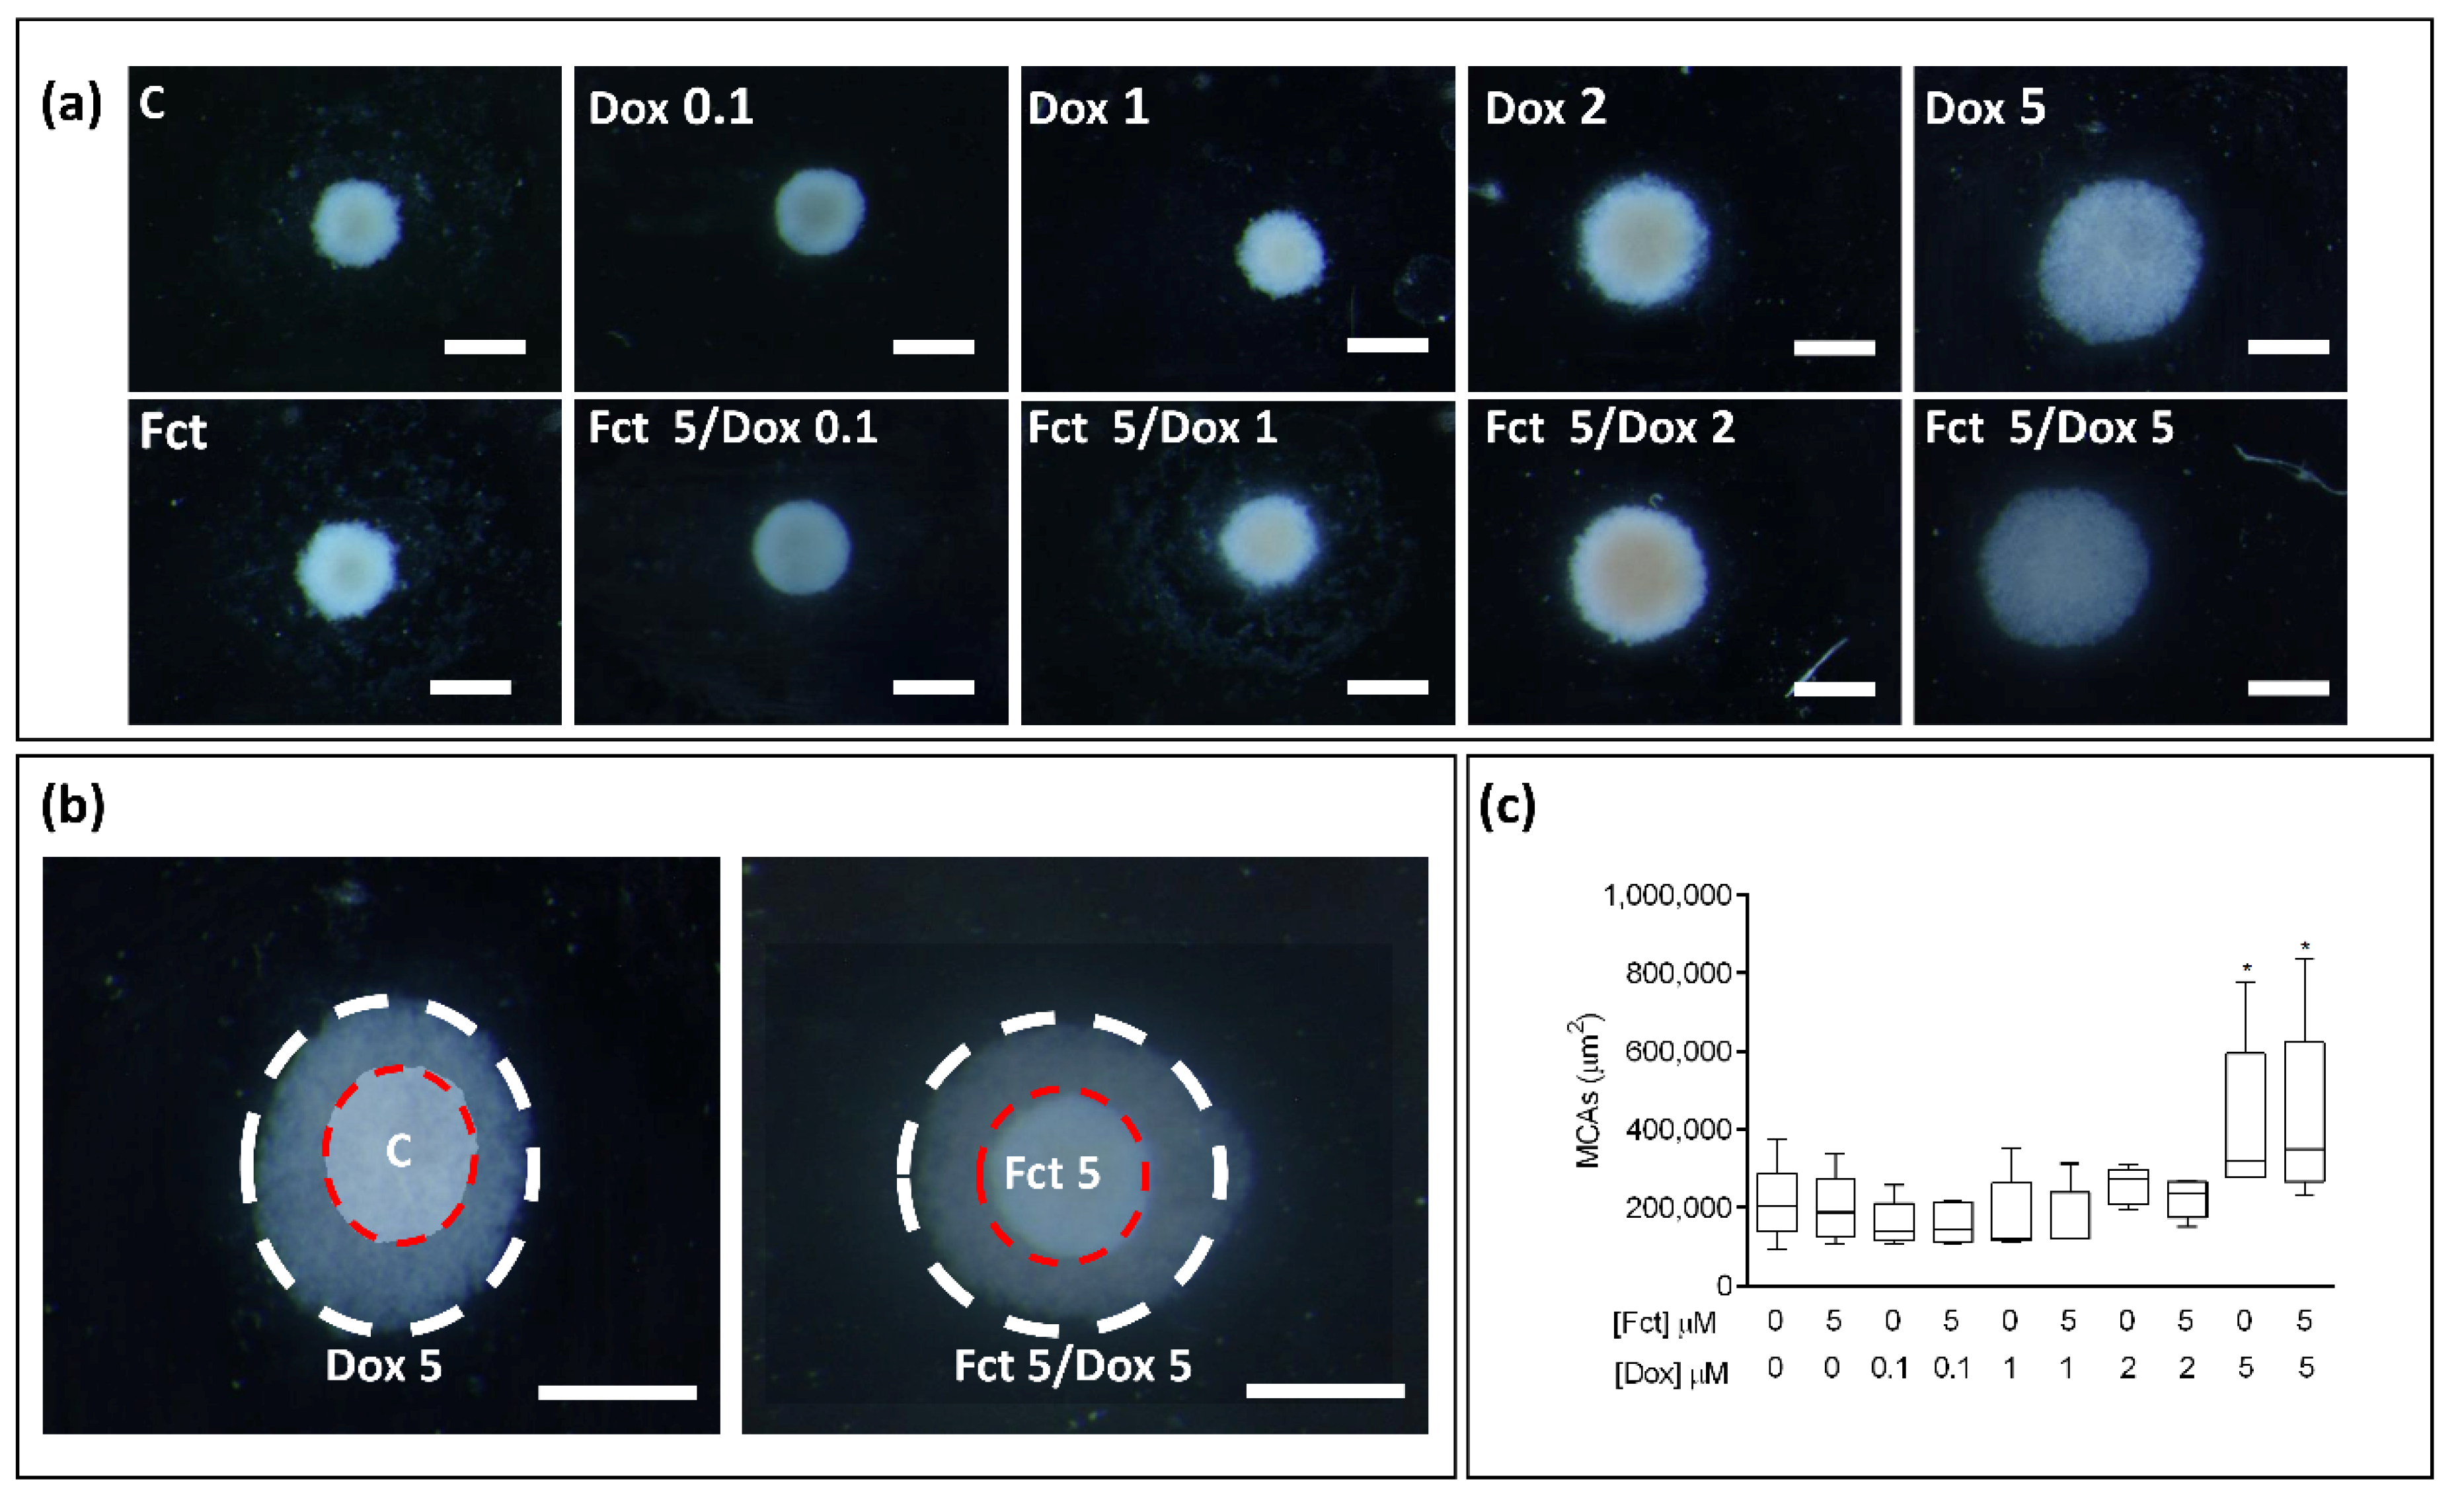
3.4.4. Morphological Analysis of 3D Cultures (MCAs)
MCAs Measurements
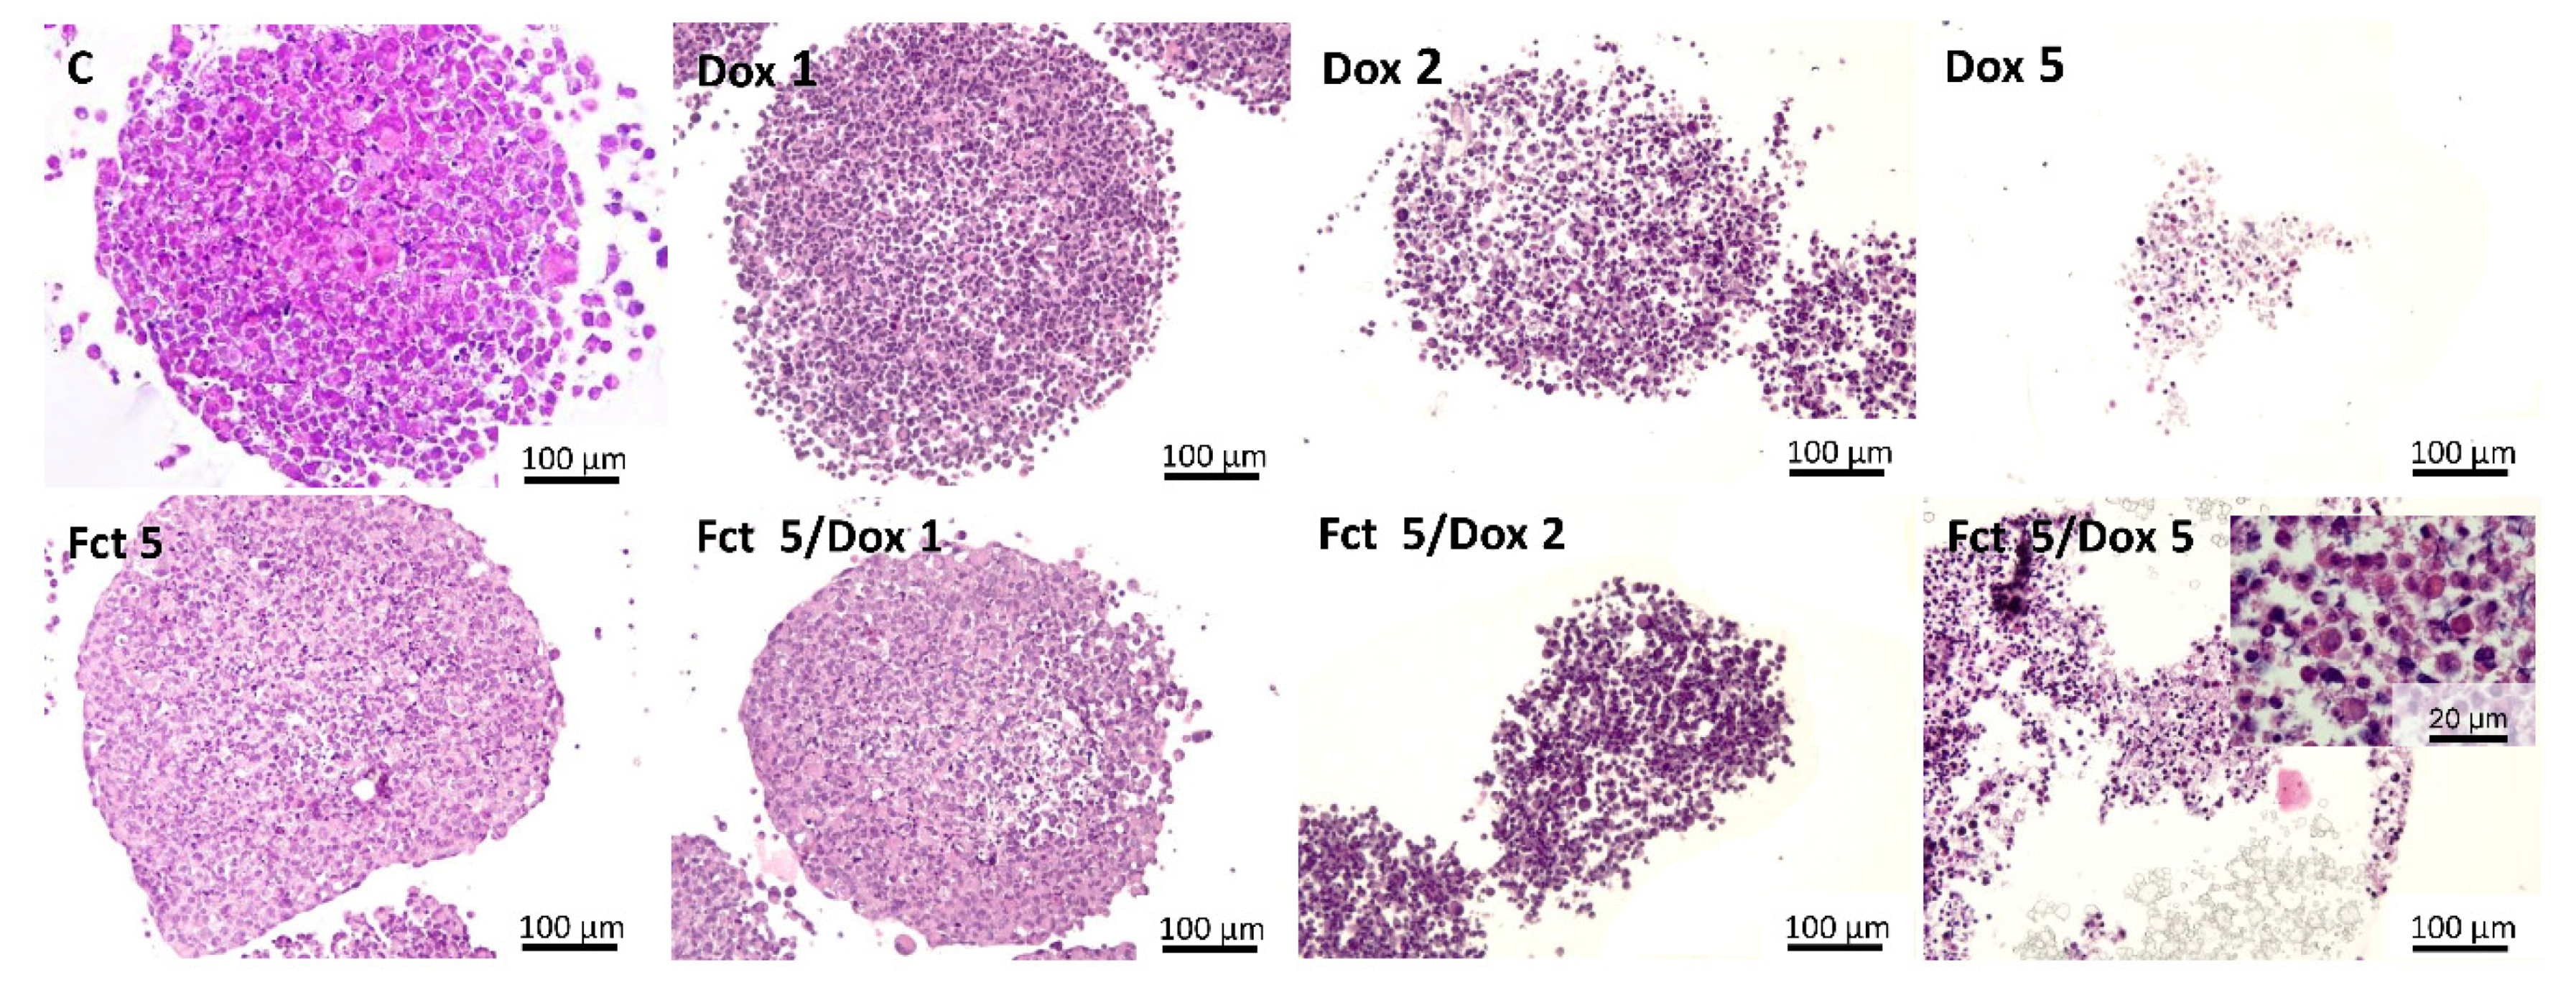
Histological and Immunocytochemical Analysis
4. Discussion
5. Conclusions
Author Contributions
Funding
Institutional Review Board Statement
Informed Consent Statement
Data Availability Statement
Conflicts of Interest
References
- Bray, F.; Ferlay, J.; Soerjomataram, I.; Siegel, R.L.; Torre, L.A.; Jemal, A. Global cancer statistics 2018: GLOBOCAN estimates of incidence and mortality worldwide for 36 cancers in 185 countries. CA Cancer J. Clin. 2018, 68, 394–424. [Google Scholar] [CrossRef] [PubMed] [Green Version]
- Akram, M.; Iqbal, M.; Daniyal, M.; Khan, A.U. Awareness and current knowledge of breast cancer. Biol. Res. 2017, 50, 33. [Google Scholar] [CrossRef] [PubMed] [Green Version]
- Moo, T.-A.; Sanford, R.; Dang, C.; Morrow, M. Overview of breast cancer therapy. PET Clin. 2018, 13, 1244–1248. [Google Scholar] [CrossRef]
- Lin, Y.; Zhang, W.; Cao, H.; Li, G.; Du, W. Classifying breast cancer subtypes using deep neural networks based on multi-omics data. Genes 2020, 11, 888. [Google Scholar] [CrossRef] [PubMed]
- Fragomeni, S.M.; Sciallis, A.; Jeruss, J.S. Molecular subtypes and local-regional control of breast cancer. Surg. Oncol. Clin. N. Am. 2018, 27, 95–120. [Google Scholar] [CrossRef]
- Polyak, K. Heterogeneity in breast cancer. J. Clin. Investig. 2011, 121, 3786–3788. [Google Scholar] [CrossRef] [Green Version]
- Masoud, V.; Pagès, G. Targeted therapies in breast cancer: New challenges to fight against resistance. World J. Clin. Oncol. 2017, 8, 120–134. [Google Scholar] [CrossRef] [Green Version]
- Tremont, A.; Lu, J.; Cole, J.T. Endocrine therapy for early breast cancer: Updated review. Ochsner J. 2017, 17, 405–441. [Google Scholar]
- Wang, J.; Xu, B. Targeted therapeutic options and future perspectives for HER2-positive breast cancer. Signal. Transduct. Target. Ther. 2019, 4, 34. [Google Scholar] [CrossRef] [Green Version]
- Alfarouk, K.O.; Stock, C.-M.; Taylor, S.; Walsh, M.; Muddathir, A.K.; Verduzco, D.; Bashir, A.H.H.; Mohammed, O.Y.; Elhassan, G.O.; Harguindey, S.; et al. Resistance to cancer chemotherapy: Failure in drug response from ADME to P-gp. Cancer Cell Int. 2015, 15, 71. [Google Scholar] [CrossRef] [Green Version]
- Cho, H.; Lee, S.; Sim, S.H.; Park, I.H.; Lee, K.S.; Kwak, M.H.; Kim, H.J. Cumulative incidence of chemotherapy-induced cardiotoxicity during a 2-year follow-up period in breast cancer patients. Breast Cancer Res. Treat. 2020, 182, 544–553. [Google Scholar] [CrossRef] [PubMed]
- Zagidullin, B.; Aldahdooh, J.; Zheng, S.; Wang, W.; Wang, Y.; Saad, J.; Malyutina, A.; Jafari, M.; Tanoli, Z.; Pessia, A.; et al. DrugComb: An integrative cancer drug combination data portal. Nucleic Acids Res. 2019, 47, 43–51. [Google Scholar] [CrossRef] [PubMed]
- Palmer, A.C.; Sorger, P.K. Combination cancer therapy can confer benefit via patient-to-patient variability without drug additivity or synergy. Cell 2017, 171, 1678–1691. [Google Scholar] [CrossRef] [PubMed] [Green Version]
- Jeon, M.; Kim, S.; Park, S.; Lee, H.; Kang, J. In silico drug combination discovery for personalized cancer therapy. BMC Syst. Biol. 2018, 12, 580–585. [Google Scholar] [CrossRef] [PubMed]
- Lee, J.H.; Nan, A. Combination drug delivery approaches in metastatic breast cancer. J. Drug Deliv. 2012, 2012, 915375. [Google Scholar] [CrossRef]
- Saldanha, S.N.; Tollefsbol, T.O. The role of nutraceuticals in chemoprevention and chemotherapy and their clinical outcomes. J. Oncol. 2012, 2012, 192464. [Google Scholar] [CrossRef] [Green Version]
- Wang, P.; Yang, H.L.; Yang, Y.J.; Wang, L.; Lee, S.C. Overcome cancer cell drug resistance using natural products. Evid. Based Complement. Alternat. Med. 2015, 2015, 767136. [Google Scholar] [CrossRef] [Green Version]
- Marostica, L.L.; de Barros, A.L.B.; Oliveira, J.; Salgado, B.S.; Cassali, G.D.; Leite, E.A.; Cardoso, V.N.; Lang, K.L.; Caro, M.S.B.; Duran, F.J.; et al. Antitumor effectiveness of a combined therapy with a new cucurbitacin B derivative and paclitaxel on a human lung cancer xenograft model. Toxicol. Appl. Pharmacol. 2017, 329, 272–281. [Google Scholar] [CrossRef]
- Boopathy, N.S.; Kathiresan, K. Anticancer drugs from marine flora: An overview. J. Oncol. 2010, 2010, 214186. [Google Scholar] [CrossRef] [Green Version]
- Newman, D.J.; Cragg, G.M. Natural products as sources of new drugs over the 30 years from 1981 to 2010. J. Nat. Prod. 2012, 75, 255–278. [Google Scholar] [CrossRef] [Green Version]
- Moghadamtousi, S.Z.; Karimian, H.; Khanabdali, R.; Razavi, M.; Firoozinia, M.; Zandi, K.; Abdul Kadir, H. Anticancer and antitumor potential of fucoidan and fucoxanthin, two main metabolites isolated from brown algae. Sci. World J. 2014, 2014, 768323. [Google Scholar] [CrossRef]
- Pádua, D.; Rocha, E.; Gargiulo, D.; Ramos, A.A. Bioactive compounds from brown seaweeds: Phloroglucinol, fucoxanthin and fucoidan as promising therapeutic agents against breast cancer. Phytochem. Lett. 2015, 14, 91–98. [Google Scholar] [CrossRef]
- Gutiérrez-Rodríguez, A.G.; Juárez-Portilla, C.; Olivares-Bañuelos, T.; Zepeda, R.C. Anticancer activity of seaweeds. Drug Discov. Today 2018, 23, 434–447. [Google Scholar] [CrossRef] [PubMed]
- Rocha, D.H.A.; Seca, A.M.L.; Pinto, D.C.G.A. Seaweed secondary metabolites in vitro and in vivo anticancer activity. Mar. Drugs 2018, 16, 410. [Google Scholar] [CrossRef] [PubMed] [Green Version]
- Murphy, C.; Hotchkiss, S.; Worthington, J.; McKeown, S.R. The potential of seaweed as a source of drugs for use in cancer chemotherapy. J. Appl. Phycol. 2014, 26, 2211–2264. [Google Scholar] [CrossRef]
- Liao, G.S.; Apaya, M.K.; Shyur, L.F. Herbal medicine and acupuncture for breast cancer palliative care and adjuvant therapy. Evid. Based Complement. Alternat. Med. 2013, 2013, 437948. [Google Scholar] [CrossRef]
- Moussavou, G.; Kwak, D.H.; Obiang-Obonou, B.W.; Maranguy, C.A.; Dinzouna-Boutamba, S.D.; Lee, D.H.; Pissibanganga, O.G.; Ko, K.; Seo, J.I.; Choo, Y.K. Anticancer effects of different seaweeds on human colon and breast cancers. Mar. Drugs 2014, 12, 4898–4911. [Google Scholar] [CrossRef]
- Yang, Y.J.; Nam, S.-J.; Kong, G.; Kim, M.K. A case–control study on seaweed consumption and the risk of breast cancer. Br. J. Nutr. 2010, 103, 1345–1353. [Google Scholar] [CrossRef] [Green Version]
- Teas, J.; Vena, S.; Cone, D.L.; Irhimeh, M. The consumption of seaweed as a protective factor in the etiology of breast cancer: Proof of principle. J. Appl. Phycol. 2013, 25, 771–779. [Google Scholar] [CrossRef] [Green Version]
- Xue, M.; Ge, Y.; Zhang, J.; Liu, Y.; Wang, Q.; Hou, L.; Zheng, Z. Fucoidan inhibited 4T1 mouse breast cancer cell growth in vivo and in vitro via downregulation of Wnt/beta-catenin signaling. Nutr. Cancer 2013, 65, 898–908. [Google Scholar] [CrossRef]
- Lin, S.-R.; Chang, C.-H.; Hsu, C.-F.; Tsai, M.-J.; Cheng, H.; Leong, M.K.; Sung, P.-J.; Chen, J.-C.; Weng, C.-F. Natural compounds as potential adjuvants to cancer therapy: Preclinical evidence. Br. J. Pharmacol. 2020, 177, 1409–1423. [Google Scholar] [CrossRef] [PubMed] [Green Version]
- Lichota, A.; Gwozdzinski, K. Anticancer activity of natural compounds from plant and marine environment. Int. J. Mol. Sci. 2018, 19, 3533. [Google Scholar] [CrossRef] [PubMed] [Green Version]
- Wang, J.; Jiang, Y.-F. Natural compounds as anticancer agents: Experimental evidence. World J. Exp. Med. 2012, 2, 45–47. [Google Scholar] [CrossRef] [PubMed]
- Fujiki, H.; Suganuma, M. Green tea: An effective synergist with anticancer drugs for tertiary cancer prevention. Cancer Lett. 2012, 324, 119–125. [Google Scholar] [CrossRef] [PubMed]
- Kapadia, G.J.; Rao, G.S.; Ramachandran, C.; Iida, A.; Suzuki, N.; Tokuda, H. Synergistic cytotoxicity of red beetroot (Beta vulgaris L.) extract with doxorubicin in human pancreatic, breast and prostate cancer cell lines. J. Altern. Complement. Med. 2013, 10. [Google Scholar] [CrossRef] [PubMed]
- Lopes-Costa, E.; Abreu, M.; Gargiulo, D.; Rocha, E.; Ramos, A.A. Anticancer effects of seaweed compounds fucoxanthin and phloroglucinol, alone and in combination with 5-fluorouracil in colon cells. J. Toxicol. Environ. Health Part A 2017, 80, 776–787. [Google Scholar] [CrossRef]
- Ramos, A.A.; Almeida, T.; Lima, B.; Rocha, E. Cytotoxic activity of the seaweed compound fucosterol, alone and in combination with 5-fluorouracil, in colon cells using 2D and 3D culturing. J. Toxicol. Environ. Health Part A 2019, 82, 537–549. [Google Scholar] [CrossRef]
- Eid, S.Y.; Althubiti, M.A.; Abdallah, M.E.; Wink, M.; El-Readi, M.Z. The carotenoid fucoxanthin can sensitize multidrug resistant cancer cells to doxorubicin via induction of apoptosis, inhibition of multidrug resistance proteins and metabolic enzymes. Phytomedicine 2020, 77, 153280. [Google Scholar] [CrossRef]
- Alekseyenko, T.V.; Zhanayeva, S.Y.; Venediktova, A.A.; Zvyagintseva, T.N.; Kuznetsova, T.A.; Besednova, N.N.; Korolenko, T.A. Antitumor and antimetastatic activity of fucoidan, a sulfated polysaccharide isolated from the Okhotsk Sea Fucus evanescens brown alga. Exp. Biol. Med. 2007, 143, 730–732. [Google Scholar] [CrossRef]
- Cheng, S.H.; Nian, Y.Q.; Ding, M.; Hu, S.B.; He, H.T.; Li, L.; Wang, Y.H. Phloroglucinol combined with parecoxib for cystospasm after transurethral resection of the prostate. Zhonghua Nan Ke Xue 2016, 22, 641–644. [Google Scholar]
- Pan, S.Y.; Zhou, J.; Gibbons, L.; Morrison, H.; Wen, S.W. Antioxidants and breast cancer risk- a population-based case-control study in Canada. BMC Cancer 2011, 11, 372. [Google Scholar] [CrossRef] [PubMed] [Green Version]
- Jung, A.Y.; Cai, X.; Thoene, K.; Obi, N.; Jaskulski, S.; Behrens, S.; Flesch-Janys, D.; Chang-Claude, J. Antioxidant supplementation and breast cancer prognosis in postmenopausal women undergoing chemotherapy and radiation therapy. Am. J. Clin. Nutr. 2019, 109, 69–78. [Google Scholar] [CrossRef] [PubMed] [Green Version]
- Nechuta, S.; Lu, W.; Chen, Z.; Zheng, Y.; Gu, K.; Cai, H.; Zheng, W.; Shu, X.O. Vitamin supplement use during breast cancer treatment and survival: A prospective cohort study. Cancer Epidemiol. Biomark. Prev. 2011, 20, 262–271. [Google Scholar] [CrossRef] [PubMed] [Green Version]
- Kitaeva, K.V.; Rutland, C.S.; Rizvanov, A.A.; Solovyeva, V.V. Cell culture based in vitro test systems for anticancer drug screening. Front. Bioeng. Biotechnol. 2020, 8, 322. [Google Scholar] [CrossRef] [Green Version]
- Imamura, Y.; Mukohara, T.; Shimono, Y.; Funakoshi, Y.; Chayahara, N.; Toyoda, M.; Kiyota, N.; Takao, S.; Kono, S.; Nakatsura, T.; et al. Comparison of 2D- and 3D-culture models as drug-testing platforms in breast cancer. Oncol. Rep. 2015, 33, 1837–1843. [Google Scholar] [CrossRef] [Green Version]
- Ravi, M.; Ramesh, A.; Pattabhi, A. Contributions of 3D cell cultures for cancer research. J. Cell Physiol. 2017, 232, 2679–2697. [Google Scholar] [CrossRef]
- Costa, E.C.; Moreira, A.F.; de Melo-Diogo, D.; Gaspar, V.M.; Carvalho, M.P.; Correia, I.J. 3D tumor spheroids: An overview on the tools and techniques used for their analysis. Biotechnol. Adv. 2016, 34, 1427–1441. [Google Scholar] [CrossRef]
- Kapałczyńska, M.; Kolenda, T.; Przybyła, W.; Zajączkowska, M.; Teresiak, A.; Filas, V.; Ibbs, M.; Bliźniak, R.; Łuczewski, Ł.; Lamperska, K. 2D and 3D cell cultures—A comparison of different types of cancer cell cultures. Arch. Med. Sci. 2018, 14, 910–919. [Google Scholar] [CrossRef]
- Mikhail, A.S.; Eetezadi, S.; Allen, C. Multicellular tumor spheroids for evaluation of cytotoxicity and tumor growth inhibitory effects of nanomedicines in vitro: A comparison of docetaxel-loaded block copolymer micelles and Taxotere®. PLoS ONE 2013, 8, e62630. [Google Scholar] [CrossRef]
- Edmondson, R.; Broglie, J.J.; Adcock, A.F.; Yang, L. Three-dimensional cell culture systems and their applications in drug discovery and cell-based biosensors. Assay Drug Dev. Technol. 2014, 12, 207–218. [Google Scholar] [CrossRef] [Green Version]
- Breslin, S.; O’Driscoll, L. Three-dimensional cell culture: The missing link in drug discovery. Drug Discov. Today 2013, 18, 240–249. [Google Scholar] [CrossRef] [PubMed]
- Holliday, D.L.; Speirs, V. Choosing the right cell line for breast cancer research. Breast Cancer Res. BCR 2011, 13, 215. [Google Scholar] [CrossRef] [PubMed] [Green Version]
- Subik, K.; Lee, J.-F.; Baxter, L.; Strzepek, T.; Costello, D.; Crowley, P.; Xing, L.; Hung, M.-C.; Bonfiglio, T.; Hicks, D.G.; et al. The expression patterns of ER, PR, HER2, CK5/6, EGFR, Ki-67 and AR by immunohistochemical analysis in breast cancer cell lines. Breast Cancer Basic Clin. Res. 2010, 4, 35–41. [Google Scholar] [CrossRef]
- Boominathan, M.; Mahesh, A. Seaweed carotenoids for cancer therapeutics. In Handbook of Anticancer Drugs from Marine Origin; Kim, S.K., Ed.; Springer: Cham, Switzerland, 2015; pp. 185–203. [Google Scholar] [CrossRef]
- Jyonouchi, H.; Sun, S.; Iijima, K.; Gross, M.D. Antitumor activity of astaxanthin and its mode of action. Nutr. Cancer 2000, 36, 59–65. [Google Scholar] [CrossRef] [PubMed]
- Miyashita, K.; Beppu, F.; Hosokawa, M.; Liu, X.; Wang, S. Nutraceutical characteristics of the brown seaweed carotenoid fucoxanthin. Arch. Biochem. Biophys. 2020, 686, 108364. [Google Scholar] [CrossRef] [PubMed]
- Tanaka, T.; Shnimizu, M.; Moriwaki, H. Cancer chemoprevention by carotenoids. Molecules 2012, 17, 3202–3242. [Google Scholar] [CrossRef]
- Song, X.D.; Zhang, J.J.; Wang, M.R.; Liu, W.B.; Gu, X.B.; Lv, C.J. Astaxanthin induces mitochondria-mediated apoptosis in rat hepatocellular carcinoma CBRH-7919 cells. Biol. Pharm. Bull. 2011, 34, 839–844. [Google Scholar] [CrossRef] [PubMed] [Green Version]
- Zhang, X.; Zhao, W.E.; Hu, L.; Zhao, L.; Huang, J. Carotenoids inhibit proliferation and regulate expression of peroxisome proliferators-activated receptor gamma (PPARγ) in K562 cancer cells. Arch. Biochem. Biophys. 2011, 512, 96–106. [Google Scholar] [CrossRef]
- Kavitha, K.; Kowshik, J.; Kishore, T.K.; Baba, A.B.; Nagini, S. Astaxanthin inhibits NF-κB and Wnt/β-catenin signaling pathways via inactivation of Erk/MAPK and PI3K/Akt to induce intrinsic apoptosis in a hamster model of oral cancer. Biochim. Biophys. Acta 2013, 1830, 4433–4444. [Google Scholar] [CrossRef]
- Song, X.; Wang, M.; Zhang, L.; Zhang, J.; Wang, X.; Liu, W.; Gu, X.; Lv, C. Changes in cell ultrastructure and inhibition of JAK1/STAT3 signaling pathway in CBRH-7919 cells with astaxanthin. Toxicol. Mech. Methods 2012, 22, 679–686. [Google Scholar] [CrossRef]
- McCall, B.; McPartland, C.K.; Moore, R.; Frank-Kamenetskii, A.; Booth, B.W. Effects of astaxanthin on the proliferation and migration of breast cancer cells in vitro. Antioxidants 2018, 7, 135. [Google Scholar] [CrossRef] [PubMed] [Green Version]
- Yasui, Y.; Hosokawa, M.; Mikami, N.; Miyashita, K.; Tanaka, T. Dietary astaxanthin inhibits colitis and colitis-associated colon carcinogenesis in mice via modulation of the inflammatory cytokines. Chem. Biol. Interact. 2011, 193, 79–87. [Google Scholar] [CrossRef] [PubMed]
- Cunha, L.; Grenha, A. Sulfated seaweed polysaccharides as multifunctional materials in drug delivery applications. Mar. Drugs 2016, 14, 42. [Google Scholar] [CrossRef] [PubMed]
- Zhuang, C.; Itoh, H.; Mizuno, T.; Ito, H. Antitumor active fucoidan from the brown seaweed, Umitoranoo (Sargassum thunbergii). Biosci. Biotechnol. Biochem. 1995, 59, 563–567. [Google Scholar] [CrossRef]
- Cumashi, A.; Ushakova, N.A.; Preobrazhenskaya, M.E.; D’Incecco, A.; Piccoli, A.; Totani, L.; Tinari, N.; Morozevich, G.E.; Berman, A.E.; Bilan, M.I.; et al. A comparative study of the anti-inflammatory, anticoagulant, antiangiogenic, and antiadhesive activities of nine different fucoidans from brown seaweeds. Glycobiology 2007, 17, 541–552. [Google Scholar] [CrossRef] [Green Version]
- Vetvicka, V.; Vetvickova, J. Fucoidans stimulate immune reaction and suppress cancer growth. Anticancer Res. 2017, 37, 6041–6046. [Google Scholar] [CrossRef] [Green Version]
- Han, Y.-S.; Lee, J.H.; Lee, S.H. Fucoidan inhibits the migration and proliferation of HT-29 human colon cancer cells via the phosphoinositide-3 kinase/Akt/mechanistic target of rapamycin pathways. Mol. Med. Rep. 2015, 12, 3446–3452. [Google Scholar] [CrossRef]
- Arumugam, P.; Arunkumar, K.; Sivakumar, L.; Murugan, M.; Murugan, K. Anticancer effect of fucoidan on cell proliferation, cell cycle progression, genetic damage and apoptotic cell death in HepG2 cancer cells. Toxicol. Rep. 2019, 6, 556–563. [Google Scholar] [CrossRef]
- Hsu, H.Y.; Hwang, P.A. Clinical applications of fucoidan in translational medicine for adjuvant cancer therapy. Clin. Transl. Med. 2019, 8, 15. [Google Scholar] [CrossRef] [Green Version]
- Yamasaki-Miyamoto, Y.; Yamasaki, M.; Tachibana, H.; Yamada, K. Fucoidan induces apoptosis through activation of caspase-8 on human breast cancer MCF-7 cells. J. Agric. Food Chem. 2009, 57, 8677–8682. [Google Scholar] [CrossRef]
- Zhang, Z.; Teruya, K.; Eto, H.; Shirahata, S. Fucoidan extract induces apoptosis in MCF-7 cells via a mechanism involving the ROS-dependent JNK Activation and mitochondria-mediated pathways. PLoS ONE 2011, 6, e27441. [Google Scholar] [CrossRef] [PubMed]
- Zhang, Z.; Teruya, K.; Yoshida, T.; Eto, H.; Shirahata, S. Fucoidan extract enhances the anti-cancer activity of chemotherapeutic agents in MDA-MB-231 and MCF-7 breast cancer cells. Mar. Drugs 2013, 11, 81–98. [Google Scholar] [CrossRef] [PubMed] [Green Version]
- Zhang, Z.; Teruya, K.; Eto, H.; Shirahata, S. Induction of apoptosis by low-molecular-weight fucoidan through calcium- and caspase-pependent mitochondrial pathways in MDA-MB-231 breast cancer cells. Biosci. Biotechnol. Biochem. 2013, 77, 235–242. [Google Scholar] [CrossRef] [PubMed]
- Vishchuk, O.S.; Ermakova, S.P.; Zvyagintseva, T.N. Sulfated polysaccharides from brown seaweeds Saccharina japonica and Undaria pinnatifida: Isolation, structural characteristics, and antitumor activity. Carbohydr. Res. 2011, 346, 2769–2776. [Google Scholar] [CrossRef] [PubMed]
- Haroun-Bouhedja, F.; Lindenmeyer, F.; Lu, H.; Soria, C.; Jozefonvicz, J.; Boisson-Vidal, C. In vitro effects of fucans on MDA-MB231 tumor cell adhesion and invasion. Anticancer Res. 2002, 22, 2285–2292. [Google Scholar]
- Park, H.-K.; Kim, I.-H.; Kim, J.; Nam, T.-J. Induction of apoptosis by laminarin, regulating the insulin-like growth factor-IR signaling pathways in HT-29 human colon cells. Int. J. Mol. Med. 2012, 30, 734–738. [Google Scholar] [CrossRef] [Green Version]
- Song, K.; Xu, L.; Zhang, W.; Cai, Y.; Jang, B.; Oh, J.; Jin, J.O. Laminarin promotes anti-cancer immunity by the maturation of dendritic cells. Oncotarget 2017, 8, 38554–38567. [Google Scholar] [CrossRef] [Green Version]
- Park, H.-K.; Kim, I.-H.; Kim, J.; Nam, T.-J. Induction of apoptosis and the regulation of ErbB signaling by laminarin in HT-29 human colon cancer cells. Int. J. Mol. Med. 2013, 32, 291–295. [Google Scholar] [CrossRef] [Green Version]
- Ji, C.F.; Ji, Y.B. Laminarin-induced apoptosis in human colon cancer LoVo cells. Oncol. Lett. 2014, 7, 1728–1732. [Google Scholar] [CrossRef]
- Xu, H.; Zou, S.; Xu, X. The β-glucan from Lentinus edodes suppresses cell proliferation and promotes apoptosis in estrogen receptor positive breast cancers. Oncotarget 2017, 8, 86693–86709. [Google Scholar] [CrossRef] [Green Version]
- Malyarenko, O.S.; Usoltseva, R.V.; Shevchenko, N.M.; Isakov, V.V.; Zvyagintseva, T.N.; Ermakova, S.P. In vitro anticancer activity of the laminarans from far-eastern brown seaweeds and their sulfated derivatives. J. Appl. Phycol. 2017, 29, 543–553. [Google Scholar] [CrossRef]
- Mouritsen, O.G.; Bagatolli, L.A.; Duelund, L.; Garvik, O.; Ipsen, J.H.; Simonsen, A.C. Effects of seaweed sterols fucosterol and desmosterol on lipid membranes. Chem. Phys. Lipids 2017, 205, 1–10. [Google Scholar] [CrossRef] [PubMed] [Green Version]
- Abdul, Q.A.; Choi, R.J.; Jung, H.A.; Choi, J.S. Health benefit of fucosterol from marine algae: A review. J. Sci. Food Agric. 2016, 96, 1856–1866. [Google Scholar] [CrossRef] [PubMed]
- Kim, S.-K.; Van Ta, Q. Potential beneficial effects of marine algal sterols on human health. In Advances in Food and Nutrition Research; Kim, S.-K., Ed.; Academic Press: Cambridge, MA, USA, 2011; Volume 64, Chapter 14; pp. 191–198. [Google Scholar] [CrossRef]
- Khanavi, M.; Gheidarloo, R.; Sadati, N.; Ardekani, M.R.; Nabavi, S.; Tavajohi, S.; Ostad, S. Cytotoxicity of fucosterol containing fraction of marine algae against breast and colon carcinoma cell line. Pharmacogn. Mag. 2012, 8, 60–64. [Google Scholar] [CrossRef] [Green Version]
- Jiang, H.; Li, J.; Chen, A.; Li, Y.; Xia, M.; Guo, P.; Yao, S.; Chen, S. Fucosterol exhibits selective antitumor anticancer activity against HeLa human cervical cell line by inducing mitochondrial mediated apoptosis, cell cycle migration inhibition and downregulation of m-TOR/PI3K/Akt signalling pathway. Oncol. Lett. 2018, 15, 3458–3463. [Google Scholar] [CrossRef]
- Pacheco, B.S.; Dos Santos, M.A.Z.; Schultze, E.; Martins, R.M.; Lund, R.G.; Seixas, F.K.; Colepicolo, P.; Collares, T.; Paula, F.R.; De Pereira, C.M.P. Cytotoxic activity of fatty acids from Antarctic macroalgae on the growth of human breast cancer cells. Front. Bioeng. Biotechnol. 2018, 6, 185. [Google Scholar] [CrossRef]
- Kim, M.-M.; Kim, S.-K. Effect of phloroglucinol on oxidative stress and inflammation. Food Chem. Toxicol. 2010, 48, 2925–2933. [Google Scholar] [CrossRef]
- Kang, M.-H.; Kim, I.-H.; Nam, T.-J.N. Phloroglucinol induces apoptosis via apoptotic signaling pathways in HT-29 colon cancer cells. Oncol. Rep. 2014, 32, 1341–1346. [Google Scholar] [CrossRef] [Green Version]
- Kumar, P.; Senthamilselvi, S.; Govindaraju, M.; Sankar, R. Unraveling the caspase-mediated mechanism for phloroglucinol-encapsulated starch biopolymer against the breast cancer cell line MDA-MB-231. RSC Adv. 2014, 4, 46157–46163. [Google Scholar] [CrossRef]
- Kim, R.K.; Uddin, N.; Hyun, J.W.; Kim, C.; Suh, Y.; Lee, S.J. Novel anticancer activity of phloroglucinol against breast cancer stem-like cells. Toxicol. Appl. Pharmacol. 2015, 286, 143–150. [Google Scholar] [CrossRef]
- Prabhakaran, P.; Hassiotou, F.; Blancafort, P.; Filgueira, L. Cisplatin induces differentiation of breast cancer cells. Front. Oncol 2013, 3, 134. [Google Scholar] [CrossRef] [PubMed] [Green Version]
- Al-malky, H.S.; Osman, A.-M.M.; Damanhouri, Z.A.; Alkreathy, H.M.; Al Aama, J.Y.; Ramadan, W.S.; Al Qahtani, A.A.; Al Mahdi, H.B. Modulation of doxorubicin-induced expression of the multidrug resistance gene in breast cancer cells by diltiazem and protection against cardiotoxicity in experimental animals. Cancer Cell Int. 2019, 19, 191. [Google Scholar] [CrossRef] [PubMed]
- Zhang, Y.; Li, H.; Zhang, J.; Zhao, C.; Lu, S.; Qiao, J.; Han, M. The combinatory effects of natural products and chemotherapy drugs and their mechanisms in breast cancer treatment. Phytochem. Rev. 2020, 19, 1179–1197. [Google Scholar] [CrossRef]
- Amable, L. Cisplatin resistance and opportunities for precision medicine. Pharmacol. Res. 2016, 106, 27–36. [Google Scholar] [CrossRef] [PubMed]
- Smith, L.; Welham, K.J.; Watson, M.B.; Drew, P.J.; Lind, M.J.; Cawkwell, L. The proteomic analysis of cisplatin resistance in breast cancer cells. Oncol. Res. 2007, 16, 497–506. [Google Scholar] [CrossRef]
- Verrill, M. Anthracyclines in breast cancer: Therapy and issues of toxicity. Breast 2001, 10, 8–15. [Google Scholar] [CrossRef]
- Shevchuk, O.O.; Posokhova, E.A.; Sakhno, L.A.; Nikolaev, V.G. Theoretical ground for adsorptive therapy of anthracyclines cardiotoxicity. Exp. Oncol. 2012, 34, 314–322. [Google Scholar]
- Lüpertz, R.; Wätjen, W.; Kahl, R.; Chovolou, Y. Dose- and time-dependent effects of doxorubicin on cytotoxicity, cell cycle and apoptotic cell death in human colon cancer cells. Toxicology 2010, 271, 115–121. [Google Scholar] [CrossRef]
- Piccinini, F.; Ana, S.P. A software suite for automatic image analysis of multicellular spheroids. Comput. Methods Programs Biomed. 2015, 119, 43–52. [Google Scholar] [CrossRef]
- Gil, R.S.; Vagnarelli, P. Ki-67: More hidden behind a ‘classic proliferation marker’. Trends Biochem. Sci. 2018, 43, 747–748. [Google Scholar] [CrossRef]
- Urruticoechea, A.; Smith, I.E.; Dowsett, M. Proliferation marker Ki-67 in early breast cancer. J. Clin. Oncol. 2005, 23, 7212–7220. [Google Scholar] [CrossRef] [PubMed]
- Bressenot, A.; Marchal, S.; Bezdetnaya, L.; Garrier, J.; Guillemin, F.; Plénat, F. Assessment of apoptosis by immunohistochemistry to active caspase-3, active caspase-7, or cleaved PARP in monolayer cells and spheroid and subcutaneous xenografts of human carcinoma. J. Histochem. Cytochem. 2009, 57, 289–300. [Google Scholar] [CrossRef] [PubMed]
- Riss, T.L.; Moravec, R.A. Use of multiple assay endpoints to investigate the effects of incubation time, dose of toxin, and plating density in cell-based cytotoxicity assays. Assay Drug Dev. Technol. 2004, 2, 51–62. [Google Scholar] [CrossRef] [PubMed]
- Holm, S. A simple sequentially rejective multiple test procedure. Scand. J. Stat. 1979, 6, 65–70. [Google Scholar]
- Gaetano, J. Holm-Bonferroni Sequential Correction: An Excel Calculator (1.3) [Microsoft Excel Workbook]. Available online: https://www.researchgate.net/publication/322568540_Holm-Bonferroni_sequential_correction_An_Excel_calculator_13 (accessed on 26 December 2020).
- Lovitt, C.J.; Shelper, T.B.; Avery, V.M. Advanced cell culture techniques for cancer drug discovery. Biology 2014, 3, 345–367. [Google Scholar] [CrossRef] [PubMed] [Green Version]
- Yun, C.W.; Kim, H.J.; Lee, S.H. Therapeutic application of diverse marine-derived natural products in cancer therapy. Anticancer Res. 2019, 39, 5261–5284. [Google Scholar] [CrossRef] [Green Version]
- Rusdi, N.A.; Kue, C.S.; Yu, K.-X.; Lau, B.F.; Chung, L.Y.; Kiew, L.V. Assessment of potential anticancer activity of brown seaweed compounds using zebrafish phenotypic assay. Nat. Prod. Commun. 2019, 14. [Google Scholar] [CrossRef]
- Ferreira, J.; Ramos, A.A.; Almeida, T.; Azqueta, A.; Rocha, E. Drug resistance in glioblastoma and cytotoxicity of seaweed compounds, alone and in combination with anticancer drugs: A mini review. Phytomedicine 2018, 48, 84–93. [Google Scholar] [CrossRef]
- Varghese, E.; Samuel, S.M.; Abotaleb, M.; Cheema, S.; Mamtani, R.; Büsselberg, D. The “Yin and Yang” of natural compounds in anticancer therapy of triple-negative breast cancers. Cancers 2018, 10, 346. [Google Scholar] [CrossRef] [Green Version]
- Roe, A.L.; Paine, M.F.; Gurley, B.J.; Brouwer, K.R.; Jordan, S.; Griffiths, J.C. Assessing natural product–drug interactions: An end-to-end safety framework. Regul. Toxicol. Pharmacol. 2016, 76, 1–6. [Google Scholar] [CrossRef]
- D’Andrea, G.M. Use of antioxidants during chemotherapy and radiotherapy should be avoided. CA Cancer J. Clin. 2005, 55. [Google Scholar] [CrossRef]
- Funahashi, H.; Imai, T.; Mase, T.; Sekiya, M.; Yokoi, K.; Hayashi, H.; Shibata, A.; Hayashi, T.; Nishikawa, M.; Suda, N.; et al. Seaweed prevents breast cancer? Jpn. J. Cancer Res. 2001, 92, 483–487. [Google Scholar] [CrossRef] [PubMed]
- Pilco-Ferreto, N.; Calaf, G.M. Influence of doxorubicin on apoptosis and oxidative stress in breast cancer cell lines. Int. J. Oncol. 2016, 49, 753–762. [Google Scholar] [CrossRef] [PubMed] [Green Version]
- Tassone, P.; Tagliaferri, P.; Perricelli, A.; Blotta, S.; Quaresima, B.; Martelli, M.L.; Goel, A.; Barbieri, V.; Costanzo, F.; Boland, C.R.; et al. BRCA1 expression modulates chemosensitivity of BRCA1-defective HCC1937 human breast cancer cells. Br. J. Cancer 2003, 88, 1285–1291. [Google Scholar] [CrossRef] [Green Version]
- Altharawi, A.; Rahman, K.M.; Chan, K.L.A. Identifying the responses from the estrogen receptor-expressed MCF7 cells treated in anticancer drugs of different modes of action using live-cell FTIR spectroscopy. ACS Omega 2020, 5, 12698–12706. [Google Scholar] [CrossRef]
- Thippabhotla, S.; Zhong, C.; He, M. 3D cell culture stimulates the secretion of in vivo like extracellular vesicles. Sci. Rep. 2019, 9, 13012. [Google Scholar] [CrossRef] [Green Version]
- Karimian, A.; Bahadori, M.H.; Moghaddam, A.H.; Mohammadrezaei, F.M. Effect of astaxanthin on cell viability in T-47D and MDA-MB-231 breast cancer cell lines. Multidiscip. Cancer Investig. 2017, 1. [Google Scholar] [CrossRef] [Green Version]
- Franceschelli, S.; Pesce, M.; Ferrone, A.; De Lutiis, M.A.; Patruno, A.; Grilli, A.; Felaco, M.; Speranza, L. Astaxanthin treatment confers protection against oxidative stress in U937 cells stimulated with lipopolysaccharide reducing O2− production. PLoS ONE 2014, 9, e88359. [Google Scholar] [CrossRef]
- Yilmaz, Y.; Tumkaya, L.; Mercantepe, T.; Akyildiz, K. Protective effect of astaxanthin against cisplatin-induced gastrointestinal toxicity in rats. Eur. Surg. 2020. [Google Scholar] [CrossRef]
- Kınal, M.E.; Tatlıpınar, A.; Uzun, S.; Keskin, S.; Tekdemir, E.; Özbeyli, D.; Akakın, D. Investigation of astaxanthin effect on cisplatin ototoxicity in rats by using otoacoustic emission, total antioxidant capacity, and histopathological methods. Ear Nose Throat J. 2019. [Google Scholar] [CrossRef] [Green Version]
- Fındık, H.; Tumkaya, L.; Yılmaz, A.; Gökhan Aslan, M.; Okutucu, M.; Akyildiz, K.; Mercantepe, T. The protective effects of astaxanthin against cisplatin-induced retinal toxicity. Cutan. Ocul. Toxicol. 2019, 38, 59–65. [Google Scholar] [CrossRef] [PubMed]
- Banafa, A.M.; Roshan, S.; Liu, Y.Y.; Chen, H.J.; Chen, M.J.; Yang, G.X.; He, G.Y. Fucoidan induces G1 phase arrest and apoptosis through caspases-dependent pathway and ROS induction in human breast cancer MCF-7 cells. J. Huazhong Univ. Sci. Technolog. Med. Sci. 2013, 33, 717–724. [Google Scholar] [CrossRef] [PubMed]
- Abudabbus, A.; Badmus, J.A.; Shalaweh, S.; Bauer, R.; Hiss, D. Effects of fucoidan and chemotherapeutic agent combinations on malignant and non-malignant breast cell lines. Curr. Pharm. Biotechnol. 2017, 18, 748–757. [Google Scholar] [CrossRef] [PubMed] [Green Version]
- Zhang, J.; Sun, Z.; Lin, N.; Lu, W.; Huang, X.; Weng, J.; Sun, S.; Zhang, C.; Yang, Q.; Zhou, G.; et al. Fucoidan from Fucus vesiculosus attenuates doxorubicin-induced acute cardiotoxicity by regulating JAK2/STAT3-mediated apoptosis and autophagy. Biomed. Pharmacother. 2020, 130, 110534. [Google Scholar] [CrossRef] [PubMed]
- Reyes, M.E.; Riquelme, I.; Salvo, T.; Zanella, L.; Letelier, P.; Brebi, P. Brown seaweed fucoidan in cancer: Implications in metastasis and drug resistance. Mar. Drugs 2020, 18, 232. [Google Scholar] [CrossRef]
- Kim, K.H.; Kim, Y.W.; Kim, H.B.; Lee, B.J.; Lee, D.S. Anti-apoptotic activity of laminarin polysaccharides and their enzymatically hydrolyzed oligosaccharides from Laminaria japonica. Biotechnol. Lett. 2006, 28, 439–446. [Google Scholar] [CrossRef]
- Malyarenko, O.S.; Usoltseva, R.V.; Silchenko, A.S.; Ermakova, S.P. Aminated laminaran from brown alga Saccharina cichorioides: Synthesis, structure, anticancer, and radiosensitizing potential in vitro. Carbohydr. Polym. 2020, 250, 117007. [Google Scholar] [CrossRef]
- Han, Y.; Shi, S.; Xu, L.; Han, Y.; Li, J.; Sun, Q.; Zheng, Q.; Bai, X.; Wang, H. Protective effects of laminarin on cisplatin-induced ototoxicity in HEIOC1 auditory cells. J. Nutr. Food Sci. 2016, 6, 1–5. [Google Scholar] [CrossRef]
- Kim, R.K.; Suh, Y.; Yoo, K.C.; Cui, Y.H.; Hwang, E.; Kim, H.J.; Kang, J.S.; Kim, M.J.; Lee, Y.Y.; Lee, S.J. Phloroglucinol suppresses metastatic ability of breast cancer cells by inhibition of epithelial-mesenchymal cell transition. Cancer Sci. 2015, 106, 94–101. [Google Scholar] [CrossRef] [Green Version]
- Lin, K.W.; Huang, A.M.; Tu, H.Y.; Weng, J.R.; Hour, T.C.; Wei, B.L.; Yang, S.C.; Wang, J.P.; Pu, Y.S.; Lin, C.N. Phloroglucinols inhibit chemical mediators and xanthine oxidase, and protect cisplatin-induced cell death by reducing reactive oxygen species in normal human urothelial and bladder cancer cells. J. Agric. Food Chem. 2009, 57, 8782–8787. [Google Scholar] [CrossRef]
- Yang, Y.I.; Ahn, J.H.; Choi, Y.S.; Choi, J.H. Brown algae phlorotannins enhance the tumoricidal effect of cisplatin and ameliorate cisplatin nephrotoxicity. Gynecol. Oncol. 2015, 136, 355–364. [Google Scholar] [CrossRef] [PubMed]
- Ahn, H.S.; Lee, D.H.; Kim, T.J.; Shin, H.C.; Jeon, H.K. Cardioprotective effects of a phlorotannin extract against doxorubicin-induced cardiotoxicity in a rat model. J. Med. Food 2017, 20, 944–950. [Google Scholar] [CrossRef] [PubMed]
- Li, X.; Li, Y.; Luo, J.; Zhou, Z.; Xue, G.; Kong, L. New phloroglucinol derivatives from the whole plant of Hypericum uralum. Fitoterapia 2017, 123, 59–64. [Google Scholar] [CrossRef] [PubMed]
- Lu, J.; Shi, K.K.; Chen, S.; Wang, J.; Hassouna, A.; White, L.N.; Merien, F.; Xie, M.; Kong, Q.; Li, J.; et al. Fucoidan extracted from the New Zealand Undaria pinnatifida-physicochemical comparison against five other fucoidans: Unique low molecular weight fraction bioactivity in breast cancer cell lines. Mar. Drugs 2018, 16, 461. [Google Scholar] [CrossRef] [PubMed] [Green Version]
- Jung, H.A.; Kim, J.I.; Choung, S.Y.; Choi, J.S. Protective effect of the edible brown alga Ecklonia stolonifera on doxorubicin-induced hepatotoxicity in primary rat hepatocytes. J. Pharm. Pharmacol. 2014, 66, 1180–1188. [Google Scholar] [CrossRef] [PubMed]
- Mao, Z.; Shen, X.; Dong, P.; Liu, G.; Pan, S.; Sun, X.; Hu, H.; Pan, L.; Huang, J. Fucosterol exerts antiproliferative effects on human lung cancer cells by inducing apoptosis, cell cycle arrest and targeting of Raf/MEK/ERK signalling pathway. Phytomedicine 2019, 61, 152809. [Google Scholar] [CrossRef]
- Choi, J.S.; Han, Y.R.; Byeon, J.S.; Choung, S.Y.; Sohn, H.S.; Jung, H.A. Protective effect of fucosterol isolated from the edible brown algae, Ecklonia stolonifera and Eisenia bicyclis, on tert-butyl hydroperoxide- and tacrine-induced HepG2 cell injury. J. Pharm. Pharmacol. 2015, 67, 1170–1178. [Google Scholar] [CrossRef]
- Bae, H.; Lee, J.-Y.; Song, G.; Lim, W. Fucosterol suppresses the progression of human ovarian cancer by inducing mitochondrial dysfunction and endoplasmic reticulum stress. Mar. Drugs 2020, 18, 261. [Google Scholar] [CrossRef]
- Kumar, P.; Aggarwal, R. An overview of triple-negative breast cancer. Arch. Gynecol. Obstet. 2016, 293, 247–269. [Google Scholar] [CrossRef]
- Dai, X.; Li, T.; Bai, Z.; Yang, Y.; Liu, X.; Zhan, J.; Sho, B. Breast cancer intrinsic subtype classification, clinical use and future trends. Am. J. Cancer 2015, 10, 2029–2943. [Google Scholar]
- Chaudhary, L.N.; Wilkinson, K.H.; Kong, A. Triple-negative breast cancer: Who should receive neoadjuvant chemotherapy? Surg. Oncol. Clin. N. Am. 2018, 27, 141–153. [Google Scholar] [CrossRef] [PubMed]
- Cocco, S.; Piezzo, M.; Calabrese, A.; Cianniello, D.; Caputo, R.; Lauro, V.D.; Fusco, G.; Gioia, G.D.; Licenziato, M.; Laurentiis, M.D. Biomarkers in triple-negative breast cancer: State-of-the-art and future perspectives. Int. J. Mol. Sci. 2020, 21, 4579. [Google Scholar] [CrossRef] [PubMed]
- da Silva, J.L.; Cardoso Nunes, N.C.; Izetti, P.; de Mesquita, G.G.; de Melo, A.C. Triple negative breast cancer: A thorough review of biomarkers. Crit Rev. Oncol. Hematol. 2020, 145, 102855. [Google Scholar] [CrossRef] [PubMed]
- Nedeljković, M.; Damjanović, A. Mechanisms of chemotherapy resistance in triple-negative breast cancer-how we can rise to the challenge. Cells 2019, 8, 957. [Google Scholar] [CrossRef] [PubMed] [Green Version]
- Sant, S.; Johnston, P.A. The production of 3D tumor spheroids for cancer drug discovery. Drug Discov. Today Technol. 2017, 23, 27–36. [Google Scholar] [CrossRef] [PubMed] [Green Version]
- Minchinton, A.I.; Tannock, I.F. Drug penetration in solid tumours. Nat. Rev. Cancer 2006, 6, 583–592. [Google Scholar] [CrossRef] [PubMed]
- Caamal-Fuentes, E.; Moo-Puc, R.; Freile-Pelegrín, Y.; Robledo, D. Cytotoxic and antiproliferative constituents from Dictyota ciliolata, Padina sanctae-crucis and Turbinaria tricostata. Pharm. Biol. 2014, 52, 1244–1248. [Google Scholar] [CrossRef] [PubMed] [Green Version]
- Fontoura, J.C.; Viezzer, C.; dos Santos, F.G.; Ligabue, R.A.; Weinlich, R.; Puga, R.D.; Antonow, D.; Severino, P.; Bonorino, C. Comparison of 2D and 3D cell culture models for cell growth, gene expression and drug resistance. Mater. Sci. Eng. C 2020, 107, 110264. [Google Scholar] [CrossRef]
- Langhans, S.A. Three-Dimensional in vitro cell culture models in drug discovery and drug repositioning. Front. Pharmacol. 2018, 9, 6. [Google Scholar] [CrossRef]
- Lovitt, C.J.; Shelper, T.B.; Avery, V.M. Doxorubicin resistance in breast cancer cells is mediated by extracellular matrix proteins. BMC Cancer 2018, 18, 41. [Google Scholar] [CrossRef] [Green Version]
- Nunes, A.S.; Costa, E.C.; Barros, A.S.; de Melo-Diogo, D.; Correia, I.J. Establishment of 2D cell cultures derived from 3D MCF-7 spheroids displaying a doxorubicin resistant profile. Biotechnol. J. 2019, 14, e1800268. [Google Scholar] [CrossRef] [PubMed]
- Ziegler, U.; Groscurth, P. Morphological features of cell death. Physiology 2004, 19, 124–128. [Google Scholar] [CrossRef] [PubMed]
- Saraste, A.; Pulkki, K. Morphologic and biochemical hallmarks of apoptosis. Cardiovasc. Res. 2000, 45, 528–537. [Google Scholar] [CrossRef]


| Chemicals | Tested Concentrations |
|---|---|
| Astaxanthin | 1; 10; 50; 100 and 200 µM |
| Fucoidan | 10; 50; 100; 500 and 1000 µg/mL |
| Fucosterol | 1; 2.5; 5; 7.5 and 10 µM |
| Laminarin | 10; 50; 100; 500 and 1000 µg/mL |
| Phloroglucinol | 10; 50; 100; 500 and 1000 µM |
| Cisplatin | 0.1; 1, 10, 20 and 50 µM |
| Doxorubicin | 0.001; 0.01; 0.1; 1 and 2 µM |
| Drug | Dox (µM) | Cis (µM) | |||||
|---|---|---|---|---|---|---|---|
| Seaweed Compound | 0.01 | 0.1 | 1 | 1 | 10 | 20 | |
| Asta (µM) | 10 | MCF7 SKBR3 MCF12A | MCF7 SKBR3 MDA-MB-231 MCF12A | MDA-MB-231 | MCF12A | MCF7 SKBR3 MDA-MB-231 MCF12A | MCF7 SKBR3 MDA-MB-231 |
| 20 | |||||||
| Fc (µg/mL) | 10 | ||||||
| 50 | |||||||
| Fct (µM) | 1 | ||||||
| 5 | |||||||
| Lm (µg/mL) | 10 | ||||||
| 50 | |||||||
| Phg (µM) | 10 | ||||||
| 50 | |||||||
| Drug (µM) | Asta (µM) | Fc (µg/mL) | Fct (µM) | Lm (µg/mL) | Phg (µM) | ||||||||||||
|---|---|---|---|---|---|---|---|---|---|---|---|---|---|---|---|---|---|
| 0 | 10 | 20 | 0 | 10 | 50 | 0 | 1 | 5 | 0 | 10 | 50 | 0 | 10 | 50 | |||
| MCF7 | Dox | 0 | |||||||||||||||
| 0.01 | |||||||||||||||||
| 0.1 | |||||||||||||||||
| Cis | 0 | ||||||||||||||||
| 10 | |||||||||||||||||
| 20 | |||||||||||||||||
| SKBR3 | Dox | 0 | |||||||||||||||
| 0.01 | |||||||||||||||||
| 0.1 | |||||||||||||||||
| Cis | 0 | ||||||||||||||||
| 10 | |||||||||||||||||
| 20 | |||||||||||||||||
| MDA-MB-231 | Dox | 0 | |||||||||||||||
| 0.1 | |||||||||||||||||
| 1 | |||||||||||||||||
| Cis | 0 | ||||||||||||||||
| 10 | |||||||||||||||||
| 20 | |||||||||||||||||
| MCF12A | Dox | 0 | |||||||||||||||
| 0.01 | |||||||||||||||||
| 0.1 | |||||||||||||||||
| Cis | 0 | ||||||||||||||||
| 1 | |||||||||||||||||
| 10 | |||||||||||||||||
| Control | |||||||||||||||||
| Cell viability is significantly higher than the control | |||||||||||||||||
| Cell viability is not significantly different from the control | |||||||||||||||||
| Cell viability is significantly lower than the control | |||||||||||||||||
| Cell viability is significantly different from control and from both drug and compound alone | |||||||||||||||||
Publisher’s Note: MDPI stays neutral with regard to jurisdictional claims in published maps and institutional affiliations. |
© 2021 by the authors. Licensee MDPI, Basel, Switzerland. This article is an open access article distributed under the terms and conditions of the Creative Commons Attribution (CC BY) license (http://creativecommons.org/licenses/by/4.0/).
Share and Cite
Malhão, F.; Ramos, A.A.; Macedo, A.C.; Rocha, E. Cytotoxicity of Seaweed Compounds, Alone or Combined to Reference Drugs, against Breast Cell Lines Cultured in 2D and 3D. Toxics 2021, 9, 24. https://0-doi-org.brum.beds.ac.uk/10.3390/toxics9020024
Malhão F, Ramos AA, Macedo AC, Rocha E. Cytotoxicity of Seaweed Compounds, Alone or Combined to Reference Drugs, against Breast Cell Lines Cultured in 2D and 3D. Toxics. 2021; 9(2):24. https://0-doi-org.brum.beds.ac.uk/10.3390/toxics9020024
Chicago/Turabian StyleMalhão, Fernanda, Alice Abreu Ramos, Ana Catarina Macedo, and Eduardo Rocha. 2021. "Cytotoxicity of Seaweed Compounds, Alone or Combined to Reference Drugs, against Breast Cell Lines Cultured in 2D and 3D" Toxics 9, no. 2: 24. https://0-doi-org.brum.beds.ac.uk/10.3390/toxics9020024