
Transcriptomic and Histopathological Effects of Bifenthrin to the Brain of Juvenile Rainbow Trout (Oncorhynchus mykiss)

 , and
, and 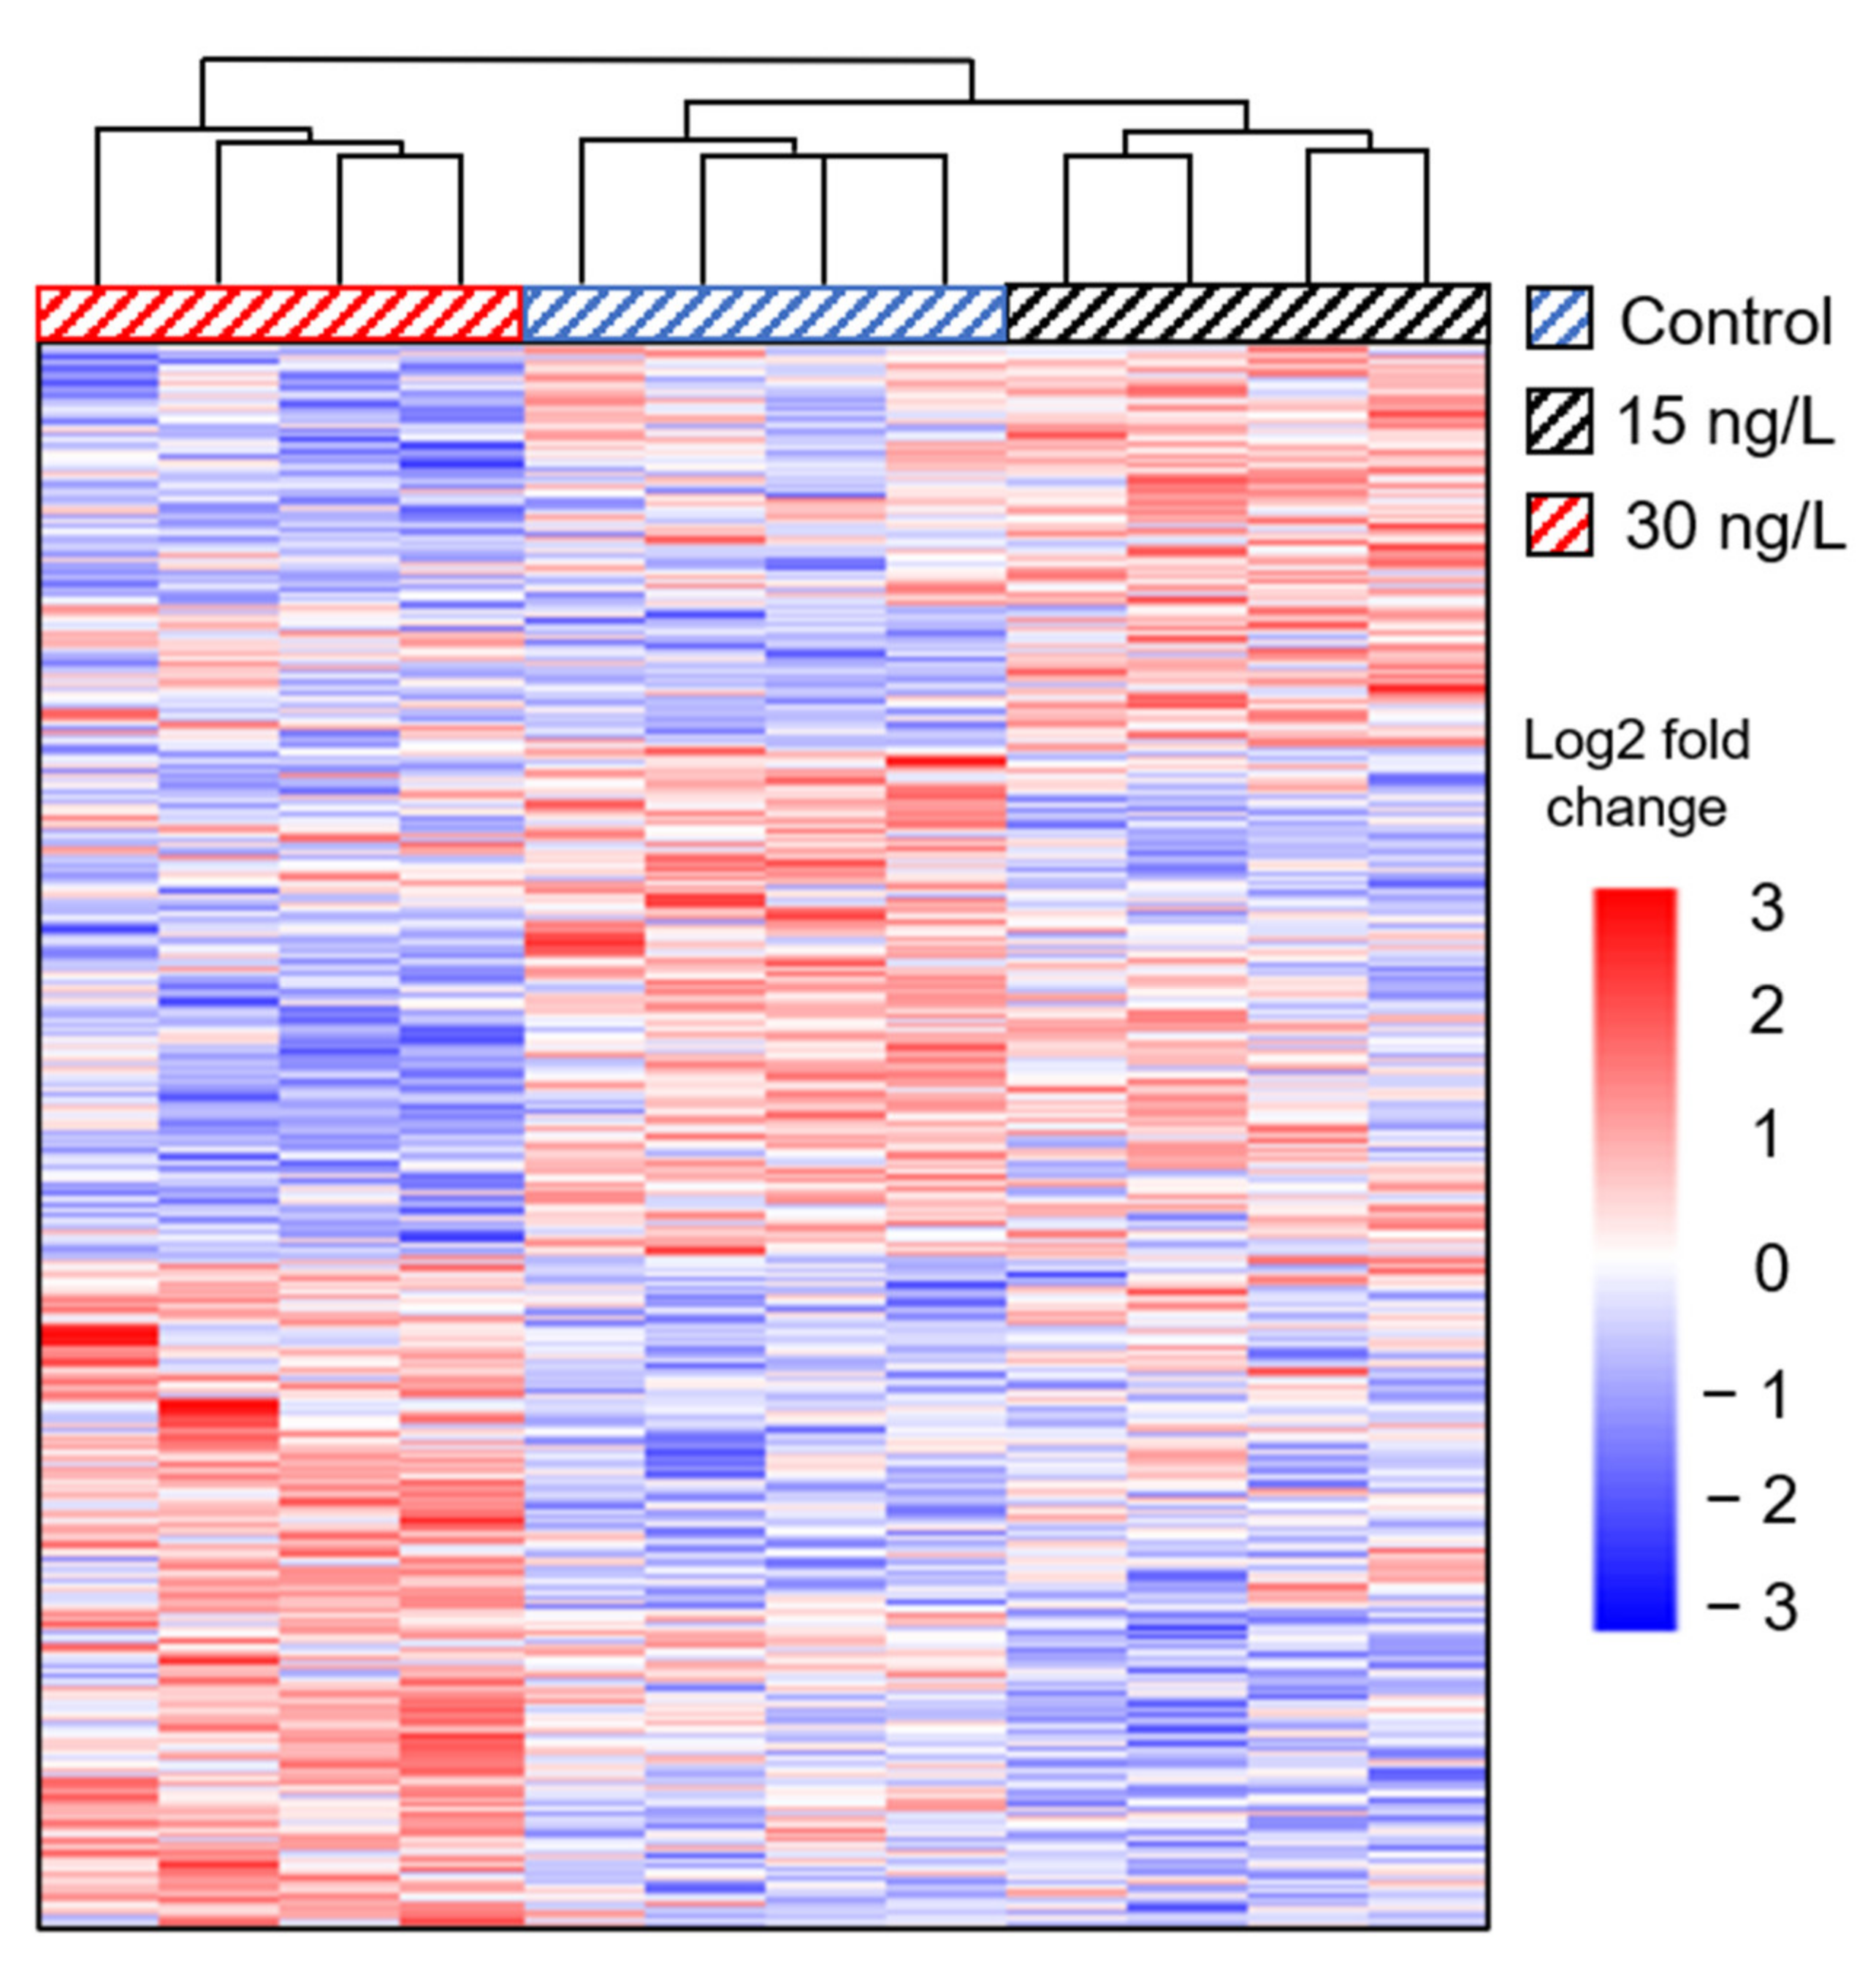
Abstract
:1. Introduction
2. Materials and Methods
2.1. Exposure Treatments
2.2. Bifenthrin Extractions and Analysis
2.3. RNA Isolation, Preparation, and Sequencing
2.4. Transcriptome Assembly and Functional Annotation
2.5. Quantitative Polymerase Chain Reaction (qPCR) Validation of Differentially Expressed Genes
2.6. Histopathological Analysis
3. Results
3.1. Waterborne Bifenthrin Concentrations
3.2. Transcriptome Assembly and Annotation
3.3. qPCR Validation
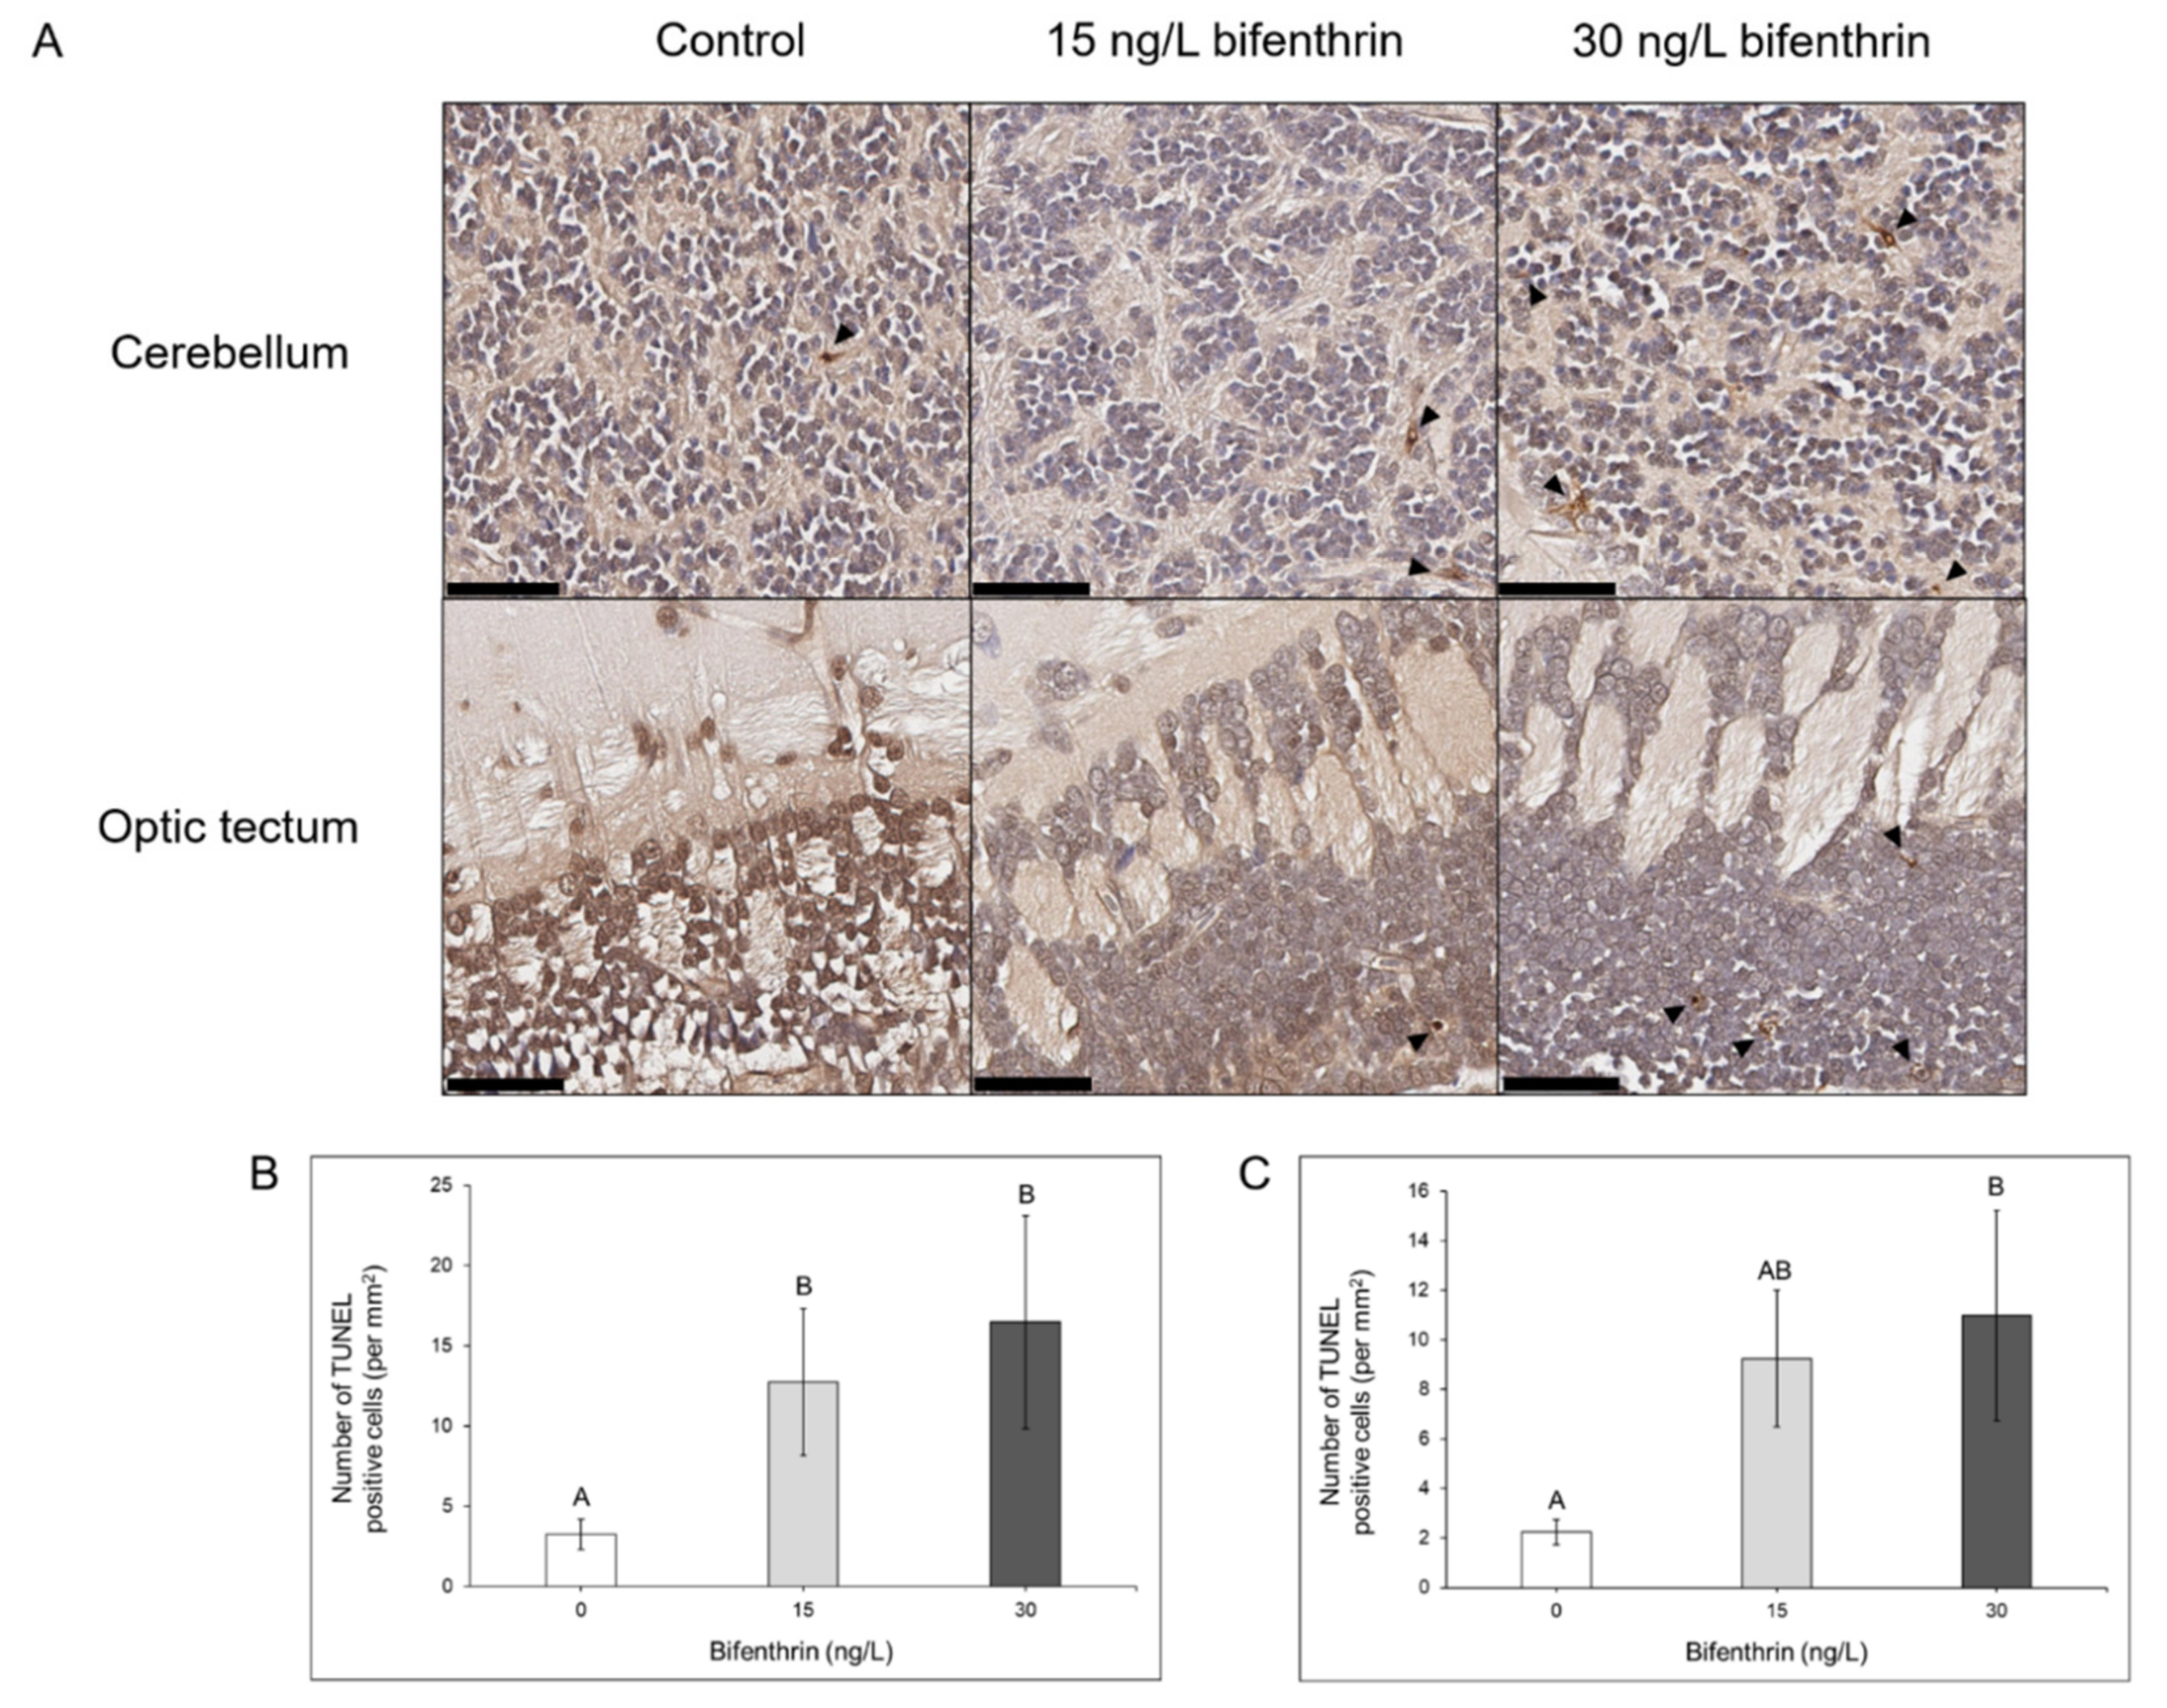
3.4. TUNEL Positive, Apoptotic Cell Assessment
4. Discussion
5. Conclusions
Supplementary Materials
Author Contributions
Funding
Institutional Review Board Statement
Data Availability Statement
Conflicts of Interest
References
- Spurlock, F.; Lee, M. Synthetic Pyrethroid Use Patterns, Properties, and Environmental Effects. In Synthetic Pyrethroids: Occurrence and Behavior in Aquatic Environments; Gan, J., Spurlock, F., Hendley, P., Weston, D.P., Eds.; American Chemical Society: Washington, DC, USA, 2008; pp. 3–25. [Google Scholar]
- Zhang, W. Global Pesticide Use: Profile, Trend, Cost/Benefit and More. Proc. Natl. Acad. Sci. USA 2018, 8, 1–27. [Google Scholar]
- Li, H.; Cheng, F.; Wei, Y.; Lydy, M.J.; You, J. Global Occurrence of Pyrethroid Insecticides in Sediment and the Associated Toxicological Effects on Benthic Invertebrates: An Overview. J. Hazard. Mater. 2017, 324, 258–271. [Google Scholar] [CrossRef] [PubMed] [Green Version]
- Tang, W.; Wang, D.; Wang, J.; Wu, Z.; Li, L.; Huang, M.; Xu, S.; Yan, D. Pyrethroid Pesticide Residues in the Global Environment: An Overview. Chemosphere 2018, 191, 990–1007. [Google Scholar] [CrossRef]
- Bradbury, S.P.; Coats, J.R. Comparative Toxicology of the Pyrethroid Insecticides. In Reviews of Environmental Contamination and Toxicology; Ware, G.W., Ed.; Springer: New York, NY, USA, 1989; Volume 108, pp. 133–177. [Google Scholar]
- Stehle, S.; Schulz, R. Agricultural Insecticides Threaten Surface Waters at the Global Scale. Proc. Natl. Acad. Sci. USA 2015, 112, 5750–5755. [Google Scholar] [CrossRef] [Green Version]
- Budd, R.; Wang, D.; Ensminger, M.; Phillips, B. An Evaluation of Temporal and Spatial Trends of Pyrethroid Concentrations in California Surface Waters. Sci. Total Environ. 2020, 718, 137402. [Google Scholar] [CrossRef] [PubMed]
- Weston, D.P.; Holmes, R.W.; Lydy, M.J. Residential Runoff as a Source of Pyrethroid Pesticides to Urban Creeks. Environ. Pollut. 2009, 157, 287–294. [Google Scholar] [CrossRef]
- Sanders, C.J.; Orlando, J.L.; Hladik, M.L. Detections of Current-Use Pesticides at 12 Surface Water Sites in California during a 2-Year Period Beginning in 2015: U.S. Geological Survey Data Series 1088; U.S. Geological Survey: Reston, VA, USA, 2018; p. 40.
- Weston, D.P.; Lydy, M.J. Urban and Agricultural Sources of Pyrethroid Insecticides to the Sacramento-San Joaquin Delta of California. Environ. Sci. Technol. 2010, 44, 1833–1840. [Google Scholar] [CrossRef]
- Siepmann, S.; Holm, S. Hazard Assessment of the Synthetic Pyrethroid Insecticides Bifenthrin, Cypermethrin, Esfenvalerate, and Permethrin to Aquatic Organisms in the Sacramento-San Joaquin River System; Office of Spill Prevention and Response 00-6. Administrative Report; California Department of Fish and Game: Rancho Cordova, CA, USA, 2000. [Google Scholar]
- Buchanan, R.A.; Skalski, J.R.; Brandes, P.L.; Fuller, A. Route Use and Survival of Juvenile Chinook Salmon through the San Joaquin River Delta. N. Am. J. Fish. Manag. 2013, 33, 216–229. [Google Scholar] [CrossRef]
- Leidy, R.A.; Becker, G.S.; Harvey, B.N. Historical Distribution and Current Status of Steelhead/Rainbow Trout (Oncorhynchus Mykiss) in Streams of the San Francisco Estuary, California; Center for Ecosystem Management and Restoration: Oakland, CA, USA, 2005. [Google Scholar]
- Brooks, M.L.; Fleishman, E.; Brown, L.R.; Lehman, P.W.; Werner, I.; Scholz, N.; Mitchelmore, C.; Lovvorn, J.R.; Johnson, M.L.; Schlenk, D.; et al. Life Histories, Salinity Zones, and Sublethal Contributions of Contaminants to Pelagic Fish Declines Illustrated with a Case Study of San Francisco Estuary, California, USA. Estuaries Coasts 2012, 35, 603–621. [Google Scholar] [CrossRef] [Green Version]
- Katz, J.; Moyle, P.B.; Quiñones, R.M.; Israel, J.; Purdy, S. Impending Extinction of Salmon, Steelhead, and Trout (Salmonidae) in California. Environ. Biol. Fishes 2013, 96, 1169–1186. [Google Scholar] [CrossRef]
- Mills, T.J.; McEwan, D.R.; Jennings, M.R. California Salmon and Steelhead: Beyond the Crossroads. In Pacific Salmon and Their Ecosytems; Stouder, D.J., Bisson, P.A., Naiman, R.J., Eds.; Chapman and Hall: New York, NY, USA, 1997. [Google Scholar]
- Sommer, T.; Armor, C.; Baxter, R.; Breuer, R.; Brown, L.; Chotkowski, M.; Culberson, S.; Feyrer, F.; Gingras, M.; Herbold, B.; et al. The Collapse of Pelagic Fishes in the Upper San Francisco Estuary: El Colapso de Los Peces Pelagicos En La Cabecera Del Estuario San Francisco. Fisheries 2007, 32, 270–277. [Google Scholar] [CrossRef]
- Weston, D.P.; Schlenk, D.; Riar, N.; Lydy, M.J.; Brooks, M.L. Effects of Pyrethroid Insecticides in Urban Runoff on Chinook Salmon, Steelhead Trout, and Their Invertebrate Prey. Environ. Toxicol. Chem. 2015, 34, 649–657. [Google Scholar] [CrossRef] [PubMed]
- De Parsia, M.; Orlando, J.L.; McWayne, M.M.; Hladik, M.L. Pesticide Inputs to the Sacramento—San Joaquin Delta, 2015–2016: Results from the Delta Regional Monitoring Program: U.S. Geological Survey Data Series 1089; U.S. Geological Survey: Reston, VA, USA, 2018; p. 49.
- Crago, J.; Schlenk, D. The Effect of Bifenthrin on the Dopaminergic Pathway in Juvenile Rainbow Trout (Oncorhynchus mykiss). Aquat. Toxicol. 2015, 162, 66–72. [Google Scholar] [CrossRef]
- Giroux, M.; Gan, J.; Schlenk, D. The Effects of Bifenthrin and Temperature on the Endocrinology of Juvenile Chinook Salmon. Environ. Toxicol. Chem. 2019, 38, 852–861. [Google Scholar] [CrossRef] [PubMed]
- Giroux, M.; Vliet, S.M.F.; Volz, D.C.; Gan, J.; Schlenk, D. Mechanisms behind Interactive Effects of Temperature and Bifenthrin on the Predator Avoidance Behaviors in Parr of Chinook Salmon (Oncorhynchus tshawytscha). Aquat. Toxicol. 2019, 216, 105312. [Google Scholar] [CrossRef]
- Magnuson, J.T.; Cryder, Z.; Andrzejczyk, N.E.; Harraka, G.; Wolf, D.C.; Gan, J.; Schlenk, D. Metabolomic Profiles in the Brains of Juvenile Steelhead (Oncorhynchus mykiss) Following Bifenthrin Treatment. Environ. Sci. Technol. 2020, 54, 12245–12253. [Google Scholar] [CrossRef]
- Magnuson, J.T.; Giroux, M.; Cryder, Z.; Gan, J.; Schlenk, D. The Use of Non-Targeted Metabolomics to Assess the Toxicity of Bifenthrin to Juvenile Chinook Salmon (Oncorhynchus tshawytscha). Aquat. Toxicol. 2020, 224, 105518. [Google Scholar] [CrossRef]
- Brander, S.M.; Gabler, M.K.; Fowler, N.L.; Connon, R.E.; Schlenk, D. Pyrethroid Pesticides as Endocrine Disruptors: Molecular Mechanisms in Vertebrates with a Focus on Fishes. Environ. Sci. Technol. 2016, 50, 8977–8992. [Google Scholar] [CrossRef] [PubMed]
- Narahashi, T. Neuronal Ion Channels as the Target Sites of Insecticides. Pharmacol. Toxicol. 1996, 78, 1–14. [Google Scholar] [CrossRef]
- Soderlund, D.M.; Clark, J.M.; Sheets, L.P.; Mullin, L.S.; Piccirillo, V.J.; Sargent, D.; Stevens, J.T.; Weiner, M.L. Mechanisms of Pyrethroid Neurotoxicity: Implications for Cumulative Risk Assessment. Toxicology 2002, 171, 3–59. [Google Scholar] [CrossRef]
- Bertotto, B.; Richards, J.; Gan, J.; Volz, D.C.; Schlenk, D. Effects of Bifenthrin Exposure on the Estrogenic and Dopaminergic Pathways in Zebrafish Embryos and Juveniles. Environ. Toxicol. Chem. 2018, 37, 236–246. [Google Scholar] [CrossRef]
- Bertotto, L.B.; Dasgupta, S.; Vliet, S.; Dudley, S.; Gan, J.; Volz, D.C.; Schlenk, D. Evaluation of the Estrogen Receptor Alpha as a Possible Target of Bifenthrin Effects in the Estrogenic and Dopaminergic Signaling Pathways in Zebrafish Embryos. Sci. Total Environ. 2019, 651, 2424–2431. [Google Scholar] [CrossRef]
- Brander, S.M.; He, G.; Smalling, K.L.; Denison, M.S.; Cherr, G.N. The in Vivo Estrogenic and in Vitro Anti-Estrogenic Activity of Permethrin and Bifenthrin. Environ. Toxicol. Chem. 2012, 31, 2848–2855. [Google Scholar] [CrossRef]
- Forsgren, K.L.; Riar, N.; Schlenk, D. The Effects of the Pyrethroid Insecticide, Bifenthrin, on Steroid Hormone Levels and Gonadal Development of Steelhead (Oncorhynchus mykiss) under Hypersaline Conditions. Gen. Comp. Endocrinol. 2013, 186, 101–107. [Google Scholar] [CrossRef] [PubMed]
- Wang, L.; Liu, W.; Yang, C.; Pan, Z.; Gan, J.; Xu, C.; Zhao, M.; Schlenk, D. Enantioselectivity in Estrogenic Potential and Uptake of Bifenthrin. Environ. Sci. Technol. 2007, 41, 6124–6128. [Google Scholar] [CrossRef]
- Frank, D.F.; Miller, G.W.; Harvey, D.J.; Brander, S.M.; Geist, J.; Connon, R.E.; Lein, P.J. Bifenthrin Causes Transcriptomic Alterations in MTOR and Ryanodine Receptor-Dependent Signaling and Delayed Hyperactivity in Developing Zebrafish (Danio rerio). Aquat. Toxicol. 2018, 200, 50–61. [Google Scholar] [CrossRef] [PubMed] [Green Version]
- Frank, D.F.; Brander, S.M.; Hasenbein, S.; Harvey, D.J.; Lein, P.J.; Geist, J.; Connon, R.E. Developmental Exposure to Environmentally Relevant Concentrations of Bifenthrin Alters Transcription of MTOR and Ryanodine Receptor-Dependent Signaling Molecules and Impairs Predator Avoidance Behavior across Early Life Stages in Inland Silversides (Menidia beryllina). Aquat. Toxicol. 2019, 206, 1–13. [Google Scholar]
- Benjamini, Y.; Hochberg, Y. Controlling the False Discovery Rate: A Practical and Powerful Approach to Multiple Testing. J. R. Stat. Soc. Ser. B 1995, 57, 289–300. [Google Scholar] [CrossRef]
- Livak, K.J.; Schmittgen, T.D. Analysis of Relative Gene Expression Data Using Real-Time Quantitative PCR and the 2−ΔΔCT Method. Methods 2001, 25, 402–408. [Google Scholar] [CrossRef]
- Salisbury, T.B.; Binder, A.K.; Nilson, J.H. Welcoming β-Catenin to the Gonadotropin-Releasing Hormone Transcriptional Network in Gonadotropes. Mol. Endocrinol. 2008, 22, 1295–1303. [Google Scholar] [CrossRef] [Green Version]
- Wurmbach, E.; Yuen, T.; Ebersole, B.J.; Sealfon, S.C. Gonadotropin-Releasing Hormone Receptor-Coupled Gene Network Organization. J. Biol. Chem. 2001, 276, 47195–47201. [Google Scholar] [CrossRef] [PubMed] [Green Version]
- Yuen, T.; Wurmbach, E.; Ebersole, B.J.; Ruf, F.; Pfeffer, R.L.; Sealfon, S.C. Coupling of GnRH Concentration and the GnRH Receptor-Activated Gene Program. Mol. Endocrinol. 2002, 16, 1145–1153. [Google Scholar] [CrossRef]
- Rhodes, S.L.; Ritz, B. Genetics of Iron Regulation and the Possible Role of Iron in Parkinson’s Disease. Neurobiol. Dis. 2008, 32, 183–195. [Google Scholar] [CrossRef] [Green Version]
- Torti, F.M.; Torti, S.V. Regulation of Ferritin Genes and Protein. Blood 2002, 99, 3505–3516. [Google Scholar] [CrossRef] [PubMed] [Green Version]
- Orino, K.; Lehman, L.; Tsuji, Y.; Ayaki, H.; Torti, S.V.; Torti, F.M. Ferritin and the Response to Oxidative Stress. Biochem. J. 2001, 357, 241–247. [Google Scholar] [CrossRef] [PubMed]
- Tsuji, Y. JunD Activates Transcription of the Human Ferritin H Gene through an Antioxidant Response Element during Oxidative Stress. Oncogene 2005, 24, 7567–7578. [Google Scholar] [CrossRef] [Green Version]
- Connon, R.E.; Geist, J.; Pfeiff, J.; Loguinov, A.V.; Abronzo, L.S.D.; Wintz, H.; Vulpe, C.D.; Werner, I. Linking Mechanistic and Behavioral Responses to Sublethal Esfenvalerate Exposure in the Endangered Delta Smelt; Hypomesus transpacificus (Fam. Osmeridae). BMC Genom. 2009, 10, 608–625. [Google Scholar] [CrossRef] [PubMed] [Green Version]
- Jeffries, K.M.; Komoroske, L.M.; Truong, J.; Werner, I.; Hasenbein, M.; Hasenbein, S.; Fangue, N.A.; Connon, R.E. The Transcriptome-Wide Effects of Exposure to a Pyrethroid Pesticide on the Critically Endangered Delta Smelt Hypomesus transpacificus. Endanger. Species Res. 2015, 28, 43–60. [Google Scholar] [CrossRef] [Green Version]
- Bogdan, A.R.; Miyazawa, M.; Hashimoto, K.; Tsuji, Y. Regulators of Iron Homeostasis: New Players in Metabolism, Cell Death, and Disease. Trends Biochem. Sci. 2016, 41, 274–286. [Google Scholar] [CrossRef] [Green Version]
- Martyniuk, C.J.; Kroll, K.J.; Doperalski, N.J.; Barber, D.S.; Denslow, N.D. Genomic and Proteomic Responses to Environmentally Relevant Exposures to Eieldrin: Indicators of Neurodegeneration? Toxicol. Sci. 2010, 117, 190–199. [Google Scholar] [CrossRef]
- Chueh, T.; Hsu, L.-S.; Kao, C.-M.; Hsu, T.-W.; Liao, H.-Y.; Wang, K.-Y.; Chen, S.C. Transcriptome Analysis of Zebrafish Embryos Exposed to Deltamethrin. Environ. Toxicol. 2016, 32, 1548–1557. [Google Scholar] [CrossRef]
- Ullah, R.; Zuberi, A.; Naeem, M.; Ullah, S. Toxicity to Hematology and Morphology of Liver, Brain and Gills during Acute Exposure of Mahseer (Tor putitora) to Cypermethrin. Int. J. Agric. Biol. 2015, 17, 199–204. [Google Scholar]
- Ullah, S.; Li, Z.; Arifeen, M.Z.U.; Khan, S.U.; Fahad, S. Multiple Biomarkers Based Appraisal of Deltamethrin Induced Toxicity in Silver Carp (Hypophthalmichthys molitrix). Chemosphere 2019, 214, 519–533. [Google Scholar] [CrossRef] [PubMed]
- Gargouri, B.; Bhatia, H.S.; Bouchard, M.; Fiebich, B.L.; Fetoui, H. Inflammatory and Oxidative Mechanisms Potentiate Bifenthrin-Induced Neurological Alterations and Anxiety-like Behavior in Adult Rats. Toxicol. Lett. 2018, 294, 73–86. [Google Scholar] [CrossRef] [PubMed]
- Gargouri, B.; Yousif, N.M.; Attaai, A.; Bouchard, M.; Chtourou, Y.; Fiebich, B.L.; Fetoui, H. Pyrethroid Bifenthrin Induces Oxidative Stress, Neuroinflammation, and Neuronal Damage, Associated with Cognitive and Memory Impairment in Murine Hippocampus. Neurochem. Int. 2018, 120, 121–133. [Google Scholar] [CrossRef] [PubMed]
- Gargouri, B.; Yousif, N.M.; Bouchard, M.; Fetoui, H.; Fiebich, B.L. Inflammatory and Cytotoxic Effects of Bifenthrin in Primary Microglia and Organotypic Hippocampal Slice Cultures. J. Neuroinflamm. 2018, 15, 159. [Google Scholar] [CrossRef] [PubMed] [Green Version]
- Lu, X.; Hu, F.; Ma, Y.; Wang, C.; Zhang, Y.; Zhao, M. The Role of Oxidative Stress in Enantiomer-Specific, Bifenthrin-Induced Cytotoxicity in PC12 Cells. Environ. Toxicol. 2010, 26, 271–278. [Google Scholar] [CrossRef] [PubMed]
- Olsvik, P.A.; Aulin, M.; Samuelsen, O.B.; Hannisdal, R.; Agnalt, A.-L.; Bjørn, L.T. Whole-Animal Accumulation, Oxidative Stress, Transcriptomic and Metabolomic Responses in the Pink Shrimp (Pandalus montagui) Exposed to Teflubenzuron. J. Appl. Toxicol. 2019, 39, 485–497. [Google Scholar] [CrossRef]


Publisher’s Note: MDPI stays neutral with regard to jurisdictional claims in published maps and institutional affiliations. |
© 2021 by the authors. Licensee MDPI, Basel, Switzerland. This article is an open access article distributed under the terms and conditions of the Creative Commons Attribution (CC BY) license (http://creativecommons.org/licenses/by/4.0/).
Share and Cite
Magnuson, J.T.; Huff Hartz, K.E.; Fulton, C.A.; Lydy, M.J.; Schlenk, D. Transcriptomic and Histopathological Effects of Bifenthrin to the Brain of Juvenile Rainbow Trout (Oncorhynchus mykiss). Toxics 2021, 9, 48. https://0-doi-org.brum.beds.ac.uk/10.3390/toxics9030048
Magnuson JT, Huff Hartz KE, Fulton CA, Lydy MJ, Schlenk D. Transcriptomic and Histopathological Effects of Bifenthrin to the Brain of Juvenile Rainbow Trout (Oncorhynchus mykiss). Toxics. 2021; 9(3):48. https://0-doi-org.brum.beds.ac.uk/10.3390/toxics9030048
Chicago/Turabian StyleMagnuson, Jason T., Kara E. Huff Hartz, Corie A. Fulton, Michael J. Lydy, and Daniel Schlenk. 2021. "Transcriptomic and Histopathological Effects of Bifenthrin to the Brain of Juvenile Rainbow Trout (Oncorhynchus mykiss)" Toxics 9, no. 3: 48. https://0-doi-org.brum.beds.ac.uk/10.3390/toxics9030048