
An Easy Procedure to Quantify Anticoagulant Rodenticides and Pharmaceutical Active Compounds in Soils

 , , ,
, , ,  and
and
Abstract
:1. Introduction
2. Materials and Methods
2.1. Reagents and Chemicals
2.2. Standard Stock Solutions and Mixes
2.3. Sample Selection and Pretreatment
2.4. Sample Preparation
2.5. LC-MS/MS Analysis
2.6. In House Validation Parameters
3. Results and Discussion
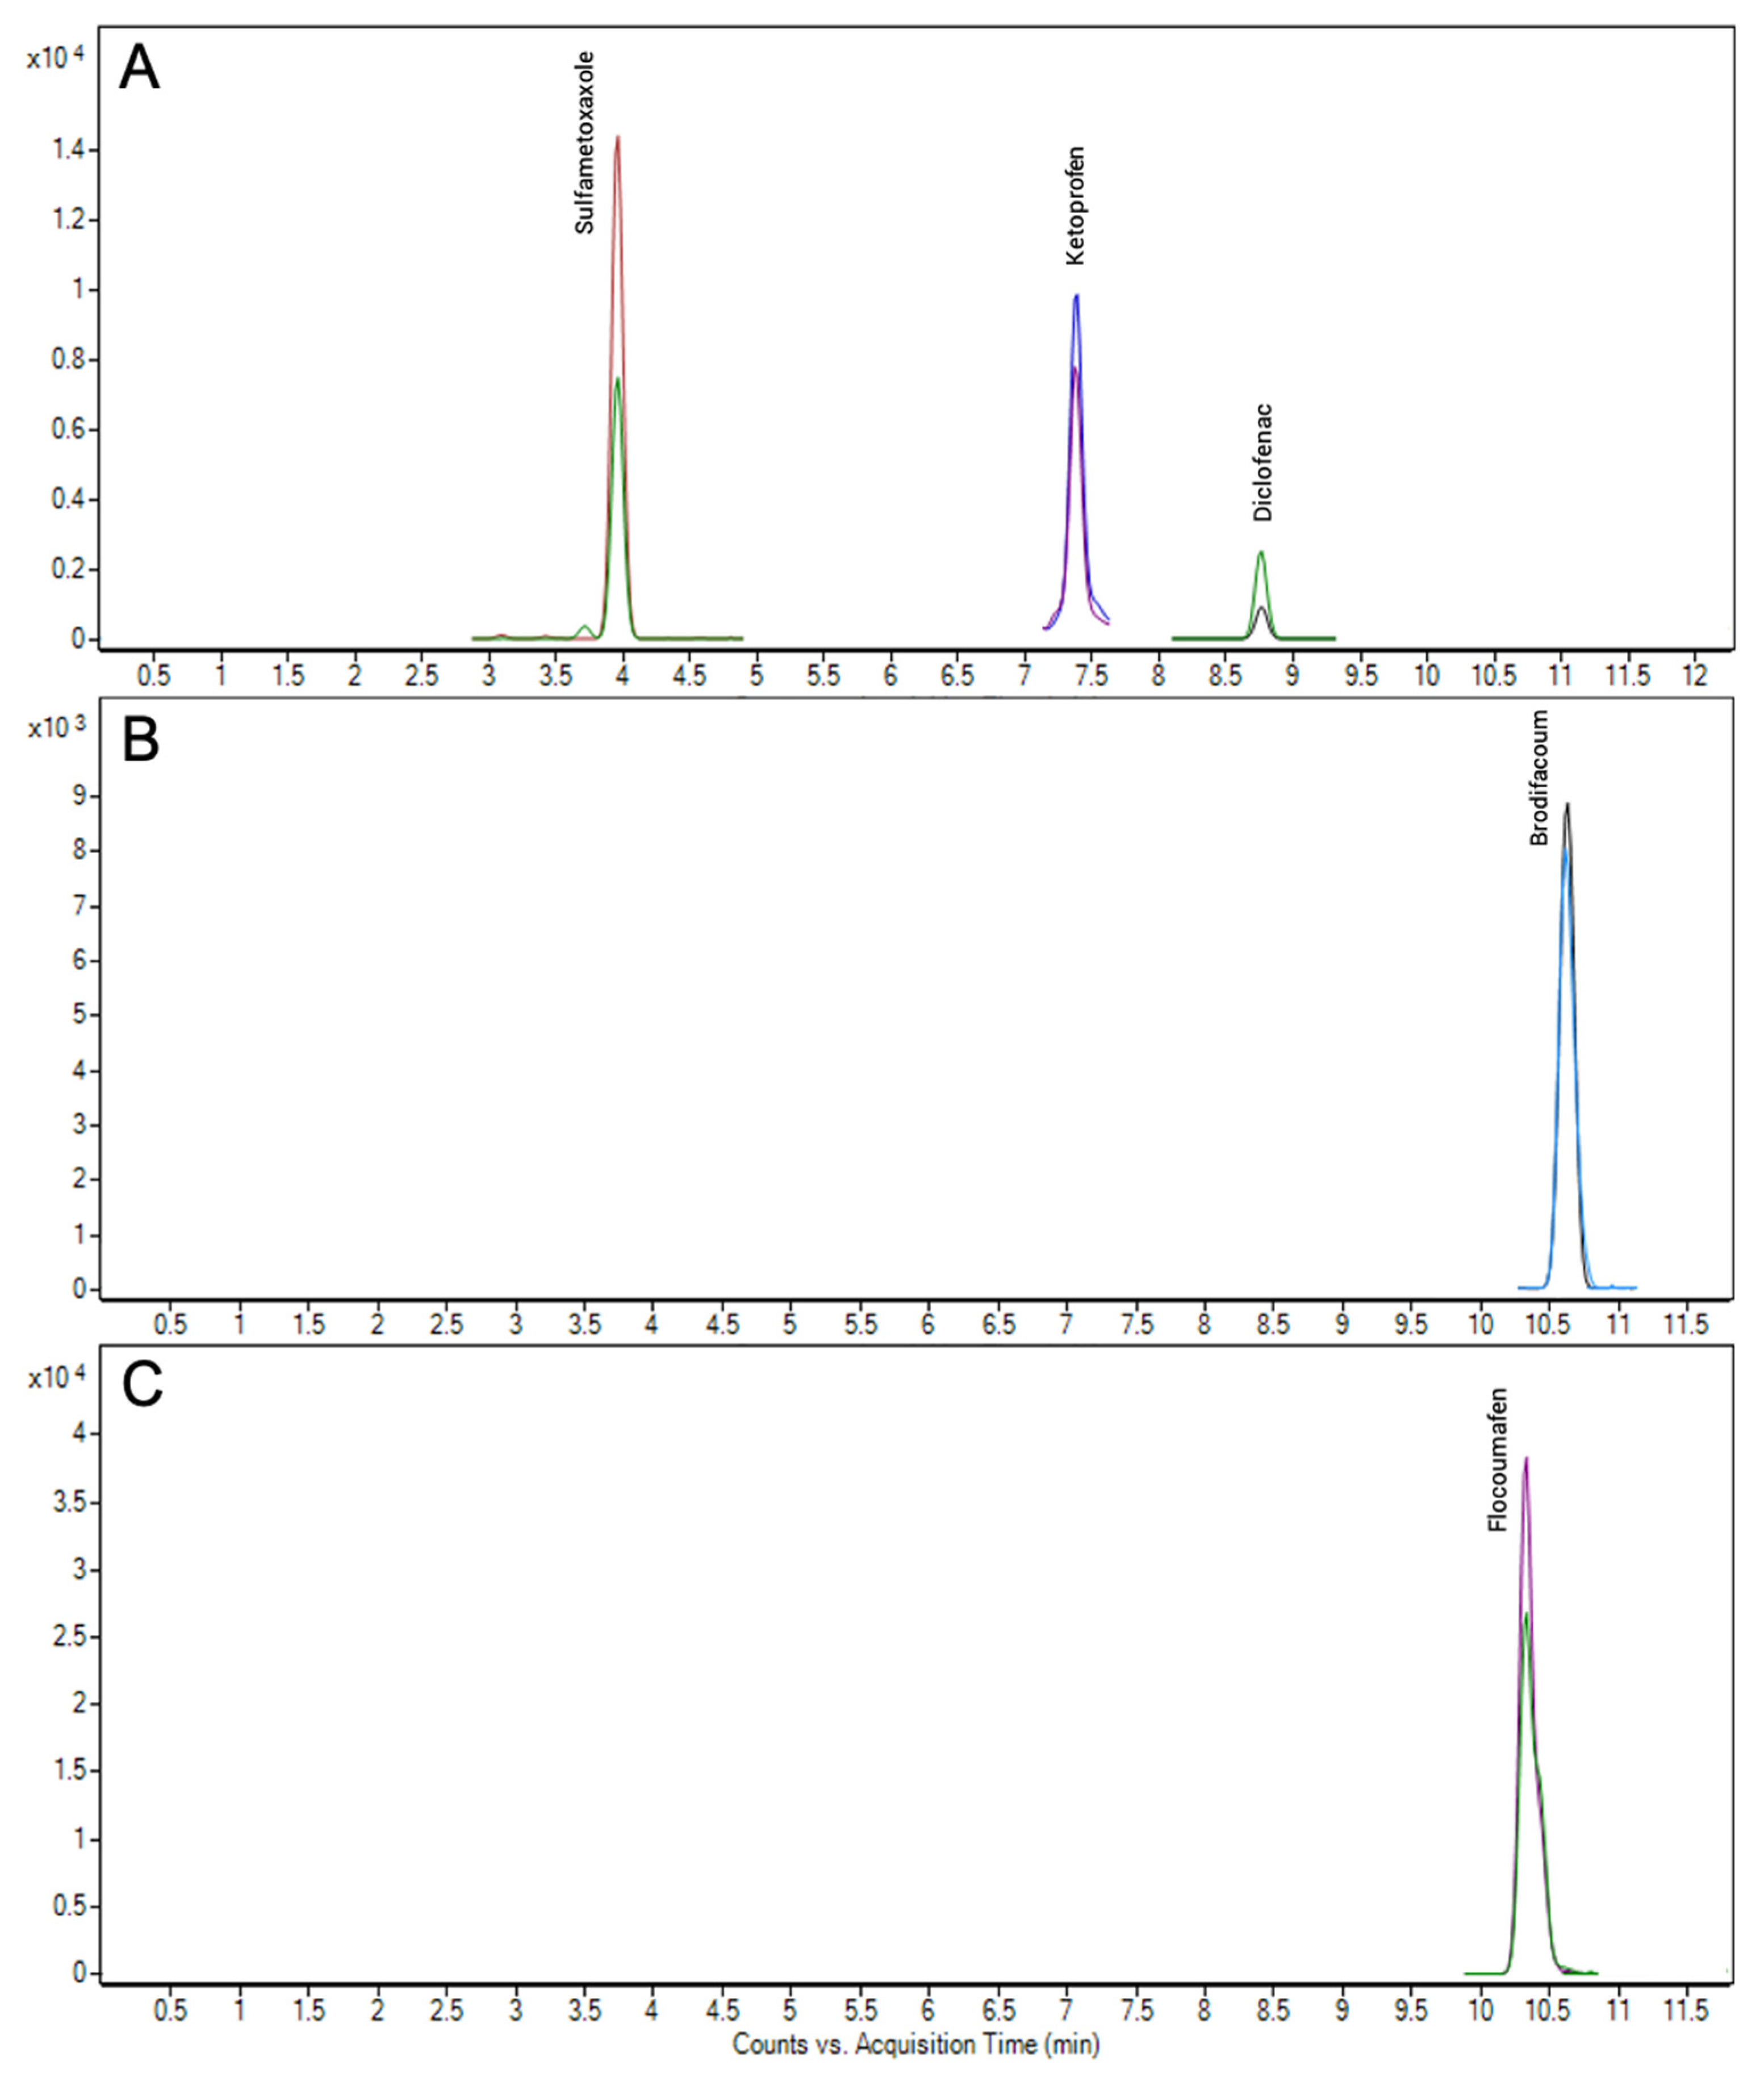
3.1. Optimization of LC-MS/MS Conditions
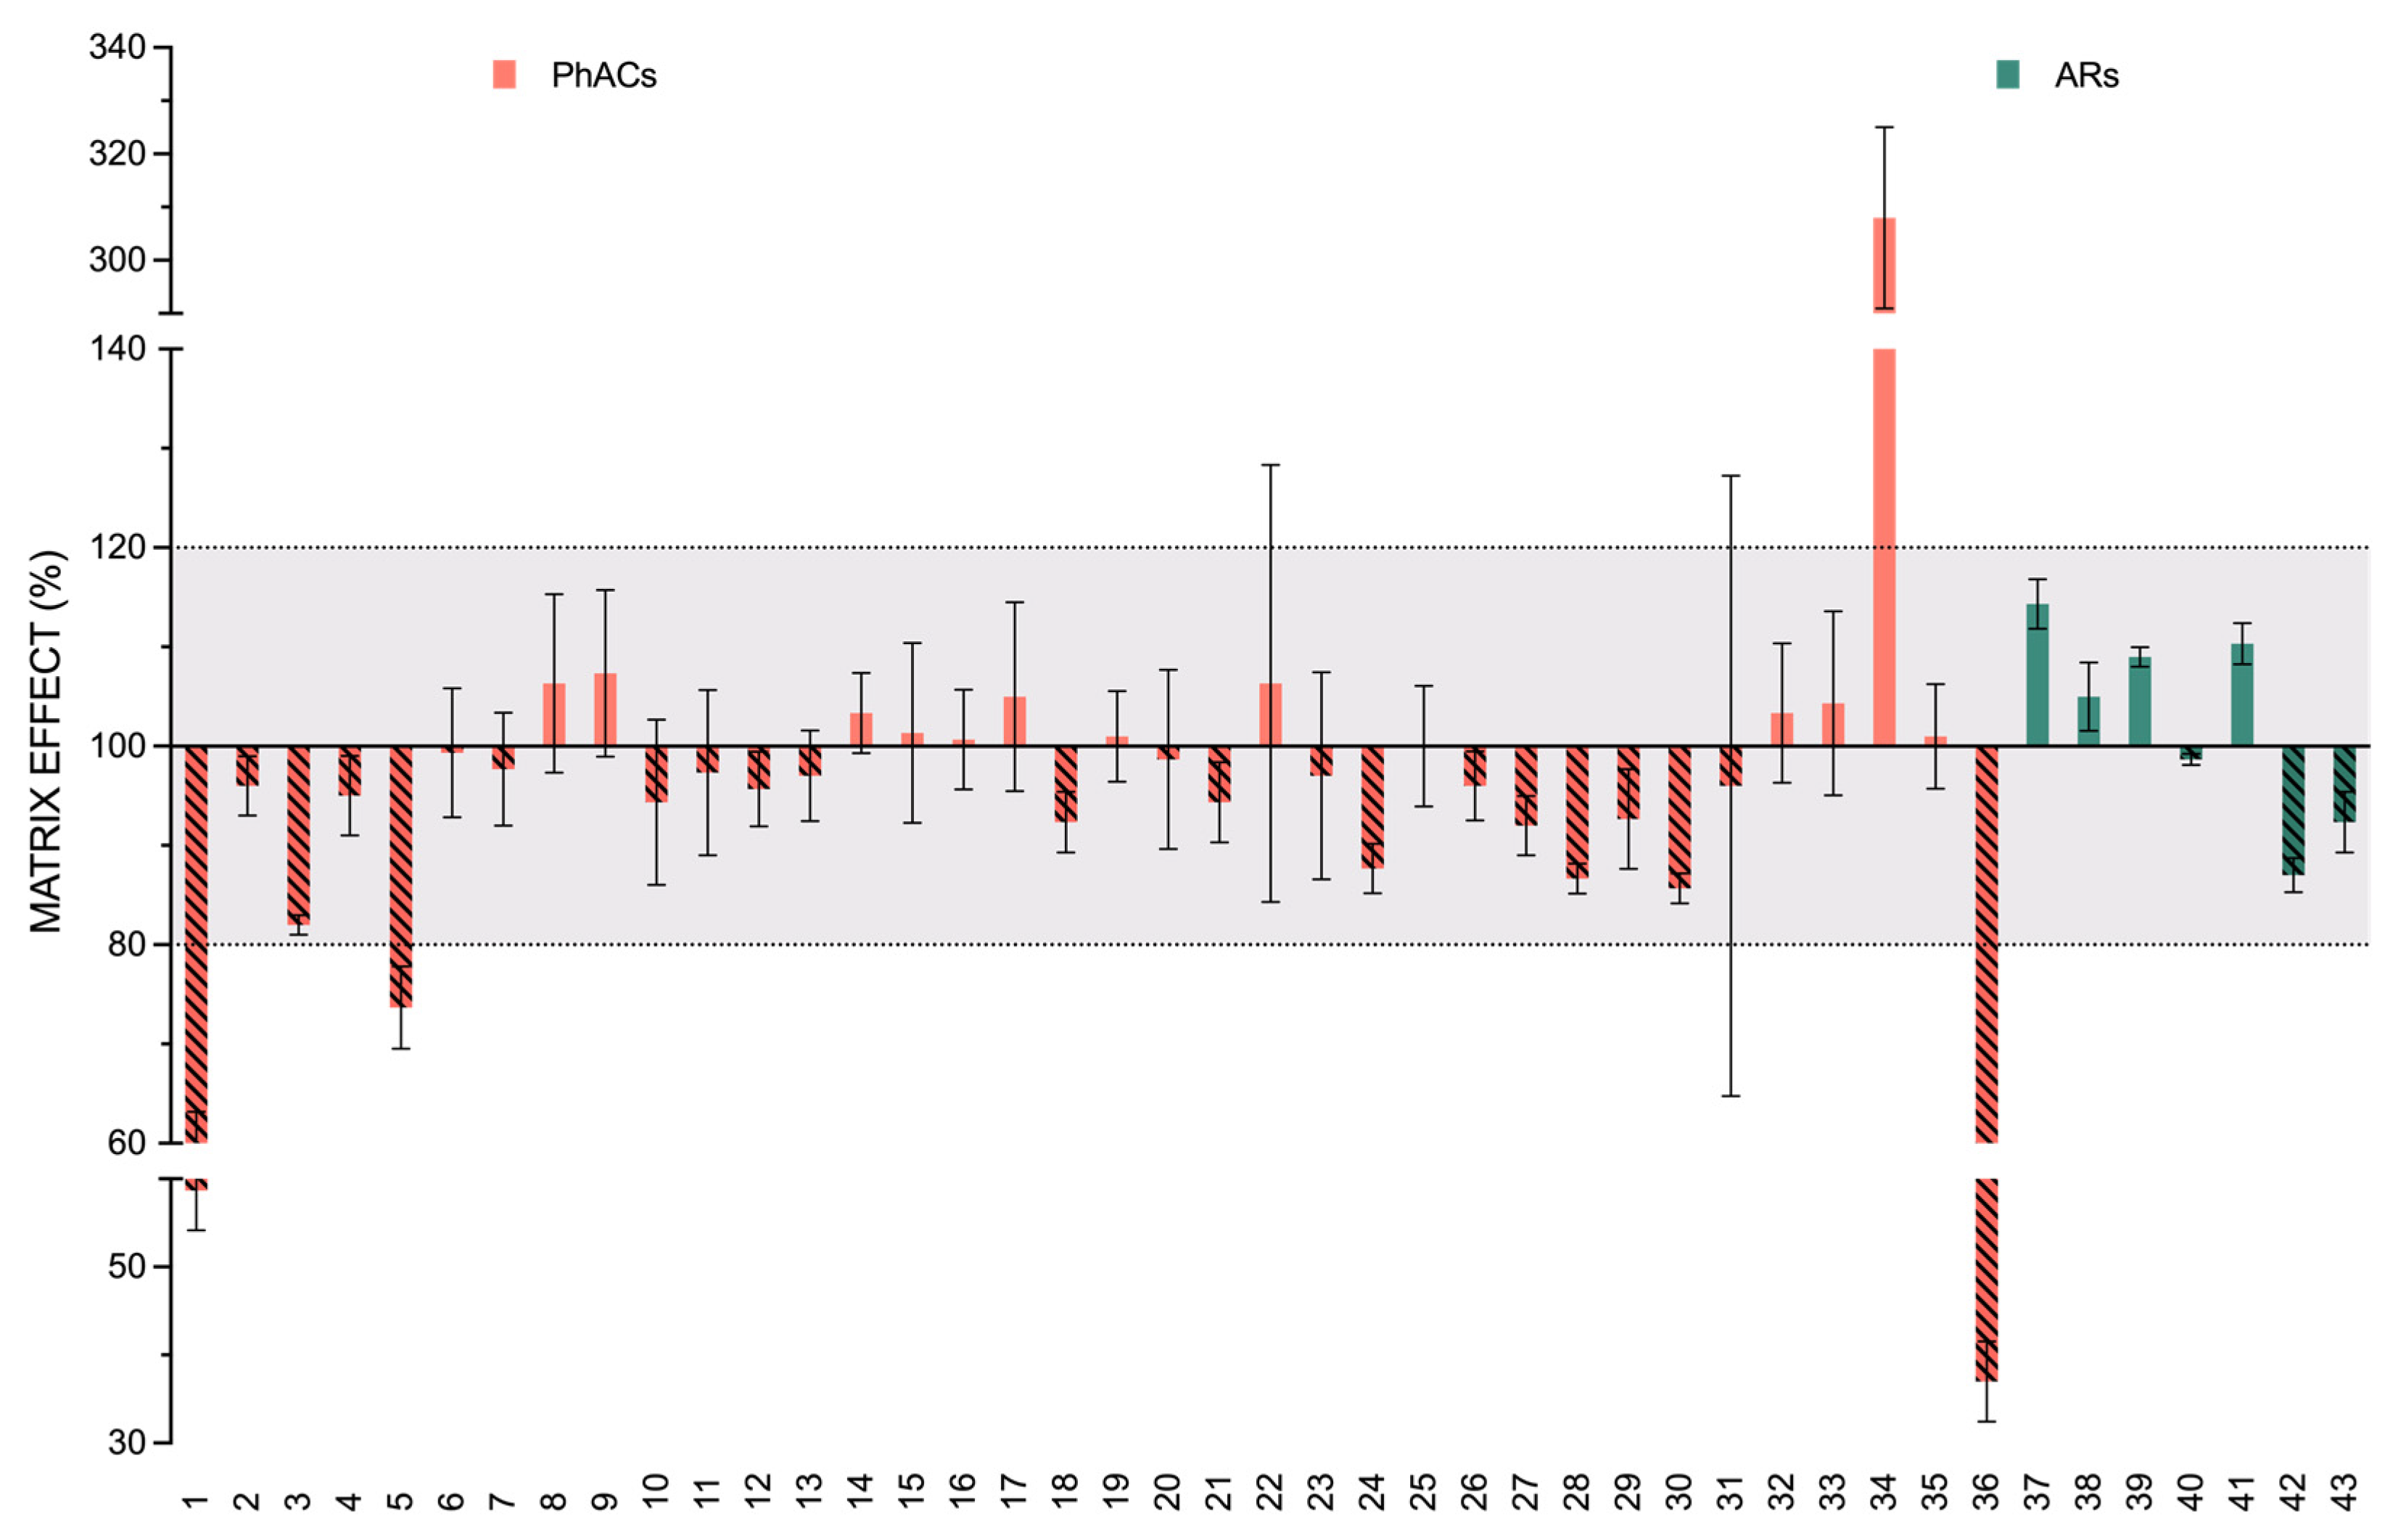
3.2. Matrix Effect Study
3.3. In House Validation Studies
3.4. Verifying the Method in Different Scenarios
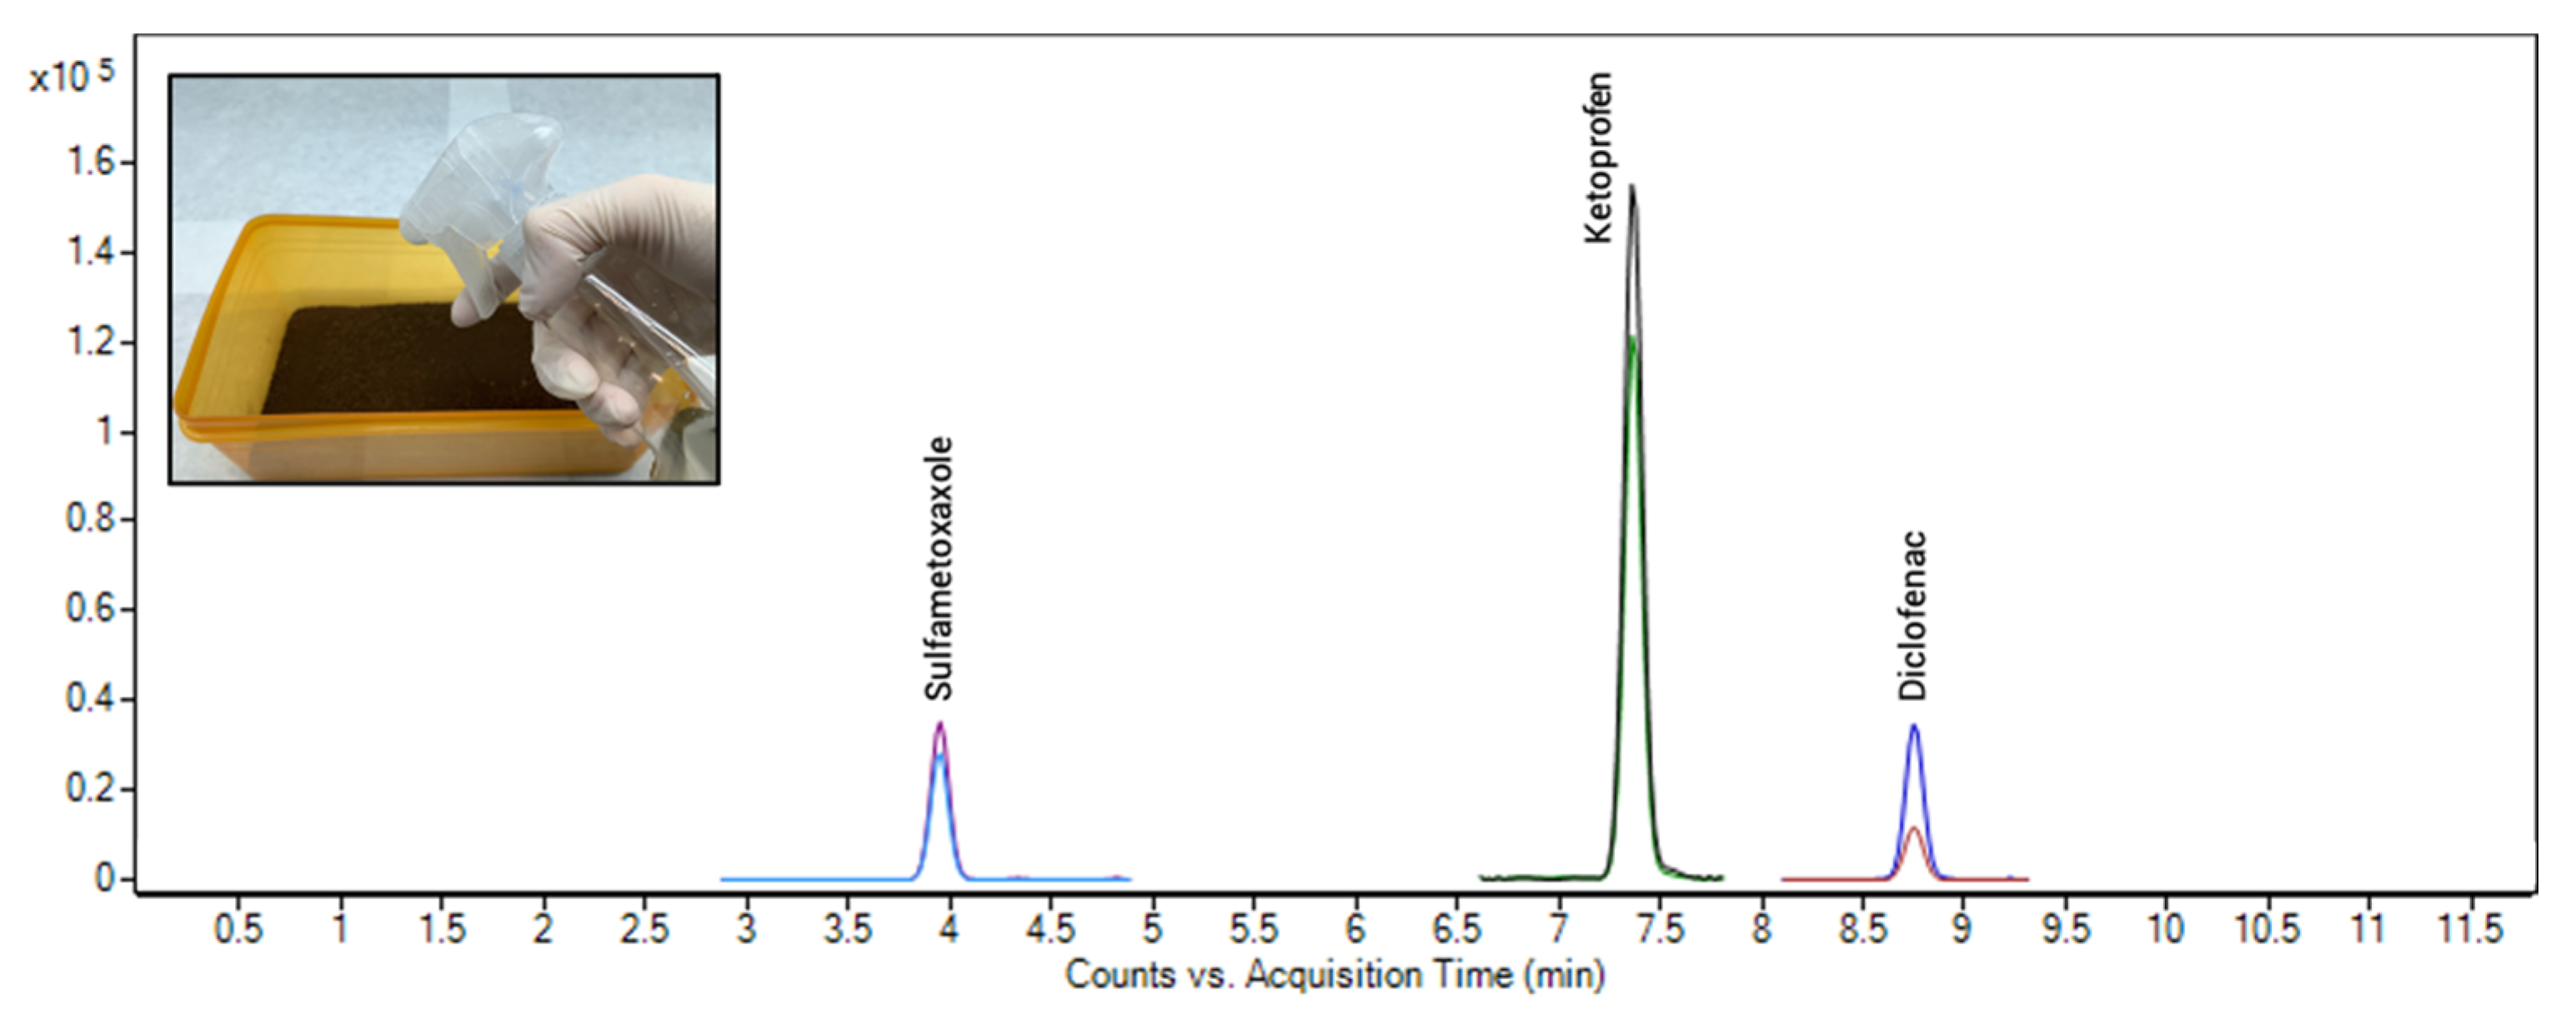
3.4.1. Agricultural Soil Samples
3.4.2. Environmental Forensic Investigation
4. Conclusions
Author Contributions
Funding
Data Availability Statement
Acknowledgments
Conflicts of Interest
References
- Fernandez-Alvarez, M.; Lamas, J.P.; Garcia-Chao, M.; Garcia-Jares, C.; Llompart, M.; Lores, M.; Dagnac, T. Monitoring of pesticide residues in dairy cattle farms from NW Spain. J. Environ. Monit. 2010, 12, 1864. [Google Scholar] [CrossRef] [PubMed]
- Watt, B.E.; Proudfoot, A.T.; Bradberry, S.M.; Vale, J.A. Anticoagulant rodenticides. Toxicol. Rev. 2005, 24, 259–269. [Google Scholar] [CrossRef] [PubMed]
- Pelfrène, A.F. Rodenticides. In Hayes’ Handbook of Pesticide Toxicology; Elsevier: Amsterdam, The Netherlands, 2010; pp. 2153–2217. [Google Scholar]
- Murphy, M.J. Anticoagulant Rodenticides. In Veterinary Toxicology: Basic and Clinical Principles, 3rd ed.; Elsevier: Amsterdam, The Netherlands, 2018; ISBN 9780128114100. [Google Scholar]
- Jackson, W.B.; Brooks, J.E.; Bowerman, A.M.; Kaukeinen, D.E. Anticoagulant resistance in Norway rats as found in US cities. Pest Control 1975, 43, 12–16. [Google Scholar]
- Singer, D.E.; Chang, Y.; Fang, M.C.; Borowsky, L.H.; Pomernacki, N.K.; Udaltsova, N.; Go, A.S. The net clinical benefit of warfarin anticoagulation in atrial fibrillation. Ann. Intern. Med. 2009, 151, 297–305. [Google Scholar] [CrossRef] [PubMed]
- Gómez-Canela, C.; Lacorte, S. Comprehensive characterization of anticoagulant rodenticides in sludge by liquid chromatography-tandem mass spectrometry. Environ. Sci. Pollut. Res. 2016, 23, 15739–15748. [Google Scholar] [CrossRef] [PubMed]
- Gómez-Canela, C.; Barata, C.; Lacorte, S. Occurrence, elimination, and risk of anticoagulant rodenticides and drugs during wastewater treatment. Environ. Sci. Pollut. Res. 2014, 21, 7194–7203. [Google Scholar] [CrossRef]
- Jelić, A.; Petrović, M.; Barceló, D. Multi-residue method for trace level determination of pharmaceuticals in solid samples using pressurized liquid extraction followed by liquid chromatography/quadrupole-linear ion trap mass spectrometry. Talanta 2009, 80, 363–371. [Google Scholar] [CrossRef] [PubMed]
- Margalida, A.; Bogliani, G.; Bowden, C.G.R.; Donázar, J.A.; Genero, F.; Gilbert, M.; Karesh, W.B.; Kock, R.; Lubroth, J.; Manteca, X.; et al. One Health approach to use of veterinary pharmaceuticals. Science (80-) 2014, 346, 1296–1298. [Google Scholar] [CrossRef] [Green Version]
- Díaz-Cruz, M.S.; Barceló, D. LC-MS2 trace analysis of antimicrobials in water, sediment and soil. TrAC Trends Anal. Chem. 2005, 24, 645–657. [Google Scholar] [CrossRef]
- Kim, K.R.; Owens, G.; Kwon, S.I.; So, K.H.; Lee, D.B.; Ok, Y.S. Occurrence and environmental fate of veterinary antibiotics in the terrestrial environment. Water. Air. Soil Pollut. 2011, 214, 163–174. [Google Scholar] [CrossRef]
- Kaczala, F.; Blum, S.E. The Occurrence of Veterinary Pharmaceuticals in the Environment: A Review. Curr. Anal. Chem. 2015, 12, 169–182. [Google Scholar] [CrossRef] [Green Version]
- Gómez-Canela, C.; Vázquez-Chica, A.; Lacorte, S. Comprehensive characterization of rodenticides in wastewater by liquid chromatography-tandem mass spectrometry. Anal. Bioanal. Chem. 2014, 406, 345–358. [Google Scholar] [CrossRef] [PubMed]
- Gómez-Canela, C.; Barth, J.A.C.; Lacorte, S. Occurrence and fate of perfluorinated compounds in sewage sludge from Spain and Germany. Environ. Sci. Pollut. Res. 2012, 19, 4109–4119. [Google Scholar] [CrossRef]
- Cuthbert, R.J.; Taggart, M.A.; Prakash, V.; Chakraborty, S.S.; Deori, P.; Galligan, T.; Kulkarni, M.; Ranade, S.; Saini, M.; Sharma, A.K.; et al. Avian scavengers and the threat from veterinary pharmaceuticals. Philos. Trans. R. Soc. B Biol. Sci. 2014, 369. [Google Scholar] [CrossRef] [PubMed] [Green Version]
- Schaff, J.E.; Montgomery, M.A. An HPLC-HR-MS-MS Method for identification of anticoagulant rodenticides in blood *. J. Anal. Toxicol. 2013, 37, 321–325. [Google Scholar] [CrossRef] [PubMed] [Green Version]
- André, C.; Guyon, C.; Thomassin, M.; Barbier, A.; Richert, L.; Guillaume, Y.C. Association mechanism between a series of rodenticide and humic acid: A frontal analysis to support the biological data. J. Chromatogr. B Anal. Technol. Biomed. Life Sci. 2005, 820, 9–14. [Google Scholar] [CrossRef] [PubMed]
- Kemper, N.; Färber, H.; Skutlarek, D.; Krieter, J. Analysis of antibiotic residues in liquid manure and leachate of dairy farms in Northern Germany. Agric. Water Manag. 2008, 95, 1288–1292. [Google Scholar] [CrossRef]
- Pitt, W.C.; Berentsen, A.R.; Shiels, A.B.; Volker, S.F.; Eisemann, J.D.; Wegmann, A.S.; Howald, G.R. Non-target species mortality and the measurement of brodifacoum rodenticide residues after a rat (Rattus rattus) eradication on Palmyra Atoll, tropical Pacific. Biol. Conserv. 2015, 185, 36–46. [Google Scholar] [CrossRef] [Green Version]
- Obimakinde, S.; Fatoki, O.; Opeolu, B.; Olatunji, O. Veterinary pharmaceuticals in aqueous systems and associated effects: An update. Environ. Sci. Pollut. Res. 2017, 24, 3274–3297. [Google Scholar] [CrossRef]
- Arnold, K.E.; Brown, A.R.; Brown, A.R.; Ankley, G.T.; Sumpter, J.P. Medicating the environment: Assessing risks of pharmaceuticals to wildlife and ecosystems. Philos. Trans. R. Soc. B Biol. Sci. 2014, 369. [Google Scholar] [CrossRef] [PubMed] [Green Version]
- Bártíková, H.; Skálová, L.; Stuchĺková, L.; Vokřál, I.; Vaněk, T.; Podlipná, R. Xenobiotic-metabolizing enzymes in plants and their role in uptake and biotransformation of veterinary drugs in the environment. Drug Metab. Rev. 2015, 47, 374–387. [Google Scholar] [PubMed]
- Blanco, G.; Junza, A.; Barrón, D. Occurrence of veterinary pharmaceuticals in golden eagle nestlings: Unnoticed scavenging on livestock carcasses and other potential exposure routes. Sci. Total Environ. 2017, 586, 355–361. [Google Scholar] [CrossRef]
- Ruiz-Suárez, N.; Melero, Y.; Giela, A.; Henríquez-Hernández, L.A.; Sharp, E.; Boada, L.D.; Taylor, M.J.; Camacho, M.; Lambin, X.; Luzardo, O.P.; et al. Rate of exposure of a sentinel species, invasive American mink (Neovison vison) in Scotland, to anticoagulant rodenticides. Sci. Total Environ. 2016, 569–570, 1013–1021. [Google Scholar] [CrossRef] [PubMed] [Green Version]
- Gao, X.; Li, H.; Li, H.; Dong, S.; Chu, J.; Guo, H.; Zhao, Q. Sensitive determination of nine anticoagulant rodenticides in blood by high resolution mass spectrometry with supported liquid extraction pretreatment. Forensic Sci. Int. 2018, 292, 39–44. [Google Scholar] [CrossRef] [PubMed]
- Barron, L.; Tobin, J.; Paull, B. Multi-residue determination of pharmaceuticals in sludge and sludge enriched soils using pressurized liquid extraction, solid phase extraction and liquid chromatography with tandem mass spectrometry. J. Environ. Monit. 2008, 10, 353–361. [Google Scholar] [CrossRef]
- Hernández, A.M.; Bernal, J.; Bernal, J.L.; Martín, M.T.; Caminero, C.; Nozal, M.J. Simultaneous determination of nine anticoagulant rodenticides in soil and water by LC-ESI-MS. J. Sep. Sci. 2013, 36, 2593–2601. [Google Scholar] [CrossRef] [PubMed]
- Ogilvie, S.C.; Pierce, R.J.; Wright, G.R.G.; Booth, L.H.; Eason, C.T. Brodifacoum residue analysis in water, soil, invertebrates, and birds after rat eradication on Lady Alice Island. N. Z. J. Ecol. 1997, 21, 195–197. [Google Scholar] [CrossRef]
- Medvedovici, A.; David, F.; Sandra, P. Determination of the rodenticides warfarin, diphenadione and chlorophacinone in soil samples by HPLC-DAD. Talanta 1997, 44, 1633–1640. [Google Scholar] [CrossRef]
- Chen, W.; Geng, M.; Zhang, L.; Xu, L.; Yuan, H.; Li, C.; Peng, C.; Wang, J.; Zhang, M. Determination of coumarin rodenticides in soils by high performance liquid chromatography. Chinese J. Chromatogr. (Se Pu) 2016, 34, 912–917. [Google Scholar] [CrossRef] [Green Version]
- Laktičová, K.; Hromada, R.; Ondrašovič, M.; Legáth, J.; Ďurečko, R.; Ondrašovičová, O.; Nowakovic-Dȩbek, B.; Saba, L. Occurrence of residues of warfarin after its application to cereal crops. Polish J. Environ. Stud. 2009, 18, 405–409. [Google Scholar]
- Lee, Y.J.; Choi, J.H.; Abd El-Aty, A.M.; Chung, H.S.; Lee, H.S.; Kim, S.W.; Rahman, M.M.; Park, B.J.; Kim, J.E.; Shin, H.C.; et al. Development of a single-run analytical method for the detection of ten multiclass emerging contaminants in agricultural soil using an acetate-buffered QuEChERS method coupled with LC–MS/MS. J. Sep. Sci. 2017, 40, 415–423. [Google Scholar] [CrossRef] [PubMed]
- Ferhi, S.; Bourdat-Deschamps, M.; Daudin, J.J.; Houot, S.; Nélieu, S. Factors influencing the extraction of pharmaceuticals from sewage sludge and soil: An experimental design approach. Anal. Bioanal. Chem. 2016, 408, 6153–6168. [Google Scholar] [CrossRef] [PubMed]
- Salvia, M.V.; Vulliet, E.; Wiest, L.; Baudot, R.; Cren-Olivé, C. Development of a multi-residue method using acetonitrile-based extraction followed by liquid chromatography-tandem mass spectrometry for the analysis of steroids and veterinary and human drugs at trace levels in soil. J. Chromatogr. A 2012, 1245, 122–133. [Google Scholar] [CrossRef] [PubMed]
- Bragança, I.; Plácido, A.; Paíga, P.; Domingues, V.F.; Delerue-Matos, C. QuEChERS: A new sample preparation approach for the determination of ibuprofen and its metabolites in soils. Sci. Total Environ. 2012, 433, 281–289. [Google Scholar] [CrossRef] [PubMed] [Green Version]
- Anastassiades, M.; Lehotay, S.J.; Štajnbaher, D.; Schenck, F.J. Fast and easy multiresidue method employing acetonitrile extraction/partitioning and “dispersive solid-phase extraction” for the determination of pesticide residues in produce. J. AOAC Int. 2003, 86, 412–431. [Google Scholar] [CrossRef] [PubMed] [Green Version]
- Perestrelo, R.; Silva, P.; Porto-Figueira, P.; Pereira, J.A.M.; Silva, C.; Medina, S.; Câmara, J.S. QuEChERS—Fundamentals, relevant improvements, applications and future trends. Anal. Chim. Acta 2019, 1070, 1–28. [Google Scholar] [CrossRef] [PubMed]
- Asensio-Ramos, M.; Hernández-Borges, J.; Ravelo-Pérez, L.M.; Rodríguez-Delgado, M.A. Evaluation of a modified QuEChERS method for the extraction of pesticides from agricultural, ornamental and forestal soils. Anal. Bioanal. Chem. 2010, 396, 2307–2319. [Google Scholar] [CrossRef] [PubMed]
- Vieira, N.M.; Paiva, M.C.G.; da Silva, A.A.; Costa, A.I.G.; de Freitas, F.C.L.; da Costa Marinho, M.I. Validation and application of a QuEChERS based method for estimation of half-life of imidazolinone herbicides in soils by LC-ESI-MS/MS. Ecotoxicol. Environ. Saf. 2018, 167, 212–217. [Google Scholar] [CrossRef]
- Acosta-Dacal, A.; Rial-Berriel, C.; Díaz-Díaz, R.; del Mar Bernal-Suárez, M.; Luzardo, O.P. Optimization and validation of a QuEChERS-based method for the simultaneous environmental monitoring of 218 pesticide residues in clay loam soil. Sci. Total Environ. 2021, 753, 142015. [Google Scholar] [CrossRef]
- He, Z.; Wang, L.; Peng, Y.; Luo, M.; Wang, W.; Liu, X. Determination of selected polychlorinated biphenyls in soil and earthworm (Eisenia fetida) using a QuEChERS-based method and gas chromatography with tandem MS. J. Sep. Sci. 2015, 38, 3766–3773. [Google Scholar] [CrossRef]
- Rouvire, F.; Buleté, A.; Cren-Olivé, C.; Arnaudguilhem, C. Multiresidue analysis of aromatic organochlorines in soil by gas chromatography-mass spectrometry and QuEChERS extraction based on water/dichloromethane partitioning. Comparison with accelerated solvent extraction. Talanta 2012, 93, 336–344. [Google Scholar] [CrossRef]
- Cao, X.; Yang, X.; Liu, Z.; Jiao, H.; Liu, S.; Liu, L.; Meng, Q. Rapid Simultaneous Screening and Detection of 12 Anticoagulant Rodenticides in Food by Ultra-performance Liquid Chromatography-Triple Quadrupole/Linear Ion Trap Tandem Mass Spectrometry. Food Anal. Methods 2017, 10, 3538–3547. [Google Scholar] [CrossRef]
- Zhu, F.; Liu, H.; Chen, B.; Rong, W.; Ma, Y. Rapid simultaneous screening and detection of ten anticoagulant rodenticides in foods by ultra-high performance liquid chromatography-tandem mass spectrometry. Chin. J. Chromatogr. 2013, 31, 473. [Google Scholar] [CrossRef] [PubMed]
- Gómez-Ramírez, P.; Martínez-López, E.; Navas, I.; María-Mojica, P.; García-Fernández, A.J. A modification of QuEChERS method to analyse anticoagulant rodenticides using small blood samples. Rev. Toxicol. 2012, 29, 10–14. [Google Scholar]
- Rial-Berriel, C.; Acosta-Dacal, A.; Zumbado, M.; Luzardo, O.P. Micro QuEChERS-based method for the simultaneous biomonitoring in whole blood of 360 toxicologically relevant pollutants for wildlife. Sci. Total Environ. 2020, 736. [Google Scholar] [CrossRef] [PubMed]
- Almeida, C.M.M. Overview of Sample Preparation and Chromatographic Methods to Analysis Pharmaceutical Active Compounds in Waters Matrices. Separations 2021, 8, 16. [Google Scholar] [CrossRef]
- Vudathala, D.; Cummings, M.; Murphy, L. Analysis of multiple anticoagulant rodenticides in animal blood and liver tissue using principles of QuEChERS method. J. Anal. Toxicol. 2010, 34, 273–279. [Google Scholar] [CrossRef] [PubMed] [Green Version]
- Orfanidis, A.; Gika, H.; Theodoridis, G.; Mastrogianni, O.; Raikos, N. Development of a UHPLC-MS/MS method for the determination of 84 pharmaceuticals and drugs of abuse in human liver. J. Chromatogr. B Anal. Technol. Biomed. Life Sci. 2020, 1151, 122192. [Google Scholar] [CrossRef] [PubMed]
- Martínez-Huelamo, M.; Jiménez-Gámez, E.; Hermo, M.P.; Barrón, D.; Barbosa, J. Determination of penicillins in milk using LC-UV, LC-MS and LC-MS/MS. J. Sep. Sci. 2009, 32, 2385–2393. [Google Scholar] [CrossRef]
- Hroboňová, K.; Sádecká, J.; Čižmárik, J. HPLC separation and determination of dicoumarol and other simple coumarins in sweet clover. Nov. Biotechnol. Chim. 2018, 17, 95–102. [Google Scholar] [CrossRef]
- Hernández, A.M.; Bernal, J.; Bernal, J.L.; Martín, M.T.; Caminero, C.; Nozal, M.J. Analysis of anticoagulant rodenticide residues in Microtus arvalis tissues by liquid chromatography with diode array, fluorescence and mass spectrometry detection. J. Chromatogr. B Anal. Technol. Biomed. Life Sci. 2013, 925, 76–85. [Google Scholar] [CrossRef]
- Gallocchio, F.; Basilicata, L.; Benetti, C.; Angeletti, R.; Binato, G. Multi-residue determination of eleven anticoagulant rodenticides by high-performance liquid chromatography with diode array/fluorimetric detection: Investigation of suspected animal poisoning in the period 2012–2013 in north-eastern Italy. Forensic Sci. Int. 2014, 244, 63–69. [Google Scholar] [CrossRef] [PubMed]
- Tuerk, J.; Reinders, M.; Dreyer, D.; Kiffmeyer, T.K.; Schmidt, K.G.; Kuss, H.M. Analysis of antibiotics in urine and wipe samples from environmental and biological monitoring—Comparison of HPLC with UV-, single MS- and tandem MS-detection. J. Chromatogr. B Anal. Technol. Biomed. Life Sci. 2006, 831, 72–80. [Google Scholar] [CrossRef] [PubMed]
- Taylor, M.J.; Giela, A.; Sharp, E.A.; Senior, C.C.; Vyas, D.S. A rapid multi-class, multi-residue UHPLC-MS/MS method for the simultaneous determination of anticoagulant rodenticides, pesticides and veterinary medicines in wild animals, pets and livestock. Anal. Methods 2019, 11, 1087–1101. [Google Scholar] [CrossRef]
- Bourdat-Deschamps, M.; Leang, S.; Bernet, N.; Daudin, J.J.; Nélieu, S. Multi-residue analysis of pharmaceuticals in aqueous environmental samples by online solid-phase extraction-ultra-high-performance liquid chromatography-tandem mass spectrometry: Optimisation and matrix effects reduction by quick, easy, cheap, effective, rugged and safe extraction. J. Chromatogr. A 2014, 1349, 11–23. [Google Scholar] [CrossRef] [PubMed]
- SANTE/12682 Guidance document on analytical quality control and validation procedures for pesticide residues analysis in food and feed. Eur. Comm. Health Consum. Prot. Dir. 2019, 2–44. Available online: https://www.eurl-pesticides.eu/docs/public/tmplt_article.asp?CntID=727 (accessed on 8 March 2021).
- Lehotay, S.J.; O’Neil, M.; Tully, J.; García, A.V.; Contreras, M.; Mol, H.; Heinke, V.; Anspach, T.; Lach, G.; Fussell, R.; et al. Determination of pesticide residues in foods by acetonitrile extraction and partitioning with magnesium sulfate: Collaborative study. J. AOAC Int. 2007, 90, 485–520. [Google Scholar] [CrossRef] [Green Version]
- Acosta-Dacal, A.; Rial-Berriel, C.; Díaz-Díaz, R.; del Mar Bernal-Suárez, M.; Zumbado, M.; Henríquez-Hernández, L.A.; Luzardo, O.P. Supporting dataset on the optimization and validation of a QuEChERS-based method for the determination of 218 pesticide residues in clay loam soil. Data Br. 2020, 33, 106393. [Google Scholar] [CrossRef] [PubMed]
- SANCO/825/00 Guidance Document on Pesticide Residue Analytical Methods. 2010. Available online: https://ec.europa.eu/food/sites/food/files/plant/docs/pesticides_ppp_app-proc_guide_res_post-reg-cont-monitor.pdf (accessed on 8 March 2021).
- Raposo, F. Evaluation of analytical calibration based on least-squares linear regression for instrumental techniques: A tutorial review. TrAC Trends Anal. Chem. 2016, 77, 167–185. [Google Scholar] [CrossRef]
- Kamel, A.M.; Brown, P.R.; Munson, B. Effects of mobile-phase additives, solution pH, ionization constant, and analyte concentration on the sensitivities and electrospray ionization mass spectra of nucleoside antiviral agents. Anal. Chem. 1999, 71, 5481–5492. [Google Scholar] [CrossRef]
- King, R.; Bonfiglio, R.; Fernandez-Metzler, C.; Miller-Stein, C.; Olah, T. Mechanistic investigation of ionization suppression in electrospray ionization. J. Am. Soc. Mass Spectrom. 2000, 11, 942–950. [Google Scholar] [CrossRef] [Green Version]
- Kruve, A.; Kaupmees, K. Adduct Formation in ESI/MS by Mobile Phase Additives. J. Am. Soc. Mass Spectrom. 2017, 28, 887–894. [Google Scholar] [CrossRef] [PubMed]
- Danaher, M.; O’Keeffe, M.; Glennon, J.D.; Howells, L. Development and optimisation of an improved derivatisation procedure for the determination of avermectins and milbemycins in bovine liver. Analyst 2001, 126, 576–580. [Google Scholar] [CrossRef] [PubMed]


| N° | Compound | Category a | Legal Status in the EU b | tR (min) | Polarity | Quantification | Confirmation | Fragmentor Voltage (V) | ||
|---|---|---|---|---|---|---|---|---|---|---|
| MRM Transition (m/z) | CE (eV) | MRM transition (m/z) | CE (eV) | |||||||
| 1 | Sulfanilamide | PhACs, AB | Approved | 1.06 | Positive | 173.0 → 93.0 | 24 | 173.0 → 76.1 | 50 | 126 |
| 2 | Sulfacetamide | PhACs, AB | Approved | 2.28 | Positive | 215.3 → 92.0 | 20 | 215.3 → 65.3 | 45 | 90 |
| 3 | Metronidazole | PhACs, AB | Approved | 2.73 | Positive | 172.1 → 128.0 | 12 | 172.1 → 82.1 | 24 | 98 |
| 4 | Sulfadiacine | PhACs, AB | Approved | 2.82 | Positive | 251.0 → 92.0 | 28 | 251.0 → 156.0 | 12 | 111 |
| 5 | Sulfapyridine | PhACs, AB | Approved | 3.16 | Positive | 250.0 → 92.0 | 28 | 250.0 → 156.0 | 12 | 126 |
| 6 | Sulfameracine | PhACs, AB | Not approved | 3.29 | Positive | 265.0 → 92.0 | 28 | 265.0 → 156.0 | 12 | 126 |
| 7 | Sulfametizole | PhACs, AB | Not approved | 3.59 | Positive | 271.0 → 155.9 | 8 | 271.0 → 92.0 | 28 | 103 |
| 8 | Sulfametacine | PhACs, AB | Not approved | 3.68 | Positive | 279.1 → 186.0 | 12 | 279.1 → 92.0 | 32 | 134 |
| 9 | Sulfametoxipiridacine | PhACs, AB | Not approved | 3.76 | Positive | 281.0 → 155.9 | 12 | 281.0 → 92.1 | 28 | 121 |
| 10 | Sulfachloropiridacine | PhACs, AB | Not approved | 3.89 | Positive | 285.0 → 156.0 | 12 | 285.0 → 92.1 | 28 | 101 |
| 11 | Sulfametoxazole | PhACs, AB | Approved | 3.95 | Positive | 254.0 → 92.0 | 28 | 254.0 → 156.0 | 12 | 111 |
| 12 | Sulfamonomethoxine | PhACs, AB | Not approved | 4.02 | Positive | 281.1 → 92.1 | 14 | 281.1 → 156.0 | 32 | 120 |
| 13 | Sulfadoxine | PhACs, AB | Approved | 4.13 | Positive | 311.1 → 156.0 | 16 | 311.1 → 92.0 | 32 | 126 |
| 14 | Sulfisoxazole | PhACs, AB | Not approved | 4.14 | Positive | 268.0 → 156.0 | 8 | 268.0 → 92.1 | 24 | 106 |
| 15 | Chloramphenicol | PhACs, AB | Approved | 4.76 | Negative | 321.0 → 152.1 | 4 | 323.0 → 152.1 | 4 | 113 |
| 16 | Sulfadimetoxine | PhACs, AB | Approved | 4.83 | Positive | 311.0 → 156.0 | 16 | 311.0 → 92.0 | 32 | 139 |
| 17 | Sulfaquinoxaline | PhACs, AB | Approved | 4.99 | Positive | 301.0 → 156.0 | 12 | 301.0 → 92.1 | 32 | 159 |
| 18 | Cefuroxime axetil (two isomers) | PhACs, AB | Approved | 5.40 | Positive | 533.0 → 447.0 | 15 | 533.0 → 386.0 | 20 | 160 |
| 19 | Oxfendazole | PhACs, AH | Approved | 5.64 | Positive | 316.1 → 159.0 | 32 | 316.1 → 191.1 | 16 | 166 |
| 20 | Penicillin V | PhACs, AB | Approved | 6.48 | Positive | 383.2 → 159.9 | 10 | 383.2 → 113.9 | 40 | 130 |
| 21 | Mebendazole | PhACs, AH | Approved | 6.73 | Positive | 296.1 → 264.1 | 20 | 296.1 → 77.0 | 48 | 151 |
| 22 | Cloxacillin | PhACs, AB | Approved | 7.09 | Positive | 468.1 → 159.9 | 8 | 468.1 → 177.8 | 20 | 126 |
| 23 | Dexamethasone | PhACs, GC | Approved | 7.18 | Positive | 393.2 → 373.2 | 2 | 393.2 → 355.2 | 6 | 103 |
| 24 | Albendazole | PhACs, AH | Approved | 7.27 | Positive | 266.1 → 234.1 | 16 | 266.1 → 191.0 | 32 | 155 |
| 25 | Ketoprofen | PhACs, NSAID | Approved | 7.36 | Positive | 255.1 → 209.1 | 8 | 255.1 → 77.1 | 48 | 123 |
| 26 | Josamycin | PhACs, AB | Approved | 7.52 | Positive | 860.5 → 173.9 | 40 | 860.5 → 108.9 | 40 | 200 |
| 27 | Naproxen | PhACs, NSAID | Approved | 7.60 | Positive | 231.1 → 185.0 | 10 | 231.1 → 169.9 | 13 | 120 |
| 28 | Cortiscosterone | PhACs, GC | Approved | 7.91 | Positive | 389.1 → 329.0 | 13 | 389.1 → 371.0 | 13 | 80 |
| 29 | Fenbendazole | PhACs, AH | Approved | 8.11 | Positive | 300.1 → 268.1 | 20 | 300.1 → 159.0 | 36 | 156 |
| 30 | Flunixin | PhACs, NSAID | Approved | 8.11 | Positive | 297.1 → 279.1 | 24 | 297.1 → 264.1 | 32 | 141 |
| 31 | Diclofenac | PhACs, NSAID | Approved | 8.75 | Positive | 296.0 → 215.1 | 16 | 296.0 → 214.1 | 48 | 103 |
| 32 | Imipenem | PhACs, AB | Approved | 8.75 | Positive | 300.0 → 125.9 | 15 | 300.0 → 98.0 | 15 | 50 |
| 33 | Mefenamic acid | PhACs, NSAID | Approved | 9.52 | Positive | 242.1 → 209.1 | 28 | 242.1 → 180.1 | 44 | 108 |
| 34 | Tolfenamic acid | PhACs, NSAID | Approved | 9.78 | Negative | 260.0 → 216.1 | 8 | 260.0 → 35.1 | 20 | 108 |
| 35 | Eprinomectin | PhACs, AB | Approved | 10.83 | Positive | 878.5 → 186.0 | 15 | 878.5 → 154.0 | 45 | 160 |
| 36 | Moxidectin | PhACs, AH | Approved | 11.25 | Positive | 641.4 → 529.2 | 5 | 641.4 → 499.2 | 5 | 100 |
| 37 | Warfarin | ARs | Not approved | 7.87 | Negative | 307.1 → 161.1 | 20 | 307.1 → 250.1 | 20 | 140 |
| 38 | Coumatetralyl | ARs | Not approved | 8.28 | Negative | 291.1 → 141.0 | 30 | 291.1 → 247.0 | 20 | 140 |
| 39 | Bromadiolone | ARs | Approved | 9.74 | Negative | 525.3 → 250.0 | 40 | 527.3 → 250.0 | 40 | 200 |
| 40 | Difenacoum | ARs | Not approved | 10.27 | Negative | 443.2 → 135.0 | 40 | 443.2 → 293.0 | 35 | 200 |
| 41 | Flocoumafen | ARs | Not approved | 10.36 | Negative | 541.3 → 382.0 | 25 | 541.3 → 161.0 | 40 | 230 |
| 42 | Brodifacoum | ARs | Not approved | 10.67 | Negative | 521.3 → 79.0 | 50 | 523.3 → 135.0 | 45 | 220 |
| 43 | Difethialone | ARs | Not approved | 10.80 | Negative | 537.3 → 79.0 | 50 | 537.3 → 151.0 | 45 | 220 |
| Cyromazine-d4 | P-IS | – | 1.58 | Positive | 171.0 → 86.0 | 15 | 171.0 → 129.0 | 15 | 100 | |
| Carbendazim-d3 | P-IS | – | 3.45 | Positive | 195.1 → 160.1 | 15 | 195.1 → 131.9 | 30 | 100 | |
| Pirimicarb-d6 | P-IS | – | 5.12 | Positive | 245.2 → 78.2 | 5 | 245.2 → 185.1 | 15 | 70 | |
| Atrazine-d5 | P-IS | – | 6.66 | Positive | 221.2 → 179.0 | 15 | 221.2 → 101.0 | 30 | 90 | |
| Linuron-d3 | P-IS | – | 7.45 | Positive | 255.1 → 159.8 | 15 | 255.1 → 185.0 | 15 | 100 | |
| Coumachlor | P-IS | – | 8.52 | Negative | 341.1 → 161.0 | 15 | 341.1 → 284.0 | 15 | 120 | |
| N° | Compound | Group | Linear Range (ng g−1) | R2 | p-Value (Mandel Test) a | LOD (ng g−1) | LOQ (ng g−1) |
|---|---|---|---|---|---|---|---|
| 1 | Sulfanilamide | PhACs | 1.56–25 | 0.9989 | 0.1611 | 1.560 | 2.5 |
| 2 | Sulfacetamide | PhACs | 0.195–50 | 0.9995 | 0.5511 | 0.195 | 0.5 |
| 3 | Metronidazole | PhACs | 0.195–25 | 0.9977 | 0.4488 | 0.195 | 0.5 |
| 4 | Sulfadiacine | PhACs | 0.195–50 | 0.9996 | 0.4122 | 0.195 | 0.5 |
| 5 | Sulfapyridine | PhACs | 0.39–50 | 0.999 | 0.2055 | 0.390 | 0.5 |
| 6 | Sulfameracine | PhACs | 0.39–25 | 0.9986 | 0.9810 | 0.390 | 1.0 |
| 7 | Sulfametizole | PhACs | 1.56–25 | 0.9945 | 0.2324 | 1.560 | 10.0 |
| 8 | Sulfametacine | PhACs | 0.39–25 | 0.9972 | 0.1826 | 0.390 | 0.5 |
| 9 | Sulfametoxipiridacine | PhACs | 0.39–25 | 0.9974 | 0.9264 | 0.390 | 0.5 |
| 10 | Sulfachloropiridacine | PhACs | 0.39–25 | 0.9931 | 0.4149 | 0.390 | 2.5 |
| 11 | Sulfametoxazole | PhACs | 0.195–25 | 0.9989 | 0.1782 | 0.195 | 2.5 |
| 12 | Sulfamonomethoxine | PhACs | 0.78–50 | 0.9956 | 0.0696 | 0.780 | 1.0 |
| 13 | Sulfadoxine | PhACs | 0.195–25 | 0.9996 | 0.3357 | 0.195 | 0.5 |
| 14 | Sulfisoxazole | PhACs | 0.78–25 | 0.9975 | 0.8231 | 0.780 | 1.0 |
| 15 | Chloramphenicol | PhACs | 6.25–50 | 0.9900 | 0.8866 | 6.250 | 20.0 |
| 16 | Sulfadimetoxine | PhACs | 0.195–50 | 0.9998 | 0.1956 | 0.195 | 0.5 |
| 17 | Sulfaquinoxaline | PhACs | 0.78–50 | 0.9987 | 0.0582 | 0.780 | 1.0 |
| 18 | Cefuroxime axetil (two isomers) | PhACs | 0.39–50 | 0.9929 | 0.3722 | 0.390 | 1.0 |
| 19 | Oxfendazole | PhACs | 0.39–50 | 0.9998 | 0.3931 | 0.390 | 0.5 |
| 20 | Penicillin V | PhACs | 1.56–25 | 0.9987 | 0.8550 | 1.560 | 2.5 |
| 21 | Mebendazole | PhACs | 0.195–50 | 0.9997 | 0.1391 | 0.195 | 0.5 |
| 22 | Cloxacillin | PhACs | 1.56–50 | 0.9904 | 0.1094 | 1.560 | 2.5 |
| 23 | Dexamethasone | PhACs | 1.56–50 | 0.9974 | 0.0826 | 1.560 | 5.0 |
| 24 | Albendazole | PhACs | 0.097–25 | 0.9969 | 0.6387 | 0.097 | 0.5 |
| 25 | Ketoprofen | PhACs | 0.39–50 | 0.9985 | 0.7022 | 0.390 | 0.5 |
| 26 | Josamycin | PhACs | 0.39–25 | 0.9994 | 0.4666 | 0.390 | 1.0 |
| 27 | Naproxen | PhACs | 3.125–50 | 0.9918 | 0.3095 | 3.125 | 20.0 |
| 28 | Cortiscosterone | PhACs | 1.56–25 | 0.9974 | 0.6711 | 1.560 | 5.0 |
| 29 | Fenbendazole | PhACs | 0.048–25 | 0.9979 | 0.5551 | 0.048 | 0.5 |
| 30 | Flunixin | PhACs | 0.097–25 | 0.9997 | 0.4675 | 0.097 | 0.5 |
| 31 | Imipenem | PhACs | 6.25–50 | 0.9996 | 0.2499 | 6.250 | 50.0 |
| 32 | Diclofenac | PhACs | 0.097–50 | 0.9938 | 0.7354 | 0.097 | 2.5 |
| 33 | Mefenamic acid | PhACs | 0.78–25 | 0.9967 | 0.1425 | 0.780 | 10.0 |
| 34 | Tolfenamic acid | PhACs | 6.25–50 | 0.9971 | 0.4907 | 6.250 | 10.0 |
| 35 | Eprinomectin | PhACs | 0.78–25 | 0.9974 | 0.2500 | 0.780 | 2.5 |
| 36 | Moxidectin | PhACs | 1.56–25 | 0.9972 | 0.1269 | 1.560 | 20.0 |
| 37 | Warfarin | ARs | 0.39–25 | 0.9941 | 0.1400 | 0.390 | 1.0 |
| 38 | Coumatetralyl | ARs | 0.195–25 | 0.9977 | 0.1055 | 0.195 | 2.5 |
| 39 | Bromadiolone | ARs | 0.195–25 | 0.9991 | 0.1691 | 0.195 | 1.0 |
| 40 | Difenacoum | ARs | 0.097–50 | 0.9943 | 0.2221 | 0.097 | 1.0 |
| 41 | Flocoumafen | ARs | 0.024–50 | 0.9983 | 0.2167 | 0.024 | 1.0 |
| 42 | Brodifacoum | ARs | 0.097–50 | 0.9997 | 0.5200 | 0.195 | 1.0 |
| 43 | Difethialone | ARs | 3.125–50 | 0.9946 | 0.0797 | 3.125 | 20.0 |
| N°. | Compound | Group | 0.5 (ng g−1) | 1.0 (ng g−1) | 2.5 (ng g−1) | 5 (ng g−1) | 10.0 (ng g−1) | 20.0 (ng g−1) | 50.0 (ng g−1) | |||||||
|---|---|---|---|---|---|---|---|---|---|---|---|---|---|---|---|---|
| Rec (%) | RSD (%) | Rec (%) | RSD (%) | Rec (%) | RSD (%) | Rec (%) | RSD (%) | Rec (%) | RSD (%) | Rec (%) | RSD (%) | Rec (%) | RSD (%) | |||
| 1 | Sulfanilamide | PhACs | N/A | N/A | N/A | N/A | 112.1 | 7.9 | 90.7 | 24.2 | 91.3 | 17.9 | 79.9 | 9.0 | 63.3 | 12.8 |
| 2 | Sulfacetamide | PhACs | 83.3 | 15.1 | 63.2 | 10.3 | 59.8 | 8.1 | 78.0 | 16.5 | 58.6 | 5.4 | 62.8 | 5.9 | 75.5 | 3.7 |
| 3 | Metronidazole | PhACs | 75.3 | 16.8 | 86.5 | 26.9 | 87.5 | 7.3 | 102.5 | 13.1 | 94.4 | 8.0 | 97.7 | 5.5 | 92.7 | 1.6 |
| 4 | Sulfadiacine | PhACs | 88.1 | 13.8 | 76.0 | 8.2 | 74.4 | 5.0 | 83.8 | 13.7 | 75.1 | 5.1 | 78.1 | 6.9 | 77.6 | 2.1 |
| 5 | Sulfapyridine | PhACs | 111.0 | 18.9 | 78.2 | 16.1 | 72.2 | 5.2 | 79.2 | 21.8 | 75.2 | 9.7 | 68.7 | 7.7 | 69.7 | 3.2 |
| 6 | Sulfameracine | PhACs | N/A | N/A | 91.6 | 19.4 | 81.3 | 2.7 | 85.7 | 14.7 | 78.2 | 5.1 | 80.5 | 9.2 | 78.9 | 3.7 |
| 7 | Sulfametizole | PhACs | N/A | N/A | N/A | N/A | N/A | N/A | N/A | N/A | N/A | 9.8 | 71.2 | 13.4 | 68.6 | 3.8 |
| 8 | Sulfametacine | PhACs | 106.8 | 9.9 | 84.0 | 17.8 | 78.5 | 11.4 | 83.9 | 18.8 | 78.9 | 3.2 | 83.9 | 7.7 | 85.4 | 1.5 |
| 9 | Sulfametoxipiridacine | PhACs | 84.1 | 10.5 | 72.0 | 21.6 | 62.5 | 7.8 | 82.7 | 17.9 | 75.5 | 6.1 | 74.2 | 5.8 | 75.0 | 2.6 |
| 10 | Sulfachloropiridacine | PhACs | N/A | N/A | N/A | N/A | 81.6 | 16.2 | 85.7 | 22.7 | 84.3 | 6.0 | 87.7 | 6.7 | 89.6 | 2.8 |
| 11 | Sulfametoxazole | PhACs | N/A | N/A | N/A | N/A | 89.3 | 13.1 | 96.4 | 16.7 | 93.3 | 7.2 | 101.2 | 2.4 | 103.2 | 3.0 |
| 12 | Sulfamonomethoxine | PhACs | N/A | N/A | 75.2 | 10.7 | 66.6 | 7.6 | 80.2 | 30.7 | 75.8 | 4.4 | 80.3 | 9.1 | 80.6 | 6.1 |
| 13 | Sulfadoxine | PhACs | 96.5 | 9.7 | 86.1 | 6.7 | 85.2 | 4.7 | 96.8 | 16.0 | 90.0 | 6.7 | 94.0 | 5.9 | 89.9 | 1.4 |
| 14 | Sulfisoxazole | PhACs | N/A | N/A | 89.8 | 13.9 | 77.4 | 15.7 | 82.8 | 18.9 | 71.3 | 10.6 | 80.1 | 7.0 | 80.8 | 3.5 |
| 15 | Chloramphenicol | PhACs | N/A | N/A | N/A | N/A | N/A | N/A | N/A | N/A | N/A | N/A | 117.0 | 11.0 | 117.8 | 9.0 |
| 16 | Sulfadimetoxine | PhACs | 85.7 | 10.3 | 86.7 | 7.4 | 84.8 | 4.0 | 91.9 | 15.6 | 86.2 | 6.0 | 90.9 | 5.7 | 88.2 | 1.3 |
| 17 | Sulfaquinoxaline | PhACs | N/A | N/A | 111.1 | 8.8 | 82.9 | 7.5 | 84.7 | 16.6 | 74.1 | 5.7 | 77.0 | 7.4 | 78.9 | 2.1 |
| 18 | Cefuroxime axetil (two isomers) | PhACs | N/A | N/A | 83.4 | 18.2 | 96.1 | 6.8 | 117.2 | 11.5 | 109.5 | 6.7 | 115.5 | 5.3 | 104.3 | 0.7 |
| 19 | Oxfendazole | PhACs | 115.1 | 13.1 | 83.4 | 9.8 | 65.2 | 2.9 | 82.3 | 13.8 | 69.9 | 5.3 | 66.2 | 4.7 | 63.4 | 0.4 |
| 20 | Penicillin V | PhACs | N/A | N/A | N/A | N/A | 66.5 | 17.6 | 69.7 | 26.7 | 63.0 | 18.2 | 65.9 | 12.8 | 73.2 | 9.9 |
| 21 | Mebendazole | PhACs | 92.4 | 15.4 | 79.8 | 13.4 | 75.1 | 4.6 | 96.0 | 18.0 | 80.7 | 5.6 | 80.7 | 6.4 | 79.3 | 1.5 |
| 22 | Cloxacillin | PhACs | N/A | N/A | N/A | N/A | 76.1 | 15.4 | 122.3 | 18.6 | 98.7 | 9.2 | 101.8 | 9.7 | 126.0 | 11.7 |
| 23 | Dexamethasone | PhACs | N/A | N/A | N/A | N/A | N/A | N/A | 71.1 | 17.6 | 68.0 | 9.1 | 75.4 | 6.2 | 69.9 | 3.6 |
| 24 | Albendazole | PhACs | 76.3 | 9.0 | 76.3 | 8.2 | 69.5 | 3.8 | 99.5 | 16.5 | 82.9 | 6.3 | 76.2 | 5.9 | 75.8 | 1.1 |
| 25 | Ketoprofen | PhACs | 103.5 | 18.3 | 99.8 | 13.8 | 76.6 | 6.7 | 93.4 | 20.7 | 92.1 | 6.8 | 89.6 | 4.9 | 87.2 | 3.2 |
| 26 | Josamycin | PhACs | N/A | N/A | 106.5 | 14.5 | 74.5 | 10.0 | 80.8 | 20.2 | 70.3 | 7.6 | 71.8 | 10.4 | 74.1 | 5.6 |
| 27 | Naproxen | PhACs | N/A | N/A | N/A | N/A | N/A | N/A | N/A | N/A | N/A | N/A | 86.9 | 18.1 | 94.2 | 5.2 |
| 28 | Cortiscosterone | PhACs | N/A | N/A | N/A | N/A | N/A | N/A | 112.9 | 15.4 | 93.9 | 6.3 | 101.3 | 10.8 | 99.7 | 5.4 |
| 29 | Fenbendazole | PhACs | 93.9 | 12.2 | 87.1 | 8.9 | 83.0 | 6.2 | 107.0 | 14.6 | 92.2 | 5.3 | 90.6 | 6.2 | 85.3 | 1.4 |
| 30 | Flunixin | PhACs | 81.0 | 11.3 | 70.2 | 17.3 | 68.6 | 4.2 | 81.9 | 17.0 | 71.8 | 4.2 | 69.8 | 4.2 | 65.0 | 2.7 |
| 31 | Imipenem | PhACs | N/A | N/A | N/A | N/A | N/A | N/A | N/A | N/A | N/A | N/A | N/A | N/A | 91.7 | 17.2 |
| 32 | Diclofenac | PhACs | N/A | N/A | N/A | N/A | 110.3 | 17.9 | 107.1 | 28.8 | 84.4 | 17.7 | 93.9 | 8.1 | 85.1 | 2.1 |
| 33 | Mefenamic acid | PhACs | N/A | N/A | N/A | N/A | N/A | N/A | N/A | N/A | 82.7 | 14.3 | 83.1 | 17.2 | 82.5 | 5.9 |
| 34 | Tolfenamic acid | PhACs | N/A | N/A | N/A | N/A | N/A | N/A | N/A | N/A | 121.5 | 15.4 | 121.2 | 7.8 | 111.5 | 10.2 |
| 35 | Eprinomectin | PhACs | N/A | N/A | N/A | N/A | 102.1 | 12.7 | 104.0 | 15.4 | 98.3 | 11.8 | 92.1 | 9.5 | 84.8 | 2.6 |
| 36 | Moxidectin | PhACs | N/A | N/A | N/A | N/A | N/A | N/A | N/A | N/A | N/A | N/A | 95.0 | 14.9 | 96.3 | 9.6 |
| 37 | Warfarin | ARs | N/A | N/A | 81.2 | 9.2 | 103.8 | 4.6 | 106.0 | 14.7 | 113.5 | 6.5 | 105.5 | 4.9 | 85.8 | 5.0 |
| 38 | Coumatetralyl | ARs | N/A | N/A | N/A | N/A | 104.6 | 13.5 | 106.5 | 12.8 | 107.3 | 13.0 | 99.3 | 3.3 | 87.6 | 5.9 |
| 39 | Bromadiolone | ARs | N/A | N/A | 92.8 | 14.4 | 87.5 | 15.4 | 90.9 | 13.8 | 93.6 | 7.7 | 91.4 | 7.4 | 82.4 | 2.6 |
| 40 | Difenacoum | ARs | N/A | N/A | 110.2 | 12.9 | 90.6 | 6.5 | 110.2 | 14.3 | 107.8 | 5.4 | 102.6 | 7.4 | 86.3 | 1.4 |
| 41 | Flocoumafen | ARs | N/A | N/A | 105.0 | 13.0 | 94.1 | 16.8 | 108.1 | 11.6 | 108.9 | 8.0 | 100.8 | 5.0 | 85.1 | 1.9 |
| 42 | Brodifacoum | ARs | N/A | N/A | 106.5 | 11.5 | 87.6 | 6.5 | 98.4 | 14.8 | 98.0 | 8.6 | 93.4 | 4.2 | 84.3 | 4.0 |
| 43 | Difethialone | ARs | N/A | N/A | N/A | N/A | N/A | N/A | N/A | N/A | N/A | N/A | 113.7 | 4.9 | 95.7 | 6.2 |
Publisher’s Note: MDPI stays neutral with regard to jurisdictional claims in published maps and institutional affiliations. |
© 2021 by the authors. Licensee MDPI, Basel, Switzerland. This article is an open access article distributed under the terms and conditions of the Creative Commons Attribution (CC BY) license (https://creativecommons.org/licenses/by/4.0/).
Share and Cite
Acosta-Dacal, A.; Rial-Berriel, C.; Díaz-Díaz, R.; Bernal-Suárez, M.d.M.; Zumbado, M.; Henríquez-Hernández, L.A.; Luzardo, O.P. An Easy Procedure to Quantify Anticoagulant Rodenticides and Pharmaceutical Active Compounds in Soils. Toxics 2021, 9, 83. https://0-doi-org.brum.beds.ac.uk/10.3390/toxics9040083
Acosta-Dacal A, Rial-Berriel C, Díaz-Díaz R, Bernal-Suárez MdM, Zumbado M, Henríquez-Hernández LA, Luzardo OP. An Easy Procedure to Quantify Anticoagulant Rodenticides and Pharmaceutical Active Compounds in Soils. Toxics. 2021; 9(4):83. https://0-doi-org.brum.beds.ac.uk/10.3390/toxics9040083
Chicago/Turabian StyleAcosta-Dacal, Andrea, Cristian Rial-Berriel, Ricardo Díaz-Díaz, María del Mar Bernal-Suárez, Manuel Zumbado, Luis Alberto Henríquez-Hernández, and Octavio P. Luzardo. 2021. "An Easy Procedure to Quantify Anticoagulant Rodenticides and Pharmaceutical Active Compounds in Soils" Toxics 9, no. 4: 83. https://0-doi-org.brum.beds.ac.uk/10.3390/toxics9040083