
Validation of a Method Scope Extension for the Analysis of POPs in Soil and Verification in Organic and Conventional Farms of the Canary Islands

 , , ,
, , ,  , , and
Abstract
:1. Introduction
2. Materials and Methods
2.1. Reagents, Standard Stock Solutions and Mixes
2.2. Sample Collection and Pre-Treatment
2.3. Sample Preparation
2.4. GC-MS/MS Analysis
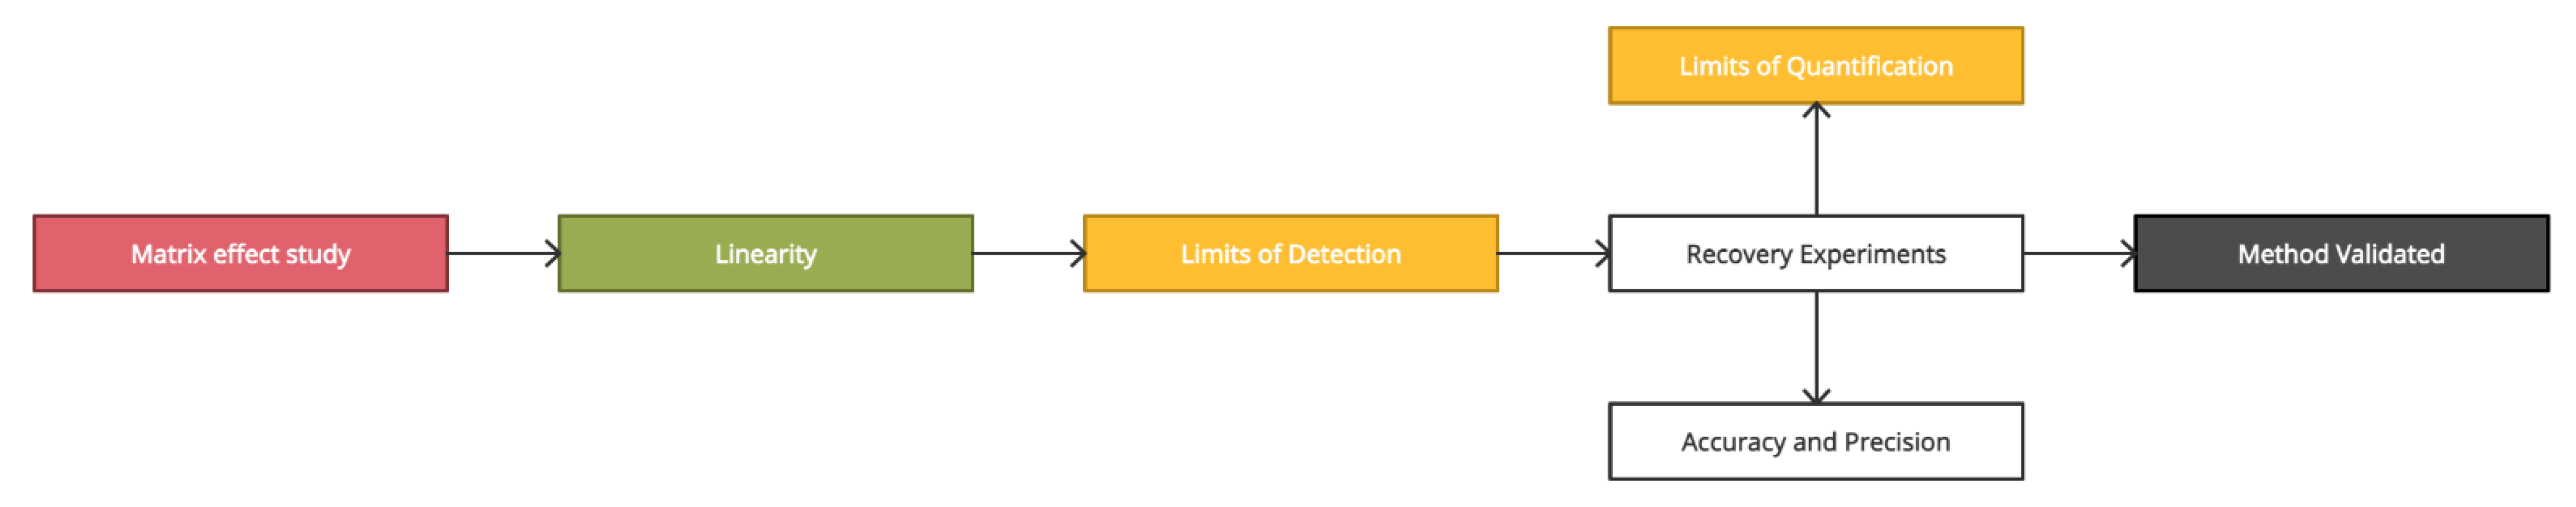
2.5. Method Validation Parameters
2.6. Statistical Analysis
3. Results and Discussion
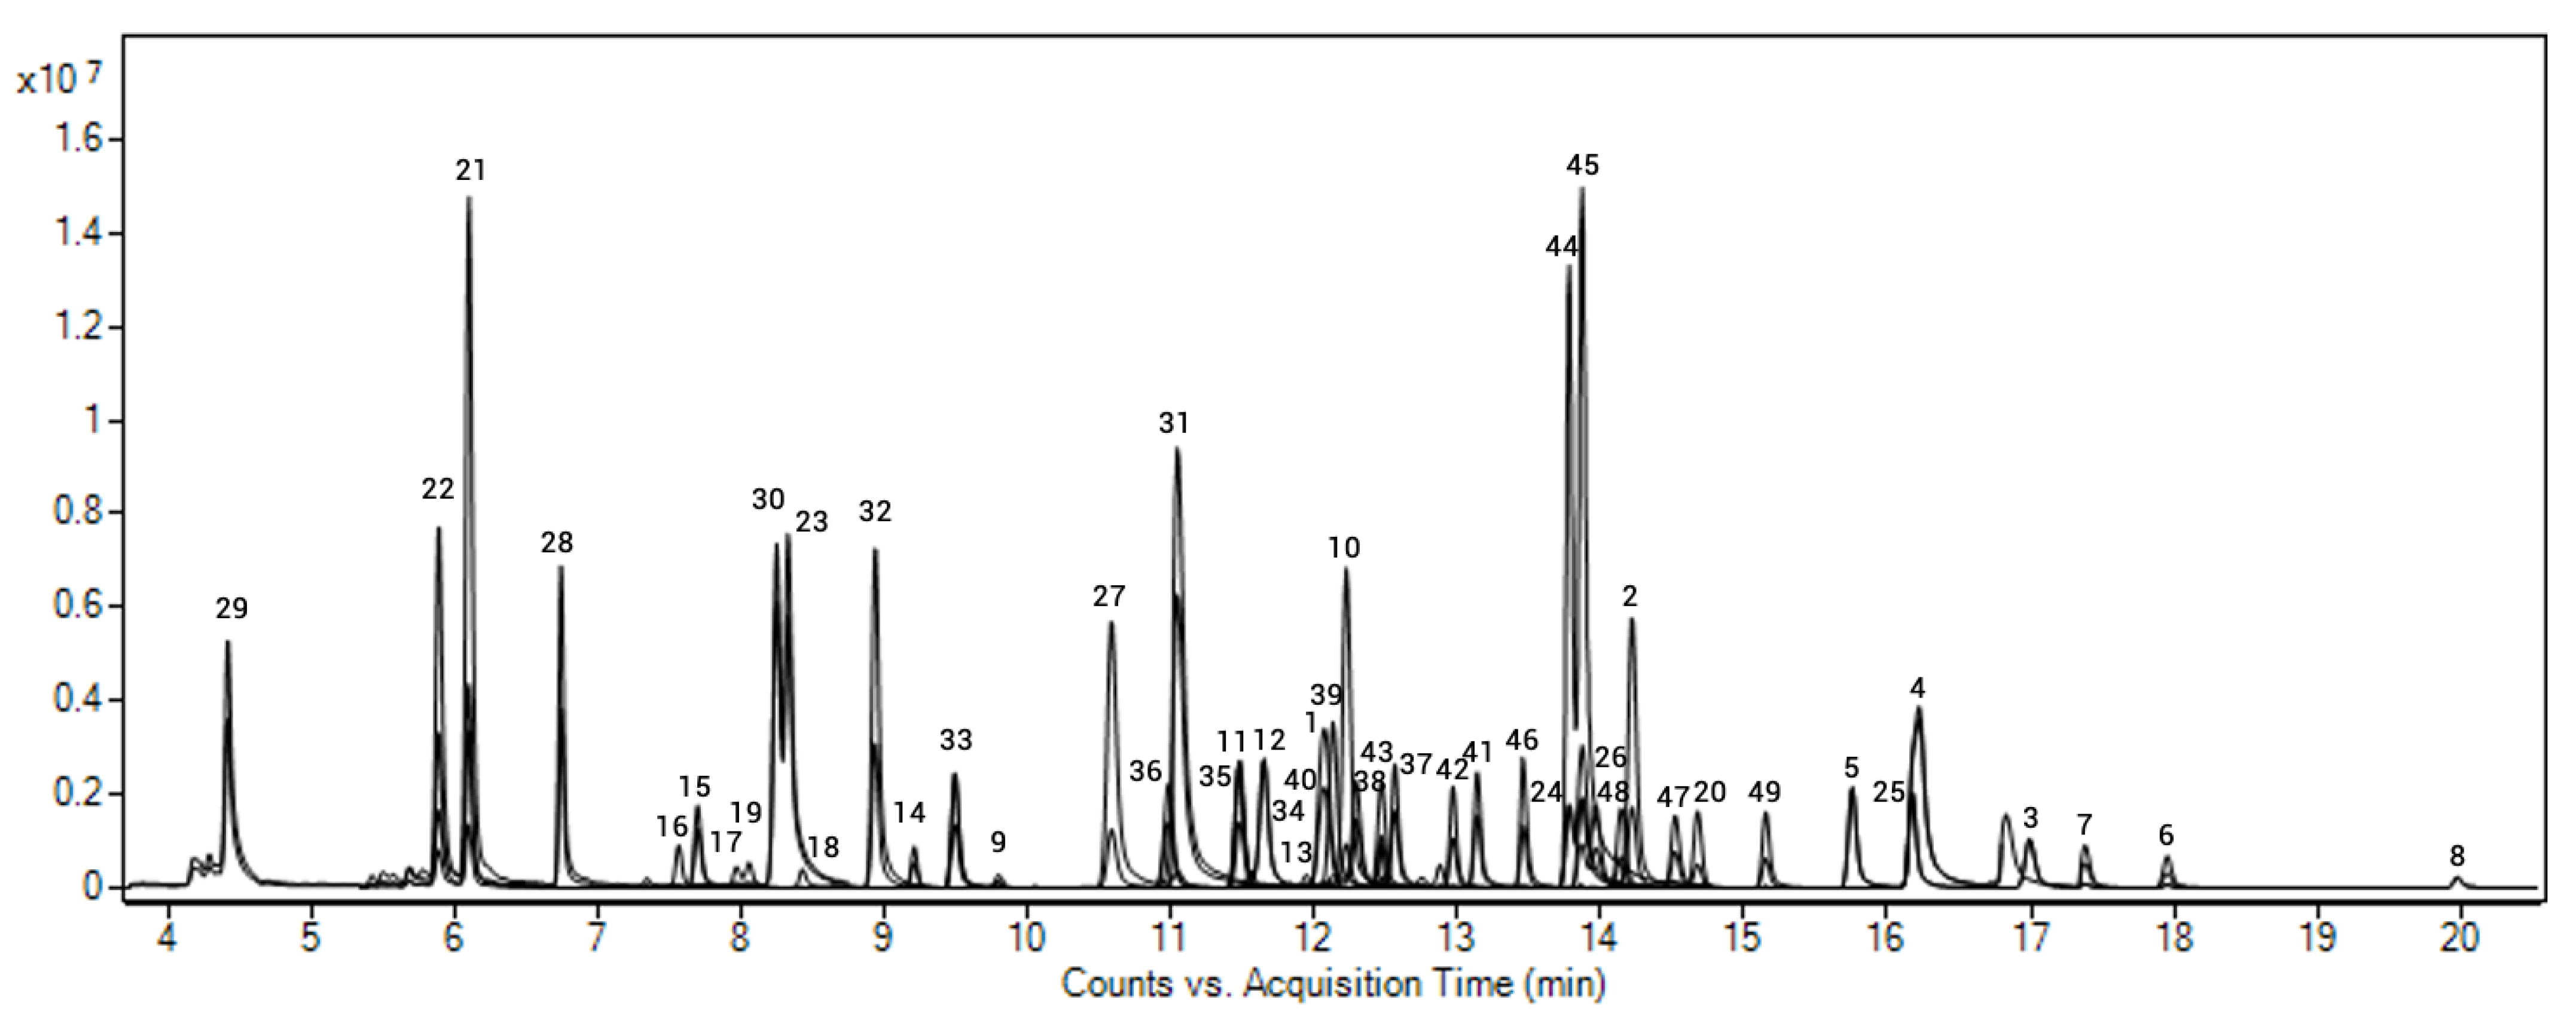
3.1. Optimization of GC-MS/MS Conditions
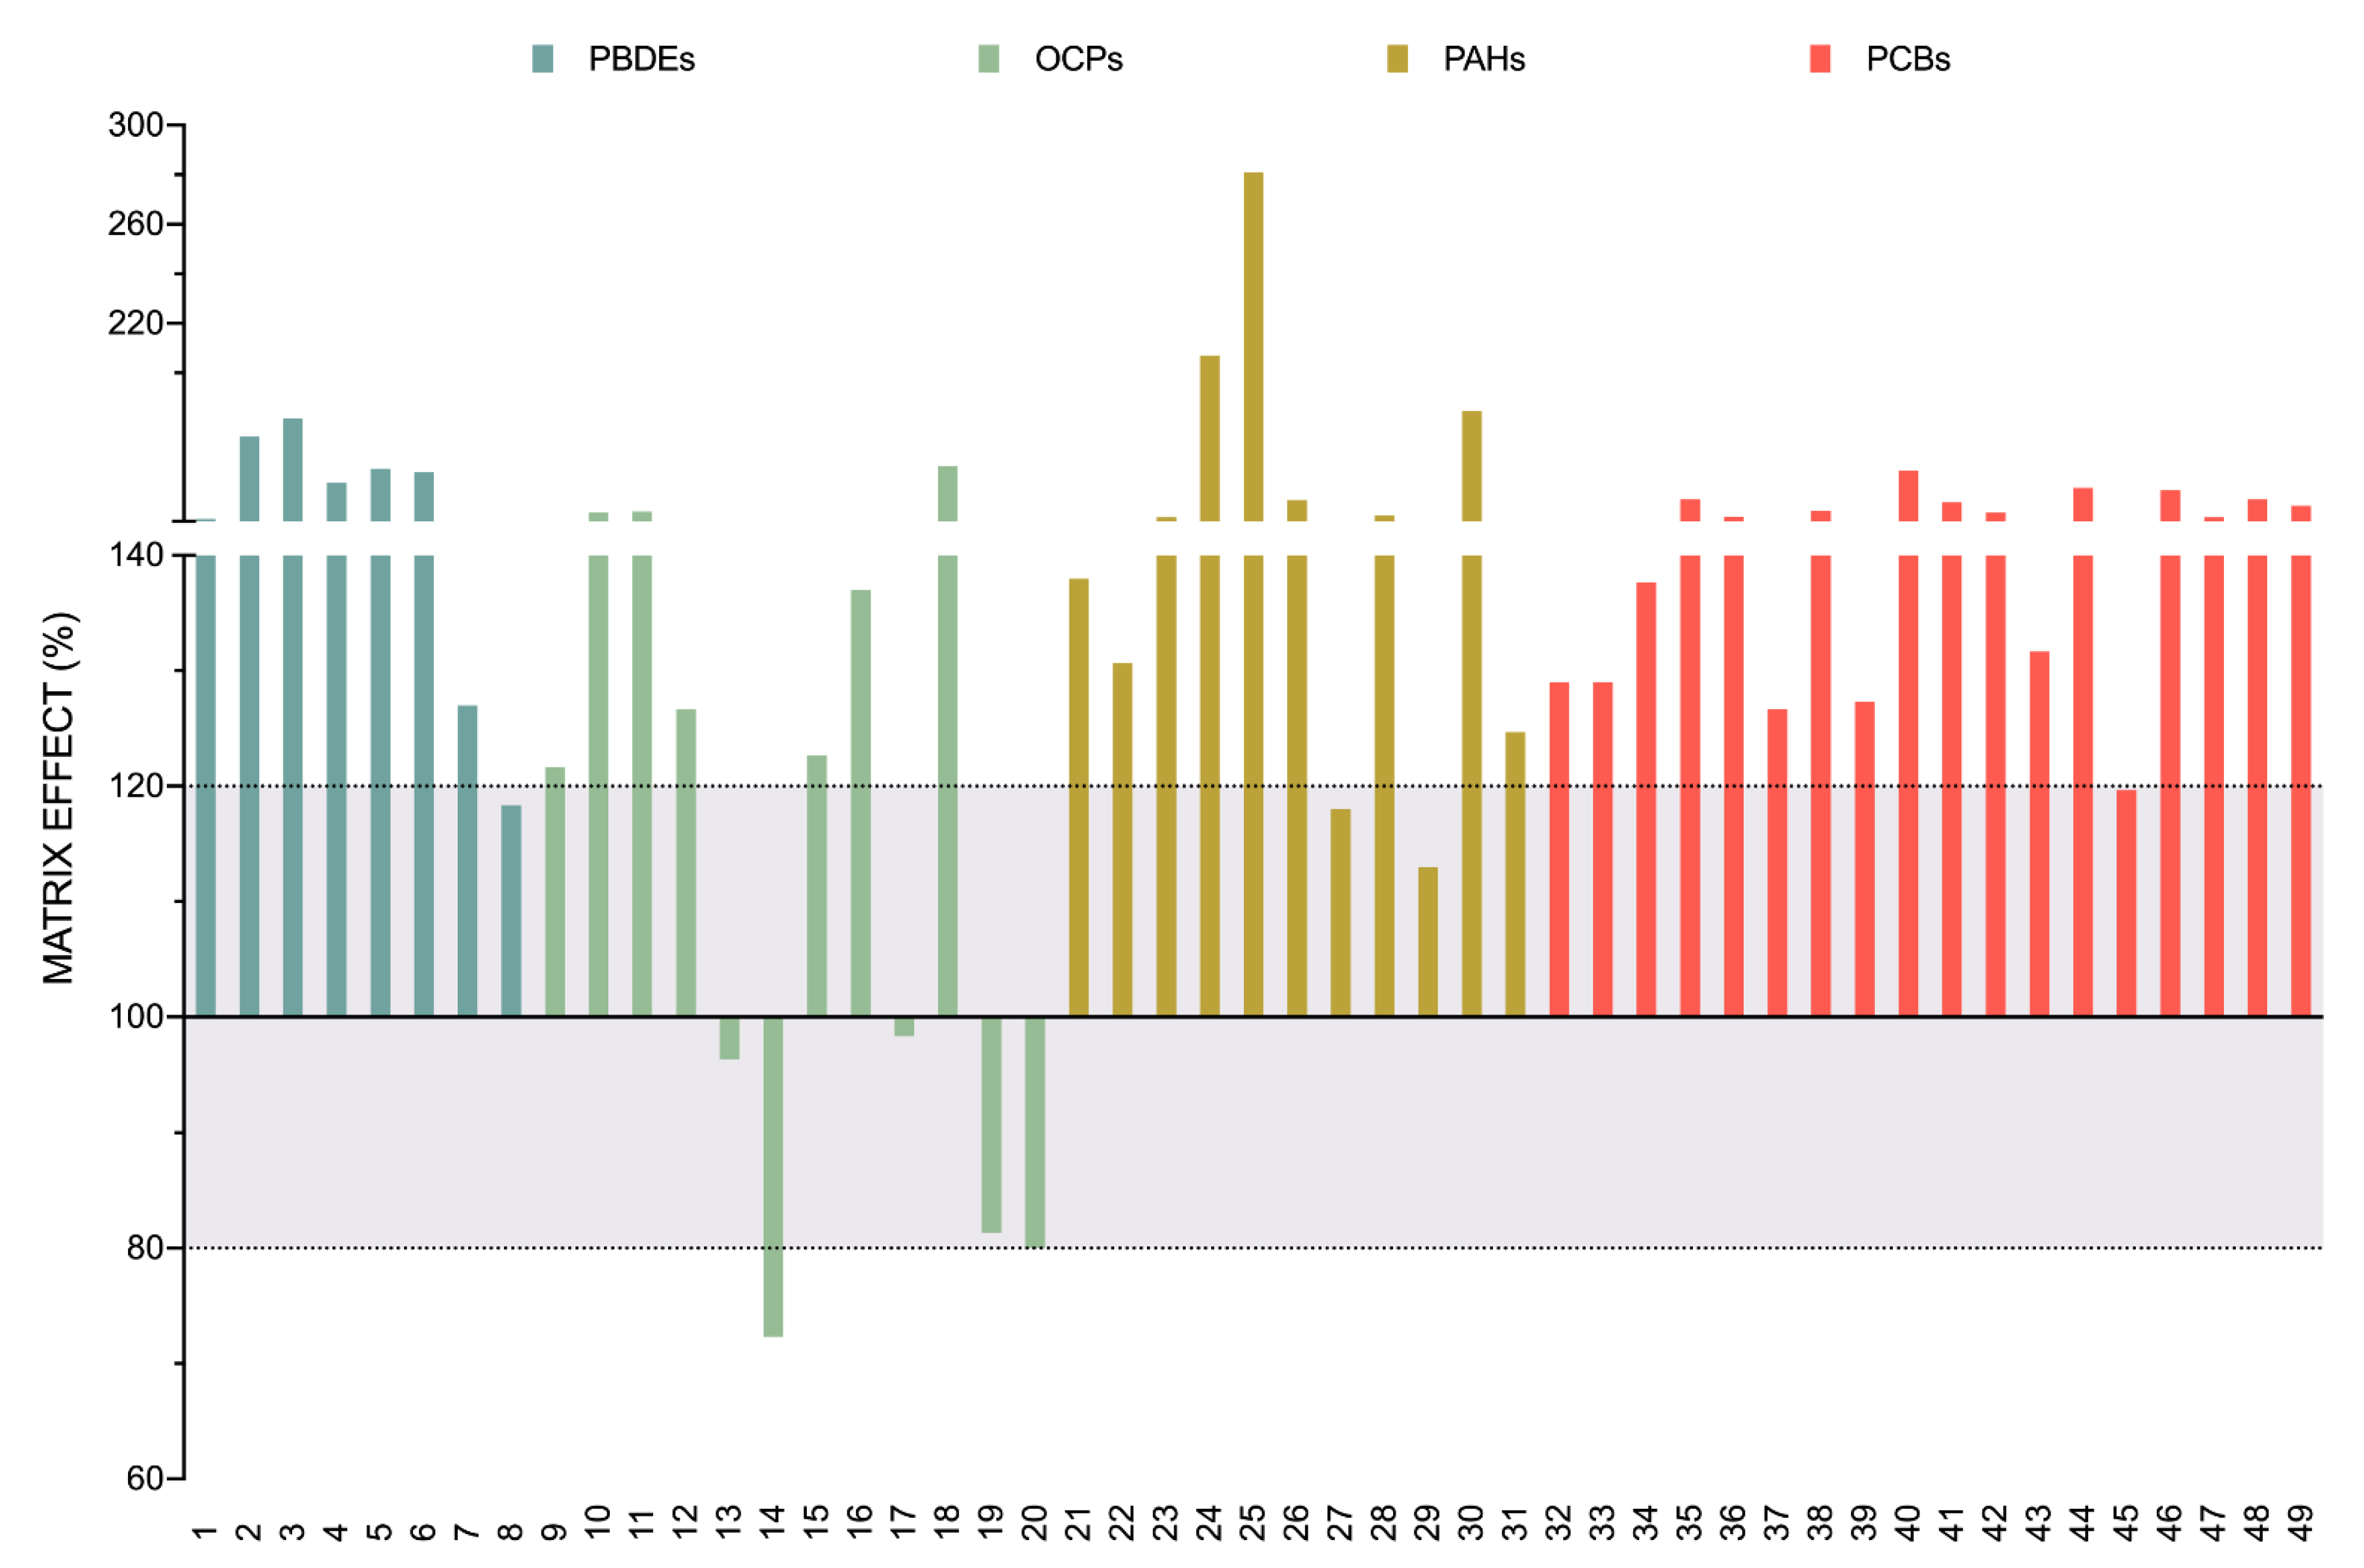
3.2. Matrix Effect Study
3.3. Method Validation
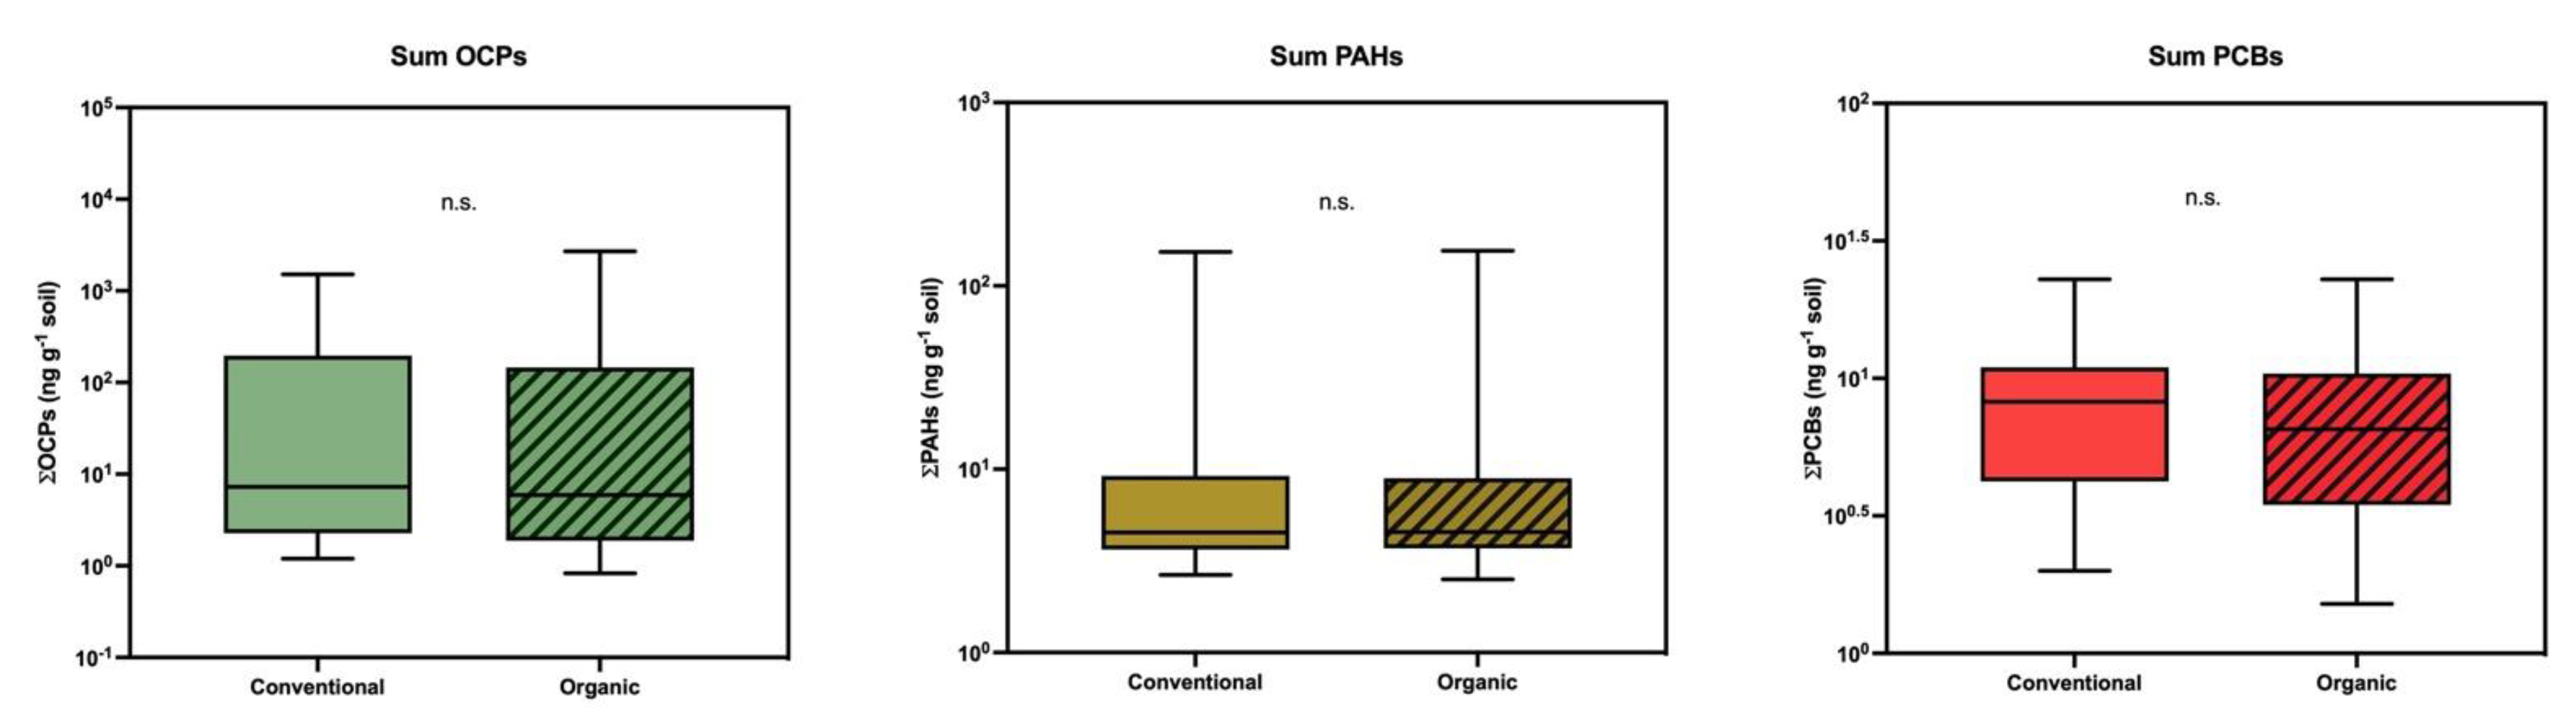
3.4. Application to Agricultural Soil Samples
4. Conclusions
Author Contributions
Funding
Institutional Review Board Statement
Informed Consent Statement
Data Availability Statement
Acknowledgments
Conflicts of Interest
References
- Weber, R.; Bell, L.; Watson, A.; Petrlik, J.; Paun, M.C.; Vijgen, J. Assessment of pops contaminated sites and the need for stringent soil standards for food safety for the protection of human health. Environ. Pollut. 2019, 249, 703–715. [Google Scholar] [CrossRef]
- Breivik, K.; Alcock, R.; Li, Y.F.; Bailey, R.E.; Fiedler, H.; Pacyna, J.M. Primary sources of selected POPs: Regional and global scale emission inventories. Environ. Pollut. 2004, 128, 3–16. [Google Scholar] [CrossRef]
- Abdel-Shafy, H.I.; Mansour, M.S.M. A review on polycyclic aromatic hydrocarbons: Source, environmental impact, effect on human health and remediation. Egypt J. Pet. 2015. [Google Scholar] [CrossRef] [Green Version]
- United Nations Environment Programme. Stockholm Convention. Available online: http://www.pops.int/ (accessed on 9 March 2021).
- Ministerio de Agricultura y Pesca. Orden de 1 de Febrero de 1991 por la que se Modifica el Anexo de la de 7 de Septiembre de 1989, Sobre Prohibición de la Comercialización y Utilización de Ciertos Productos Fitosanitarios en Aplicación de las Directivas 90/335/CEE y 90/533/CEE. Available online: https://www.boe.es/buscar/doc.php?id=BOE-A-1991-3665 (accessed on 8 March 2021).
- Ministerio de la Presidencia. Real Decreto 1378 / 1999, de 27 de Agosto, por el que se Establecen Medidas para la Eliminación y Gestión de los Policlorobifenilos, Policloroterfenilos y Aparatos que los Contengan. Available online: https://www.boe.es/buscar/doc.php?id=BOE-A-1999-18193 (accessed on 8 March 2021).
- Fernandez-Alvarez, M.; Lamas, J.P.; Garcia-Chao, M.; Garcia-Jares, C.; Llompart, M.; Lores, M.; Dagnac, T. Monitoring of pesticide residues in dairy cattle farms from NW Spain. J. Environ. Monit. 2010, 12, 1864. [Google Scholar] [CrossRef] [PubMed]
- Mackay, D. Multimedia Environmental Models: The Fugacity Approach; CRC Press: Boca Raton, FL, USA, 2001; ISBN 1420032542. [Google Scholar]
- Kumari, B.; Madan, V.K.; Kathpal, T.S. Status of insecticide contamination of soil and water in Haryana, India. Monit. Assess. 2008, 136, 239–244. [Google Scholar] [CrossRef]
- Tasdemir, Y.; Salihoglu, G.; Salihoglu, N.K.; Birgül, A. Air-soil exchange of PCBs: Seasonal variations in levels and fluxes with influence of equilibrium conditions. Environ. Pollut. 2012, 169, 90–97. [Google Scholar] [CrossRef]
- Meijer, S.N.; Ockenden, W.A.; Sweetman, A.; Breivik, K.; Grimalt, J.O.; Jones, K.C. Global distribution and budget of PCBs and HCB in background surface soils: Implications for sources and environmental processes. Environ. Sci. Technol. 2003, 37, 667–672. [Google Scholar] [CrossRef] [PubMed]
- Weber, J.B.; Wilkerson, G.G.; Reinhardt, C.F. Calculating pesticide sorption coefficients (Kd) using selected soil properties. Chemosphere 2004, 55, 157–166. [Google Scholar] [CrossRef]
- Gevao, B.; Semple, K.T.; Jones, K.C. Bound pesticide residues in soils: A review. Environ. Pollut. 2000, 108, 3–14. [Google Scholar] [CrossRef]
- Shen, L.; Wania, F. Compilation, evaluation, and selection of physical-chemical property data for organochlorine pesticides. J. Chem. Eng. Data 2005, 50, 742–768. [Google Scholar] [CrossRef]
- Connell, D.W.; Miller, G.J.; Mortimer, M.R.; Shaw, G.R.; Anderson, S.M. Persistent lipophilic contaminants and other chemical residues in the southern Hemisphere. Crit. Rev. Environ. Sci. Technol. 1999, 29, 47–82. [Google Scholar] [CrossRef]
- Hilber, I.; Mäder, P.; Schulin, R.; Wyss, G.S. Survey of organochlorine pesticides in horticultural soils and there grown Cucurbitaceae. Chemosphere 2008, 73, 954–961. [Google Scholar] [CrossRef] [PubMed]
- Henríquez-Hernández, L.A.; Ortiz-Andrelluchi, A.; Álvarez-Pérez, J.; Acosta-Dacal, A.; Zumbado, M.; Martínez-González, M.A.; Boada, L.D.; Salas-Salvadó, J.; Luzardo, O.P.; Serra-Majem, L. Human biomonitoring of persistent organic pollutants in elderly people from the Canary Islands (Spain): A temporal trend analysis from the predimed and predimed-plus cohorts. Sci. Total Environ. 2021, 758, 143637. [Google Scholar] [CrossRef] [PubMed]
- Cabrera-Rodríguez, R.; Luzardo, O.P.; Almeida-González, M.; Boada, L.D.; Zumbado, M.; Acosta-Dacal, A.; Rial-Berriel, C.; Henríquez-Hernández, L.A. Association between prenatal exposure to multiple persistent organochlorine pollutants (POPs) and growth indicators in newborns. Environ. Res. 2018, 171, 285–292. [Google Scholar] [CrossRef]
- Ozkoc, H.B.; Bakan, G.; Ariman, S. Distribution and bioaccumulation of organochlorine pesticides along the Black Sea coast. Environ. Geochem. Health 2007, 29, 59–68. [Google Scholar] [CrossRef] [PubMed]
- Lanfranchi, A.L.; Menone, M.L.; Miglioranza, K.S.B.; Janiot, L.J.; Aizpún, J.E.; Moreno, V.J. Striped weakfish (cynoscion guatucupa): A biomonitor of organochlorine pesticides in estuarine and near-coastal zones. Mar. Pollut. Bull. 2006, 52, 74–80. [Google Scholar] [CrossRef] [PubMed]
- Brevik, E.C.; Burgess, L.C. Soils and Human Health; CRC Press: Boca Raton, FL, USA, 2012; ISBN 9781439844557. [Google Scholar]
- Davis, S.; Mirick, D.K. Soil ingestion in children and adults in the same family. J. Expo. Sci. Environ. Epidemiol. 2006, 16, 63–75. [Google Scholar] [CrossRef] [PubMed] [Green Version]
- von Lindern, I.; Spalinger, S.; Stifelman, M.L.; Stanek, L.W.; Bartrem, C. Estimating children’s soil/dust ingestion rates through retrospective analyses of blood lead biomonitoring from the Bunker Hill superfund site in Idaho. Environ. Health Perspect. 2016, 124, 1462–1470. [Google Scholar] [CrossRef] [Green Version]
- Rychen, G.; Jurjanz, S.; Fournier, A.; Toussaint, H.; Feidt, C. Exposure of ruminants to persistent organic pollutants and potential of decontamination. Env. Sci Pollut Res. Int 2014, 21, 6440–6447. [Google Scholar] [CrossRef]
- Wong, F.; Alegria, H.A.; Bidleman, T.F. Organochlorine pesticides in soils of Mexico and the potential for soil-air exchange. Environ. Pollut. 2010, 158, 749–755. [Google Scholar] [CrossRef]
- Zhou, Q.; Wang, J.; Meng, B.; Cheng, J.; Lin, G.; Chen, J.; Zheng, D.; Yu, Y. Distribution and sources of organochlorine pesticides in agricultural soils from central China. Ecotoxicol. Environ. Saf. 2013, 93, 163–170. [Google Scholar] [CrossRef] [PubMed]
- Bianco, G.; Novario, G.; Bochicchio, D.; Anzilotta, G.; Palma, A.; Cataldi, T.R.I. Polychlorinated biphenyls in contaminated soil samples evaluated by GC-ECD with dual-column and GC-HRMS. Chemosphere 2008, 73, 104–112. [Google Scholar] [CrossRef] [PubMed]
- During, R.A.; Gäth, S. Microwave assisted methodology for the determination of organic pollutants in organic municipal wastes and soils: Extraction of polychlorinated biphenyls using heat transformer disks. Fresenius. J. Anal. Chem. 2000, 368, 697–701. [Google Scholar] [CrossRef] [PubMed]
- Abou-Elwafa Abdallah, M.; Drage, D.; Harrad, S. A one-step extraction/clean-up method for determination of PCBs, PBDEs and HBCDs in environmental solid matrices. Environ. Sci. Process. Impacts 2013, 15, 2279–2287. [Google Scholar] [CrossRef] [PubMed]
- Park, H.M.; Hong, S.M.; Agustin-Camacho, M.R.; Dirwono, W.; Lee, K.B. Pressurized liquid extraction for the simultaneous analysis of polychlorinated biphenyls and polybrominated diphenyl ethers from soil by GC-TOF-MS detection. J. Chromatogr. Sci. 2009, 47, 681–688. [Google Scholar] [CrossRef] [Green Version]
- He, Z.; Wang, L.; Peng, Y.; Luo, M.; Wang, W.; Liu, X. Determination of selected polychlorinated biphenyls in soil and earthworm (Eisenia fetida) using a QuEChERS-based method and gas chromatography with tandem MS. J. Sep. Sci. 2015, 38, 3766–3773. [Google Scholar] [CrossRef]
- Varca, J.P.R.O.; Martins, E.A.J.; Varca, G.H.C.; Romano, R.L.; Lebre, D.T.; Lainetti, P.E.O.; Bustillos, J.O.V. Determination of organochlorines in soil of a suburban area of São Paulo Brazil. Int. J. Environ. Res. Public Health 2020, 17, 5666. [Google Scholar] [CrossRef]
- Anastassiades, M.; Lehotay, S.J.; Štajnbaher, D.; Schenck, F.J. Fast and easy multiresidue method employing acetonitrile extraction/partitioning and “dispersive solid-phase extraction” for the determination of pesticide residues in produce. J. AOAC Int. 2003, 86, 412–431. [Google Scholar] [CrossRef] [PubMed] [Green Version]
- Perestrelo, R.; Silva, P.; Porto-Figueira, P.; Pereira, J.A.M.; Silva, C.; Medina, S.; Câmara, J.S. QuEChERS—Fundamentals, relevant improvements, applications and future trends. Anal. Chim. Acta 2019, 1070, 1–28. [Google Scholar] [CrossRef]
- Correia-Sá, L.; Fernandes, V.C.; Carvalho, M.; Calhau, C.; Domingues, V.M.F.; Delerue-Matos, C. Optimization of QuEChERS method for the analysis of organochlorine pesticides in soils with diverse organic matter. J. Sep. Sci. 2012, 35, 1521–1530. [Google Scholar] [CrossRef]
- Xu, X.; Yang, H.; Li, Q.; Yang, B.; Wang, X.; Lee, F.S.C. Residues of organochlorine pesticides in near shore waters of LaiZhou Bay and JiaoZhou Bay, Shandong Peninsula, China. Chemosphere 2007, 68, 126–139. [Google Scholar] [CrossRef] [PubMed]
- Ali, M.; Kazmi, A.A.; Ahmed, N. Study on effects of temperature, moisture and pH in degradation and degradation kinetics of aldrin, endosulfan, lindane pesticides during full-scale continuous rotary drum composting. Chemosphere 2014, 102, 68–75. [Google Scholar] [CrossRef] [PubMed]
- Rial-Berriel, C.; Acosta-Dacal, A.; Zumbado, M.; Luzardo, O.P. Micro QuEChERS-based method for the simultaneous biomonitoring in whole blood of 360 toxicologically relevant pollutants for wildlife. Sci. Total Environ. 2020. [Google Scholar] [CrossRef] [PubMed]
- Olisah, C.; Okoh, O.O.; Okoh, A.I. Occurrence of organochlorine pesticide residues in biological and environmental matrices in Africa: A two-decade review. Heliyon 2020, 6, e03518. [Google Scholar] [CrossRef] [PubMed]
- Zumbado, M.; Goethals, M.; Álvarez-León, E.E.; Luzardo, O.P.; Cabrera, F.; Serra-Majem, L.; Domínguez-Boada, L. Inadvertent exposure to organochlorine pesticides DDT and derivatives in people from the Canary Islands (Spain). Sci. Total Environ. 2005, 339, 49–62. [Google Scholar] [CrossRef] [PubMed]
- Luzardo, O.P.; Goethals, M.; Zumbado, M.; Álvarez-León, E.E.; Cabrera, F.; Serra-Majem, L.; Boada, L.D. Increasing serum levels of non-DDT-derivative organochlorine pesticides in the younger population of the Canary Islands (Spain). Sci. Total Environ. 2006, 367, 129–138. [Google Scholar] [CrossRef]
- Boada, L.D.; Henriquez-Hernandez, L.A.; Navarro, P.; Zumbado, M.; Almeida-Gonzalez, M.; Camacho, M.; Alvarez-Leon, E.E.; Valencia-Santana, J.A.; Luzardo, O.P. Exposure to polycyclic aromatic hydrocarbons (PAHs) and bladder cancer: Evaluation from a gene-environment perspective in a hospital-based case-control study in the Canary Islands (Spain). Int J. Occup Environ. Health 2015, 21, 23–30. [Google Scholar] [CrossRef] [Green Version]
- Zumbado, M.; Luzardo, O.P.; Lara, P.C.; Alvarez-Leon, E.E.; Losada, A.; Apolinario, R.; Serra-Majem, L.; Boada, L.D. Insulin-like growth factor-I (IGF-I) serum concentrations in healthy children and adolescents: Relationship to level of contamination by DDT-derivative pesticides. Growth Horm IGF Res. 2010, 20, 63–67. [Google Scholar] [CrossRef]
- Garcia-Alvarez, N.; Martin, V.; Fernandez, A.; Almunia, J.; Xuriach, A.; Arbelo, M.; Tejedor, M.; Boada, L.D.; Zumbado, M.; Luzardo, O.P. Levels and profiles of POPs (organochlorine pesticides, PCBs, and PAHs) in free-ranging common bottlenose dolphins of the Canary Islands, Spain. Sci. Total Environ. 2014, 493, 22–31. [Google Scholar] [CrossRef] [PubMed]
- Luzardo, O.P.; Ruiz-Suarez, N.; Henriquez-Hernandez, L.A.; Valeron, P.F.; Camacho, M.; Zumbado, M.; Boada, L.D. Assessment of the exposure to organochlorine pesticides, PCBs and PAHs in six species of predatory birds of the Canary Islands, Spain. Sci. Total Environ. 2014, 472, 146–153. [Google Scholar] [CrossRef]
- Acosta-Dacal, A.; Rial-Berriel, C.; Díaz-Díaz, R.; del Suárez, M.M.B.; Zumbado, M.; Henríquez-Hernández, L.A.; Luzardo, O.P. Supporting dataset on the optimization and validation of a QuEChERS-based method for the determination of 218 pesticide residues in clay loam soil. Data Br. 2020, 33, 106393. [Google Scholar] [CrossRef] [PubMed]
- Acosta-Dacal, A.; Rial-Berriel, C.; Díaz-Díaz, R.; del MarBernal-Suárezb, M.; Luzardo, O.P. Optimization and validation of a QuEChERS-based method for the simultaneous environmental monitoring of 218 pesticide residues in clay loam soil. Sci. Total Environ. 2021, 753, 142015. [Google Scholar] [CrossRef]
- Hoff, R.B.; Barreto, F.; Melo, J.; Martins, M.T.; Pizzolato, T.M.; Peralba, M.D.C.R. Scope extension validation protocol: Inclusion of analytes and matrices in an LC-MS/MS sulfonamide residues method. Food Addit. Contam.Part. A Chem. Anal. Control. Expo. Risk Assess. 2014, 31, 39–47. [Google Scholar] [CrossRef] [PubMed]
- European Commission. Guidance document on analytical quality control and method validation procedures for pesticides residues analysis in food and feed. European Commission Health and Consumer Protection Directorate: Brussel, Belgium, 2019; pp. 2–44. [Google Scholar]
- Lehotay, S.J.; O’Neil, M.; Tully, J.; García, A.V.; Contreras, M.; Mol, H.; Heinke, V.; Anspach, T.; Lach, G.; Fussell, R.; et al. Determination of pesticide residues in foods by acetonitrile extraction and partitioning with magnesium sulfate: Collaborative study. J. AOAC Int. 2007, 90, 485–520. [Google Scholar] [CrossRef] [PubMed] [Green Version]
- European Commission. Guidance document on pesticide residue analytical methods; European Commission Directorate General Health and Consumer Protection: Parma, Italy, 2010; p. 34. [Google Scholar]
- Wenzl, T.; Haedrich, J.; Schaechtele, A.; Robouch, P.; Stroka, J. Guidance Document on the Estimation of LOD and LOQ for Measurements in the Field of Contaminants in Feed and Food; Publications Office of the European Union: Luxembourg, 2016. [Google Scholar]
- Maštovská, K.; Lehotay, S.J. Evaluation of common organic solvents for gas chromatographic analysis and stability of multiclass pesticide residues. J. Chromatogr. A 2004, 1040, 259–272. [Google Scholar] [CrossRef]
- Asensio-Ramos, M.; Hernández-Borges, J.; Ravelo-Pérez, L.M.; Rodríguez-Delgado, M.A. Evaluation of a modified QuEChERS method for the extraction of pesticides from agricultural, ornamental and forestal soils. Anal. Bioanal. Chem. 2010, 396, 2307–2319. [Google Scholar] [CrossRef] [PubMed]
- Fernandes, V.C.; Domingues, V.F.; Mateus, N.; Delerue-Matos, C. Multiresidue pesticides analysis in soils using modified QuEChERS with disposable pipette extraction and dispersive solid-phase extraction. J. Sep. Sci. 2013, 36, 376–382. [Google Scholar] [CrossRef]
- Jiao, X.; Tang, Q.; Chen, S.; Deng, Y.; Cao, H.; Wang, G.; Yang, Y. Spatial distribution and temporal trends of farmland soil PBDEs: Processes and crop rotation effects. Environ. Sci. Pollut. Res. 2016, 23, 13137–13146. [Google Scholar] [CrossRef]
- Gaylor, M.O.; Mears, G.L.; Harvey, E.; La Guardia, M.J.; Hale, R.C. Polybrominated diphenyl ether accumulation in an agricultural soil ecosystem receiving wastewater sludge amendments. Environ. Sci. Technol. 2014, 48, 7034–7043. [Google Scholar] [CrossRef]
- Xu, J.; Qian, W.; Li, J.; Zhang, X.; He, J.; Kong, D. Polybrominated diphenyl ethers (PBDEs) in soil and dust from plastic production and surrounding areas in eastern of China. Environ. Geochem. Health 2019, 41, 2315–2327. [Google Scholar] [CrossRef]
- Camacho, M.; Herrera, A.; Gómez, M.; Acosta-Dacal, A.; Martínez, I.; Henríquez-Hernández, L.A.; Luzardo, O.P. Organic pollutants in marine plastic debris from Canary Islands beaches. Sci. Total Environ. 2019, 662. [Google Scholar] [CrossRef]
- Henríquez-Hernández, L.A.; Luzardo, O.P.; Arellano, J.L.P.; Carranza, C.; Sánchez, N.J.; Almeida-González, M.; Ruiz-Suárez, N.; Valerón, P.F.; Camacho, M.; Zumbado, M.; et al. Different pattern of contamination by legacy POPs in two populations from the same geographical area but with completely different lifestyles: Canary Islands (Spain) vs. Morocco. Sci. Total Environ. 2016, 541, 51–57. [Google Scholar] [CrossRef] [PubMed]
- Turrio-Baldassarri, L.; Abate, V.; Alivernini, S.; Battistelli, C.L.; Carasi, S.; Casella, M.; Iacovella, N.; Iamiceli, A.L.; Indelicato, A.; Scarcella, C.; et al. A study on PCB, PCDD/PCDF industrial contamination in a mixed urban-agricultural area significantly affecting the food chain and the human exposure. Part I: Soil and feed. Chemosphere 2007, 67, 1822–1830. [Google Scholar] [CrossRef] [PubMed]
- Hanedar, A.; Güneş, E.; Kaykioğlu, G. Presence and distributions of POPS in soil, atmospheric deposition, and bioindicator samples in an industrial-agricultural area in Turkey. Environ. Monit. Assess. 2019, 191, 42. [Google Scholar] [CrossRef] [PubMed]
- Mackiewicz-Walec, E.; Krzebietke, S.J. Content of polycyclic aromatic hydrocarbons in soil in a multi-annual fertilisation regime. Environ. Monit. Assess. 2020, 192. [Google Scholar] [CrossRef] [PubMed]
- Cai, Q.Y.; Mo, C.H.; Wu, Q.T.; Katsoyiannis, A.; Zeng, Q.Y. The status of soil contamination by semivolatile organic chemicals (SVOCs) in China: A review. Sci. Total Environ. 2008, 389, 209–224. [Google Scholar] [CrossRef] [PubMed]
- Akça, M.O.; Hisatomi, S.; Takemura, M.; Harada, N.; Nonaka, M.; Sakakibara, F.; Takagi, K.; Turgay, O.C. 4,4′-DDE and endosulfan levels in agricultural soils of the çukurova region, Mediterranean Turkey. Bull. Environ. Contam. Toxicol. 2016, 96, 376–382. [Google Scholar] [CrossRef]
- Khuman, S.N.; Vinod, P.G.; Bharat, G.; Kumar, Y.S.M.; Chakraborty, P. Spatial distribution and compositional profiles of organochlorine pesticides in the surface soil from the agricultural, coastal and backwater transects along the south-west coast of India. Chemosphere 2020, 254, 126699. [Google Scholar] [CrossRef]
- Ukalska-Jaruga, A.; Smreczak, B.; Siebielec, G. Assessment of pesticide residue content in Polish agricultural soils. Molecules 2020, 25, 587. [Google Scholar] [CrossRef] [Green Version]
- Malusá, E.; Tartanus, M.; Danelski, W.; Miszczak, A.; Szustakowska, E.; Kicińska, J.; Furmanczyk, E.M. Monitoring of DDT in agricultural soils under organic farming in Poland and the risk of crop contamination. Environ. Manag. 2020, 66, 916–929. [Google Scholar] [CrossRef]
- Kafaei, R.; Arfaeinia, H.; Savari, A.; Mahmoodi, M.; Rezaei, M.; Rayani, M.; Sorial, G.A.; Fattahi, N.; Ramavandi, B. Organochlorine pesticides contamination in agricultural soils of southern Iran. Chemosphere 2020, 240. [Google Scholar] [CrossRef] [PubMed]
- Ukalska-Jaruga, A.; Lewí nska, K.; Mammadov, E.; Karczewska, A.; Smreczak, Z.; Medy, A. Molecules Residues of persistent organic pollutants (POPs) in agricultural soils adjacent to historical sources of their storage and distribution-the case study of Azerbaijan. Molecules 2020, 25, 1815. [Google Scholar] [CrossRef] [Green Version]
- Alonso González, P.; Parga-Dans, E.; Pérez Luzardo, O. Big sales, no carrots: Assessment of pesticide policy in Spain. Crop. Prot. 2021, 141, 105428. [Google Scholar] [CrossRef]
- Sabatier, P.; Poulenard, J.; Fanget, B.; Reyss, J.-L.; Develle, A.-L.; Wilhelm, B.; Ployon, E.; Pignol, C.; Naffrechoux, E.; Dorioz, J.-M.; et al. Long-term relationships among pesticide applications, mobility, and soil erosion in a vineyard watershed. Proc. Natl. Acad. Sci. USA 2014, 111, 15647–15652. [Google Scholar] [CrossRef] [Green Version]
- Zaller, J.G.; Cantelmo, C.; Dos Santos, G.; Muther, S.; Gruber, E.; Pallua, P.; Mandl, K.; Friedrich, B.; Hofstetter, I.; Schmuckenschlager, B.; et al. Herbicides in vineyards reduce grapevine root mycorrhization and alter soil microorganisms and the nutrient composition in grapevine roots, leaves, xylem sap and grape juice. Environ. Sci. Pollut. Res. 2018, 25, 23215–23226. [Google Scholar] [CrossRef] [PubMed] [Green Version]
- Patinha, C.; Durães, N.; Dias, A.C.; Pato, P.; Fonseca, R.; Janeiro, A.; Barriga, F.; Reis, A.P.; Duarte, A.; Ferreira da Silva, E.; et al. Long-term application of the organic and inorganic pesticides in vineyards: Environmental record of past use. Appl. Geochem. 2018, 88, 226–238. [Google Scholar] [CrossRef]


| No. | Compound | Group a | tR (min) | Quantification | Confirmation | ||
|---|---|---|---|---|---|---|---|
| MRM Transition (m/z) | CE (eV) | MRM Transition (m/z) | CE (eV) | ||||
| 1 | PBDE 28 | PBDEs | 12.13 | 406.0 → 246.0 | 20 | 406.0 → 167.0 | 25 |
| 2 | PBDE 47 | PBDEs | 14.21 | 326.0 → 138.0 | 45 | 484.0 → 324.0 | 25 |
| 3 | PBDE 85 | PBDEs | 16.99 | 566.0 → 406.0 | 25 | 564.0 → 404.0 | 25 |
| 4 | PBDE 99 | PBDEs | 16.18 | 566.0 → 406.0 | 25 | 564.0 → 404.0 | 25 |
| 5 | PBDE 100 | PBDEs | 15.76 | 564.0 → 404.0 | 25 | 566.0 → 406.0 | 25 |
| 6 | PBDE 153 | PBDEs | 17.96 | 644.0 → 484.0 | 30 | 486.0 → 377.0 | 30 |
| 7 | PBDE 154 | PBDEs | 17.38 | 644.0 → 484.0 | 30 | 486.0 → 377.0 | 30 |
| 8 | PBDE 183 | PBDEs | 19.98 | 563.6 → 454.7 | 40 | 561.6 → 454.7 | 40 |
| 9 | Aldrin | OCPs | 9.80 | 263.0 → 228.0 | 10 | 255.0 → 220.0 | 20 |
| 10 | Dichlorodiphenyldichloroethane (p,p’ DDD) | OCPs | 12.22 | 235.0 → 165.0 | 20 | 235.0 → 199.0 | 30 |
| 11 | Dichlorodiphenyldichloroethylene (p,p’ DDE) | OCPs | 11.48 | 318.0 → 176.0 | 60 | 318.0 → 248.0 | 15 |
| 12 | Dieldrin | OCPs | 11.58 | 263.0 → 228.0 | 15 | 277.0 → 241.0 | 15 |
| 13 | Endrin | OCPs | 11.94 | 263.0 → 193.0 | 35 | 245.0 → 173.0 | 25 |
| 14 | Heptachlor | OCPs | 9.21 | 272.0 → 237.0 | 15 | 274.0 → 239.0 | 15 |
| 15 | Hexachlorobenzene (HCB) | OCPs | 7.70 | 284.0 → 214.0 | 40 | 284.0 → 249.0 | 25 |
| 16 | Hexachlorocyclohexane (alpha, HCH- α) | OCPs | 7.56 | 219.0 → 183.0 | 10 | 219.0 → 109.0 | 10 |
| 17 | Hexachlorocyclohexano (beta, HCH- β) | OCPs | 7.93 | 219.0 → 183.0 | 10 | 219.0 → 109.0 | 10 |
| 18 | Hexaclorociclohexano (delta, HCH- δ) | OCPs | 8.43 | 219.0 → 183.0 | 15 | 219.0 → 109.0 | 45 |
| 19 | Hexachlorocyclohexane (gamma, HCH-γ, lindane) | OCPs | 8.13 | 219.0 → 183.0 | 10 | 219.0 → 109.0 | 10 |
| 20 | Mirex | OCPs | 14.68 | 272.0 → 237.0 | 10 | 274.0 → 237.0 | 10 |
| 21 | Acenaphthene | PAHs | 6.10 | 153.0 → 152.0 | 25 | 153.0 → 151.0 | 35 |
| 22 | Acenaphthylene | PAHs | 5.89 | 152.0 → 151.0 | 25 | 152.0 → 126.0 | 30 |
| 23 | Anthracene | PAHs | 8.47 | 178.0 → 152.0 | 28 | 178.0 → 176.0 | 35 |
| 24 | Benzo[a]anthracene | PAHs | 13.74 | 228.0 → 226.0 | 40 | 228.0 → 202.0 | 35 |
| 25 | Benzo[b]fluoranthene | PAHs | 16.15 | 252.0 → 224.0 | 60 | 252.0 → 248.0 | 60 |
| 26 | Chrysene | PAHs | 14.01 | 228.0 → 226.0 | 40 | 228.0 → 227.0 | 25 |
| 27 | Fluoranthene | PAHs | 10.58 | 202.0 → 201.0 | 27 | 202.0 → 152.0 | 42 |
| 28 | Fluorene | PAHs | 6.75 | 165.0 → 163.0 | 40 | 165.0 → 139.0 | 32 |
| 29 | Naphthalene | PAHs | 4.42 | 128.0 → 102.0 | 25 | 128.0 → 127.0 | 15 |
| 30 | Phenanthrene | PAHs | 8.23 | 178.0 → 176.0 | 35 | 178.0 → 152.0 | 28 |
| 31 | Pyrene | PAHs | 11.04 | 202.0 → 200.0 | 45 | 202.0 → 201.0 | 27 |
| 32 | PCB 28 | PCBs | 8.94 | 256.0 → 186.0 | 25 | 256.0 → 151.0 | 50 |
| 33 | PCB 52 | PCBs | 9.49 | 292.0 → 222.0 | 25 | 292.0 → 220.0 | 25 |
| 34 | PCB 77 | PCBs | 11.65 | 292.0 → 222.0 | 25 | 292.0 → 220.0 | 25 |
| 35 | PCB 81 | PCBs | 11.47 | 292.0 → 222.0 | 25 | 292.0 → 220.0 | 25 |
| 36 | PCB 101 | PCBs | 10.98 | 326.0 → 256.0 | 30 | 328.0 → 256.0 | 30 |
| 37 | PCB 105 | PCBs | 12.56 | 326.0 → 256.0 | 30 | 328.0 → 256.0 | 30 |
| 38 | PCB 114 | PCBs | 12.29 | 326.0 → 256.0 | 30 | 328.0 → 256.0 | 30 |
| 39 | PCB 118 | PCBs | 12.15 | 326.0 → 256.0 | 30 | 328.0 → 256.0 | 30 |
| 40 | PCB 123 | PCBs | 12.01 | 326.0 → 256.0 | 30 | 328.0 → 256.0 | 30 |
| 41 | PCB 126 | PCBs | 13.14 | 326.0 → 256.0 | 30 | 328.0 → 256.0 | 30 |
| 42 | PCB 138 | PCBs | 12.97 | 360.0 → 290.0 | 25 | 360.0 → 288.0 | 25 |
| 43 | PCB 153 | PCBs | 12.47 | 360.0 → 290.0 | 25 | 360.0 → 288.0 | 25 |
| 44 | PCB 156 | PCBs | 13.86 | 360.0 → 290.0 | 25 | 360.0 → 288.0 | 25 |
| 45 | PCB 157 | PCBs | 13.96 | 360.0 → 290.0 | 25 | 360.0 → 288.0 | 25 |
| 46 | PCB 167 | PCBs | 13.45 | 360.0 → 290.0 | 25 | 360.0 → 288.0 | 25 |
| 47 | PCB 169 | PCBs | 14.52 | 360.0 → 290.0 | 25 | 360.0 → 288.0 | 25 |
| 48 | PCB 180 | PCBs | 14.14 | 394.0 → 324.0 | 30 | 394.0 → 322.0 | 30 |
| 49 | PCB 189 | PCBs | 15.15 | 394.0 → 324.0 | 30 | 394.0 → 322.0 | 30 |
| PCB 200 | P-IS | 14.46 | 427.8 → 357.8 | 30 | 429.8 → 359.8 | 30 | |
| No. | Compound | Group | R2 | LOD (ng g−1) | LOQ (ng g−1) |
|---|---|---|---|---|---|
| 1 | PBDE 28 | PBDEs | 0.9997 | 0.390 | 1.0 |
| 2 | PBDE 47 | PBDEs | 0.9984 | 0.195 | 1.0 |
| 3 | PBDE 85 | PBDEs | 0.9982 | 0.780 | 1.0 |
| 4 | PBDE 99 | PBDEs | 0.9984 | 0.390 | 1.0 |
| 5 | PBDE 100 | PBDEs | 0.9966 | 0.195 | 1.0 |
| 6 | PBDE 153 | PBDEs | 0.9990 | 0.195 | 1.0 |
| 7 | PBDE 154 | PBDEs | 0.9984 | 0.390 | 1.0 |
| 8 | PBDE 183 | PBDEs | 0.9981 | 0.195 | 0.5 |
| 9 | Aldrin | OCPs | 0.9976 | 0.390 | 1.0 |
| 10 | p,p’ DDD | OCPs | 0.9993 | 1.560 | 2.5 |
| 11 | p,p’ DDE | OCPs | 0.9975 | 0.390 | 2.5 |
| 12 | Dieldrin | OCPs | 0.9951 | 1.560 | 5.0 |
| 13 | Endrin | OCPs | 0.9910 | 1.560 | 2.5 |
| 14 | Heptachlor | OCPs | 0.9987 | 0.097 | 0.5 |
| 15 | HCB | OCPs | 0.9997 | 0.390 | 1.0 |
| 16 | HCH- α | OCPs | 0.9948 | 1.560 | 2.5 |
| 17 | HCH- β | OCPs | 0.9989 | 1.560 | 2.5 |
| 18 | HCH- δ | OCPs | 0.9992 | 1.560 | 2.5 |
| 19 | Lindane | OCPs | 0.9993 | 1.560 | 5.0 |
| 20 | Mirex | OCPs | 0.9988 | 0.390 | 1.0 |
| 21 | Acenaphthene | PAHs | 0.9972 | 0.780 | 2.5 |
| 22 | Acenaphthylene | PAHs | 0.9962 | 0.780 | 1.0 |
| 23 | Anthracene | PAHs | 0.9993 | 0.780 | 5.0 |
| 24 | Benzo[a]anthracene | PAHs | 0.9932 | 0.780 | 20.0 |
| 25 | Benzo[b]fluoranthene | PAHs | 0.9967 | 1.560 | 10.0 |
| 26 | Chrysene | PAHs | 0.9912 | 0.780 | 10.0 |
| 27 | Fluoranthene | PAHs | 0.9963 | 0.780 | 20.0 |
| 28 | Fluorene | PAHs | 0.9980 | 0.390 | 1.0 |
| 29 | Naphthalene | PAHs | 0.9978 | 3.125 | 50.0 |
| 30 | Phenanthrene | PAHs | 0.9991 | 0.780 | 5.0 |
| 31 | Pyrene | PAHs | 0.9993 | 0.780 | 10.0 |
| 32 | PCB 28 | PCBs | 0.9997 | 0.097 | 1.0 |
| 33 | PCB 52 | PCBs | 0.9986 | 0.195 | 1.0 |
| 34 | PCB 77 | PCBs | 0.9995 | 0.195 | 1.0 |
| 35 | PCB 81 | PCBs | 0.9947 | 0.780 | 1.0 |
| 36 | PCB 101 | PCBs | 0.9995 | 0.390 | 1.0 |
| 37 | PCB 105 | PCBs | 0.9963 | 0.097 | 1.0 |
| 38 | PCB 114 | PCBs | 0.9993 | 0.195 | 1.0 |
| 39 | PCB 118 | PCBs | 0.9968 | 0.195 | 1.0 |
| 40 | PCB 123 | PCBs | 0.9992 | 0.097 | 1.0 |
| 41 | PCB 126 | PCBs | 0.9999 | 0.097 | 1.0 |
| 42 | PCB 138 | PCBs | 0.9996 | 0.048 | 1.0 |
| 43 | PCB 153 | PCBs | 0.9997 | 0.390 | 1.0 |
| 44 | PCB 156 | PCBs | 0.9990 | 0.390 | 1.0 |
| 45 | PCB 157 | PCBs | 0.9978 | 0.390 | 1.0 |
| 46 | PCB 167 | PCBs | 0.9990 | 0.390 | 1.0 |
| 47 | PCB 169 | PCBs | 0.9983 | 0.390 | 1.0 |
| 48 | PCB 180 | PCBs | 0.9943 | 0.78 | 1.0 |
| 49 | PCB 189 | PCBs | 0.9992 | 0.195 | 1.0 |
| No. | Compound | Group | 0.5 ng g−1 | 1.0 ng g−1 | 2.5 ng g⁻1 | 5.0 ng g⁻1 | 10.0 ng g⁻1 | 20.0 ng g⁻1 | 50.0 ng g⁻1 |
|---|---|---|---|---|---|---|---|---|---|
| 1 | PBDE 28 | PBDEs | N/A | 106.8 (12.3) | 116.4 (16.6) | 101.1 (6.7) | 122.9 (20.7) | 105.7 (7.5) | 105.0 (6.4) |
| 2 | PBDE 47 | PBDEs | N/A | 98.7 (5.5) | 102.7 (9.3) | 97.8 (2.9) | 114.5 (11.6) | 99.3 (4.6) | 103.1 (4.8) |
| 3 | PBDE 85 | PBDEs | N/A | 92.5 (7.9) | 100.7 (13.7) | 88.1 (7.6) | 104.1 (11.9) | 91.7 (15.7) | 99.3 (9.8) |
| 4 | PBDE 99 | PBDEs | N/A | 107.8 (9.7) | 107.0 (11.0) | 92.3 (10.4) | 102.1 (15.4) | 96.2 (15.3) | 103.1 (9.7) |
| 5 | PBDE 100 | PBDEs | N/A | 97.9 (11.6) | 108.4 (10.9) | 91.5 (3.5) | 112.0 (13.0) | 103.6 (6.4) | 104.6 (5.9) |
| 6 | PBDE 153 | PBDEs | N/A | 95.0 (9.6) | 103.3 (11.2) | 86.2 (4.6) | 99.4 (15.2) | 89.9 (8.9) | 96.1 (9.8) |
| 7 | PBDE 154 | PBDEs | N/A | 100.1 (2.4) | 99.5 (11.4) | 86.6 (6.2) | 94.3 (14.2) | 87.1 (11.2) | 94.2 (7.5) |
| 8 | PBDE 183 | PBDEs | 117.1 (15.3) | 80.6 (10.8) | 95.3 (8.1) | 83.5 (6.3) | 96.3 (19.1) | 87.3 (9.4) | 85.6 (4.8) |
| 9 | Aldrin | OCPs | N/A | 106.2 (17.0) | 112.1 (11.1) | 99.9 (13.0) | 112.5 (12.1) | 100.7 (4.3) | 102.2 (5.8) |
| 10 | p,p’ DDD | OCPs | N/A | N/A | 105.2 (18.8) | 89.9 (4.4) | 97.5 (17.2) | 89.2 (3.1) | 86.7 (5.1) |
| 11 | p,p’ DDE | OCPs | N/A | N/A | 101.3 (13.3) | 81.8 (10.8) | 107.4 (11.0) | 103.5 (6.1) | 107.7 (9.9) |
| 12 | Dieldrin | OCPs | N/A | N/A | N/A | 77.5 (10.0) | 116.7 (10.7) | 104.0 (4.9) | 96.5 (6.2) |
| 13 | Endrin | OCPs | N/A | N/A | 90.8 (11.1) | 77.3 (9.1) | 72.1 (12.8) | 69.2 (11.5) | 67.9 (9.0) |
| 14 | Heptachlor | OCPs | 99.4 (13.3) | 69.8 (13.5) | 88.3 (27.1) | 74.3 (7.1) | 85.4 (21.5) | 84.3 (10.4) | 82.0 (16.8) |
| 15 | HCB | OCPs | N/A | 104.2 (8.5) | 111.4 (7.0) | 102.0 (4.9) | 110.0 (14.6) | 101.4 (4.3) | 103.9 (3.5) |
| 16 | HCH- α | OCPs | N/A | N/A | 119.6 (7.6) | 101.9 (4.4) | 100.1 (15.0) | 89.3 (10.1) | 95.3 (18.2) |
| 17 | HCH- β | OCPs | N/A | N/A | 99.2 (12.7) | 86.3 (9.6) | 98.3 (22.7) | 99.5 (19.3) | 84.6 (7.3) |
| 18 | HCH- δ | OCPs | N/A | N/A | 81.8 (16.4) | 77.7 (5.5) | 93.8 (23.1) | 89.9 (6.7) | 86.6 (7.1) |
| 19 | Lindane | OCPs | N/A | N/A | N/A (N/A) | 76.9 (15.7) | 94.9 (31.6) | 94.7 (20.9) | 84.1 (5.4) |
| 20 | Mirex | OCPs | N/A | 82.7 (13.9) | 84.5 (19.3) | 72.7 (7.5) | 83.3 (14.6) | 78.4 (7.9) | 79.9 (7.3) |
| 21 | Acenaphthene | PAHs | N/A | N/A | 112.7 (18.6) | 117.2 (12.9) | 130.4 (19.6) | 130.8 (8.9) | 122.9 (4.0) |
| 22 | Acenaphthylene | PAHs | N/A | 117.9 (10.7) | 116.8 (8.1) | 115.3 (6.3) | 118.3 (15.6) | 123.1 (12.6) | 112.6 (5.7) |
| 23 | Anthracene | PAHs | N/A | N/A | N/A | 104.8 (8.7) | 103.5 (13.9) | 101.9 (2.6) | 100.9 (8.8) |
| 24 | Benzo[a]anthracene | PAHs | N/A | N/A | N/A | N/A | N/A | 76.5 (12.1) | 86.5 (10.5) |
| 25 | Benzo[b]fluoranthene | PAHs | N/A | N/A | N/A | N/A | 63.2 (12.7) | 67.1 (14.1) | 71.7 (9.3) |
| 26 | Chrysene | PAHs | N/A | N/A | N/A | N/A | 70.1 (19.7) | 68.4 (10.0) | 76.1 (10.8) |
| 27 | Fluoranthene | PAHs | N/A | N/A | N/A | N/A | N/A | 109.2 (14.1) | 106.9 (9.7) |
| 28 | Fluorene | PAHs | N/A | 109.4 (17.3) | 113.1 (10.3) | 121.9 (2.7) | 126.8 (19.6) | 121.0 (9.9) | 122.5 (5.9) |
| 29 | Naphthalene | PAHs | N/A | N/A | N/A | N/A | N/A | N/A | 116.8 (4.0) |
| 30 | Phenanthrene | PAHs | N/A | N/A | N/A | 113.8 (13.6) | 120.1 (19.1) | 120.3 (6.4) | 113.3 (7.0) |
| 31 | Pyrene | PAHs | N/A | N/A | N/A | N/A | 113.4 (19.8) | 104.0 (15.5) | 102.9 (11.4) |
| 32 | PCB 28 | PCBs | N/A | 102.6 (10.5) | 114.5 (9.2) | 108.1 (7.3) | 120.6 (15.7) | 112.7 (5.1) | 112.9 (5.4) |
| 33 | PCB 52 | PCBs | N/A | 106.6 (5.8) | 119.2 (6.9) | 106.9 (4.6) | 126.0 (11.8) | 110.1 (3.8) | 105.5 (5.0) |
| 34 | PCB 77 | PCBs | N/A | 98.3 (4.2) | 108.7 (7.4) | 106.8 (6.8) | 114.2 (11.1) | 103.3 (3.5) | 98.7 (7.0) |
| 35 | PCB 81 | PCBs | N/A | 107.0 (7.6) | 105.6 (4.1) | 93.6 (4.2) | 106.2 (11.5) | 97.3 (5.8) | 109.8 (9.6) |
| 36 | PCB 101 | PCBs | N/A | 101.0 (4.9) | 111.5 (9.2) | 107.6 (8.0) | 126.7 (16.1) | 111.5 (5.6) | 107.5 (6.1) |
| 37 | PCB 105 | PCBs | N/A | 90.6 (8.0) | 102.8 (15.6) | 99.4 (11.2) | 112.2 (11.8) | 108.8 (5.1) | 110.5 (2.9) |
| 38 | PCB 114 | PCBs | N/A | 107.5 (12.6) | 110.6 (10.9) | 102.9 (5.4) | 117.1 (19.5) | 104.1 (6.5) | 107.2 (4.5) |
| 39 | PCB 118 | PCBs | N/A | 108.7 (13.9) | 109.8 (10.7) | 100.8 (8.6) | 110.5 (15.4) | 97.7 (4.1) | 100.4 (20.3) |
| 40 | PCB 123 | PCBs | N/A | 114.8 (9.5) | 131.9 (7.3) | 128.1 (6.0) | 136.5 (13.5) | 123.1 (4.9) | 111.2 (2.2) |
| 41 | PCB 126 | PCBs | N/A | 102.1 (8.6) | 111.0 (9.2) | 114.2 (6.3) | 115.4 (13.9) | 98.9 (6.2) | 91.7 (5.8) |
| 42 | PCB 138 | PCBs | N/A | 92.3 (10.0) | 108.7 (17.7) | 111.7 (7.7) | 120.3 (22.5) | 88.6 (12.7) | 81.5 (8.3) |
| 43 | PCB 153 | PCBs | N/A | 103.6 (15.3) | 109.2 (5.6) | 110.0 (6.2) | 121.6 (15.9) | 105.5 (4.3) | 104.5 (3.2) |
| 44 | PCB 156 | PCBs | N/A | 102.0 (6.1) | 110.6 (3.5) | 107.1 (10.1) | 109.2 (9.9) | 98.1 (10.5) | 88.5 (6.9) |
| 45 | PCB 157 | PCBs | N/A | 103.5 (12.7) | 102.5 (9.1) | 97.0 (6.0) | 103.3 (19.1) | 95.5 (5.6) | 103.3 (14.5) |
| 46 | PCB 167 | PCBs | N/A | 102.1 (9.9) | 106.5 (10.7) | 101.9 (5.4) | 110.9 (16.1) | 101.3 (4.7) | 105.3 (7.6) |
| 47 | PCB 169 | PCBs | N/A | 108.2 (8.5) | 100.9 (8.7) | 96.1 (4.5) | 106.4 (12.5) | 93.7 (4.4) | 101.1 (6.5) |
| 48 | PCB 180 | PCBs | N/A | 104.5 (6.4) | 100.0 (16.6) | 97.3 (5.6) | 102.0 (10.5) | 87.3 (3.9) | 99.0 (10.1) |
| 49 | PCB 189 | PCBs | N/A | 104.9 (8.6) | 114.9 (2.3) | 103.7 (2.1) | 118.4 (12.6) | 103.9 (11.5) | 95.9 (6.5) |
| Conventional Production | Organic Production | ||||||||
|---|---|---|---|---|---|---|---|---|---|
| Compound | Mean ± SD | Median | P25–P75 | Freq. (%) | Mean ± SD | Median | P25–P75 | Freq. (%) | p-Value |
| DDE | 170.6 ± 309.9 | 5.3 | 0.3–156.9 | 68.2 | 295.0 ± 697.7 | 3.0 | 0.3–108.4 | 65.8 | 0.7549 |
| DDD | 31.9 ± 54.4 | 1.4 | 0.5–38.1 | 45.6 | 39.2 ± 96.5 | 1.2 | 0.7–18.6 | 39.5 | 0.5156 |
| Dieldrin | 5.1 ± 18.0 | 1.1 | 0.4–1.4 | 13.6 | 21.5 ± 59.9 | 0.8 | 0.3–3.1 | 23.7 | 0.9834 |
| Lindane | - | - | - | 0 | 0.4 ± 0.9 | 0.3 | 0.2–0.5 | 2.6 | 0.4574 |
| Acenaphthene | 0.7 ± 1.5 | 0.4 | 0.2–0.6 | 4.5 | 0.5 ± 0.3 | 0.4 | 0.2–0.6 | 7.9 | 0.9539 |
| Acenaphthylene | - | - | - | 0 | 0.4 ± 0.3 | 0.3 | 0.1–0.5 | 7.9 | 0.1224 |
| Anthracene | 1.0 ± 2.5 | 0.5 | 0.1–0.7 | 4.5 | 0.4 ± 0.7 | 0.3 | 0.1–0.6 | 2.6 | 0.2252 |
| Benzo[a]anthracene | 1.1 ± 1.7 | 0.4 | 0.2 – 0.7 | 15.9 | 1.8 ± 4.7 | 0.4 | 0.1–0.7 | 13.2 | 0.9318 |
| Benzo[b]fluoranthene | 0.6 ± 1.5 | 0.3 | 0.2–0.5 | 4.5 | 3.9 ± 12.1 | 0.4 | 0.2–0.7 | 7.9 | 0.0975 |
| Chrysene | 0.4 ± 0.8 | 0.3 | 0.1–0.6 | 2.3 | 1.8 ± 5.3 | 0.4 | 0.3–0.5 | 2.6 | 0.0591 |
| Fluoranthene | 4.3 ± 9.5 | 0.4 | 0.2–0.7 | 22.7 | 2.2 ± 4.9 | 0.5 | 0.2–0.7 | 15.8 | 0.7478 |
| Fluorene | 0.7 ± 1.6 | 0.4 | 0.2–0.6 | 4.5 | - | - | - | 0 | 0.8369 |
| Naphthalene | 0.6 ± 1.0 | 0.4 | 0.2–0.6 | 4.5 | - | - | - | 0 | 0.4631 |
| Phenanthrene | 3.8 ± 11.5 | 0.6 | 0.3–1.4 | 27.3 | 1.3 ± 2.2 | 0.4 | 0.2–1.3 | 26.3 | 0.5155 |
| Pyrene | 3.6 ± 7.4 | 0.4 | 0.2–1.6 | 25.0 | 2.2 ± 5.1 | 0.4 | 0.2–0.6 | 15.8 | 0.5740 |
| PCB28 | 0.4 ± 0.2 | 0.3 | 0.2–0.6 | 11.4 | 0.4 ± 0.2 | 0.4 | 0.2–0.6 | 21.1 | 0.9650 |
| PCB52 | 0.5 ± 0.2 | 0.5 | 0.3–0.7 | 4.5 | 0.4 ± 0.2 | 0.5 | 0.2–0.6 | 7.9 | 0.6091 |
| Conventional Production | Organic Production | ||||||||
|---|---|---|---|---|---|---|---|---|---|
| Compound | Mean ± SD | Median | P25–P75 | Freq. (%) | Mean ± SD | Median | P25–P75 | Freq. (%) | p-Value |
| DDE | 456.2 ± 721.6 | 148.8 **** | 5.8–568.9 | 91.4 | 58.4 ± 185.3 | 0.5 | 0.2–7.9 | 51.0 | <0.0001 |
| DDD | 55.8 ± 66.5 | 32.6 *** | 0.9–119.0 | 62.8 | 19.2 ± 78.8 | 1.2 | 0.5–2.7 | 27.7 | 0.0006 |
| Dieldrin | 27.3 ± 63.8 | 1.3 * | 0.4–5.6 | 34.3 | 1.8 ± 5.0 | 0.8 | 0.5–1.3 | 6.4 | 0.0240 |
| Lindane | - | - | - | 0 | 0.4 ± 0.9 | 0.3 | 0.1–0.5 | 4.3 | 0.9478 |
| Acenaphthene | 0.9 ± 1.7 | 0.5 | 0.3–0.7 | 14.3 | - | - | - | 0 | 0.0964 |
| Acenaphthylene | 0.5 ± 0.3 | 0.4 | 0.3–0.6 | 8.5 | - | - | - | 0 | 0.3506 |
| Anthracene | 1.1 ± 2.7 | 0.4 | 0.2–0.6 | 5.7 | 0.5 ± 0.6 | 0.5 | 0.1–0.7 | 2.1 | 0.7503 |
| Benzo[a]anthracene | 1.3 ± 1.8 | 0.6 | 0.3–1.5 | 25.7 | 1.5 ± 4.2 | 0.5 | 0.2–0.7 | 8.5 | 0.4825 |
| Benzo[b]fluoranthene | - | - | - | 0 | 3.4 ± 10.8 | 0.5 | 0.2–0.7 | 17.0 | 0.2092 |
| Chrysene | - | - | - | 0 | 1.6 ± 4.7 | 0.4 | 0.2–0.6 | 8.5 | 0.8092 |
| Fluoranthene | 5.7 ± 10.4 | 0.6 | 0.3–6.6 | 31.4 | 1.6 ± 4.3 | 0.5 | 0.2–0.7 | 10.6 | 0.2515 |
| Fluorene | 0.8 ± 1.8 | 0.4 | 0.2–0.6 | 5.7 | - | - | - | 0 | 0.9766 |
| Naphthalene | 0.6 ± 1.1 | 0.4 | 0.1–0.6 | 5.7 | - | - | - | 0 | 0.5803 |
| Phenanthrene | 4.9 ± 12.8 | 0.6 | 0.5–4.2 | 40.0 | 1.0 ± 1.9 | 0.5 | 0.3–0.7 | 17.0 | 0.0315 |
| Pyrene | 4.8 ± 8.2 | 0.4 | 0.2–7.6 | 31.4 | 1.5 ± 4.3 | 0.3 | 0.2–0.8 | 14.9 | 0.1583 |
| PCB28 | - | - | - | 0 | 0.4 ± 0.3 | 0.3 | 0.2–0.6 | 27.7 | 0.4995 |
| PCB52 | 0.4 ± 0.2 | 0.4 | 0.1–0.6 | 14.3 | - | - | - | 0 | 0.6052 |
Publisher’s Note: MDPI stays neutral with regard to jurisdictional claims in published maps and institutional affiliations. |
© 2021 by the authors. Licensee MDPI, Basel, Switzerland. This article is an open access article distributed under the terms and conditions of the Creative Commons Attribution (CC BY) license (https://creativecommons.org/licenses/by/4.0/).
Share and Cite
Acosta-Dacal, A.; Rial-Berriel, C.; Díaz-Díaz, R.; Bernal-Suárez, M.d.M.; Zumbado, M.; Henríquez-Hernández, L.A.; Alonso-González, P.; Parga-Dans, E.; Luzardo, O.P. Validation of a Method Scope Extension for the Analysis of POPs in Soil and Verification in Organic and Conventional Farms of the Canary Islands. Toxics 2021, 9, 101. https://0-doi-org.brum.beds.ac.uk/10.3390/toxics9050101
Acosta-Dacal A, Rial-Berriel C, Díaz-Díaz R, Bernal-Suárez MdM, Zumbado M, Henríquez-Hernández LA, Alonso-González P, Parga-Dans E, Luzardo OP. Validation of a Method Scope Extension for the Analysis of POPs in Soil and Verification in Organic and Conventional Farms of the Canary Islands. Toxics. 2021; 9(5):101. https://0-doi-org.brum.beds.ac.uk/10.3390/toxics9050101
Chicago/Turabian StyleAcosta-Dacal, Andrea, Cristian Rial-Berriel, Ricardo Díaz-Díaz, María del Mar Bernal-Suárez, Manuel Zumbado, Luis Alberto Henríquez-Hernández, Pablo Alonso-González, Eva Parga-Dans, and Octavio P. Luzardo. 2021. "Validation of a Method Scope Extension for the Analysis of POPs in Soil and Verification in Organic and Conventional Farms of the Canary Islands" Toxics 9, no. 5: 101. https://0-doi-org.brum.beds.ac.uk/10.3390/toxics9050101