Article

Short-Term Exposure to Ambient Air Pollution and Increased Emergency Room Visits for Skin Diseases in Beijing, China

1
Department of Occupational and Environmental Health Sciences, School of Public Health, Peking University, Beijing 100191, China
2
Emergency Department, Peking University Third Hospital, Beijing 100191, China
*
Authors to whom correspondence should be addressed.
These authors contributed equally to this work.
Submission received: 1 April 2021 / Revised: 4 May 2021 / Accepted: 8 May 2021 / Published: 12 May 2021

Abstract

:
Skin diseases have become a global concern. This study aims to evaluate the associations between ambient air pollution and emergency room visits for skin diseases under the background of improving air quality in China. Based on 45,094 cases from a general hospital and fixed-site monitoring environmental data from 2014–2019 in Beijing, China, this study used generalized additive models with quasi-Poisson regression to estimate the exposure–health associations at lag 0–1 to lag 0–7. PM2.5 and NO2 exposure were associated with increased emergency room visits for total skin diseases (ICD10: L00-L99). Positive associations of PM2.5, PM10, O3 and NO2 with dermatitis/eczema (ICD-10: L20–30), as well as SO2 and NO2 with urticaria (ICD-10: L50) visits were also found. For instance, a 10 μg/m3 increase in PM2.5 was associated with increases of 0.7% (95%CI: 0.2%, 1.2%) in total skin diseases visits at lag 0–5 and 1.1% (95%CI: 0.6%, 1.7%) in dermatitis/eczema visits at lag 0–1, respectively. For PM2.5, PM10 and CO, stronger annual associations were typically observed in the high-pollution (2014) and low-pollution (2018/2019) years. For instance, a 10 μg/m3 increase in PM2.5 at lag 0–5 was associated with increases of 1.8% (95%CI: 1.0%, 2.6%) and 2.3% (95%CI: 0.4%, 4.3%) in total skin disease visits in 2014 and 2018, respectively. Our study emphasizes the necessity of controlling the potential health hazard of air pollutants on skin, although significant achievements in air quality control have been made in China.

1. Introduction

Ambient air pollution is associated with exacerbated disease burden in the global scale [1]. Short- and long-term exposures to ambient air pollution are associated with increased all-cause mortality and risks of cardiovascular diseases and asthma at the population level [2,3,4]. Skin diseases have become a major challenge for global public health due to their high prevalence and severe disease burden. Among the top 50 most prevalent diseases, eight were skin and subcutaneous diseases [5], affecting one in four individuals worldwide in 2019 [6], with a rapid increase of over 24.0% compared to 1990 [7]. In 2019, skin and subcutaneous diseases accounted for 42.9 million disability-adjusted life years (DALYs) globally, among which dermatitis and eczema contributed to the greatest proportion [6]. In China, there were more than 369 million skin disease cases, contributing to 8.3 million DALYs in 2019 [6]. The concurrent increasing trend of skin disease prevalence and ambient air pollution brings novel insights into its environmental etiology [8,9]. Several epidemiological studies have also linked exposure to air pollution, especially particulate matter (PM) to increased risks of dermatitis, eczema [10,11,12,13,14], acne vulgaris [15], etc., but yielded inconclusive findings partly attributable to the variations across populations and regions with different environment backgrounds [16].
In 2013, Air Pollution Prevention and Control Action Plan (APPCAP) was launched to overcome the air pollution challenge in China with a focus on several key regions [17], among which the Beijing–Tianjin–Hebei region was of great concern due to its severe pollution [18]. As a key prevention and control area, Beijing additionally initiated the Clean Air Action Plan from 2013–2017, causing remarkable reductions in air pollutants, except for ozone (O3), since 2013 [19]. This provides a good opportunity to evaluate the potential health effects of air pollutants at different concentrations [20].
There were two major limitations of recent studies. First, most previous evidence was based on outpatient visits, which were relatively less sensitive to capture the acute effects of air pollutants. Meanwhile, to date, the potential effect of the constant improvement of air quality on skin diseases remains unexplored. Therefore, this study investigated the association between short-term exposure to ambient air pollution and emergency room visits for skin diseases, a sensitive measure for the acute onset of skin diseases at the population level. We also, for the first time, explored its temporal variability from 2014–2019, a time period showing remarkable and continuous improvement in air quality in Beijing, China.

2. Materials and methods

2.1. Study Design and Population

The present time-series study was conducted based on a population derived from the emergency room visit data of Peking University Third Hospital (https://www.puh3.net.cn/englishweb/index.shtml, accessed on 1 August 2020), which is one of the largest tertiary general hospitals in Beijing. In 2019, the hospital provided more than 300,000 emergency medical services for people in all age groups and with different kinds of demographical characteristics. The patients were similar to those of other public hospitals, and accounted for about 15~20% of the total emergency cases in Beijing.
We extracted daily hospital emergency room visits for skin diseases from January 2014 through December 2019 recorded in the hospital information system (HIS) coded as the International Classification of Disease, 10th revision (ICD-10): L00-L99. The emergency room visits for two major skin diseases, dermatitis/eczema (ICD-10: L20–30) and urticaria (ICD-10: L50) were also extracted [21].
The data used for this study were collected for administrative purposes without individual identifiers, and thus could be exempt from the Institutional Review Board.

2.2. Air Pollutants and Meteorological Data

We included six major ambient air pollutants, including the fine particles (PM2.5), inhalable particles (PM10), nitrogen dioxide (NO2), sulfur dioxide (SO2), O3 and carbon monoxide (CO). The Chinese Air Quality Online Monitoring and Analysis Platform (https://www.aqistudy.cn/, accessed on 5 August 2020) provided hourly concentrations of the six air pollutants in 35 fixed-site stations in Beijing. Daily average concentrations of five ambient pollutants (PM2.5, PM10, NO2, SO2 and CO) and 8 h maximum concentration of O3 during the study period were calculated, as a proxy for population exposure, in line with previous time-series studies [10,11]. The National Meteorological Information Center (http://data.cma.cn/, accessed on 5 August 2020) provided daily meteorological data such as temperature and relative humidity (RH) of 20 national observatories in Beijing. The numbers (proportion) of missing data were 7 (0.32%), 42 (1.92%), 18 (0.82%), 1 (0.05%), 1 (0.05%) and 1 (0.05%) for PM2.5, PM10, O3, SO2, NO2 and CO, respectively, and they were excluded from the analysis.

2.3. Statistical Analysis

To capture the short-term cumulative lagged associations between ambient air pollution and emergency room visits for skin diseases, 2- to 8-day moving average concentrations (lag 0–1 to lag 0–7, the average concentration of the present day and previous 1–7 days) of the six pollutants were generated and assigned to the daily visit data. The exposure metrics were selected based on previous time-series studies [22,23]. First, we conducted a time-series analysis to estimate the overall associations over the whole study period (2014–2019). Generalized additive models with quasi-Poisson regression [24] were performed using the following formula:
Log[E(Yt)] = α + βZt + DOW + Holiday + ns (calendar time, df = 7 per year) + cb (Tt, …, Tt−14, df = 4) + ns (RH, df = 3)
where t represents the day of the observation; E(Yt) is the expected number of emergency room visits for skin diseases on day t; β is the regression coefficient of air pollutants; Zt is the moving average concentrations of ambient air pollutants at lag 0–1 to lag 0–7 for day t. DOW and Holiday are the category day of week and holiday variable included to account for temporal variations across weeks and holidays. The ns (calendar time, df = 7 per year) indicates a natural cubic spline function with 7 degrees of freedom per year for calendar time [3]. Temperature and RH were also used to adjust for potential non-linear and delayed confounding effects of weather conditions. Specifically, cb (Tt, …, Tt−14, df = 4) is a cross-basis function using the distributed lag nonlinear model (DLNM) with a maximum period of 14 days and 4 degrees of freedom for temperature [25], and ns (RH, df = 3) is a natural cubic spline function with 3 degrees of freedom for RH, consistent with previous studies [26]. Subgroup analyses stratified by individual age (≤18, 18–39 and ≥40 years), sex and season (warm season: May–Oct; cold season: Nov–Apr) were performed [27]. The inter-group differences were examined using the Z-test [3].
To further explore the temporal variability of the associations between ambient air pollutants and emergency room visits for skin diseases over the study period, we performed time-stratified analyses using interaction models, which included the main effect terms of pollutants and year, their multiplicative interaction terms, as well as aforementioned covariates. The yearly effect estimates were obtained from the regression coefficients of pollutants and interaction terms [26]. The interaction terms of pollutants and year were also examined to evaluate the differences by year [28,29].
Several additional analyses were used to evaluate the robustness of the results. First, two-pollutant models were conducted for each air pollutant by adjusting one other air pollutant with the same exposure metrics. Second, we used a different lag time of 30 days for temperature to account for its potential non-linear effects at a longer exposure metric, and different df values of 4–10 per year for calendar time, as used previously [26,30]. Third, we also conducted time-stratified analyses based on three time periods: 2014–2015, 2016–2017 and 2018–2019, considering that the annual estimates might be unstable, as reported previously [28]. In addition, we plotted the exposure–response curves to characterize the associations between air pollutants and daily emergency room visits for skin diseases at different exposure concentrations, where we replaced the linear term of air pollutants in the main model with a natural smoothing function with 3 dfs [31]. We also compared the main models and the non-linear models according to the minimized AIC criteria.
Results were expressed as the percentage changes and 95% confidence intervals (CIs) in the emergency room visits for skin diseases with a 10 μg/m3 increase in PM2.5, PM10, NO2, SO2, 8 h maximum O3 concentrations and an increase of 1 mg/m3 in CO concentration. All statistical analyses were performed using R software (Version 4.0.0) with “mgcv” and “dlnm” packages. A two-sided p < 0.05 was considered statistically significant.

3. Results

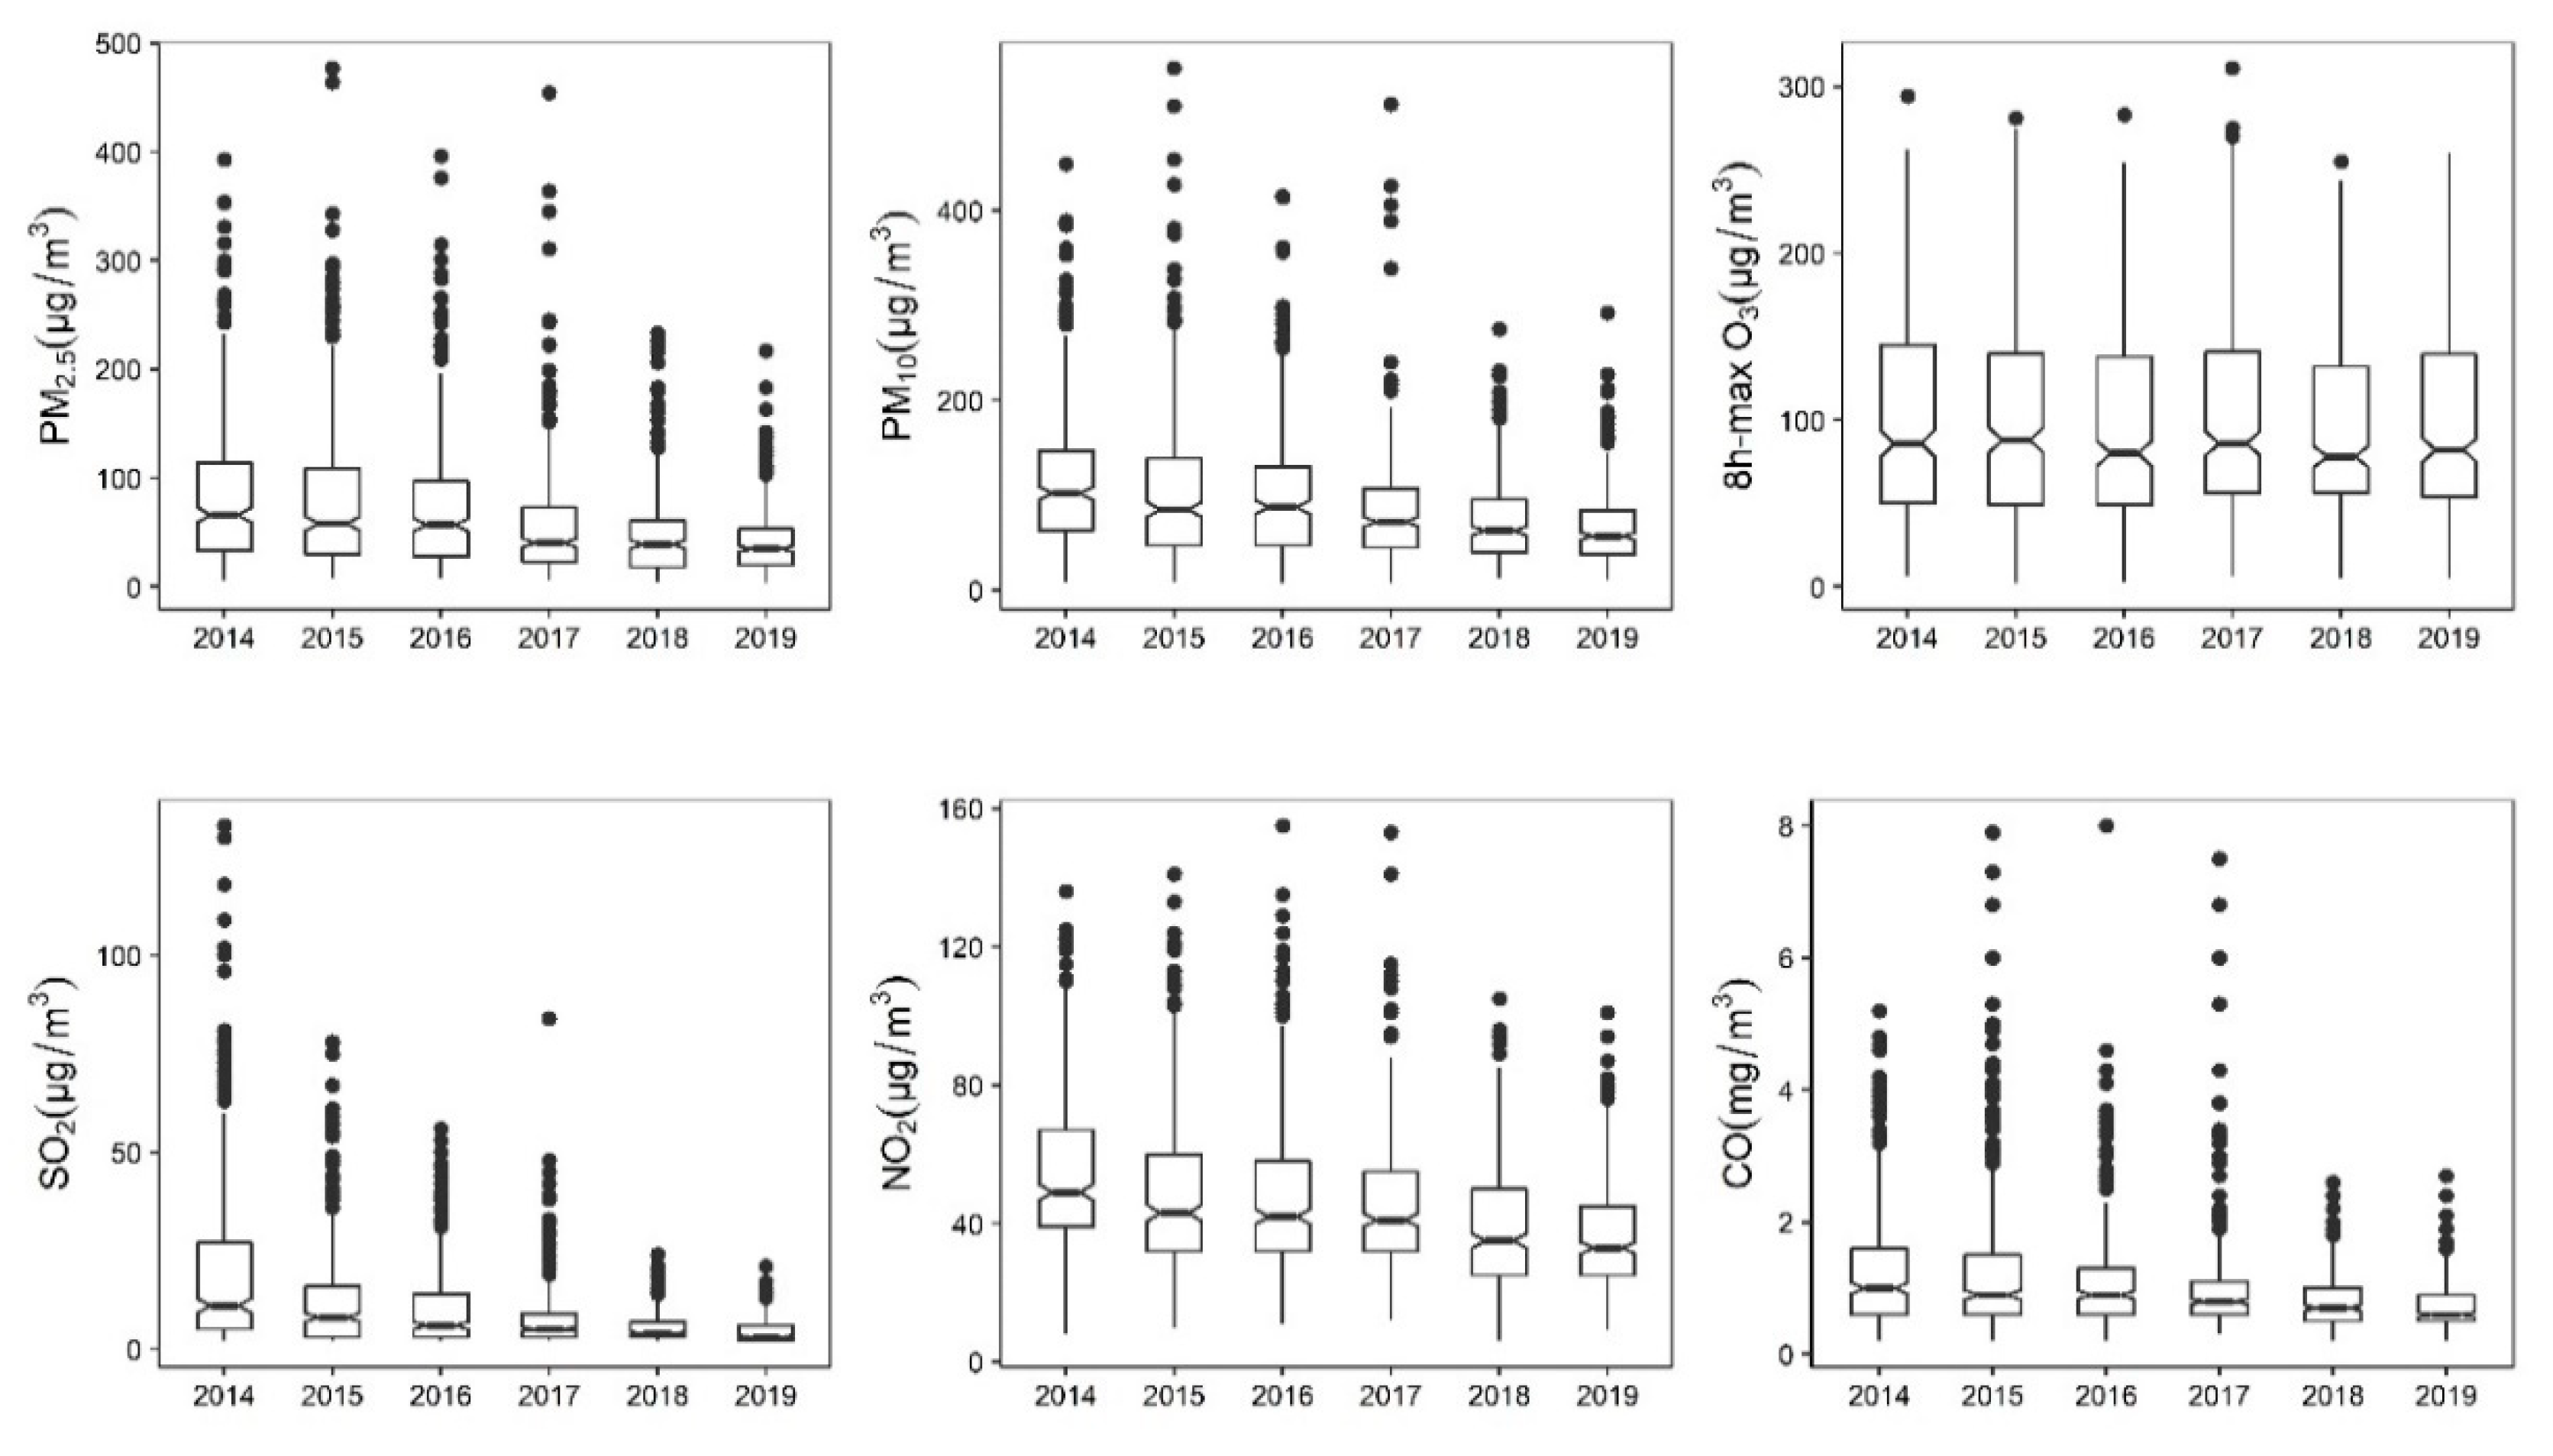
3.1. Descriptive Results

A total of 45,094 emergency room visits for skin diseases were identified in this study from 2014–2019, among which 16,891 (37.5%) were dermatitis/eczema cases, and 23,832 (52.8%) were urticaria cases (Table 1). Figure S1 presents the daily distribution of emergency room visits for total skin diseases, dermatitis/eczema and urticaria from 2014–2019.
As shown in Figure 1, remarkable decreases were observed in PM2.5, PM10, NO2, SO2 and CO, but not 8 h maximum O3 from 2014–2019. Distributions of daily concentrations of the ambient air pollutants and meteorological variables during the study period are shown in Table S1. The results of Spearman correlation analysis between air pollutants and meteorological variables are presented in Table S2.

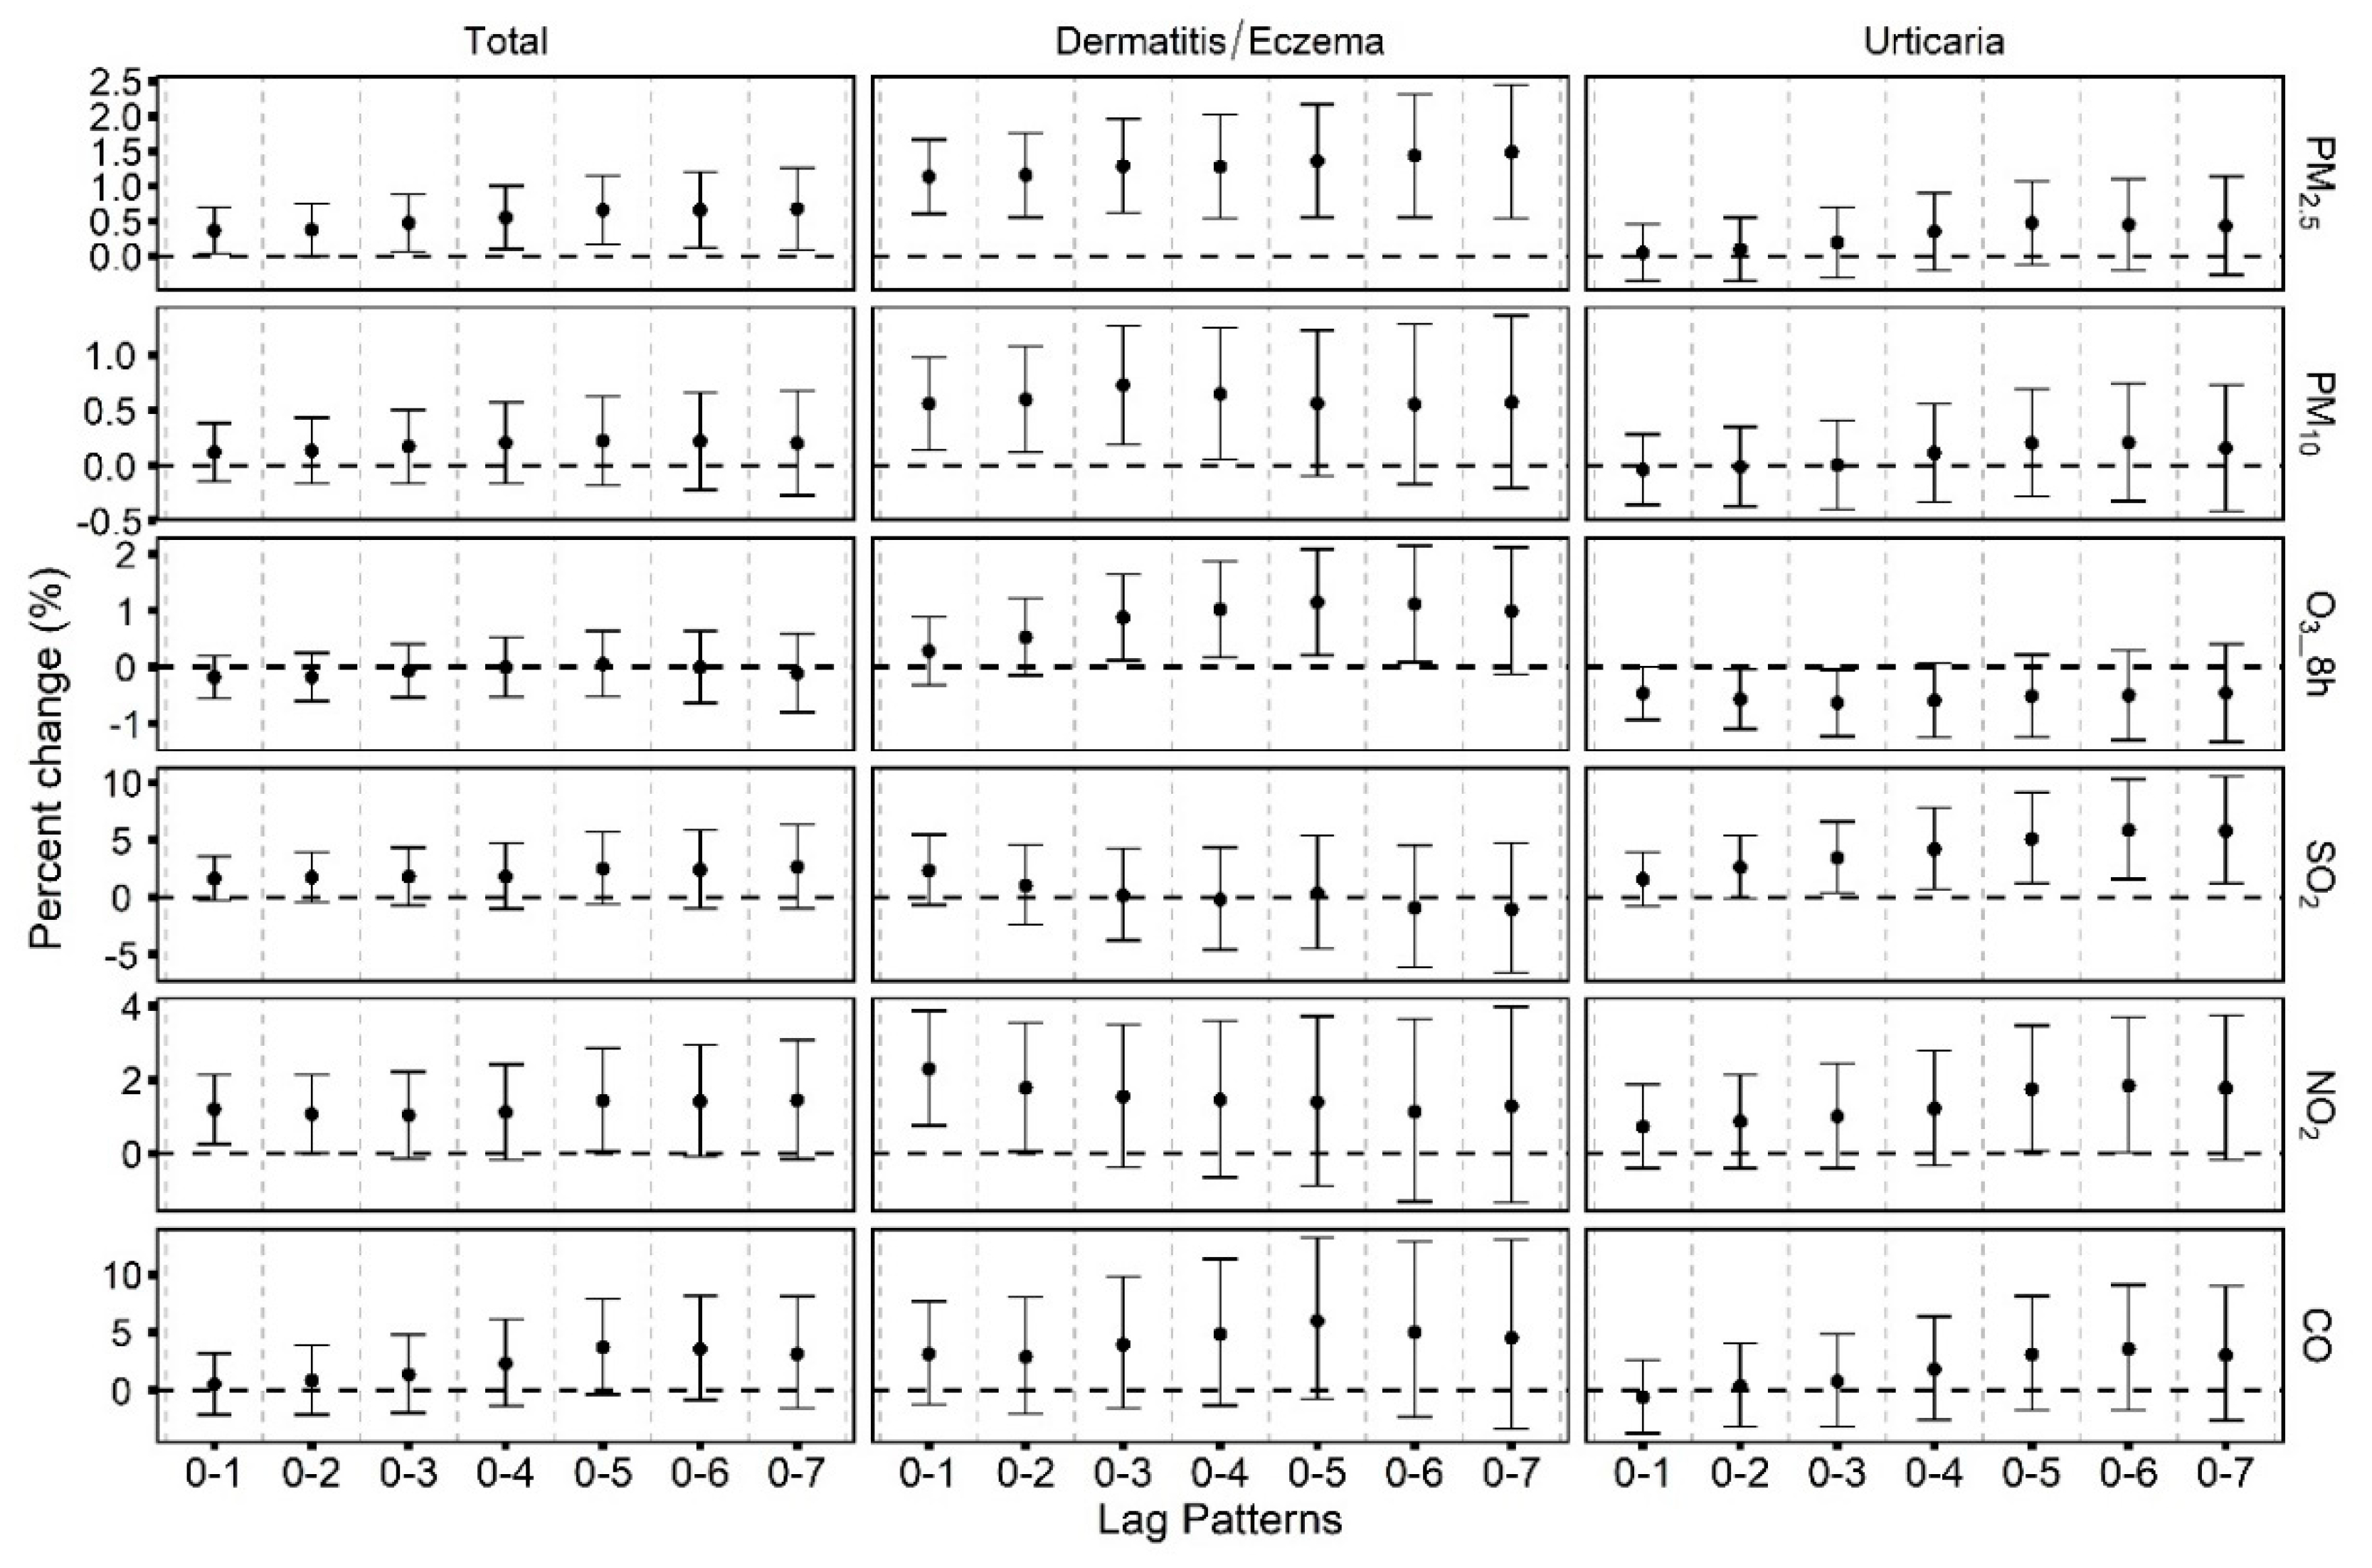
3.2. Associations between Ambient Air Pollutants and Emergency Room Visits for Skin Diseases

As shown in Figure 2, short-term PM2.5 and NO2 exposures were associated with increased emergency room visits for total skin diseases. Positive associations of PM2.5, PM10, O3 and NO2 with dermatitis/eczema, as well as SO2 and NO2 with urticaria visits were also found. For instance, a 10 μg/m3 increase in PM2.5 was associated with increases of 0.7% (95%CI: 0.2%, 1.2%) in total skin disease visits at lag 0–5 and 1.1% (95%CI: 0.6%, 1.7%) in dermatitis/eczema visits at lag 0–1. A 10 μg/m3 increase in O3 at lag 0–5 was associated with a significant increase of 1.1% (95%CI: 0.2%, 2.1%) in dermatitis/eczema visits. In addition, a 10 μg/m3 increase in NO2 was associated with a significant increase of 1.2% (95%CI: 0.3%, 2.2%) in total skin disease visits.
Figure 3 demonstrates the results of subgroup analyses stratified by age, sex and season, based on the time metric with the most significant effect estimate (with the smallest p-value) for each air pollutant. Generally, we did not find consistent differences in the effect estimates between different age, season and sex groups. The associations of SO2 and NO2 with urticaria were more significant in people aged ≥40 years compared to ≤18 years. Stronger associations were found between urticaria visits and PM2.5 and PM10 in the cold season. Meanwhile, female individuals were more susceptible to PM2.5 exposure for the urticaria visits. The results of other lag patterns (lag0–1~lag0–7) also highlighted these findings (Figures S2–S4).

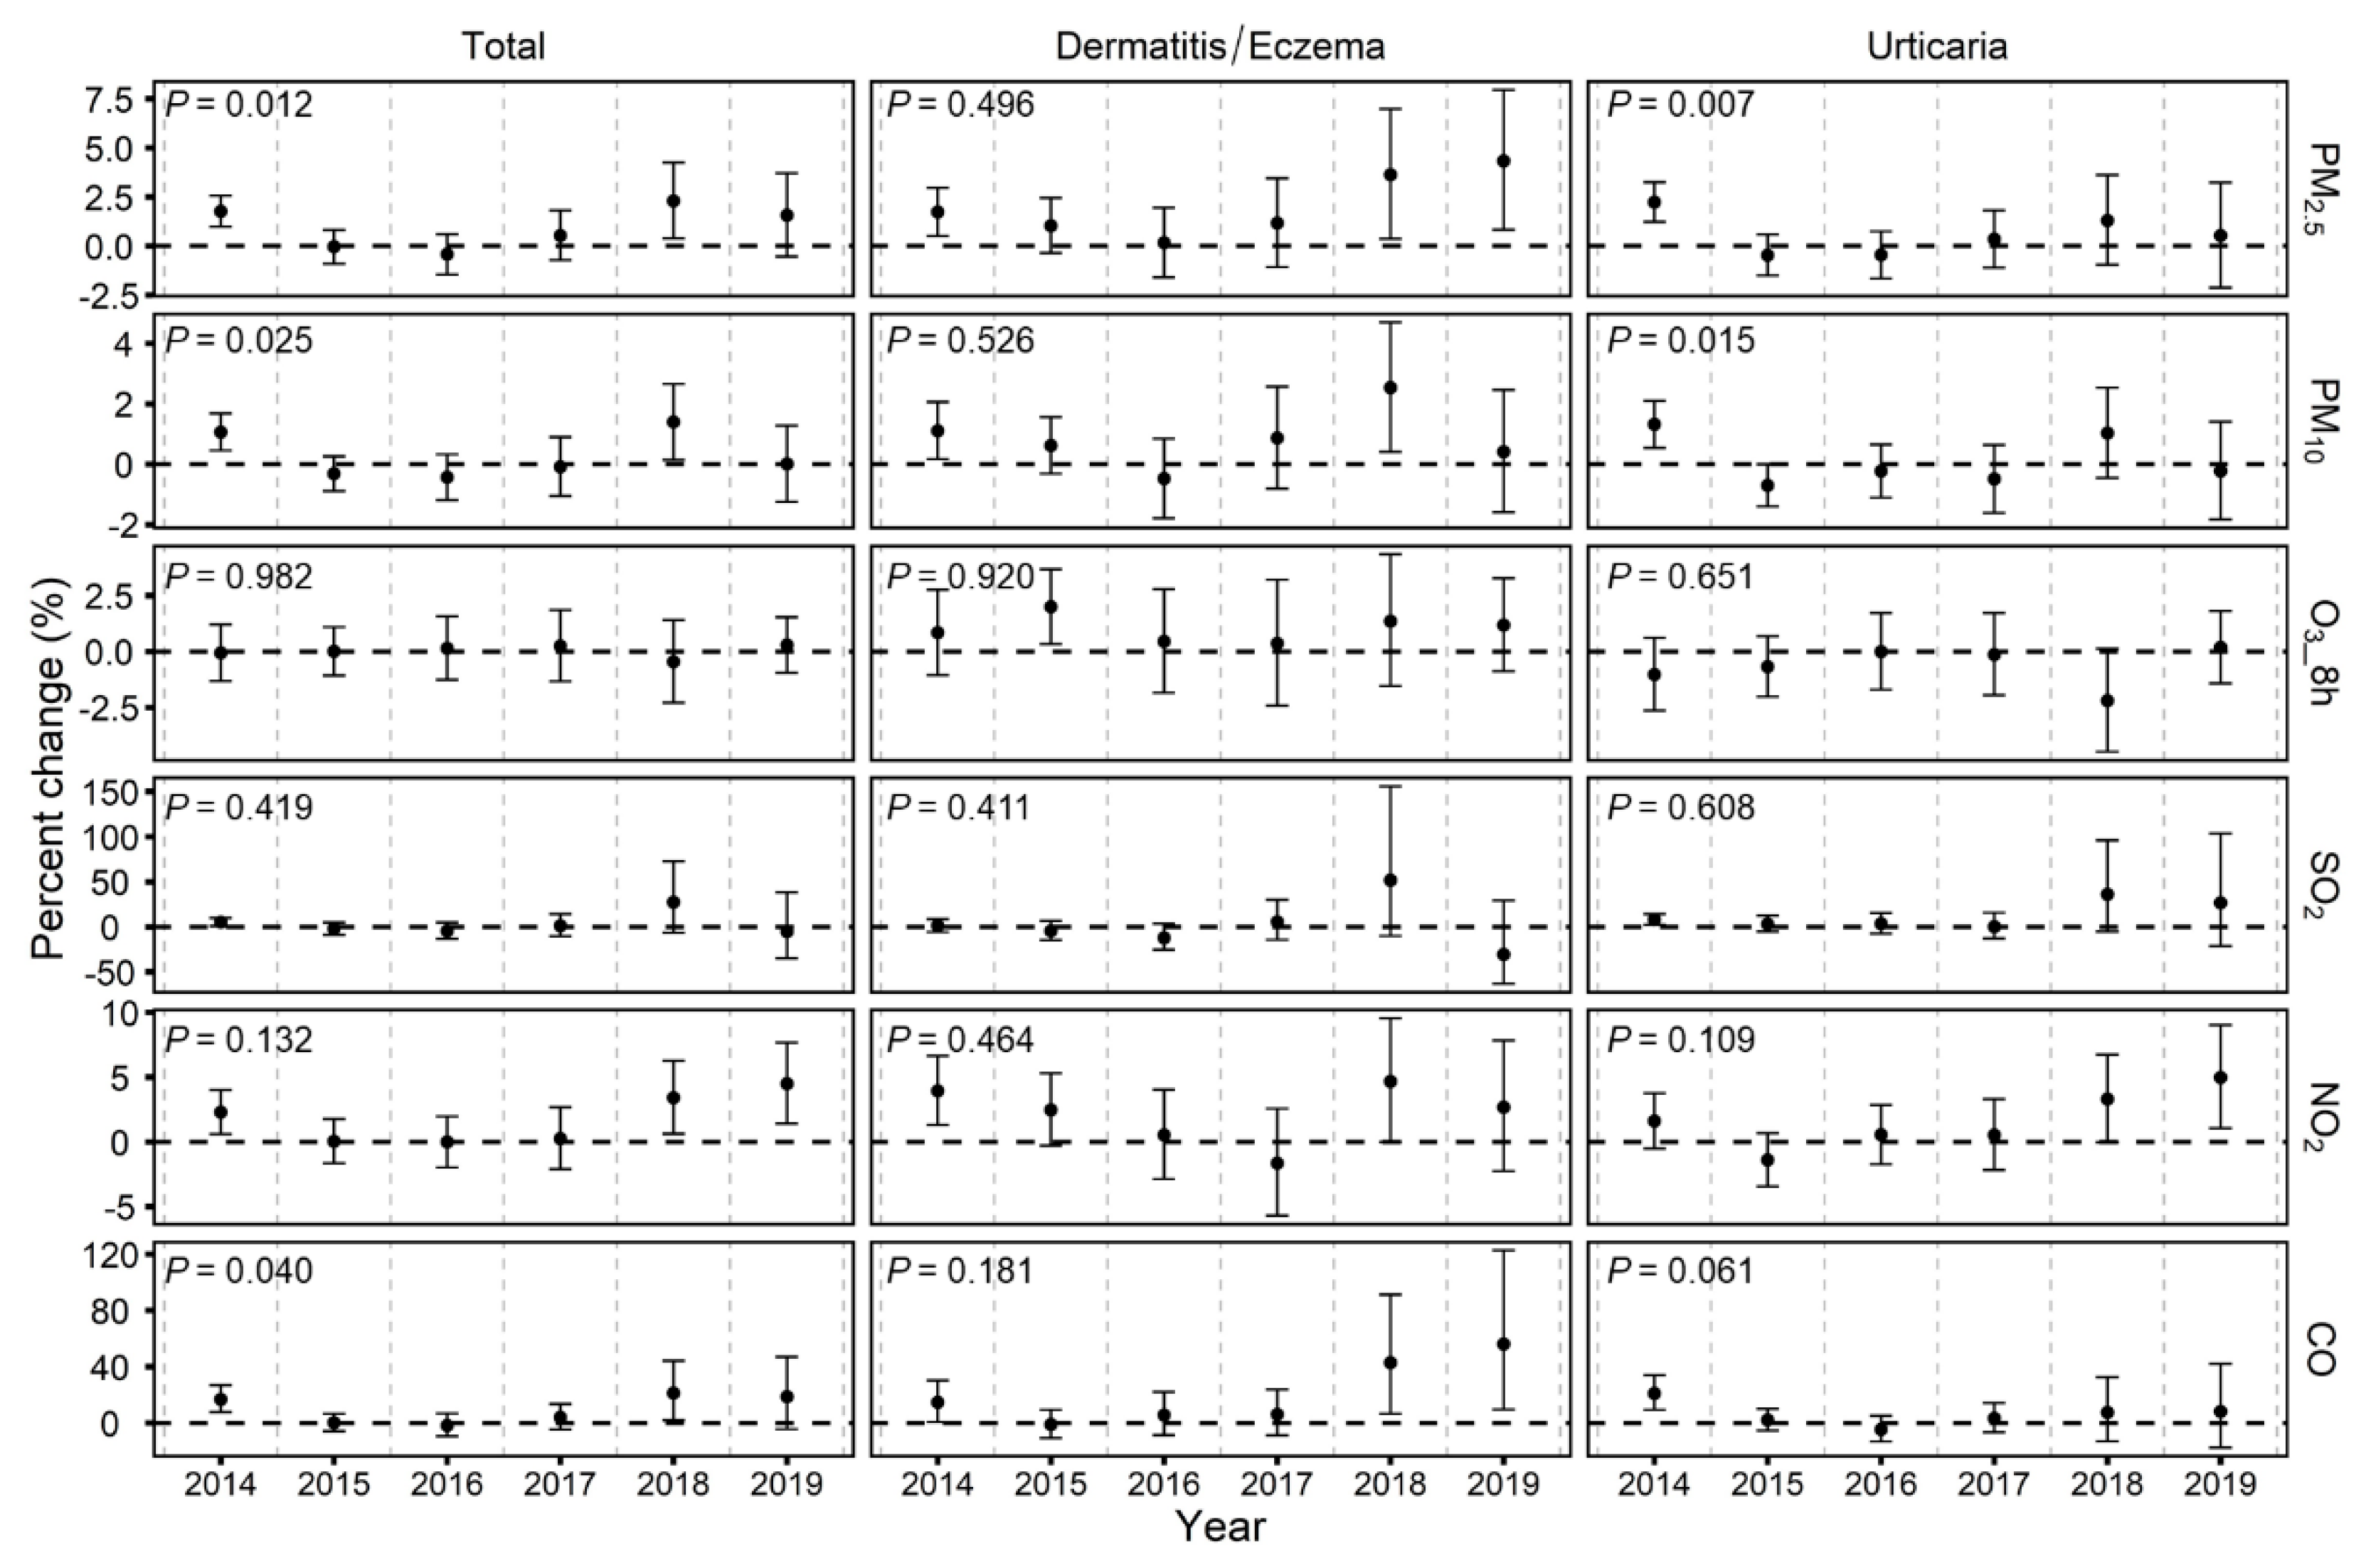
3.3. Temporal Variability of the Associations between Air Pollutants and Emergency Room Visits for Skin Diseases

As displayed in Figure 4, stronger annual associations of PM2.5, PM10 and CO with emergency room visits for total skin diseases and urticaria were typically found in the high-pollution (2014) and low-pollution (2018/2019) years, while trends for dermatitis/eczema were less consistent. There were statistically significant differences by year for associations of PM2.5 and PM10 with emergency room visits for total skin diseases and urticaria, as well as CO with total skin diseases (p for interaction term of pollutant and year <0.05). For instance, along with a 10 μg/m3 increase in PM2.5 concentration at lag 0–5, we observed a significant increase of 1.8% (95%CI: 1.0%, 2.6%) in 2014, a weaker insignificant change of 0.5% (95%CI: −0.7%, 1.8%) in 2017 and a relapsed increase of 2.3% (95%CI: 0.4%, 4.3%) in 2018 for emergency room visits for total skin diseases in the interaction models (p for interaction term of pollutant and year = 0.012). Meanwhile, we did not observe apparent changes in the associations between skin disease visits and O3 and SO2 over the study period.

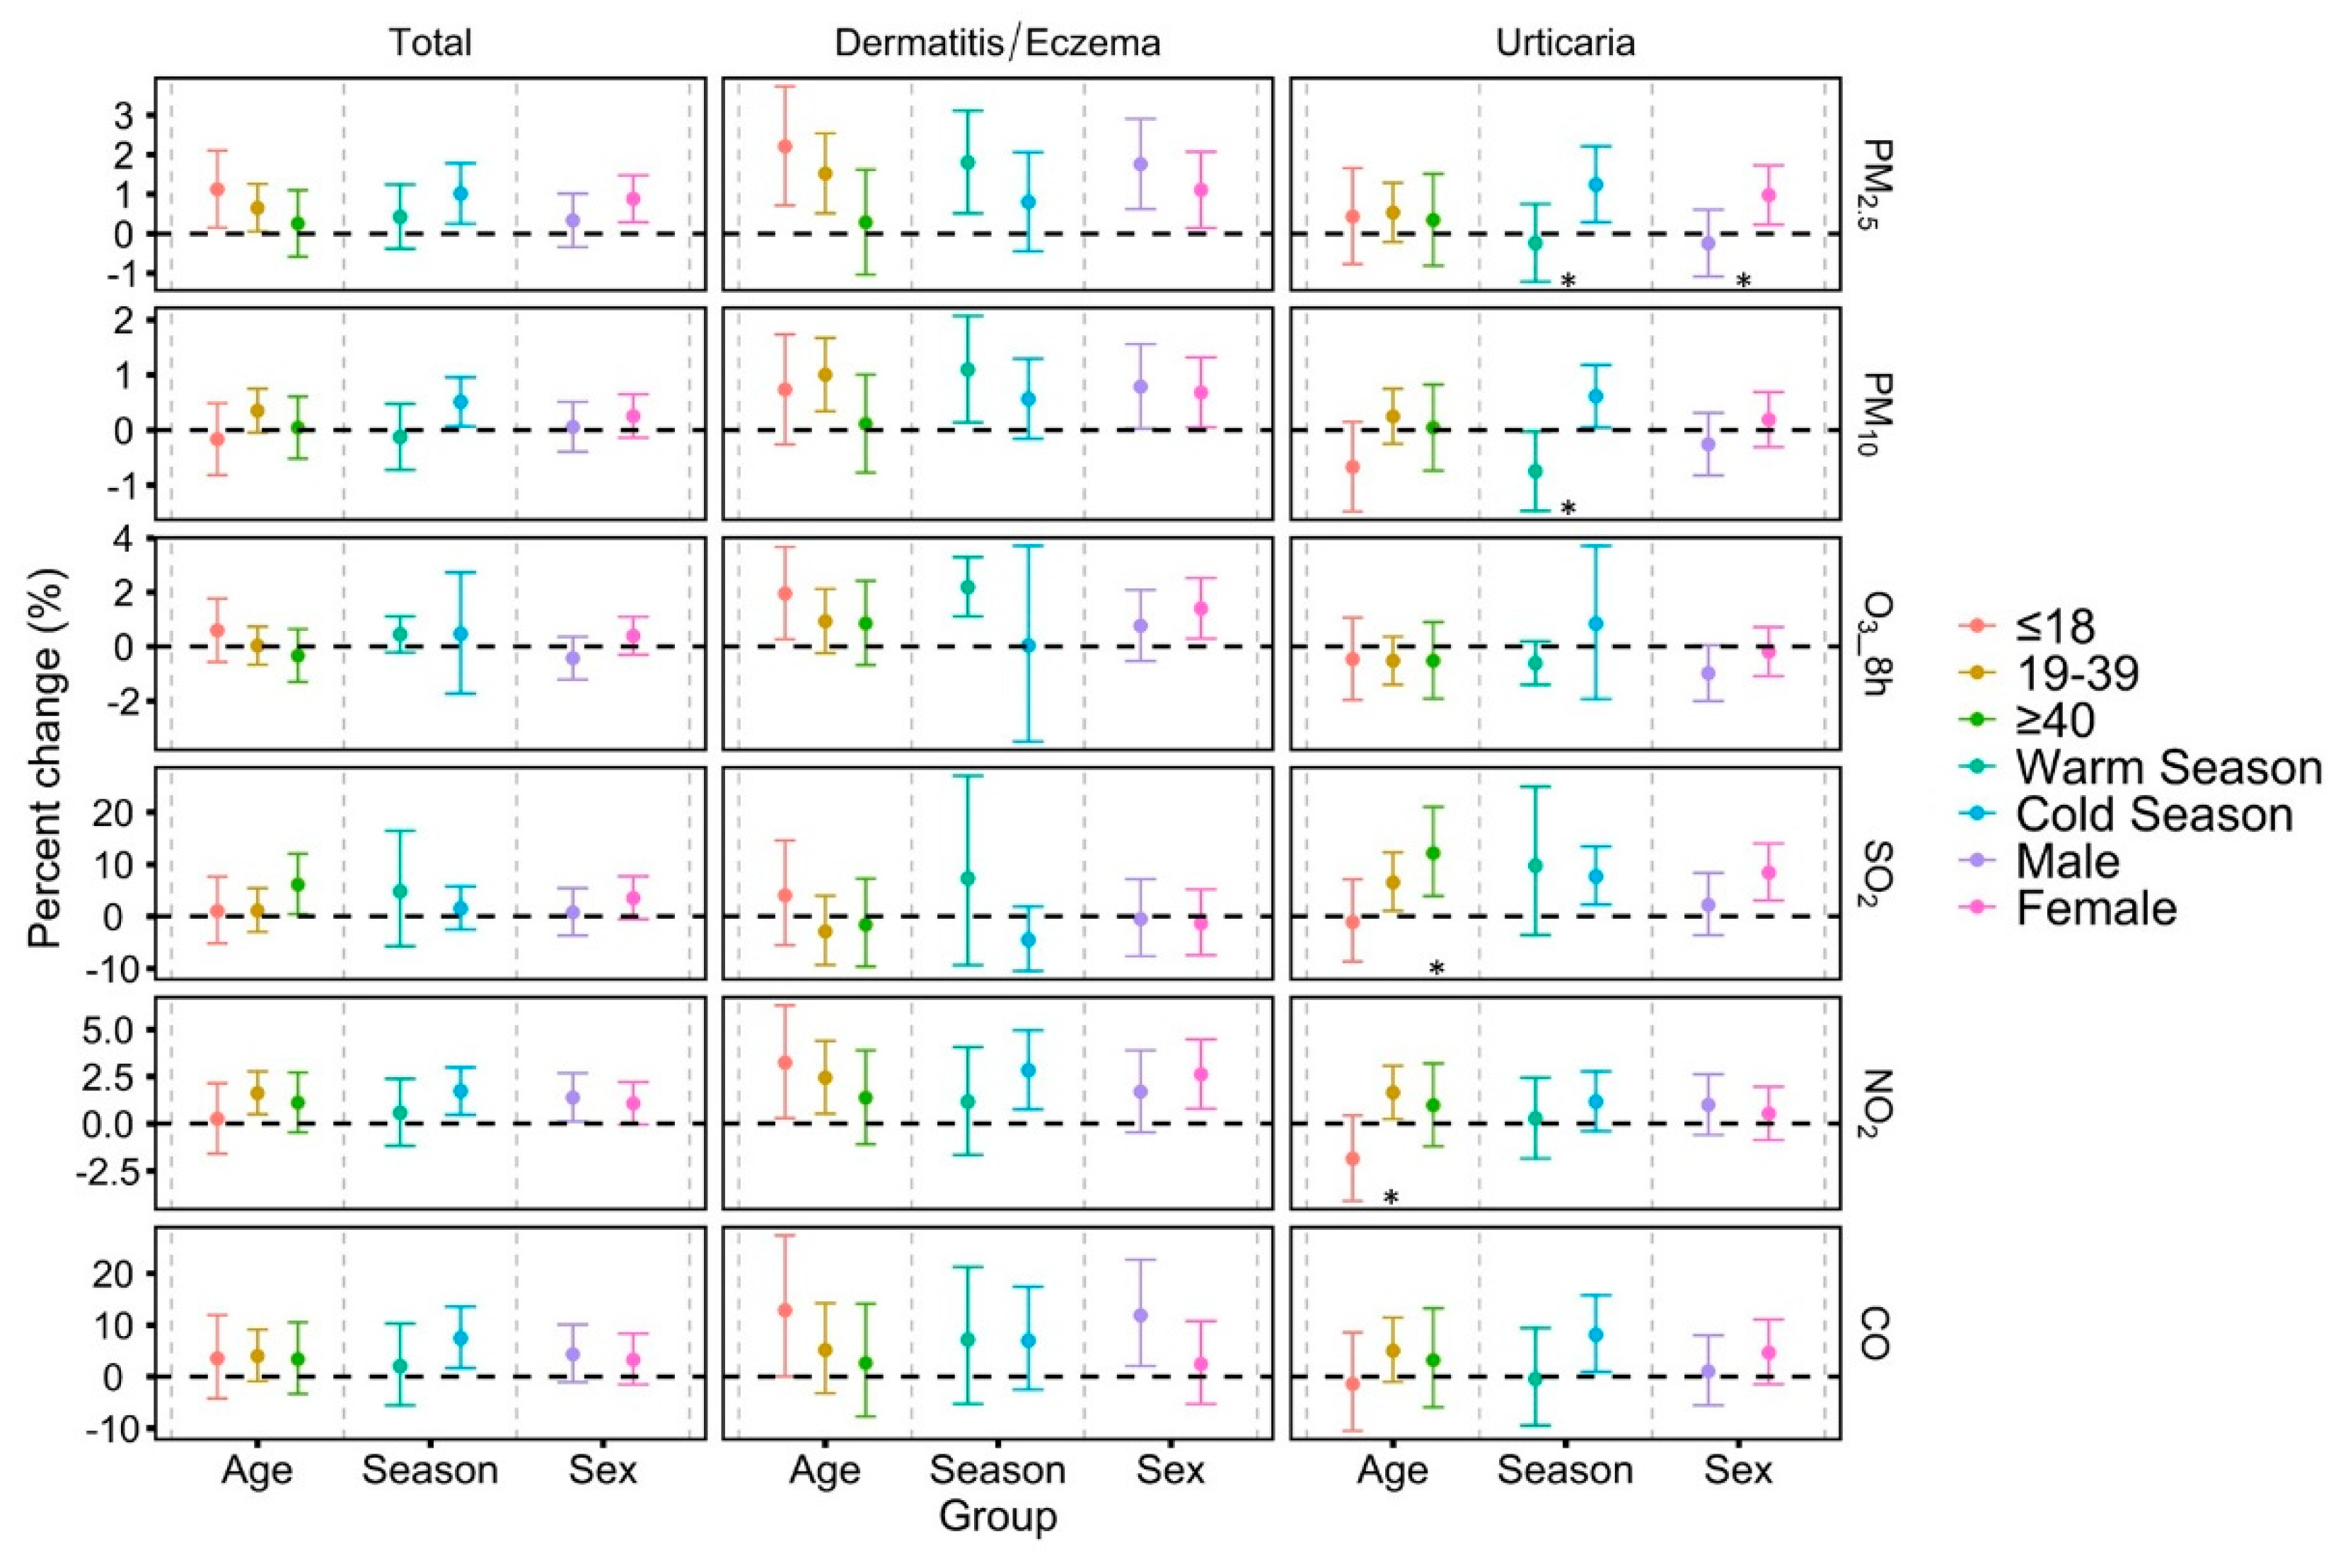
3.4. Additional Analyses

After additionally adjusting for co-pollutants and maximum lags for temperature (30 days), the associations were generally robust, although several estimates were attenuated (Tables S3 and S4). Analyses stratified by two-year periods showed a similar temporal variability feature (Figure S5). In addition, the results of exposure–response curves were generally consistent with the aforementioned findings over the whole study period (Figure S6). The comparison between main models and non-linear models showed that the main models performed better according to the minimized AIC criteria.

4. Discussion

Clarifying the potential environmental risk factors which mediate the acute onset of skin diseases is important for patient-centered prevention and control with public health relevance. To this end, this study evaluated the associations between short-term exposure to ambient air pollutants and emergency room visits for total skin diseases, dermatitis/eczema and urticaria in Beijing, China from 2014–2019. We found that short-term PM2.5 and NO2 exposures were associated with increased emergency room visits for total skin diseases. Meanwhile, positive associations of PM2.5, PM10, O3 and NO2 with dermatitis/eczema, as well as SO2 and NO2 with urticaria visits were also found. In addition, for PM2.5, PM10 and CO, stronger associations were typically observed in the high-pollution (2014) and low-pollution (2018/2019) periods.
Skin diseases have become a severe public health concern owing to the high prevalence and steadily increasing disease burden [7]. Apart from the respiratory system, the skin is one of the major target organs of ambient air pollutants [16,32]. PM is the carrier of multiple noxious constituents, including heavy metal elements and organic components, which is in direct contact with skin and might be enriched in its surface [32]. Gaseous air pollutants are not considered to exert direct effects on skin, but might readily interact with molecules in the stratum corneum [33]. The potential underlying mechanisms mediating the effects of air pollutants on skin diseases remain unclear, but metabolism, inflammatory processes and oxidative stress may play important roles [16]. For instance, short-term exposure to air pollutants within days or even hours might directly and indirectly induce inflammatory status, reactive oxygen species (ROS) level, lipid peroxidation and protein oxidation in skin, resulting in the onset or exacerbation of skin diseases [16,34]. In this study, short-term exposure to some pollutants (e.g., PM2.5 and NO2) were positively associated with emergency room visits for total skin diseases, dermatitis/eczema and urticaria. Our results were generally similar to previous findings showing that ambient air pollution exposure was positively associated with outpatient visits for dermatitis and eczema [10,11,35], as well as hospital admissions for skin diseases [22].
The subgroup analyses found stronger associations of SO2 exposure with urticaria in middle-aged people (≥40 years) compared to younger people (≤18 years). A previous study found that elderly people might be more susceptible to air pollutant–dermatitis/eczema associations [10]. However, this study did not provide stratified analyses solely for the elderly (≥65 years) due to the limited number of cases. Meanwhile, we found stronger associations of urticaria visits with PM2.5 and PM10 exposure in the cold season. This might be attributable to the PM source. In cold weather, coal combustion and traffic emissions are the major sources of PM, which might induce stronger inflammatory responses [36]. Meanwhile, it is plausible that the cold weather may potentiate the inflammation and oxidative stress when exposed to PM and result in the exacerbation of urticaria [37]. Previous studies found stronger associations between PM and outpatient visits for dermatitis and eczema in the warm season [10,11], but this study did not observe differences between the two groups. As for sex differences, we found that female individuals were more predisposed to PM2.5 exposure for urticaria visits. However, a study in Chengdu, China found stronger associations between PM exposure and hospital admission for total skin diseases in male individuals [22]. The inconsistent results above might partly be attributed to the geography and population variations across studies [38]. Meanwhile, aforementioned studies used different clinical outcomes, which could be another reason for the inconsistency. This study used emergency room visits as the outcome measure, which is more sensitive for the characterization of the acute onset of diseases due to urgent need of medical services [39].
The improvement of air quality contributes to reductions in disease burden attributable to air pollutant exposure [20], however, whether it can reduce the risks of the onset and development of diseases is still a controversial issue. A study in Rome, Italy found that the effects of air pollution on mortality were generally unchanged over the last two decades [28]. Similar findings were also reported by studies in Switzerland [40] and Canada [41]. However, decreasing exposure–health associations were found with a background of air quality improvement in Germany [42], the U.S. [43] and Korea [44], and an opposite trend was found in Canada [29].
Since the implementation of APPCAP in 2013, the government of China have initiated a series of air pollution control measures. Consequently, key regions like Beijing showed remarkable decreases of 10~50% in major air pollutants except for O3, as shown in our results and previous studies [17,18]. However, no previous studies have examined its effects on the association between air pollution exposure and skin diseases over recent years in China. In this study, we did not observe consistent temporal variability of this association over the whole study period (2014–2019). Interestingly, we found stronger annual associations of some pollutants (e.g., PM2.5 and PM10) with emergency room visits for total skin diseases and urticaria in the high-pollution (2014) and low-pollution (2018/2019) periods, although the pollutant concentrations were continuously declining over this period. We speculated that this might be partly attributed to changes in pollution sources and components [36]. Due to the implementation of air pollution prevention and control strategies in Beijing, the emissions from fossil fuel combustion (e.g., coal combustion) are considerably decreased, while vehicle emissions account for greater proportion over time [18,45]. Accordingly, the components change with the restructuring of pollution sources [46,47], and thus the exposure–health association might not decrease along with the declining concentrations of air pollutants [28,48,49]. In addition, the changes of demographic distribution and population susceptibility might also be reasons for the findings [28,41].
A strength of the present study is that we provide evidence of the air pollutant–skin disease associations with the background of constantly improving air quality due to the implementation of a series of air pollution prevention and control measures in China. To date, relevant studies are still limited, especially studies in developing countries over a relatively long period. Second, we used emergency room visit data as the outcome measure, which might more sensitively capture the acute effects of air pollutants.
Several limitations of this study should be noted. First, this study is a time-series ecological study, and thus the results should be interpreted cautiously, for association does not imply causation. Meanwhile, using environmental monitoring data as a proxy for individual exposure might include exposure measurement errors. In addition, skin diseases might be attributable to other confounding factors such as health status, allergen exposure or diet and nutrition [50]. However, these factors were not evaluated due to the limitation of the time-series design and data availability. Second, the study cases were derived from one general hospital in Beijing, thus the findings still need further verification at a larger population scale. Third, the skin diseases covered a wide range of specific diseases. The positive associations of air pollutants with total skin diseases do not necessarily mean that a variety of skin diseases might be attributable to air pollution exposure. Fourth, this study did not examine the association between PM components and skin diseases owing to the lack of data on PM components, and further studies are needed to test our hypothesis. Lastly, we used multiple testing to evaluate the associations of air pollution with skin diseases, which might lead to potential false positive results.

5. Conclusions

We found that short-term exposures to certain air pollutants (e.g., PM2.5 and NO2) were associated with increased emergency room visits for skin diseases such as dermatitis/eczema and urticaria. Meanwhile, some of the associations were found both in the high-pollution (2014) and low-pollution (2018/2019) periods. Our study emphasizes the necessity of controlling the potential health hazard of air pollutants on skin, although significant achievements in air quality control have been made in China. Further evidence on the associations of sources and components of air pollution with skin diseases is still needed, in order to establish guided environmental health policies at the population level.

Supplementary Materials

The following are available online at https://0-www-mdpi-com.brum.beds.ac.uk/article/10.3390/toxics9050108/s1, Table S1: Summary statistics of daily ambient air pollutants and meteorological variables in Beijing during the study period (2014–2019). Table S2: Spearman correlation coefficients among the ambient air pollutants and meteorological variables in Beijing during the study period (2014–2019). Table S3: Associations between ambient air pollutants and daily emergency room visits for skin diseases in two-pollutant models. Table S4: Associations between ambient air pollutants and daily emergency room visits for skin diseases in sensitive analyses in single-pollutant models. Figure S1: Daily emergency room visits for skin diseases during the study period (2014–2019). Figure S2: Percent changes and 95% confidence intervals (CIs) in daily emergency room visits for skin diseases per 10 μg/m3 increases in PM2.5, PM10, 8 h maximum O3, SO2, NO2 and 1 mg/m3 increase in CO with different time metrics from 2014–2019, stratified by age. Figure S3: Percent changes and 95% confidence intervals (CIs) in daily emergency room visits for skin diseases per 10 μg/m3 increases in PM2.5, PM10, 8 h maximum O3, SO2, NO2 and 1 mg/m3 increase in CO with different time metrics from 2014–2019, stratified by season. Figure S4: Percent changes and 95% confidence intervals (CIs) in daily emergency room visits for skin diseases per 10 μg/m3 increases in PM2.5, PM10, 8 h maximum O3, SO2, NO2 and 1 mg/m3 increase in CO with different time metrics from 2014–2019, stratified by sex. Figure S5: Percent changes and 95% confidence intervals (CIs) in daily emergency room visits for skin diseases along with a 10 μg/m3 increases in PM2.5 (lag 0–5), PM10 (lag 0–3), 8 h maximum O3 (lag 0–5), SO2 (lag 0–6), NO2 (lag 0–1) and a 1 mg/m3 increase in CO (lag 0–5) from 2014–2015, 2016–2017 and 2018–2019. Figure S6: The exposure–response curve for the association between ambient air pollutant concentrations and risk for emergency room visits for skin diseases during the study period (2014–2019).

Author Contributions

Conceptualization, F.D. and Q.M.; Methodology, W.Z. and W.W.; Software, W.W. and W.Z.; Validation, J.Z.; Formal Analysis, W.Z. and W.W.; Data Curation, H.L. and J.W.; Writing—Original Draft Preparation, W.W. and W.Z.; Writing—Review and Editing, F.D., Q.M. and X.G.; Supervision, F.D. and Q.M.; Project Administration, F.D.; Funding Acquisition, F.D. All authors have read and agreed to the published version of the manuscript.

Funding

The study was funded by the National Natural Science Foundation of China, grant number 22076006, 82073506 and the Ministry of Ecology and Environment: the research of national-level ecological and environmental planning, grant number 14430019.

Institutional Review Board Statement

Not applicable.

Informed Consent Statement

Not applicable.

Data Availability Statement

The datasets generated and analyzed during the current study are not publicly available due to protection of patient privacy, but are available from the corresponding author on reasonable request.

Conflicts of Interest

The authors declare no conflict of interest.

References

  1. Lelieveld, J.; Evans, J.S.; Fnais, M.; Giannadaki, D.; Pozzer, A. The contribution of outdoor air pollution sources to premature mortality on a global scale. Nature 2015, 525, 367–371. [Google Scholar] [CrossRef] [PubMed]
  2. GBD 2019 Risk Factors Collaborators. Global burden of 87 risk factors in 204 countries and territories, 1990-2019: A systematic analysis for the Global Burden of Disease Study 2019. Lancet 2020, 396, 1223–1249. [Google Scholar] [CrossRef]
  3. Liu, C.; Chen, R.; Sera, F.; Vicedo-Cabrera, A.M.; Guo, Y.; Tong, S.; Coelho, M.; Saldiva, P.H.N.; Lavigne, E.; Matus, P.; et al. Ambient Particulate Air Pollution and Daily Mortality in 652 Cities. N. Engl. J. Med. 2019, 381, 705–715. [Google Scholar] [CrossRef] [PubMed]
  4. Guarnieri, M.; Balmes, J.R. Outdoor air pollution and asthma. Lancet 2014, 383, 1581–1592. [Google Scholar] [CrossRef] [Green Version]
  5. Hay, R.J.; Johns, N.E.; Williams, H.C.; Bolliger, I.W.; Dellavalle, R.P.; Margolis, D.J.; Marks, R.; Naldi, L.; Weinstock, M.A.; Wulf, S.K.; et al. The global burden of skin disease in 2010: An analysis of the prevalence and impact of skin conditions. J. Investig. Dermatol. 2014, 134, 1527–1534. [Google Scholar] [CrossRef] [PubMed] [Green Version]
  6. Vos, T.; Lim, S.S.; Abbafati, C.; Abbas, K.M.; Abbasi, M.; Abbasifard, M.; Abbasi-Kangevari, M.; Abbastabar, H.; Abd-Allah, F.; Abdelalim, A.; et al. Global burden of 369 diseases and injuries in 204 countries and territories, 1990-2019: A systematic analysis for the Global Burden of Disease Study 2019. Lancet 2020, 396, 1204–1222. [Google Scholar] [CrossRef]
  7. James, S.L.; Abate, D.; Abate, K.H.; Abay, S.M.; Abbafati, C.; Abbasi, N.; Abbastabar, H.; Abd-Allah, F.; Abdela, J.; Abdelalim, A.; et al. GBD 2017 Disease and Injury Incidence and Prevalence Collaborators. Global, regional, and national incidence, prevalence, and years lived with disability for 354 diseases and injuries for 195 countries and territories, 1990–2017: A systematic analysis for the Global Burden of Disease Study 2017. Lancet 2018, 392, 1789–1858. [Google Scholar] [CrossRef] [Green Version]
  8. Ahn, K. The role of air pollutants in atopic dermatitis. J. Allergy Clin. Immunol. 2014, 134, 993–999. [Google Scholar] [CrossRef]
  9. Nguyen, G.H.; Andersen, L.K.; Davis, M.D.P. Climate change and atopic dermatitis: Is there a link? Int. J. Dermatol. 2019, 58, 279–282. [Google Scholar] [CrossRef]
  10. Guo, Q.; Liang, F.; Tian, L.; Schikowski, T.; Liu, W.; Pan, X. Ambient air pollution and the hospital outpatient visits for eczema and dermatitis in Beijing: A time-stratified case-crossover analysis. Environ. Sci. Process. Impacts 2019, 21, 163–173. [Google Scholar] [CrossRef]
  11. Li, Q.; Yang, Y.; Chen, R.; Kan, H.; Song, W.; Tan, J.; Xu, F.; Xu, J. Ambient Air Pollution, Meteorological Factors and Outpatient Visits for Eczema in Shanghai, China: A Time-Series Analysis. Int. J. Environ. Res. Public Health 2016, 13, 1106. [Google Scholar] [CrossRef] [PubMed]
  12. Patella, V.; Florio, G.; Palmieri, M.; Bousquet, J.; Tonacci, A.; Giuliano, A.; Gangemi, S. Atopic dermatitis severity during exposure to air pollutants and weather changes with an Artificial Neural Network (ANN) analysis. Pediatr. Allergy Immunol. 2020, 31, 938–945. [Google Scholar] [CrossRef] [PubMed]
  13. Tang, K.T.; Ku, K.C.; Chen, D.Y.; Lin, C.H.; Tsuang, B.J.; Chen, Y.H. Adult atopic dermatitis and exposure to air pollutants—A nationwide population-based study. Ann. Allergy Asthma Immunol 2017, 118, 351–355. [Google Scholar] [CrossRef] [PubMed]
  14. Zhou, C.; Baïz, N.; Banerjee, S.; Charpin, D.A.; Caillaud, D.; de Blay, F.; Raherison, C.; Lavaud, F.; Annesi-Maesano, I. The relationships between ambient air pollutants and childhood asthma and eczema are modified by emotion and conduct problems. Ann. Epidemiol. 2013, 23, 778–783. [Google Scholar] [CrossRef] [PubMed]
  15. Liu, W.; Pan, X.; Vierkötter, A.; Guo, Q.; Wang, X.; Wang, Q.; Seité, S.; Moyal, D.; Schikowski, T.; Krutmann, J. A Time-Series Study of the Effect of Air Pollution on Outpatient Visits for Acne Vulgaris in Beijing. Skin Pharmacol. Physiol. 2018, 31, 107–113. [Google Scholar] [CrossRef] [PubMed]
  16. Araviiskaia, E.; Berardesca, E.; Bieber, T.; Gontijo, G.; Viera, M.S.; Marrot, L.; Chuberre, B.; Dreno, B. The impact of airborne pollution on skin. J. Eur. Acad. Dermatol. Venereol. 2019, 33, 1496–1505. [Google Scholar] [CrossRef] [PubMed]
  17. Zhang, N.N.; Ma, F.; Qin, C.B.; Li, Y.F. Spatiotemporal trends in PM2.5 levels from 2013 to 2017 and regional demarcations for joint prevention and control of atmospheric pollution in China. Chemosphere 2018, 210, 1176–1184. [Google Scholar] [CrossRef]
  18. Cai, S.; Wang, Y.; Zhao, B.; Wang, S.; Chang, X.; Hao, J. The impact of the “Air Pollution Prevention and Control Action Plan” on PM2.5 concentrations in Jing-Jin-Ji region during 2012–2020. Sci. Total Environ. 2017, 580, 197–209. [Google Scholar] [CrossRef]
  19. Maji, K.J.; Li, V.O.; Lam, J.C. Effects of China’s current Air Pollution Prevention and Control Action Plan on air pollution patterns, health risks and mortalities in Beijing 2014–2018. Chemosphere 2020, 260, 127572. [Google Scholar] [CrossRef]
  20. Huang, J.; Pan, X.; Guo, X.; Li, G. Health impact of China’s Air Pollution Prevention and Control Action Plan: An analysis of national air quality monitoring and mortality data. Lancet Planet. Health 2018, 2, e313–e323. [Google Scholar] [CrossRef] [Green Version]
  21. Baghestani, S.; Zare, S.; Mahboobi, A.A. Skin disease patterns in Hormozgan, Iran. Int. J. Dermatol. 2005, 44, 641–645. [Google Scholar] [CrossRef] [PubMed]
  22. Zhu, X.; Qiu, H.; Wang, L.; Duan, Z.; Yu, H.; Deng, R.; Zhang, Y.; Zhou, L. Risks of hospital admissions from a spectrum of causes associated with particulate matter pollution. Sci. Total Environ. 2019, 656, 90–100. [Google Scholar] [CrossRef] [PubMed]
  23. Shah, A.S.; Lee, K.K.; McAllister, D.A.; Hunter, A.; Nair, H.; Whiteley, W.; Langrish, J.P.; Newby, D.E.; Mills, N.L. Short term exposure to air pollution and stroke: Systematic review and meta-analysis. BMJ 2015, 350, h1295. [Google Scholar] [CrossRef] [Green Version]
  24. Tian, Y.; Liu, H.; Zhao, Z.; Xiang, X.; Li, M.; Juan, J.; Song, J.; Cao, Y.; Wang, X.; Chen, L.; et al. Association between ambient air pollution and daily hospital admissions for ischemic stroke: A nationwide time-series analysis. PLoS Med. 2018, 15, e1002668. [Google Scholar] [CrossRef] [PubMed] [Green Version]
  25. Gasparrini, A.; Guo, Y.; Hashizume, M.; Lavigne, E.; Zanobetti, A.; Schwartz, J.; Tobias, A.; Tong, S.; Rocklöv, J.; Forsberg, B.; et al. Mortality risk attributable to high and low ambient temperature: A multicountry observational study. Lancet 2015, 386, 369–375. [Google Scholar] [CrossRef]
  26. Shi, W.; Sun, Q.; Du, P.; Tang, S.; Chen, C.; Sun, Z.; Wang, J.; Li, T.; Shi, X. Modification Effects of Temperature on the Ozone-Mortality Relationship: A Nationwide Multicounty Study in China. Environ. Sci. Technol. 2020, 54, 2859–2868. [Google Scholar] [CrossRef]
  27. Gu, X.; Guo, T.; Si, Y.; Wang, J.; Zhang, W.; Deng, F.; Chen, L.; Wei, C.; Lin, S.; Guo, X.; et al. Association Between Ambient Air Pollution and Daily Hospital Admissions for Depression in 75 Chinese Cities. Am. J. Psychiatry 2020, 177, 735–743. [Google Scholar] [CrossRef]
  28. Renzi, M.; Stafoggia, M.; Faustini, A.; Cesaroni, G.; Cattani, G.; Forastiere, F. Analysis of Temporal Variability in the Short-term Effects of Ambient Air Pollutants on Nonaccidental Mortality in Rome, Italy (1998–2014). Environ. Health Perspect. 2017, 125, 067019. [Google Scholar] [CrossRef] [Green Version]
  29. Shin, H.H.; Stieb, D.M.; Jessiman, B.; Goldberg, M.S.; Brion, O.; Brook, J.; Ramsay, T.; Burnett, R.T. A temporal, multicity model to estimate the effects of short-term exposure to ambient air pollution on health. Environ. Health Perspect. 2008, 116, 1147–1153. [Google Scholar] [CrossRef] [Green Version]
  30. Liu, S.; Zhang, K. Fine particulate matter components and mortality in Greater Houston: Did the risk reduce from 2000 to 2011? Sci. Total Environ. 2015, 538, 162–168. [Google Scholar] [CrossRef]
  31. Liang, L.; Cai, Y.; Barratt, B.; Lyu, B.; Chan, Q.; Hansell, A.L.; Xie, W.; Zhang, D.; Kelly, F.J.; Tong, Z. Associations between daily air quality and hospitalisations for acute exacerbation of chronic obstructive pulmonary disease in Beijing, 2013-17: An ecological analysis. Lancet Planet. Health 2019, 3, e270–e279. [Google Scholar] [CrossRef] [Green Version]
  32. Morgan, J.L.L.; Shauchuk, A.; Meyers, J.L.; Altemeier, A.; Qiao, X.; Jones, M.; Smith, E.D.; Jiang, J. Quantifying the Deposition of Airborne Particulate Matter Pollution on Skin Using Elemental Markers. Environ. Sci. Technol. 2020, 54, 15958–15967. [Google Scholar] [CrossRef] [PubMed]
  33. Krutmann, J.; Liu, W.; Li, L.; Pan, X.; Crawford, M.; Sore, G.; Seite, S. Pollution and skin: From epidemiological and mechanistic studies to clinical implications. J. Dermatol. Sci. 2014, 76, 163–168. [Google Scholar] [CrossRef] [PubMed]
  34. Dong, Y.M.; Liao, L.Y.; Li, L.; Yi, F.; Meng, H.; He, Y.F.; Guo, M.M. Skin inflammation induced by ambient particulate matter in China. Sci. Total Environ. 2019, 682, 364–373. [Google Scholar] [CrossRef] [PubMed]
  35. Karagün, E.; Yıldız, P.; Cangür, Ş. Effects of climate and air pollution factors on outpatient visits for eczema: A time series analysis. Arch. Dermatol. Res. 2020, 313, 49–55. [Google Scholar] [CrossRef]
  36. Chi, R.; Li, H.; Wang, Q.; Zhai, Q.; Wang, D.; Wu, M.; Liu, Q.; Wu, S.; Ma, Q.; Deng, F.; et al. Association of emergency room visits for respiratory diseases with sources of ambient PM2.5. J. Environ. Sci. 2019, 86, 154–163. [Google Scholar] [CrossRef]
  37. Kousha, T.; Valacchi, G. The Air Quality Health Index and Emergency Department Visits for Urticaria in Windsor, Canada. J. Toxicol. Environ. Health Part A 2015, 78, 524–533. [Google Scholar] [CrossRef] [PubMed]
  38. Shah, A.S.; Langrish, J.P.; Nair, H.; McAllister, D.A.; Hunter, A.L.; Donaldson, K.; Newby, D.E.; Mills, N.L. Global association of air pollution and heart failure: A systematic review and meta-analysis. Lancet 2013, 382, 1039–1048. [Google Scholar] [CrossRef] [Green Version]
  39. Taj, T.; Malmqvist, E.; Stroh, E.; Åström, D.O.; Jakobsson, K.; Oudin, A. Short-Term Associations between Air Pollution Concentrations and Respiratory Health-Comparing Primary Health Care Visits, Hospital Admissions, and Emergency Department Visits in a Multi-Municipality Study. Int. J. Environ. Res. Public Health 2017, 14, 587. [Google Scholar] [CrossRef] [Green Version]
  40. Perez, L.; Grize, L.; Infanger, D.; Künzli, N.; Sommer, H.; Alt, G.M.; Schindler, C. Associations of daily levels of PM10 and NO2 with emergency hospital admissions and mortality in Switzerland: Trends and missed prevention potential over the last decade. Environ. Res. 2015, 140, 554–561. [Google Scholar] [CrossRef]
  41. Shin, H.H.; Parajuli, R.P.; Maquiling, A.; Smith-Doiron, M. Temporal trends in associations between ozone and circulatory mortality in age and sex in Canada during 1984–2012. Sci. Total Environ. 2020, 724, 137944. [Google Scholar] [CrossRef] [PubMed]
  42. Breitner, S.; Stölzel, M.; Cyrys, J.; Pitz, M.; Wölke, G.; Kreyling, W.; Küchenhoff, H.; Heinrich, J.; Wichmann, H.E.; Peters, A. Short-term mortality rates during a decade of improved air quality in Erfurt, Germany. Environ. Health Perspect. 2009, 117, 448–454. [Google Scholar] [CrossRef]
  43. Dominici, F.; Peng, R.D.; Zeger, S.L.; White, R.H.; Samet, J.M. Particulate air pollution and mortality in the United States: Did the risks change from 1987 to 2000? Am. J. Epidemiol. 2007, 166, 880–888. [Google Scholar] [CrossRef] [PubMed]
  44. Choi, Y.; Kim, H.; Lee, J.T. Temporal variability of short term effects of PM10 on mortality in Seoul, Korea. Sci. Total Environ. 2018, 644, 122–128. [Google Scholar] [CrossRef] [PubMed]
  45. Zhu, Y.; Huang, L.; Li, J.; Ying, Q.; Zhang, H.; Liu, X.; Liao, H.; Li, N.; Liu, Z.; Mao, Y.; et al. Sources of particulate matter in China: Insights from source apportionment studies published in 1987–2017. Environ. Int. 2018, 115, 343–357. [Google Scholar] [CrossRef]
  46. Ewen, C.; Anagnostopoulou, M.A.; Ward, N.I. Monitoring of heavy metal levels in roadside dusts of Thessaloniki, Greece in relation to motor vehicle traffic density and flow. Environ. Monit. Assess. 2009, 157, 483–498. [Google Scholar] [CrossRef] [PubMed] [Green Version]
  47. Lazaridis, M.; Eleftheriadis, K.; Smolik, J.; Colbeck, I.; Kallos, G.; Drossinos, Y.; Zdimal, V.; Vecera, Z.; Mihalopoulos, N.; Mikuska, P.; et al. Dynamics of fine particles and photo-oxidants in the Eastern Mediterranean (SUB-AERO). Atmos. Environ. 2006, 40, 6214–6228. [Google Scholar] [CrossRef]
  48. Lei, X.; Chen, R.; Wang, C.; Shi, J.; Zhao, Z.; Li, W.; Yan, B.; Chillrud, S.; Cai, J.; Kan, H. Personal Fine Particulate Matter Constituents, Increased Systemic Inflammation, and the Role of DNA Hypomethylation. Environ. Sci. Technol. 2019, 53, 9837–9844. [Google Scholar] [CrossRef]
  49. Emmanouil, C.; Drositi, E.; Vasilatou, V.; Diapouli, E.; Krikonis, K.; Eleftheriadis, K.; Kungolos, A. Study on particulate matter air pollution, source origin, and human health risk based of PM10 metal content in Volos City, Greece. Toxicol. Environ. Chem. 2017, 99, 691–709. [Google Scholar] [CrossRef]
  50. Nutten, S. Atopic dermatitis: Global epidemiology and risk factors. Ann. Nutr. Metab. 2015, 66 (Suppl. S1), 8–16. [Google Scholar] [CrossRef]
Figure 1. Annual distributions of daily average concentrations of ambient PM2.5, PM10, 8 h maximum O3, SO2, NO2 and CO in Beijing during the study period (2014–2019).
Toxics 09 00108 g001
Figure 2. Overall percent changes and 95% confidence intervals (CIs) in daily emergency room visits for skin diseases per 10 μg/m3 increases in PM2.5, PM10, 8 h maximum O3, SO2, NO2 and 1 mg/m3 increase in CO with different time metrics (2014–2019).
Toxics 09 00108 g002
Figure 3. Percent changes and 95% confidence intervals (CIs) in daily emergency room visits for skin diseases per 10 μg/m3 increases in PM2.5 (lag 0–5), PM10 (lag 0–3), 8 h maximum O3 (lag 0–5), SO2 (lag 0–6), NO2 (lag 0–1) and 1 mg/m3 increase in CO (lag 0–5) from 2014–2019, stratified by age, season and sex. Note: Warm season: May–Oct; cold season: November–April. * p for subgroup differences < 0.05.
Toxics 09 00108 g003
Figure 4. Annual percent changes and 95% confidence intervals (CIs) in daily emergency room visits for skin diseases along with a 10 μg/m3 increase in in PM2.5 (lag 0–5), PM10 (lag 0–3), 8 h maximum O3 (lag 0–5), SO2 (lag 0–6), NO2 (lag 0–1) and a 1 mg/m3 increase in CO (lag 0–5) from 2014–2019. Note: p-value indicates the results of the heterogeneity test on annual estimates based on multiplicative interaction terms of pollutants and year.
Toxics 09 00108 g004
Table 1. Demographic characteristics of patients included in this study, 2014–2019.
VariableTotal
(N = 45,094)
Dermatitis/Eczema
(N = 16,891)
Urticaria
(N = 23,832)
N%N%N%
Sex a
  Male18,25140.5639437.9964940.5
  Female26,84359.510,49762.114,18359.5
Age (years) a
  0–18902220.0361821.4492920.7
19–3925,00455.4895853.013,88258.2
≥4011,06824.5431525.5502121.1
Season
Cold (November–April)17,61539.1622736.9976141.0
Warm (May–October)27,47960.910,66463.114,07159.0
a Subgroups excluded cases without sex or age information.
Publisher’s Note: MDPI stays neutral with regard to jurisdictional claims in published maps and institutional affiliations.

