
Feature Importance of Acute Rejection among Black Kidney Transplant Recipients by Utilizing Random Forest Analysis: An Analysis of the UNOS Database

 , , ,
, , ,  ,
, 
Abstract
:1. Introduction
2. Materials and Methods
2.1. Data Source and Study Population
2.2. Data Collection
2.3. Machine Learning Variable Importance Analysis
2.4. Statistical Analysis
3. Results
3.1. Traditional Analysis
3.2. Machine Learning Variable Importance
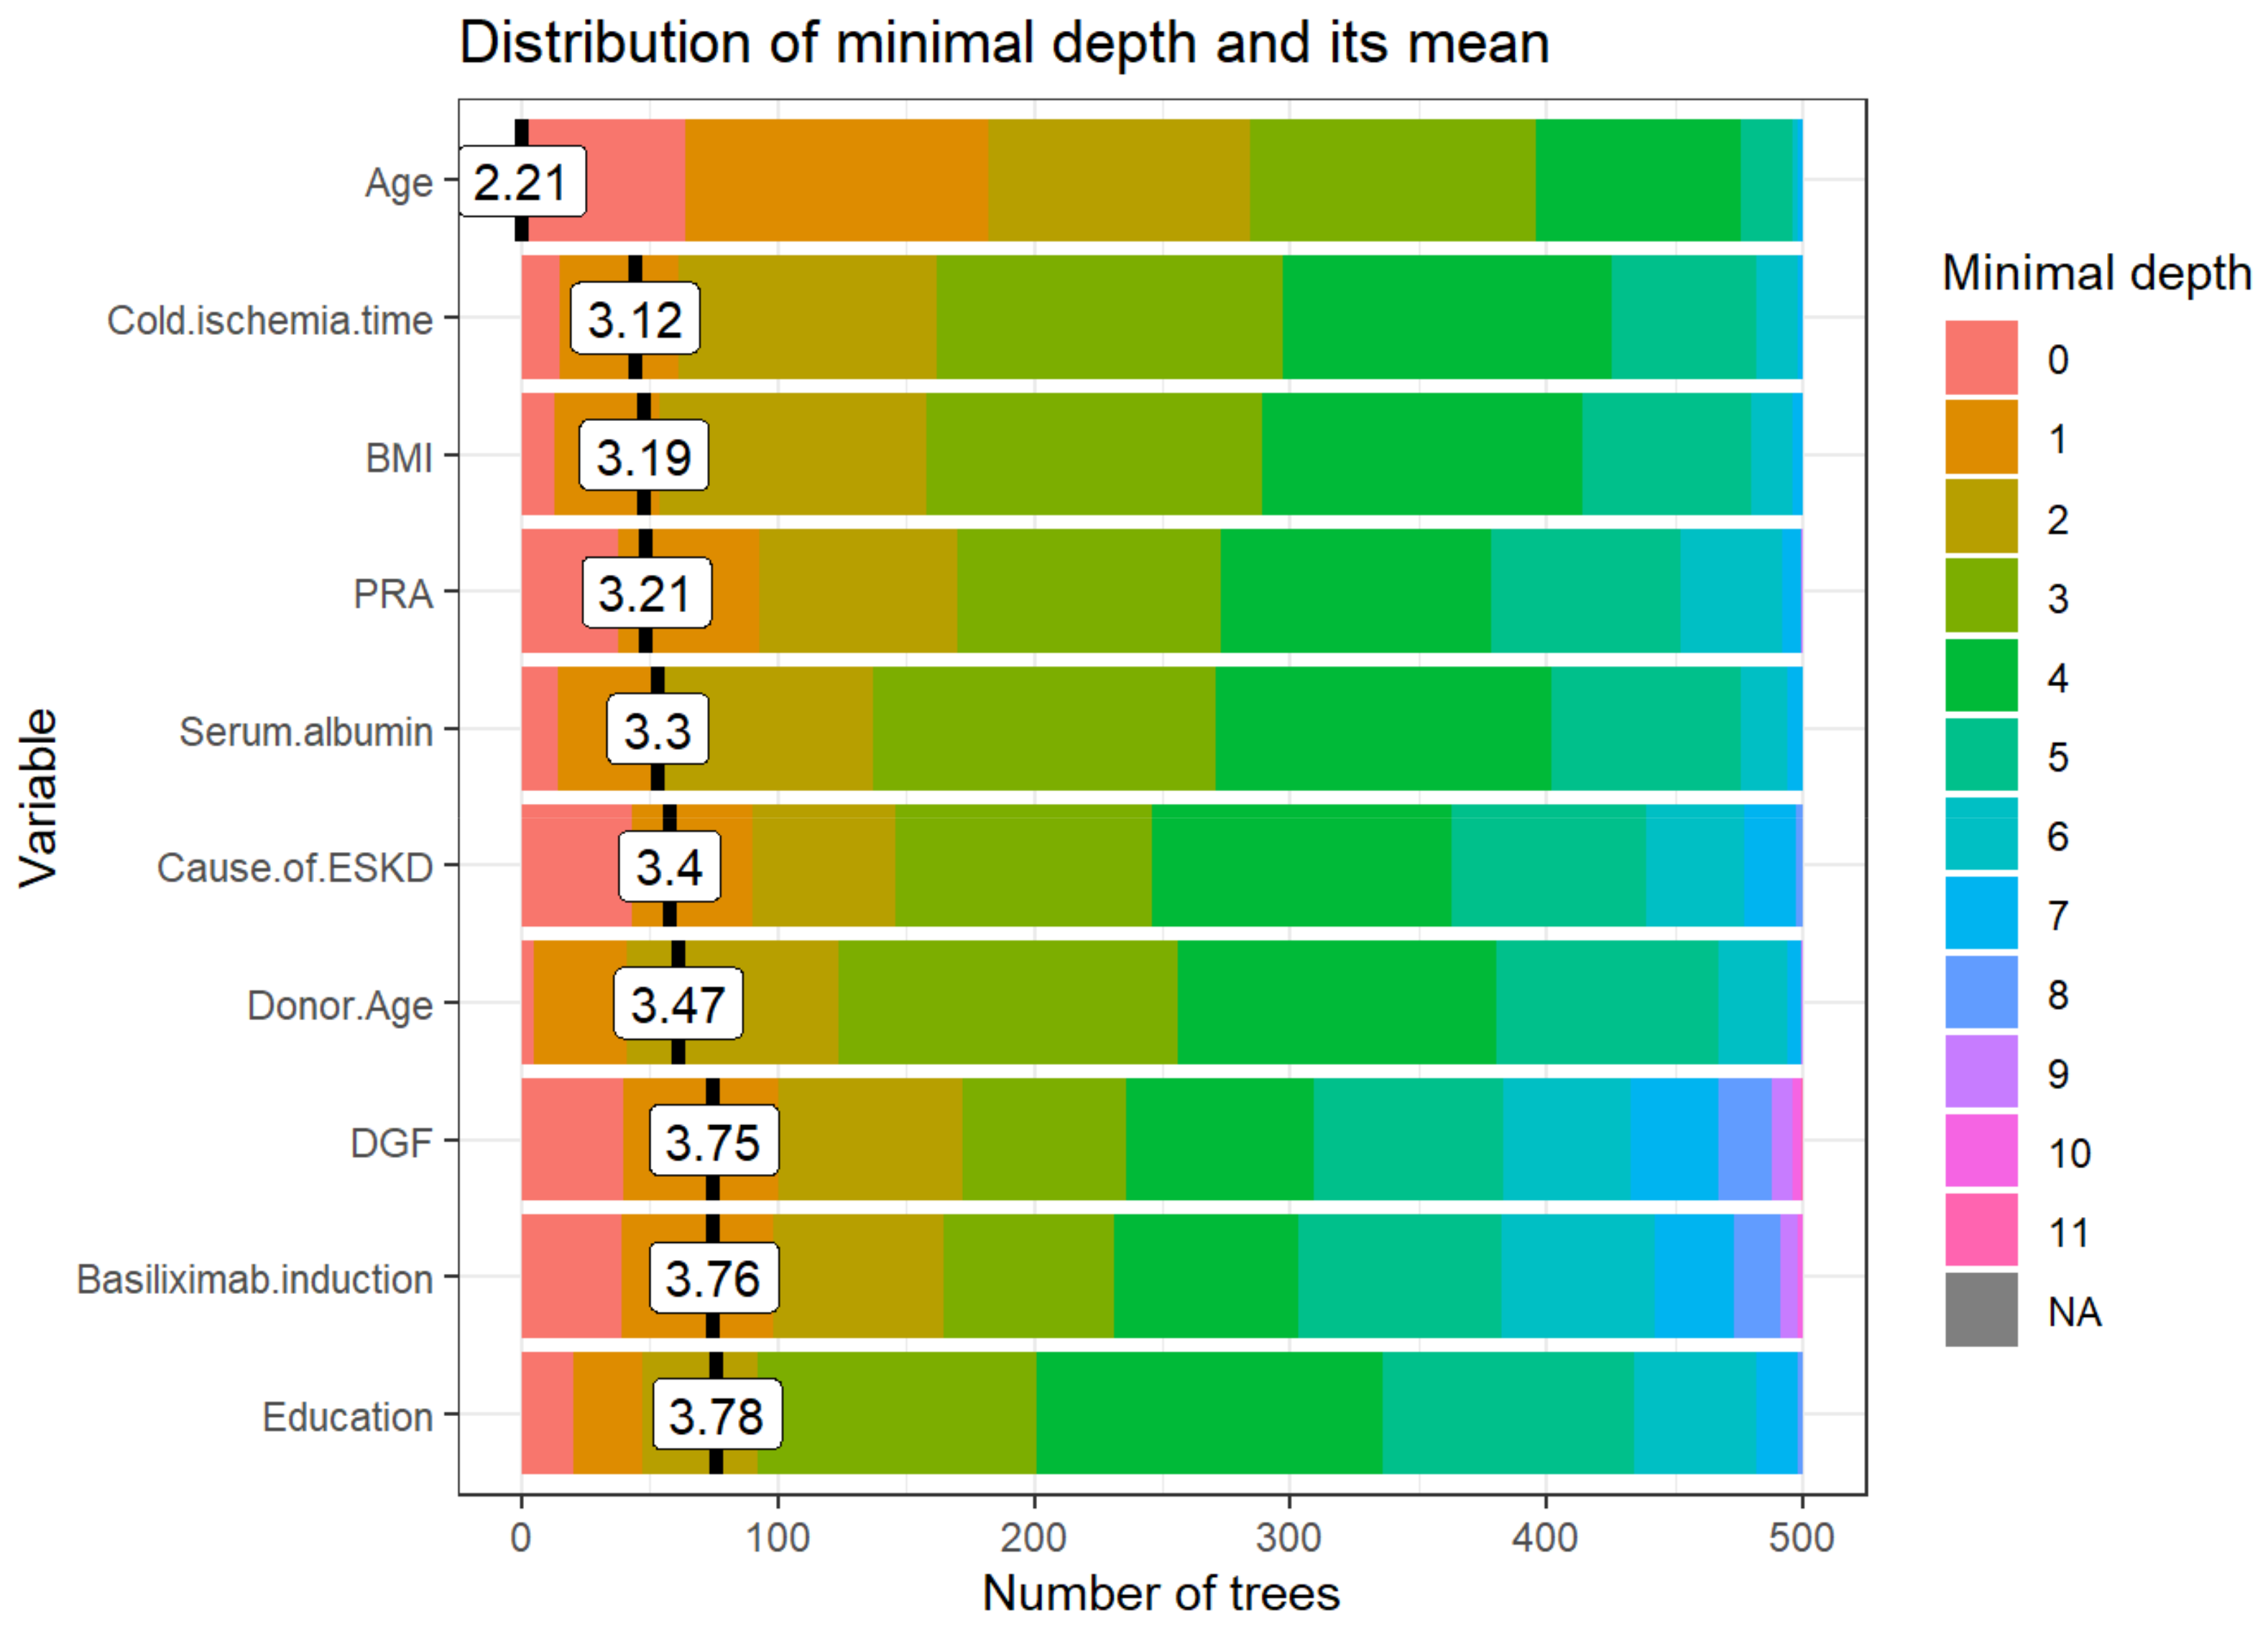
3.2.1. Distribution of Minimal Depth
3.2.2. Importance Measures
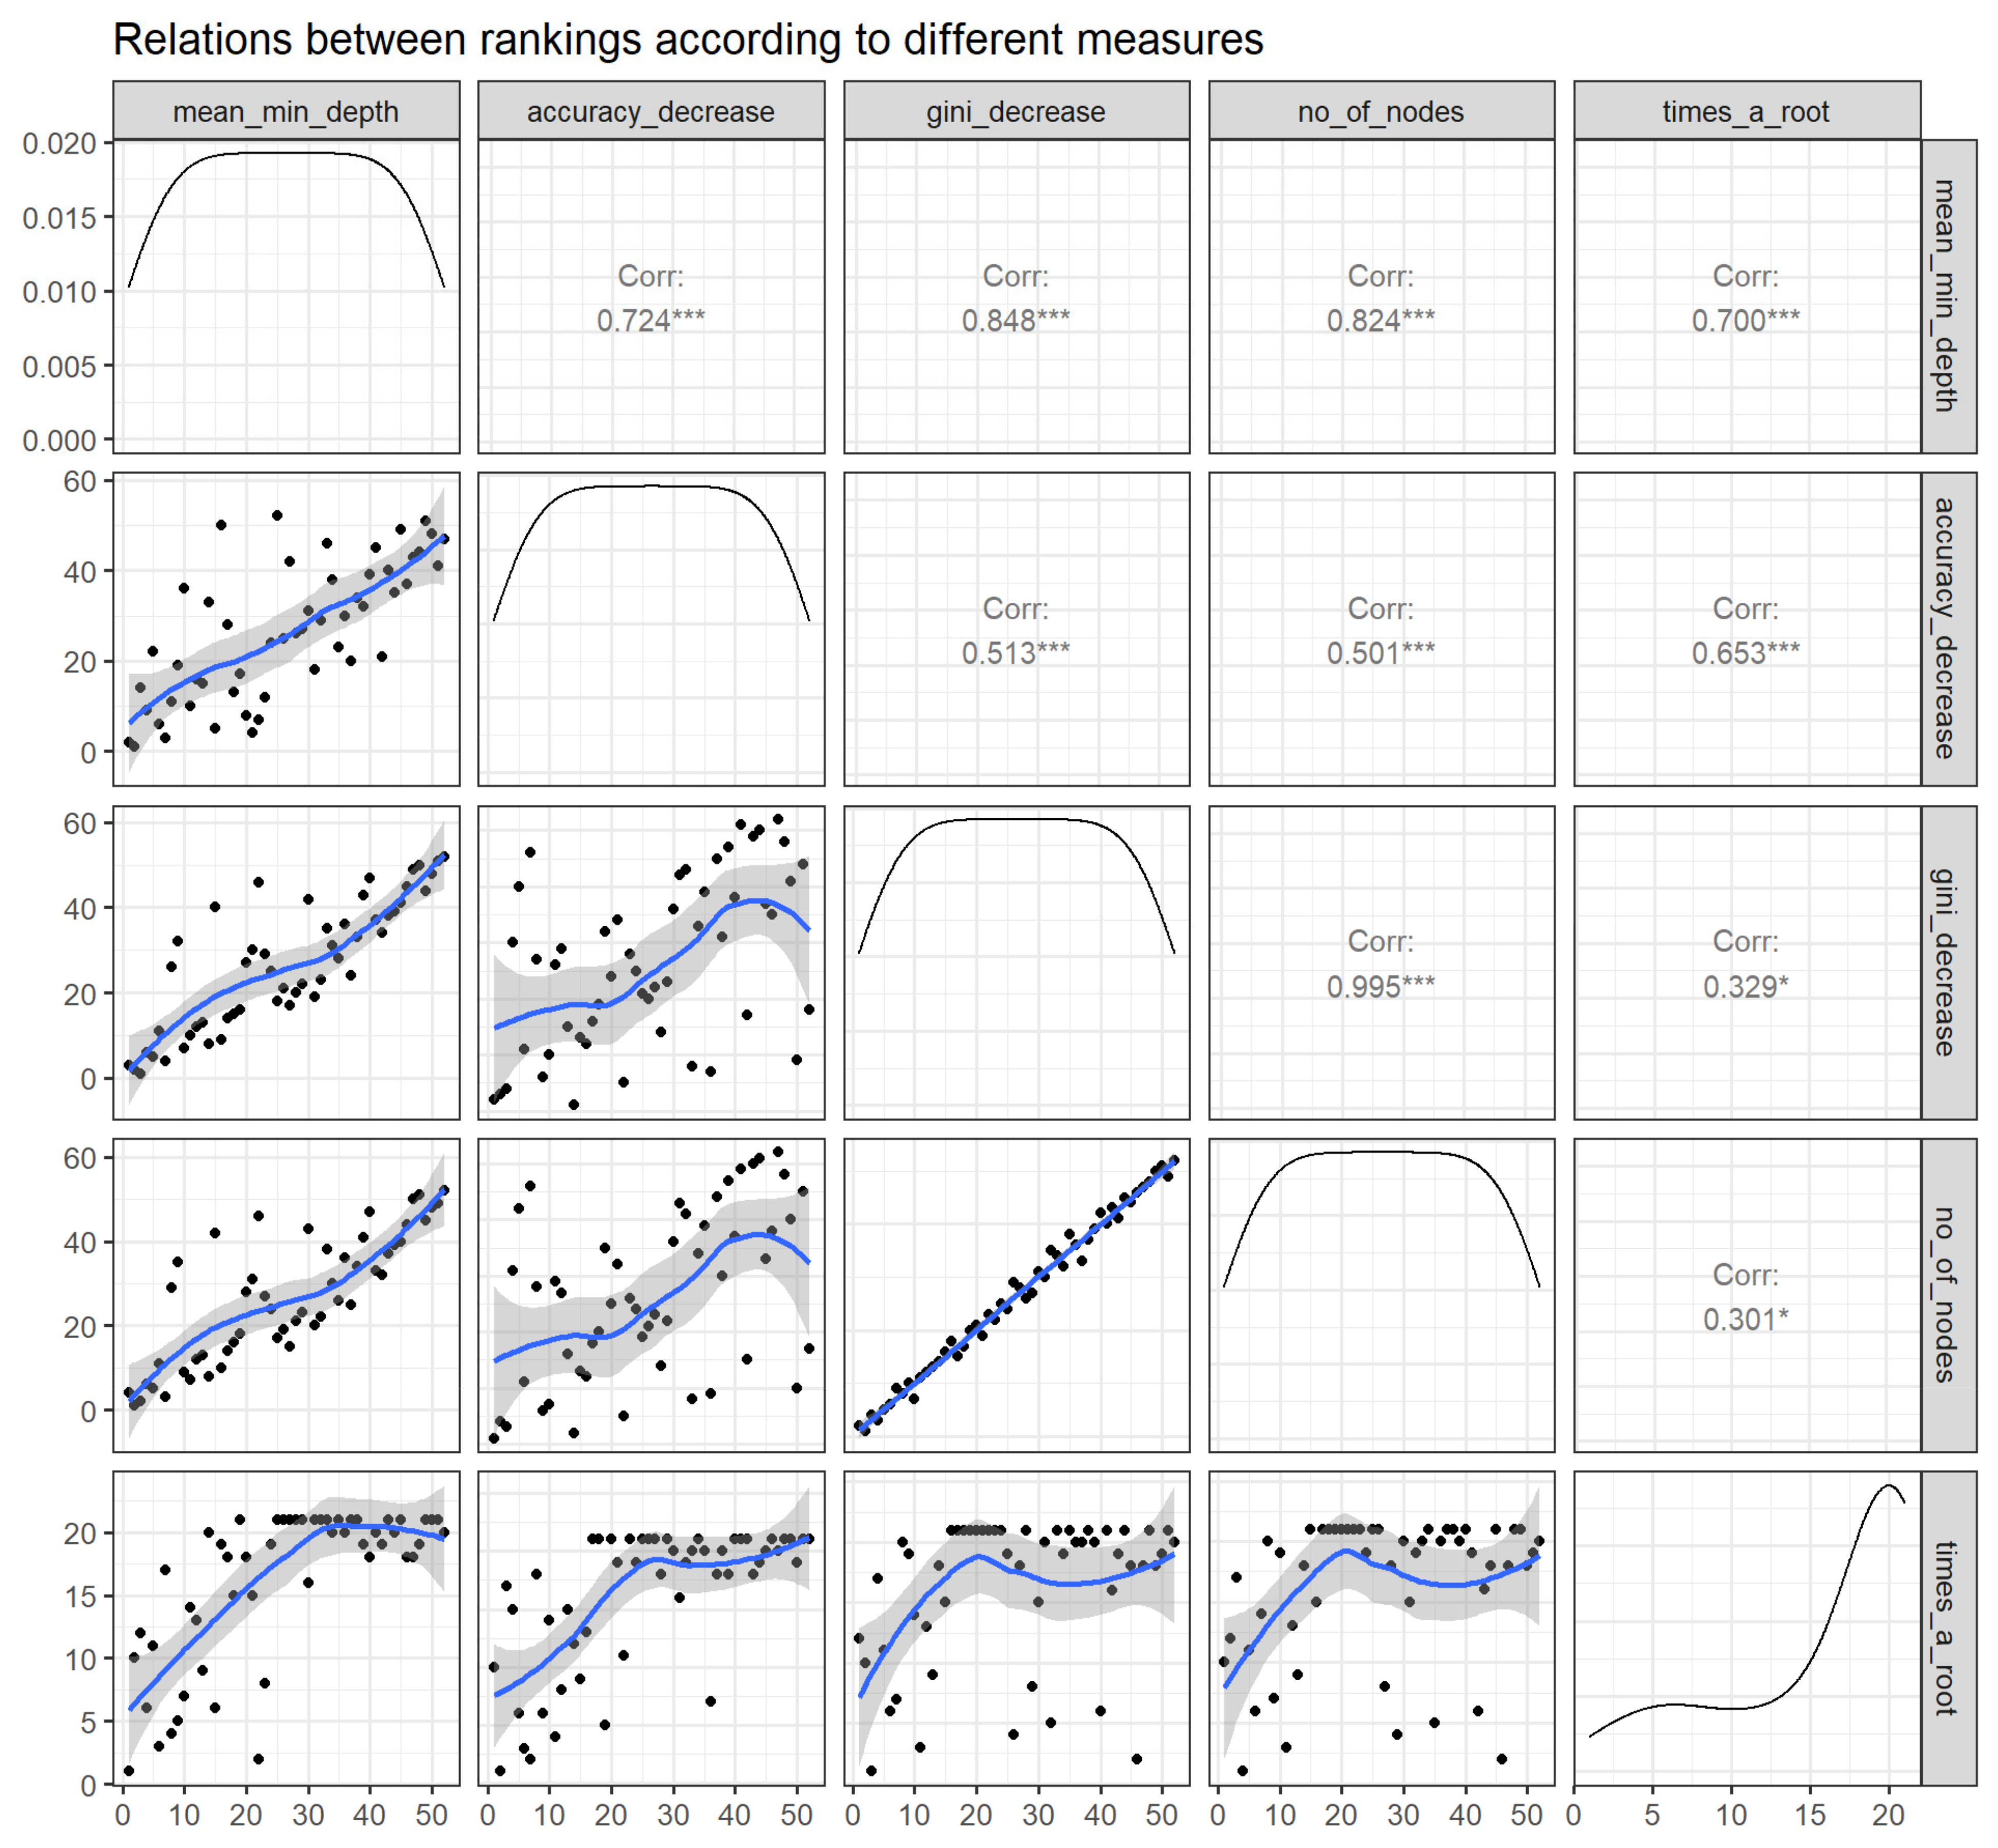
- Mean minimal depth: recipient age, cold ischemia time, BMI, PRA, and serum albumin are the top five variables used to split trees at the root.
- Number of nodes: cold ischemia time, BMI, donor age, recipient age, and serum albumin.
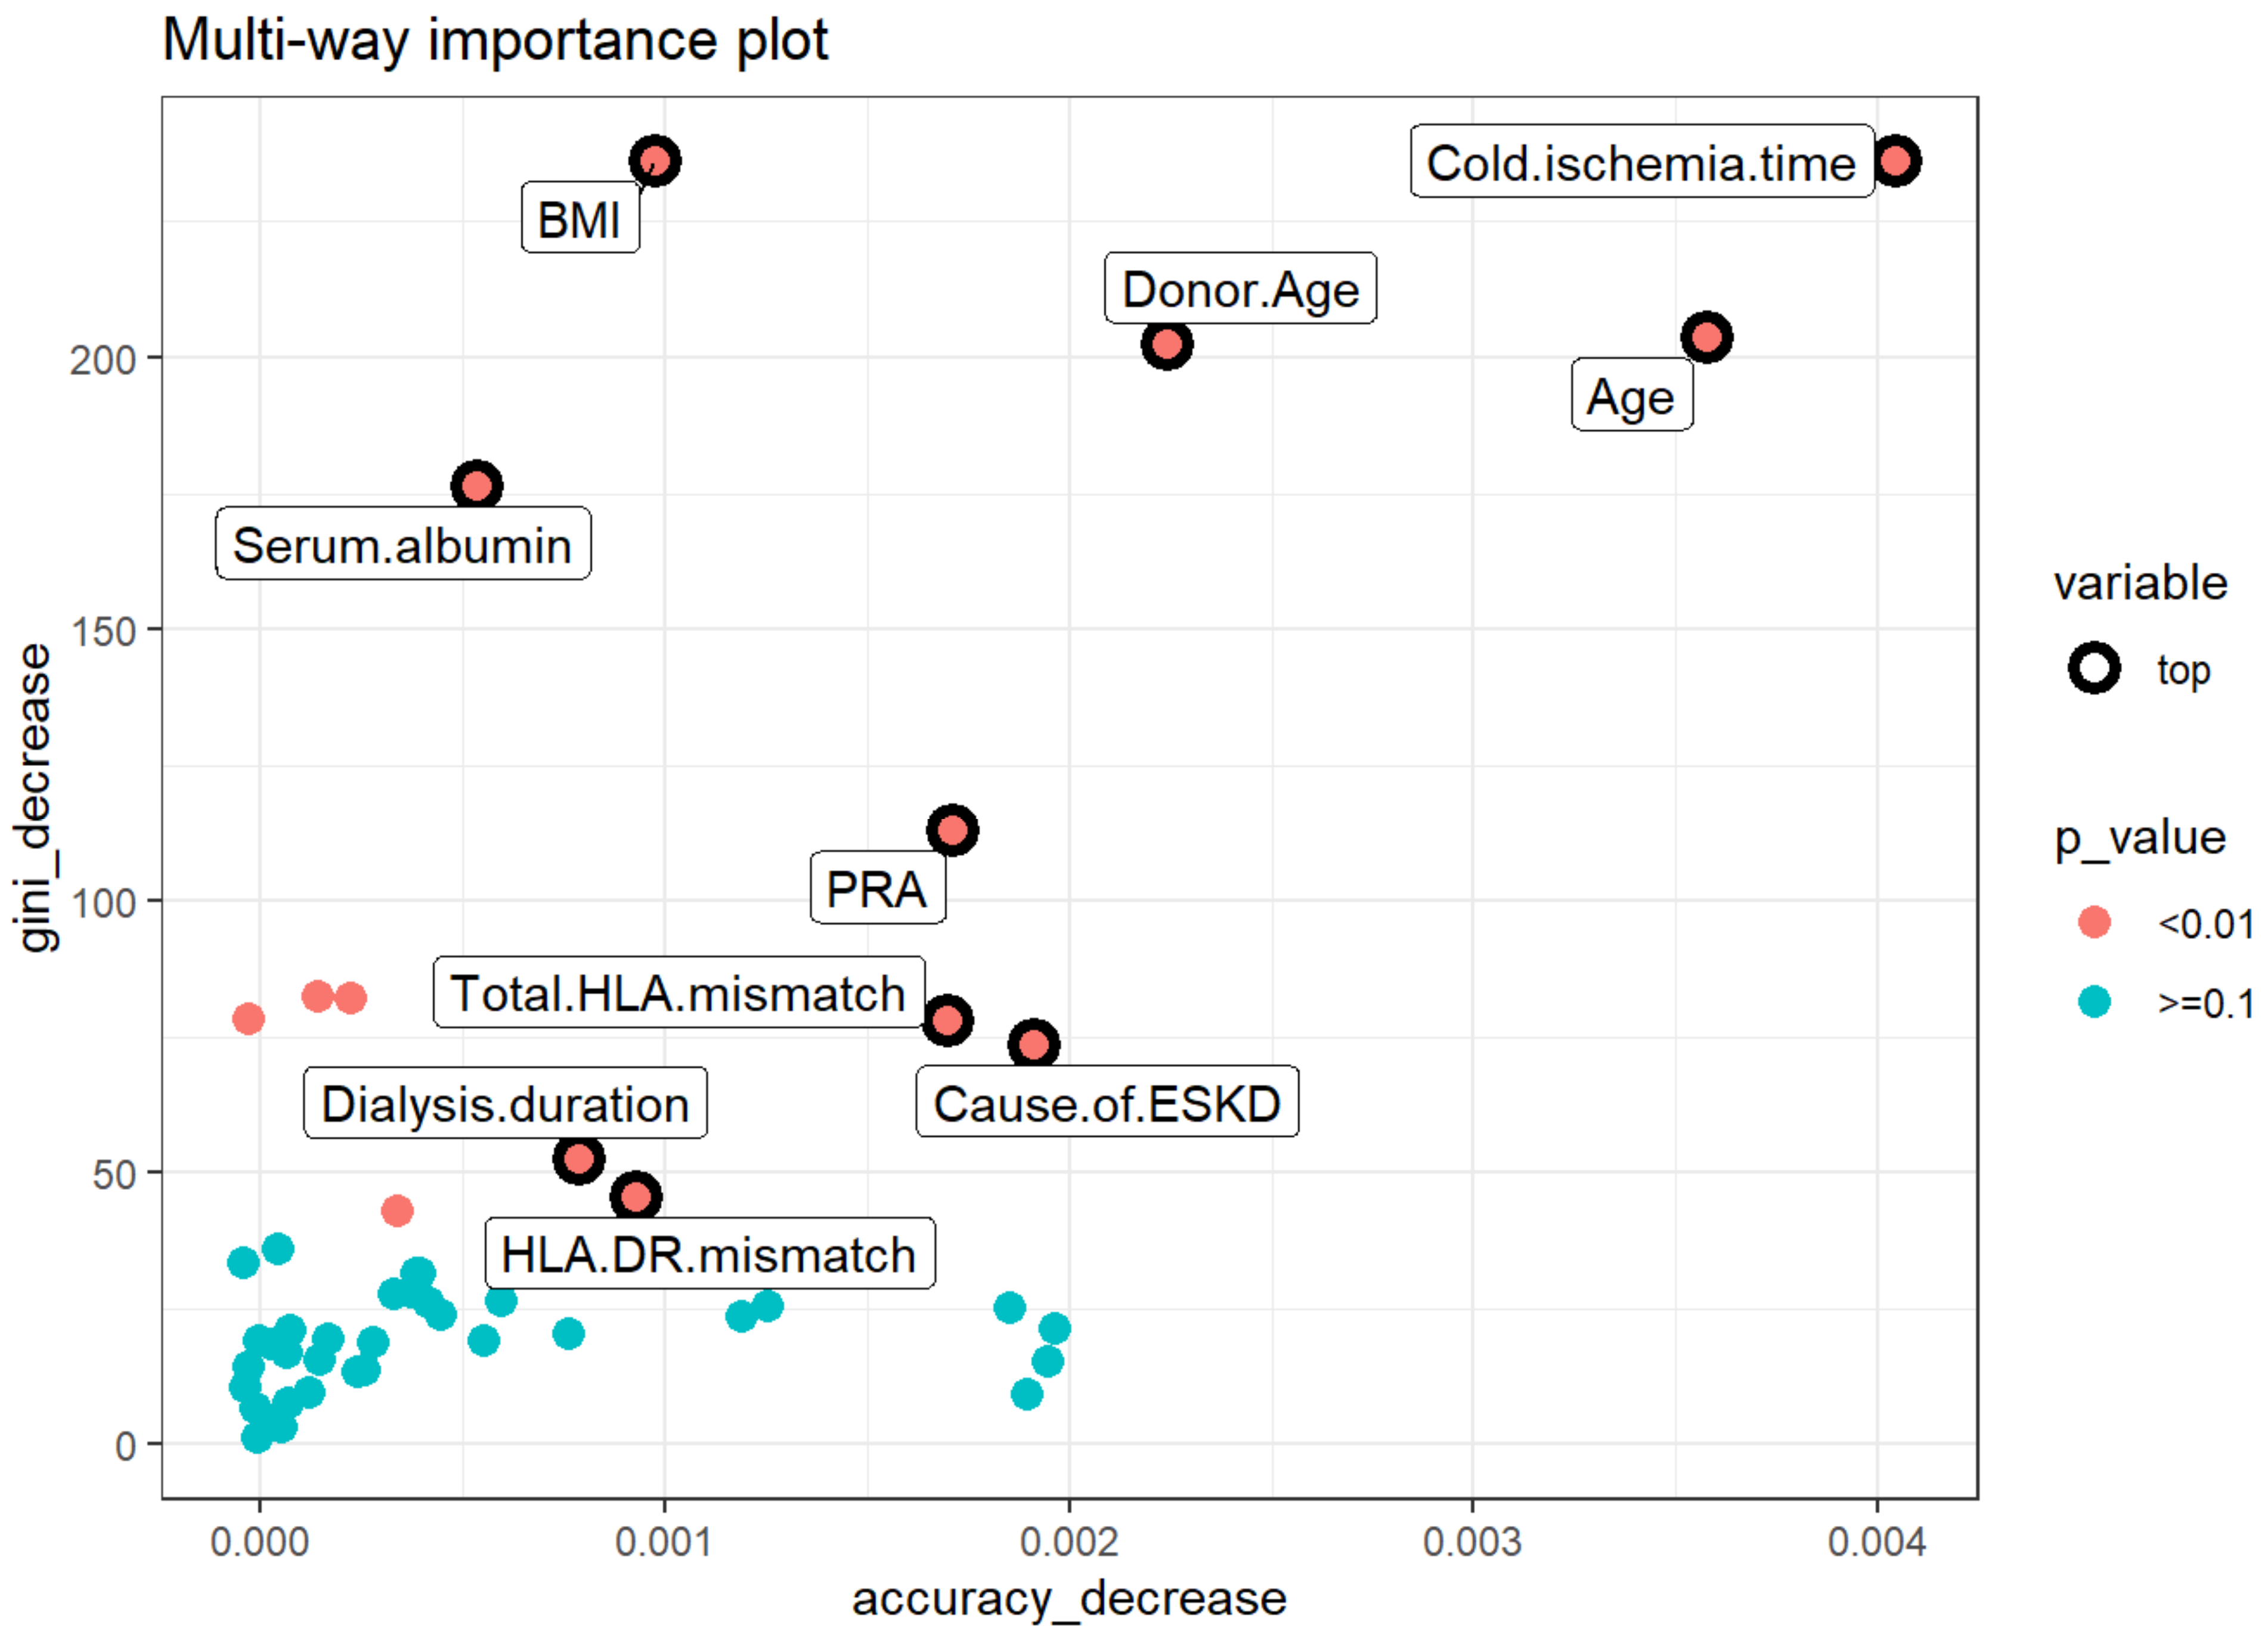
- Decrease in accuracy: cold ischemia time, age, donor age, KDPI group, and number of transplants.
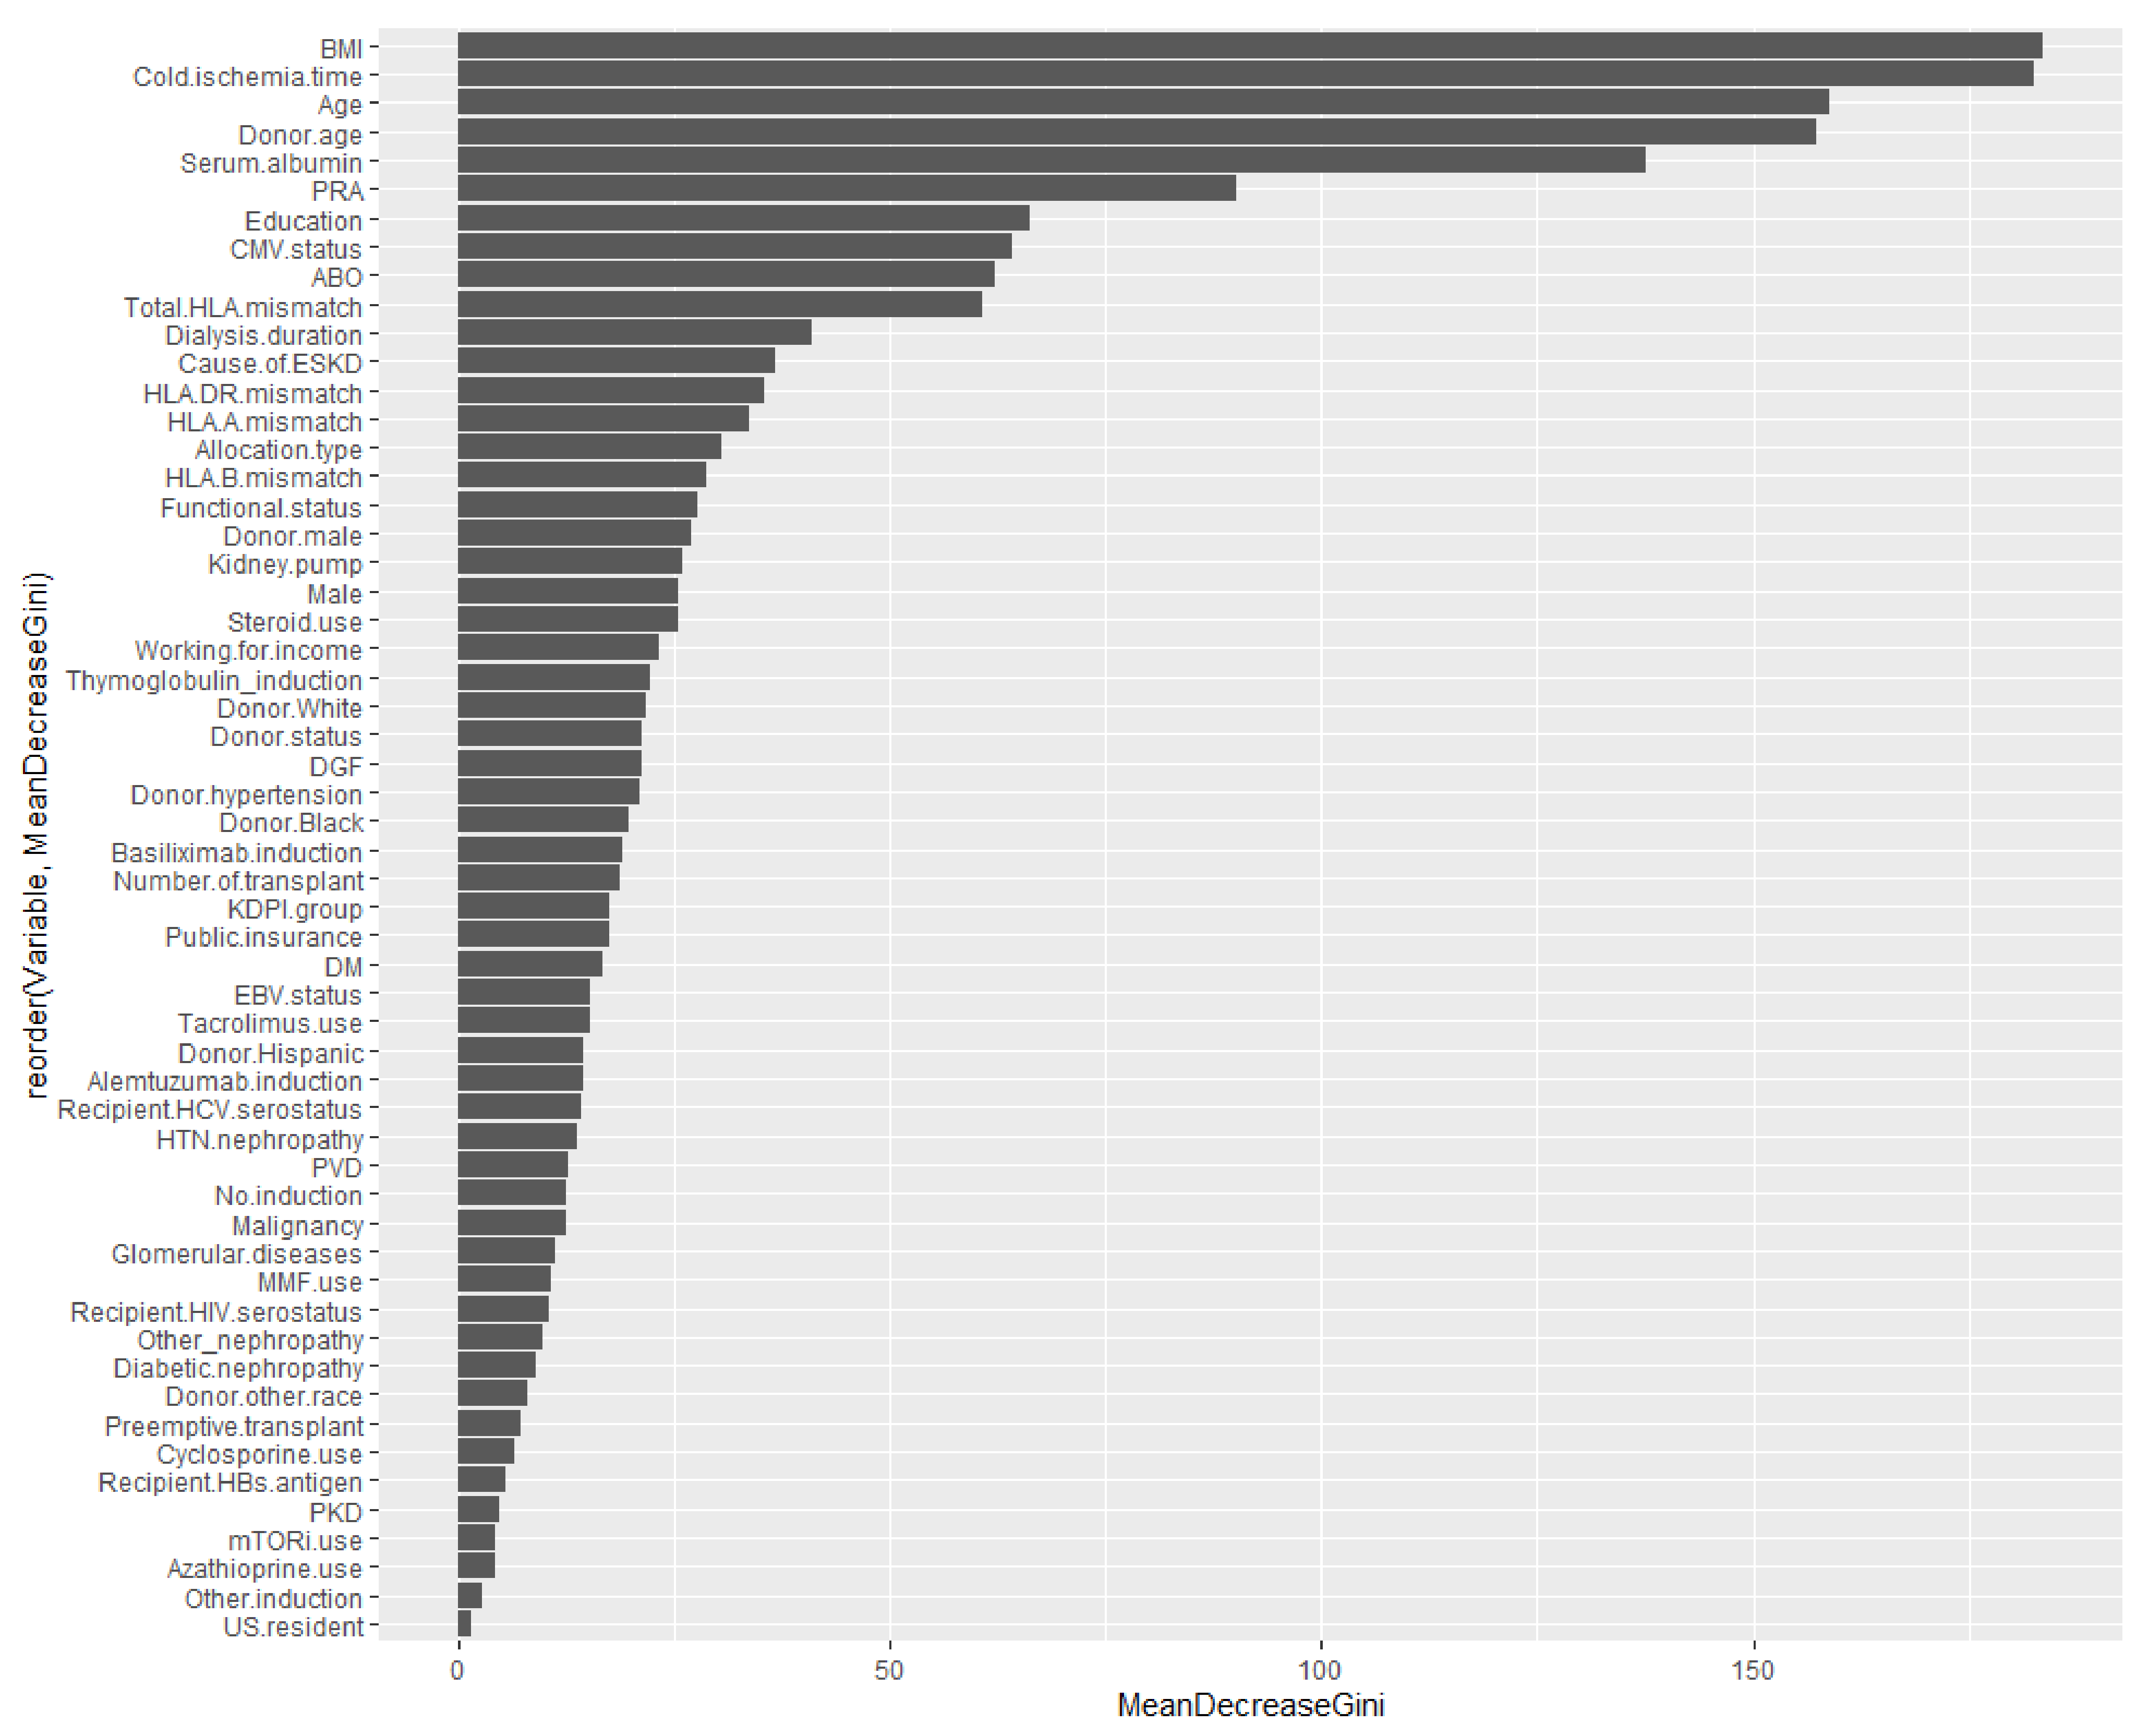
- Decrease in Gini: BMI, cold ischemia time, recipient age, donor age, and serum albumin.
- Number of trees: BMI, cold ischemia time, recipient age, donor age, and serum albumin.
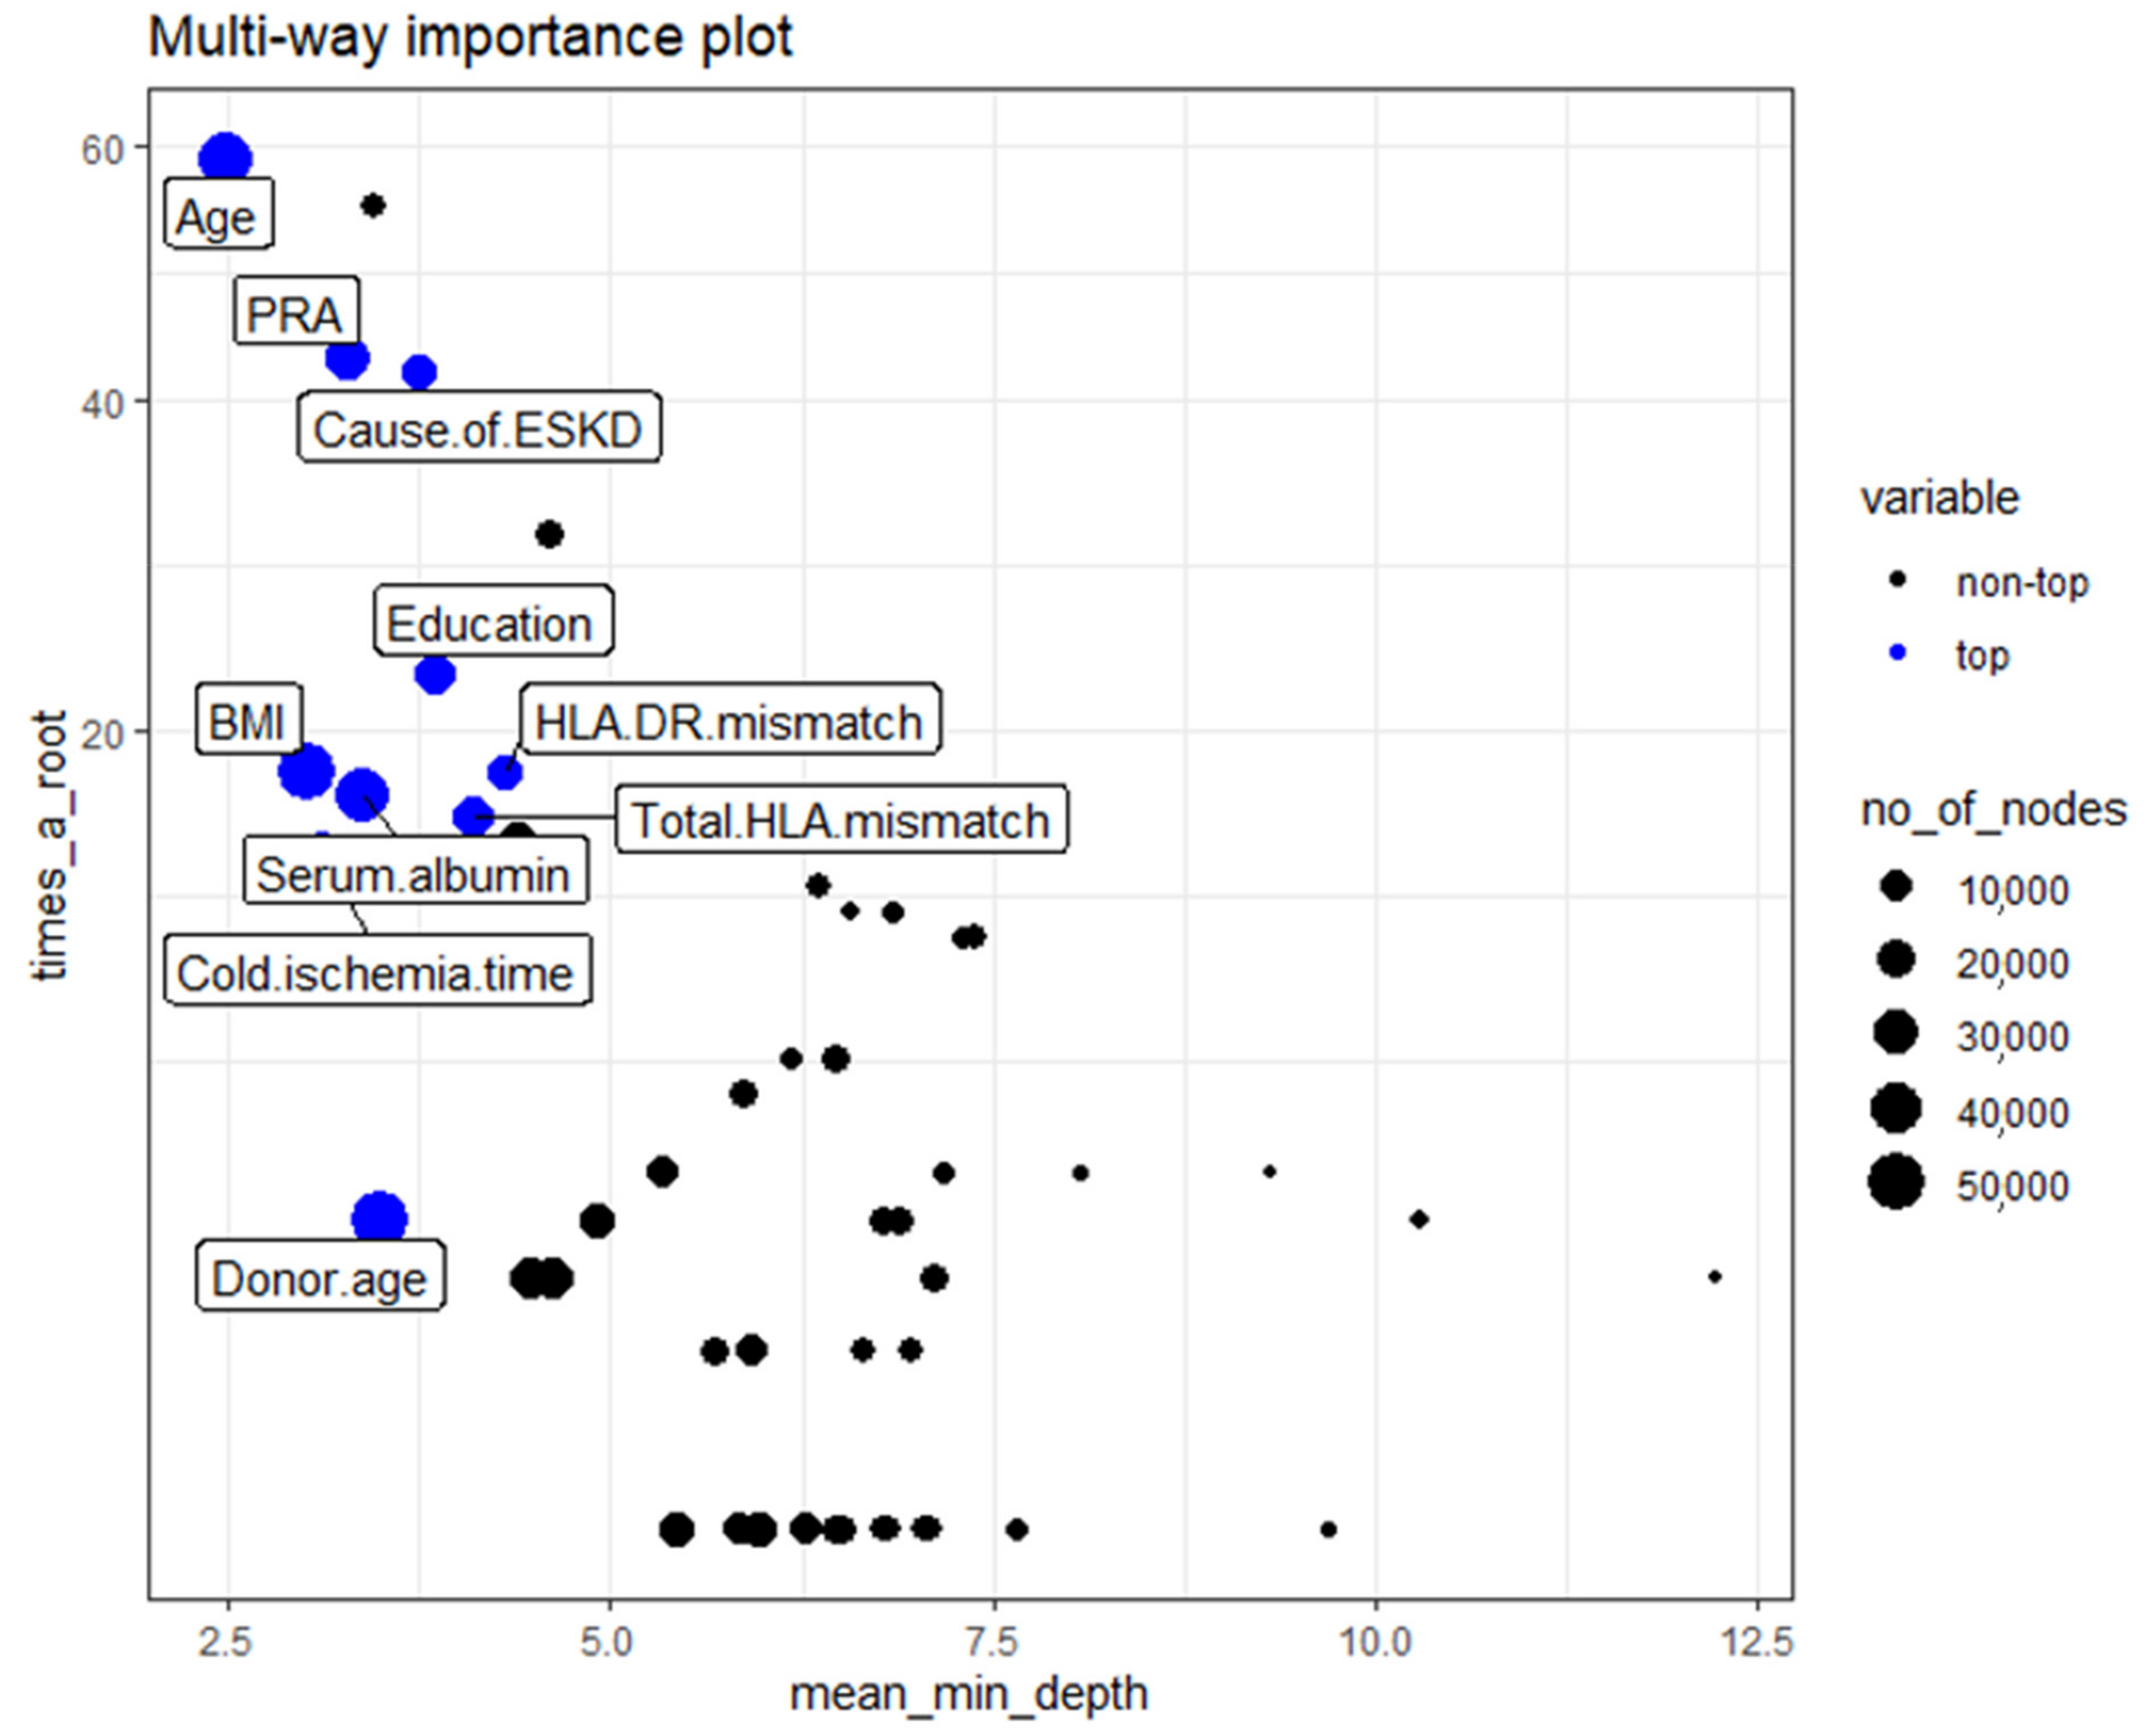
- Times_a_root: recipient age, retransplant, cause of ESKD, DGF, and basiliximab induction.
3.2.3. Multi-way Importance Plot
3.2.4. Compare Rankings of Variables
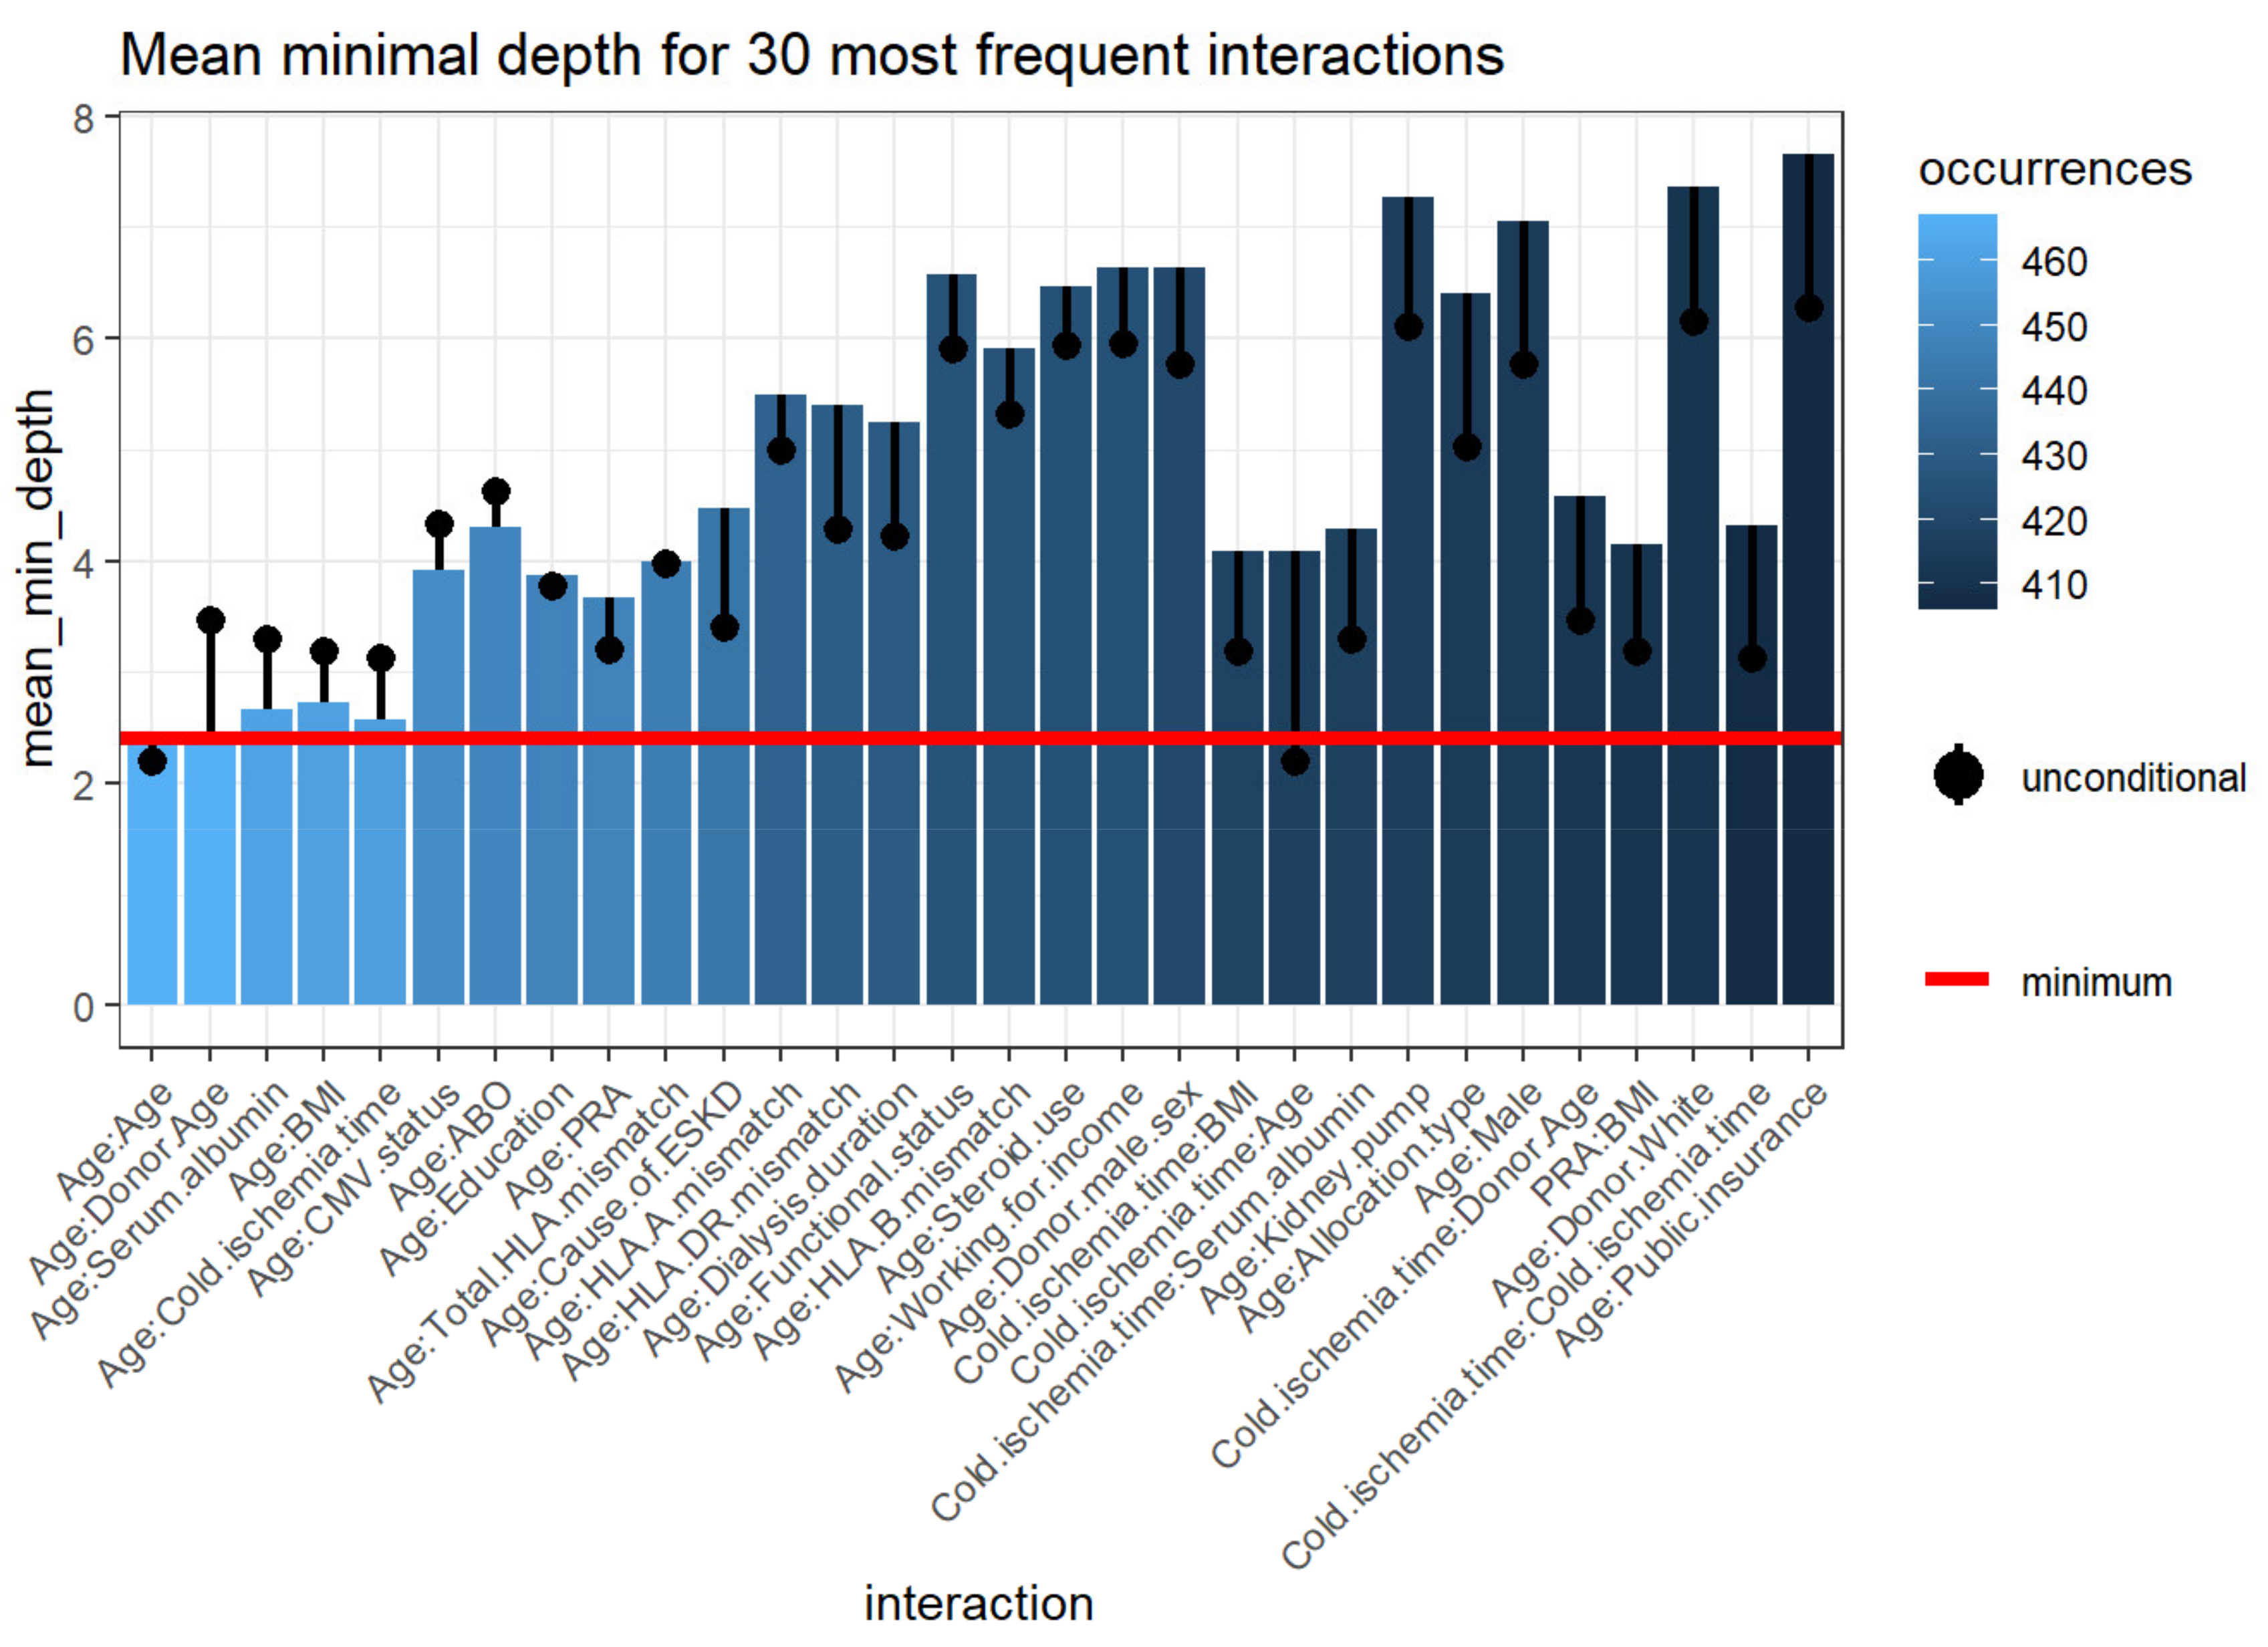
3.2.5. Variable Interactions
4. Discussion
5. Conclusions
Author Contributions
Funding
Institutional Review Board Statement
Informed Consent Statement
Data Availability Statement
Acknowledgments
Conflicts of Interest
References
- Isaacs, R.B.; Nock, S.L.; Spencer, C.E.; Connors, A.F., Jr.; Wang, X.-Q.; Sawyer, R.; Lobo, P.I. Racial disparities in renal transplant outcomes. Am. J. Kidney Dis. 1999, 34, 706–712. [Google Scholar] [CrossRef]
- Foster, C.E., III; Philosophe, B.; Schweitzer, E.J.; Colonna, J.O.; Farney, A.C.; Jarrell, B.; Anderson, L.; Bartlett, S.T. A Decade of Experience with Renal Transplantation in African-Americans. Ann. Surg. 2002, 236, 794–805. [Google Scholar] [CrossRef]
- Hariharan, S.; Mcbride, M.A.; Cherikh, W.S.; Tolleris, C.B.; Bresnahan, B.A.; Johnson, C.P. Post-transplant renal function in the first year predicts long-term kidney transplant survival. Kidney Int. 2002, 62, 311–318. [Google Scholar] [CrossRef] [PubMed] [Green Version]
- Goldfarb-Rumyantzev, A.S.; Scandling, J.D.; Pappas, L.; Smout, R.J.; Horn, S. Prediction of 3-yr cadaveric graft survival based on pre-transplant variables in a large national dataset. Clin. Transplant. 2003, 17, 485–497. [Google Scholar] [CrossRef]
- Mandal, A.K.; Snyder, J.J.; Gilbertson, D.T.; Collins, A.J.; Silkensen, J.R. Does cadaveric donor renal transplantation ever provide better outcomes than live-donor renal transplantation? Transplantation 2003, 75, 494–500. [Google Scholar] [CrossRef] [PubMed]
- Moore, D.E.; Feurer, I.D.; Rodgers, S., Jr.; Shaffer, D.; Nylander, W.; Gorden, D.L.; Chari, R.S.; Wright, J.K.; Pinson, C.W. Is there racial disparity in outcomes after solid organ transplantation? Am. J. Surg. 2004, 188, 571–574. [Google Scholar] [CrossRef]
- Eckhoff, D.E.; Young, C.J.; Gaston, R.S.; Fineman, S.W.; Deierhoi, M.H.; Foushee, M.T.; Brown, R.N.; Diethelm, A.G. Racial Disparities in Renal Allograft Survival: A Public Health Issue? J. Am. Coll. Surg. 2007, 204, 894–902. [Google Scholar] [CrossRef]
- Joshi, S.; Gaynor, J.J.; Ciancio, G. Review of ethnic disparities in access to renal transplantation. Clin. Transplant. 2012, 26, E337–E343. [Google Scholar] [CrossRef]
- Morris, P.J.; Johnson, R.J.; Fuggle, S.V.; Belger, M.A.; Briggs, J.D. Analysis of factors that affect outcome of primary cadaveric renal transplantation in the UK. HLA Task Force of the Kidney Advisory Group of the United Kingdom Transplant Support Service Authority (UKTSSA). Lancet 1999, 354, 1147–1152. [Google Scholar] [CrossRef]
- Meier-Kriesche, H.-U.; Kaplan, B. Waiting time on dialysis as the strongest modifiable risk factor for renal transplant outcomes: A paired donor kidney analysis. Transplantation 2002, 74, 1377–1381. [Google Scholar] [CrossRef]
- Johansen, K.L.; Zhang, R.; Huang, Y.; Patzer, R.E.; Kutner, N.G. Association of Race and Insurance Type with Delayed Assessment for Kidney Transplantation among Patients Initiating Dialysis in the United States. Clin. J. Am. Soc. Nephrol. 2012, 7, 1490–1497. [Google Scholar] [CrossRef] [PubMed] [Green Version]
- Tankersley, M.; Gaston, R.; Curtis, J.; Julian, B.; Deierhoi, M.; Rhynes, V.; Zeigler, S.; Diethelm, A. The living donor process in kidney transplantation: Influence of race and comorbidity. Transplant. Proc. 1997, 29, 3722–3723. [Google Scholar] [CrossRef]
- Chavalitdhamrong, D.; Gill, J.; Takemoto, S.; Madhira, B.R.; Cho, Y.W.; Shah, T.; Bunnapradist, S. Patient and Graft Outcomes from Deceased Kidney Donors Age 70 Years and Older: An Analysis of the Organ Procurement Transplant Network/United Network of Organ Sharing Database. Transplantation 2008, 85, 1573–1579. [Google Scholar] [CrossRef] [PubMed] [Green Version]
- Taber, D.J.; Egede, L.E.; Baliga, P.K. Outcome disparities between African Americans and Caucasians in contemporary kidney transplant recipients. Am. J. Surg. 2017, 213, 666–672. [Google Scholar] [CrossRef] [Green Version]
- Rebellato, L.M.; Arnold, A.N.; Bozik, K.M.; Haisch, C.E. HLA matching and the united network for organ sharing allocation system: Impact of HLA matching on african-american recipients of cadaveric kidney transplants. Transplantation 2002, 74, 1634–1636. [Google Scholar] [CrossRef]
- Ng, F.L.; Holt, D.W.; Chang, R.W.S.; MacPhee, I.A.M. Black renal transplant recipients have poorer long-term graft survival than CYP3A5 expressers from other ethnic groups. Nephrol. Dial. Transplant. 2010, 25, 628–634. [Google Scholar] [CrossRef] [PubMed] [Green Version]
- Martins, L.S.; Fonseca, I.; Sousa, S.; Matos, C.; Santos, J.; Dias, L.; Henriques, A.; Sarmento, A.; Cabrita, A. The Influence of HLA Mismatches and Immunosuppression on Kidney Graft Survival: An Analysis of More Than 1300 Patients. Transplant. Proc. 2007, 39, 2489–2493. [Google Scholar] [CrossRef]
- Roberts, J.P.; Wolfe, R.A.; Bragg-Gresham, J.L.; Rush, S.H.; Wynn, J.; Distant, D.A.; Ashby, V.B.; Held, P.J.; Port, F.K. Effect of Changing the Priority for HLA Matching on the Rates and Outcomes of Kidney Transplantation in Minority Groups. N. Engl. J. Med. 2004, 350, 545–551. [Google Scholar] [CrossRef] [Green Version]
- Malek, S.K.; Keys, B.J.; Kumar, S.; Milford, E.; Tullius, S.G. Racial and ethnic disparities in kidney transplantation. Transpl. Int. 2010, 24, 419–424. [Google Scholar] [CrossRef] [PubMed]
- Kasiske, B.L.; Anjum, S.; Shah, R.; Skogen, J.; Kandaswamy, C.; Danielson, B.; O’Shaughnessy, E.A.; Dahl, D.C.; Silkensen, J.R.; Sahadevan, M.; et al. Hypertension after kidney transplantation. Am. J. Kidney Dis. 2004, 43, 1071–1081. [Google Scholar] [CrossRef] [PubMed]
- Kasiske, B.L.; Snyder, J.J.; Gilbertson, D.; Matas, A.J. Diabetes Mellitus after Kidney Transplantation in the United States. Arab. Archaeol. Epigr. 2003, 3, 178–185. [Google Scholar] [CrossRef]
- Gralla, J.; Le, C.N.; Cooper, J.E.; Wiseman, A.C. The risk of acute rejection and the influence of induction agents in lower-risk African American kidney transplant recipients receiving modern immunosuppression. Clin. Transplant. 2014, 28, 292–298. [Google Scholar] [CrossRef]
- Padiyar, A.; Hricik, D.E. Immune factors influencing ethnic disparities in kidney transplantation outcomes. Expert Rev. Clin. Immunol. 2011, 7, 769–778. [Google Scholar] [CrossRef] [PubMed]
- Siedlecki, A.; Irish, W.; Brennan, D.C. Delayed Graft Function in the Kidney Transplant. Arab. Archaeol. Epigr. 2011, 11, 2279–2296. [Google Scholar] [CrossRef] [Green Version]
- Taber, D.J.; Hunt, K.J.; Gebregziabher, M.; Srinivas, T.; Chavin, K.D.; Baliga, P.K.; Egede, L.E. A Comparative Effectiveness Analysis of Early Steroid Withdrawal in Black Kidney Transplant Recipients. Clin. J. Am. Soc. Nephrol. 2017, 12, 131–139. [Google Scholar] [CrossRef] [Green Version]
- Liu, A.; Woodside, K.J.; Augustine, J.J.; Sarabu, N. Racial disparity in kidney transplant survival relates to late rejection and is independent of steroid withdrawal. Clin. Transplant. 2018, 32, e13381. [Google Scholar] [CrossRef] [PubMed]
- Gordon, E.J.; Ladner, D.P.; Caicedo, J.C.; Franklin, J. Disparities in Kidney Transplant Outcomes: A Review. Semin. Nephrol. 2010, 30, 81–89. [Google Scholar] [CrossRef] [Green Version]
- Vasquez, E.M.; Benedetti, E.; Pollak, R. Ethnic differences in clinical response to corticosteroid treatment of acute renal allograft rejection. Transplantation 2001, 71, 229–233. [Google Scholar] [CrossRef]
- Weng, S.F.; Vaz, L.; Qureshi, N.; Kai, J. Prediction of premature all-cause mortality: A prospective general population cohort study comparing machine-learning and standard epidemiological approaches. PLoS ONE 2019, 14, e0214365. [Google Scholar] [CrossRef]
- Song, X.; Mitnitski, A.; Cox, J.; Rockwood, K. Comparison of Machine Learning Techniques with Classical Statistical Models in Predicting Health Outcomes. Stud. Health Technol. Inform. 2004, 107, 736–740. [Google Scholar] [PubMed]
- Breiman, L. Random forests. Mach. Learn. 2001, 45, 5–32. [Google Scholar] [CrossRef] [Green Version]
- Rashidi, H.H.; Tran, N.K.; Betts, E.V.; Howell, L.P.; Green, R. Artificial Intelligence and Machine Learning in Pathology: The Present Landscape of Supervised Methods. Acad. Pathol. 2019, 6, 2374289519873088. [Google Scholar] [CrossRef] [PubMed]
- Wasserman, L.; Roeder, K. High-dimensional variable selection. Ann. Stat. 2009, 37, 2178–2201. [Google Scholar] [CrossRef] [Green Version]
- Ayers, B.; Sandholm, T.; Gosev, I.; Prasad, S.; Kilic, A. Using machine learning to improve survival prediction after heart transplantation. J. Card. Surg. 2021, 36, 4113–4120. [Google Scholar] [CrossRef]
- Zhang, Y.; Yang, D.; Liu, Z.; Chen, C.; Ge, M.; Li, X.; Luo, T.; Wu, Z.; Shi, C.; Wang, B.; et al. An explainable supervised machine learning predictor of acute kidney injury after adult deceased donor liver transplantation. J. Transl. Med. 2021, 19, 1–15. [Google Scholar] [CrossRef]
- Senanayake, S.; Kularatna, S.; Healy, H.; Graves, N.; Baboolal, K.; Sypek, M.P.; Barnett, A. Development and validation of a risk index to predict kidney graft survival: The kidney transplant risk index. BMC Med. Res. Methodol. 2021, 21, 127. [Google Scholar] [CrossRef] [PubMed]
- Walker, S.W.C.; Anwar, A.; Psutka, J.M.; Crouse, J.; Liu, C.; Le Blanc, J.C.Y.; Montgomery, J.; Goetz, G.H.; Janiszewski, J.S.; Campbell, J.L.; et al. Determining molecular properties with differential mobility spectrometry and machine learning. Nat. Commun. 2018, 9, 5096. [Google Scholar] [CrossRef] [PubMed] [Green Version]
- Van Buuren, S.; Groothuis-Oudshoorn, K. Mice: Multivariate imputation by chained equations in R. J. Stat. Softw. 2011, 45, 1–67. [Google Scholar] [CrossRef] [Green Version]
- Paluszynska, A.; Biecek, P.; Jiang, Y. Random Forest Explainer: Explaining and visualizing random forests in terms of variable importance. R package Version 0.9 2017. Available online: https://github.com/ModelOriented/randomForestExplainer (accessed on 15 July 2021).
- Liaw, A.; Wiener, M. Classification and regression by random forest. R News 2002, 2, 18–22. [Google Scholar]
- Muchlinski, D.; Siroky, D.; He, J.; Kocher, M. Comparing Random Forest with Logistic Regression for Predicting Class-Imbalanced Civil War Onset Data. Political Anal. 2016, 24, 87–103. [Google Scholar] [CrossRef]


| All | Rejection | No Rejection | p-Value | |
|---|---|---|---|---|
| (n = 22,687) | (n = 1330) | (n = 21,357) | ||
| Recipient Age (year) | 51.4 ± 12.6 | 47.8 ± 13.2 | 51.6 ± 12.6 | <0.001 |
| 52 (43–61) | 48 (37–58) | 53 (43–61) | ||
| Recipient male sex | 13,635 (60) | 817 (61) | 12,818 (60) | 0.31 |
| ABO blood group | 0.34 | |||
| - A | 6452 (28) | 368 (28) | 6084 (28) | |
| - B | 4334 (19) | 239 (18) | 4095 (19) | |
| - AB | 1255 (6) | 68 (5) | 1187 (6) | |
| - O | 10,646 (50) | 655 (49) | 9991 (47) | |
| Body mass index (kg/m2) | 29.3 ± 5.7 | 29.2 ± 5.5 | 29.3 ± 5.7 | 0.33 |
| 29.0 (25.1–33.4) | 28.9 (25.1–33.2) | 29.0 (25.1–33.4) | ||
| Kidney retransplant | 2413 (11) | 222 (17) | 2191 (10) | <0.001 |
| Dialysis duration | <0.001 | |||
| - Preemptive or <1 year | 3585 (16) | 159 (12) | 3426 (16) | |
| - 1–3 years | 4069 (18) | 245 (18) | 3824 (18) | |
| - >3 years | 15,033 (66) | 926 (70) | 14,107 (66) | |
| Cause of end-stage kidney disease | <0.001 | |||
| - Diabetes mellitus | 6460 (28) | 313 (24) | 6147 (29) | |
| - Hypertension | 8189 (36) | 455 (34) | 7734 (36) | |
| - Glomerular disease | 4027 (18) | 295 (22) | 3732 (17) | |
| - PKD | 839 (4) | 36 (3) | 803 (4) | |
| - Other | 3172 (14) | 231 (17) | 2941 (14) | |
| Comorbidity | ||||
| - Diabetes mellitus | 8253 (36) | 417 (31) | 7836 (37) | <0.001 |
| - Malignancy | 1580 (7) | 85 (6) | 1495 (7) | 0.4 |
| - Peripheral vascular disease | 2119 (9) | 109 (8) | 2010 (9) | 0.14 |
| PRA | 0 (0–48) | 0 (0–69) | 0 (0–47) | <0.001 |
| Positive HCV serostatus | 1825 (8) | 118 (9) | 1707 (8) | 0.25 |
| Positive HBs antigen | 340 (2) | 18 (1) | 322 (2) | 0.65 |
| Positive HIV serostatus | 767 (3) | 67 (5) | 700 (3) | 0.001 |
| Functional status | 0.84 | |||
| - 10–30% | 50 (0) | 2 (0.2) | 48 (0.2) | |
| - 40–70% | 11,869 (52) | 700 (53) | 11,169 (52) | |
| - 80–100% | 10,768 (47) | 628 (47) | 10,140 (47) | |
| Working income | 5883 (26) | 320 (24) | 5563 (26) | 0.11 |
| Public insurance | 18,504 (82) | 1117 (84) | 17,387 (81) | 0.02 |
| US resident | 22,597 (99) | 1327 (99) | 21,270 (99) | 0.31 |
| Undergraduate education or above | 12,405 (55) | 708 (53) | 11,697 (55) | 0.28 |
| Serum albumin | 4.0 ± 0.6 | 3.9 ± 0.5 | 4.0 ± 0.6 | 0.32 |
| 4.0 (3.6–4.3) | 4.0 (3.6–4.3) | 4.0 (3.6–4.3) | ||
| Kidney donor status | 0.047 | |||
| - Non-ECD deceased | 17,052 (75) | 1030 (77) | 16,022 (75) | |
| - ECD deceased | 2482 (11) | 145 (11) | 2337 (11) | |
| - Living | 3153 (14) | 155 (12) | 2998 (14) | |
| Donor age | 38.4 ± 4.8 | 38.2 ± 15.0 | 38.2 ± 14.8 | 0.99 |
| 38 (27–50) | 39 (27–50) | 38 (27–50) | ||
| Donor male sex | 13,064 (58) | 796 (60) | 12,268 (57) | 0.08 |
| Donor race | 0.57 | |||
| - White | 13,784 (61) | 817 (61) | 12,967 (61) | |
| - African American | 5918 (26) | 328 (25) | 5590 (26) | |
| - Hispanic | 2266 (10) | 143 (11) | 2123 (10) | |
| - Other | 719 (3) | 42 (3) | 677 (3) | |
| History of hypertension in donor | 5477 (24) | 310 (23) | 5167 (24) | 0.46 |
| KDPI | 0.02 | |||
| - Living donor | 3153 (14) | 155 (12) | 2998 (14) | |
| - KDPI < 85 | 17,892 (79) | 1093 (82) | 16,889 (79) | |
| - KDPI ≥ 85 | 1552 (7) | 82 (6) | 1470 (7) | |
| HLA mismatch | ||||
| - A | 2 (1–2) | 2 (1–2) | 2 (1–2) | 0.64 |
| - B | 2 (1–2) | 2 (1–2) | 2 (1–2) | 0.48 |
| - DR | 1 (1–2) | 1 (1–2) | 1 (1–2) | <0.001 |
| - ABDR | 5 (4–5) | 5 (4–5) | 5 (4–5) | 0.008 |
| Cold ischemia time | 15.8 ± 9.8 | 16.1 ± 9.5 | 15.8 ± 9.8 | 0.41 |
| 15.5 (9.1–21.7) | 15.2 (9.8–21.4) | 15.5 (9.0–21.7) | ||
| Allocation type | 0.03 | |||
| - Local | 16,718 (74) | 973 (73) | 15,745 (74) | |
| - Regional | 2821 (12) | 142 (11) | 2679 (13) | |
| - National | 3147 (14) | 215 (16) | 2633 (14) | |
| Kidney on pump | 9496 (42) | 557 (42) | 8939 (42) | 0.99 |
| Delay graft function | 6720 (30) | 494 (37) | 6226 (29) | <0.001 |
| EBV status | 0.54 | |||
| - Low risk | 122 (1) | 5 (0.4) | 117 (0.5) | |
| - Moderate risk | 21,200 (93) | 1239 (93) | 19,961 (93) | |
| - High risk | 1365 (6) | 86 (6) | 1279 (6) | |
| CMV status | 0.55 | |||
| - D-/R- | 2531 (11) | 149 (11) | 2382 (11) | |
| - D-/R+ | 6554 (29) | 374 (28) | 6180 (29) | |
| - D+/R+ | 10,398 (46) | 632 (48) | 9766 (46) | |
| - D+/R- | 3204 (14) | 175 (13) | 3029 (14) | |
| Induction immunosuppression | ||||
| - Thymoglobulin | 14,376 (63) | 803 (60) | 13,573 (64) | 0.02 |
| - Alemtuzumab | 3792 (18) | 197 (15) | 3595 (17) | 0.05 |
| - Basiliximab | 3684 (16) | 289 (22) | 3395 (16) | <0.001 |
| - Other | 328 (1) | 9 (0.7) | 319 (1) | 0.02 |
| - No induction | 1547 (7) | 96 (7) | 1451 (7) | 0.55 |
| Maintenance Immunosuppression | ||||
| - Tacrolimus | 20,689 (91) | 1203 (90) | 19,486 (91) | 0.33 |
| - Cyclosporine | 184 (1) | 19 (1) | 165 (1) | 0.01 |
| - Mycophenolate | 20,907 (92) | 1250 (94) | 19,657 (92) | 0.01 |
| - Azathioprine | 65 (0.3) | 8 (0.6) | 57 (0.3) | 0.03 |
| - mTOR inhibitors | 62 (0.3) | 8 (0.6) | 54 (0.3) | 0.02 |
| - Steroid | 16,131 (71) | 954 (72) | 15,177 (71) | 0.60 |
| Variable | Univariate Analysis | Multivariate Analysis | ||
|---|---|---|---|---|
| OR (95% CI) | p-Value | OR (95% CI) | p-Value | |
| Recipient Age (per 5-year increase) | 0.89 (0.87–0.91) | <0.001 | 0.88 (0.86–0.90) | <0.001 |
| Recipient male sex | 1.06 (0.95–1.19) | 0.31 | ||
| ABO blood group | ||||
| - A | 0.92 (0.81–1.05) | 0.23 | ||
| - B | 0.89 (0.76–1.04) | 0.13 | ||
| - AB | 0.87 (0.68–1.13) | 0.30 | ||
| - O | 1 (ref) | - | ||
| Body mass index (kg/m2) | 0.98 (0.93–1.03) | 0.34 | ||
| Kidney retransplant | 1.75 (1.51–2.04) | <0.001 | 1.50 (1.24–1.81) | <0.001 |
| Dialysis duration | ||||
| - Preemptive or <1 year | 1 (ref) | - | 1 (ref) | - |
| - 1–3 years | 1.38 (1.12–1.69) | 0.002 | 1.28 (1.04–1.58) | 0.02 |
| - >3 years | 1.41 (1.19–1.68) | <0.001 | 1.26 (1.04–1.51) | 0.02 |
| Cause of end-stage kidney disease | ||||
| - Diabetes mellitus | 0.87 (0.75–1.00) | 0.055 | ||
| - Hypertension | 1 (ref) | |||
| - Glomerular disease | 1.34 (1.15–1.56) | <0.001 | ||
| - PKD | 0.76 (0.54–1.08) | 0.11 | ||
| - Other | 1.34 (1.13–1.57) | <0.001 | ||
| Comorbidity | ||||
| - Diabetes mellitus | 0.79 (0.70–0.89) | <0.001 | ||
| - Malignancy | 0.91 (0.72–1.13) | 0.39 | ||
| - Peripheral vascular disease | 0.86 (0.70–1.05) | 0.13 | ||
| - PRA | ||||
| - 0 | 1 (ref) | - | 1 (ref) | - |
| - 1–20 | 1.18 (0.98–1.42) | 0.09 | 1.18 (0.98–1.43) | 0.08 |
| - 21–80 | 0.96 (0.81–1.12) | 0.59 | 0.97 (0.82–1.14) | 0.69 |
| - 81–100 | 1.51 (1.31–1.74) | <0.001 | 1.39 (1.16–1.67) | <0.001 |
| Positive HCV serostatus | 1.12 (0.92–1.36) | 0.25 | ||
| Positive HBs antigen | 0.90 (0.56–1.45) | 0.65 | ||
| Positive HIV serostatus | 1.57 (1.21–2.02) | 0.001 | 1.35 (1.03–1.76) | 0.03 |
| Functional status <80% | 1.01 (0.90–1.13) | 0.85 | ||
| Working income | 0.90 (0.79–1.02) | 0.11 | ||
| Public insurance | 1.20 (1.03–1.39) | 0.02 | ||
| US resident | 1.81 (0.57–5.73) | 0.31 | ||
| Undergraduate education or above | 0.94 (0.84–1.05) | 0.28 | ||
| Serum albumin (per 1-g/dL increase) | 0.95 (0.86–1.05) | 0.33 | ||
| Kidney donor status | ||||
| - Non-ECD deceased | 1 (ref) | - | 1 (ref) | - |
| - ECD deceased | 0.97 (0.81–1.15) | 0.70 | 1.23 (1.02–1.48) | 0.03 |
| - Living | 0.80 (0.68–0.96) | 0.01 | 0.98 (0.80–1.19) | 0.82 |
| Donor age | 1.00 (0.98–1.02) | 0.99 | ||
| Donor male sex | 1.10 (0.99–1.24) | 0.08 | ||
| Donor race | ||||
| - White | 1 (ref) | - | ||
| - African American | 0.93 (0.82–1.06) | 0.29 | ||
| - Hispanic | 1.07 (0.89–1.28) | 0.48 | ||
| - Other | 0.98 (0.72–1.36) | 0.92 | ||
| History of hypertension in donor | 0.95 (0.84–1.09) | 0.46 | ||
| KDPI | ||||
| - Living donor | 0.80 (0.67–0.95) | 0.01 | ||
| - KDPI < 85 | 1 (ref) | - | ||
| - KDPI ≥ 85 | 0.86 (0.68–1.09) | 0.20 | ||
| HLA A mismatch | ||||
| - 0 | 1 (ref) | - | ||
| - 1 | 1.37 (1.08–1.73) | 0.01 | ||
| - 2 | 1.29 (1.02–1.63) | 0.03 | ||
| HLA B mismatch | ||||
| - 0 | 1 (ref) | - | ||
| - 1 | 1.23 (0.91–1.67) | 0.19 | ||
| - 2 | 1.24 (0.92–1.66) | 0.16 | ||
| HLA DR mismatch | ||||
| - 0 | 1 (ref) | - | ||
| - 1 | 1.25 (1.02–1.53) | 0.03 | ||
| - 2 | 1.49 (1.22–1.82) | <0.001 | ||
| HLA ABDR mismatch | ||||
| - 0 | 1 (ref) | - | 1 (ref) | - |
| - 1 | 3.05 (1.11–8.37) | 0.03 | 2.84 (1.03–7.81) | 0.04 |
| - 2 | 4.24 (1.82–9.87) | 0.001 | 4.43 (1.90–10.34) | <0.001 |
| - 3 | 3.88 (1.71–8.83) | 0.001 | 4.37 (1.92–9.97) | <0.001 |
| - 4 | 3.69 (1.64–8.33) | 0.002 | 4.32 (1.91–9.80) | <0.001 |
| - 5 | 4.14 (1.84–9.31) | 0.001 | 5.10 (2.25–11.54) | <0.001 |
| - 6 | 4.42 (1.95–9.98) | <0.001 | 5.63 (2.48–12.80) | <0.001 |
| Cold ischemia time | 1.00 (0.99–1.01) | 0.42 | ||
| Allocation type | ||||
| - Local | 1 (ref) | - | ||
| - Regional | 0.86 (0.72–1.03) | 0.10 | ||
| - National | 1.19 (1.02–1.38) | 0.03 | ||
| Kidney on pump | 1.00 (0.89–1.12) | 0.99 | ||
| Delay graft function | 1.44 (1.28–1.61) | <0.001 | 1.44 (1.28–1.62) | <0.001 |
| EBV status | ||||
| - Low risk | 0.69 (0.28–1.69) | 0.41 | ||
| - Moderate risk | 1 (ref) | - | ||
| - High risk | 1.08 (0.86–1.36) | 0.49 | ||
| CMV status | ||||
| - D−/R− | 0.97 (0.80–1.16) | 0.72 | ||
| - D−/R+ | 0.94 (0.82–1.07) | 0.32 | ||
| - D+/R+ | 1 (ref) | - | ||
| - D+/R− | 0.89 (0.75–1.06) | 0.20 | ||
| Induction immunosuppression | ||||
| - Thymoglobulin | 0.87 (0.78–0.98) | 0.02 | ||
| - Alemtuzumab | 0.86 (0.74–1.00) | 0.05 | 0.80 (0.68–0.95) | 0.01 |
| - Basiliximab | 1.47 (1.28–1.68) | <0.001 | 0.79 (0.64–0.98) | 0.03 |
| - Other | 0.45 (0.23–0.87) | 0.01 | 1.40 (1.17–1.67) | <0.001 |
| - No induction | 1.07 (0.86–1.32) | 0.55 | ||
| Maintenance Immunosuppression | ||||
| - Tacrolimus | 0.91 (0.75–1.10) | 0.33 | ||
| - Cyclosporine | 1.86 (1.15–3.00) | 0.01 | 2.33 (1.42–3.82) | 0.002 |
| - Mycophenolate | 1.35 (1.07–1.70) | 0.01 | 0.02 | |
| - Azathioprine | 2.26 (1.08–4.75) | 0.03 | 2.70 (1.24–5.87) | 0.02 |
| - mTOR inhibitors | 2.39 (1.13–5.03) | 0.02 | 2.65 (1.24–5.66) | |
| - Steroid | 1.03 (0.91–1.17) | 0.60 | ||
| Variable | Mean Minimal Depth | Number of Nodes | Accuracy Decrease | Gini Decrease | Number of Trees | Times_a_Root * | p Value |
|---|---|---|---|---|---|---|---|
| BMI | 3.1920 | 72,508 | 0.0010 | 236.4036 | 500 | 13 | <0.001 |
| Cold ischemia time | 3.1200 | 73,014 | 0.0040 | 236.2731 | 500 | 15 | <0.001 |
| Age | 2.2080 | 65,930 | 0.0036 | 203.8359 | 500 | 64 | <0.001 |
| Donor age | 3.4700 | 67,340 | 0.0022 | 202.5135 | 500 | 5 | <0.001 |
| Serum albumin | 3.3020 | 61,652 | 0.0005 | 176.4404 | 500 | 14 | <0.001 |
| PRA | 3.2120 | 40,174 | 0.0017 | 113.1232 | 500 | 38 | <0.001 |
| Education level | 3.7800 | 32,605 | 0.0001 | 82.5028 | 500 | 20 | <0.001 |
| CMV status | 4.3320 | 32,808 | 0.0002 | 82.0938 | 500 | 1 | <0.001 |
| ABO blood type | 4.6260 | 31,967 | −0.0000 | 78.2775 | 500 | 2 | <0.001 |
| Total HLA mismatch | 3.9760 | 33,012 | 0.0017 | 77.9731 | 500 | 9 | <0.001 |
| Cause of ESKD | 3.3980 | 28,985 | 0.0019 | 73.6816 | 500 | 43 | <0.001 |
| Dialysis duration | 4.2220 | 21,608 | 0.0008 | 52.6351 | 500 | 11 | <0.001 |
| HLA DR mismatch | 4.2940 | 20,334 | 0.0009 | 45.7800 | 500 | 16 | <0.001 |
| HLA A mismatch | 5.0020 | 19,639 | 0.0003 | 43.1578 | 500 | 4 | <0.001 |
| Allocation type | 5.0260 | 16,622 | 0.0011 | 38.9588 | 500 | 7 | 1.00 |
| HLA B mismatch | 5.3220 | 16,180 | 0.0008 | 37.2973 | 500 | 0 | 1.00 |
| Functional status | 5.9100 | 17,307 | 0.0000 | 36.0106 | 500 | 0 | 1.00 |
| Donor male | 5.7640 | 16,565 | −0.0000 | 33.6225 | 500 | 0 | 1.00 |
| Kidney pump use | 6.1100 | 15,487 | 0.0008 | 31.9330 | 500 | 0 | 1.00 |
| Steroid use | 5.9380 | 14,707 | 0.0004 | 31.7875 | 500 | 0 | 1.00 |
| Male | 5.7760 | 15,622 | 0.0004 | 31.6972 | 500 | 0 | 1.00 |
| Working for income | 5.9480 | 13,230 | 0.0004 | 28.1003 | 500 | 0 | 1.00 |
| Donor White | 6.1580 | 13,616 | 0.0003 | 27.706 | 500 | 0 | 1.00 |
| Hypertensive donor | 6.3700 | 12,578 | 0.0006 | 26.6712 | 500 | 0 | 1.00 |
| Thymoglobulin induction | 5.7580 | 12,740 | 0.0004 | 26.2509 | 500 | 2 | 1.00 |
| DGF | 3.7540 | 10,816 | 0.0013 | 25.4752 | 500 | 40 | 1.00 |
| Donor status | 5.4620 | 11,189 | 0.0019 | >25.2774 | 500 | 4 | 1.00 |
| Donor black | 6.3460 | 11,570 | 0.0004 | 24.1010 | 500 | 0 | 1.00 |
| DM | 5.7140 | 11,370 | 0.0012 | 23.5846 | 500 | 18 | 1.00 |
| KDPI group | 5.5320 | 9255 | 0.0020 | 21.5138 | 500 | 7 | 1.00 |
| Public insurance | 6.2720 | 9871 | 0.0001 | 21.2143 | 500 | 1 | 1.00 |
| Basiliximab induction | 3.7560 | 7713 | 0.0008 | 20.5859 | 500 | 39 | 1.00 |
| Tacrolimus use | 6.4760 | 7983 | 0.0002 | 19.4706 | 500 | 0 | 1.00 |
| Alemtuzumab induction | 6.6840 | 8913 | 0.0005 | 19.2899 | 500 | 2 | 1.00 |
| EBV status | 6.2540 | 7302 | −0.0000 | 19.1136 | 500 | 0 | 1.00 |
| Recipient HCV serostatus | 6.3560 | 7444 | 0.0003 | 18.7719 | 500 | 1 | 1.00 |
| Donor Hispanic | 6.5880 | 8153 | 0.0000 | 18.6623 | 500 | 1 | 1.00 |
| PVD | 6.8200 | 7303 | 0.0001 | 17.0666 | 500 | 0 | 1.00 |
| Malignancy | 6.9220 | 6275 | 0.0001 | 15.7198 | 500 | 1 | 1.00 |
| Number of transplants | 4.3420 | 4851 | 0.0019 | 15.5554 | 500 | 38 | 1.00 |
| No induction | 7.1900 | 6050 | −0.0000 | 14.4486 | 500 | 0 | 1.00 |
| Recipient HIV serostatus | 6.0180 | 4810 | 0.0003 | 13.8118 | 500 | 6 | 1.00 |
| MMF use | 6.5580 | 5683 | 0.0002 | 13.6395 | 500 | 2 | 1.00 |
| Donor- other race | 7.7300 | 3861 | −0.0000 | 10.5321 | 500 | 0 | 1.00 |
| Preemptive transplant | 7.3320 | 4415 | 0.0001 | 9.7186 | 500 | 4 | 1.00 |
| Retransplant | 5.6520 | 3136 | 0.0019 | 9.2727 | 466 | 61 | 1.00 |
| Cyclosporine use | 6.5829 | 2157 | 0.0001 | 7.7893 | 499 | 4 | 1.00 |
| Recipient HBs antigen | 8.1428 | 2137 | −0.0000 | 6.6728 | 497 | 0 | 1.00 |
| mTORi use | 7.5623 | 1253 | 0.0000 | 4.8298 | 489 | 4 | 1.00 |
| Azathioprine use | 7.6357 | 1154 | 0.0000 | 4.6491 | 479 | 2 | 1.00 |
| Other induction | 10.9853 | 1263 | 0.0000 | 3.2797 | 471 | 0 | 1.00 |
| US resident | 12.5317 | 484 | −0.0000 | 1.5589 | 328 | 1 | 1.00 |
| Variable | Root Variable | Mean Minimal Depth | Occurrences | Interaction | Unconditional Mean Minimal Depth |
|---|---|---|---|---|---|
| Recipient Age | Age | 2.4218 | 467 | Age:Age | 2.2080 |
| Donor age | Age | 2.4069 | 467 | Age:Donor age | 3.4700 |
| Serum albumin | Age | 2.6582 | 461 | Age:Serum albumin | 3.3020 |
| BMI | Age | 2.7236 | 460 | Age:BMI | 3.1920 |
| Cold ischemia time | Age | 2.5770 | 459 | Age:Cold ischemia time | 3.1200 |
| CMV status | Age | 3.9216 | 452 | Age:CMV status | 4.3320 |
| ABO | Age | 4.2978 | 449 | Age:ABO | 4.6260 |
| Education level | Age | 3.8707 | 448 | Age:Education level | 3.7800 |
| PRA | Age | 3.6716 | 448 | Age:PRA | 3.2120 |
| Total HLA mismatch | Age | 3.9931 | 446 | Age:Total HLA mismatch | 3.9760 |
| Cause of ESKD | Age | 4.4647 | 442 | Age:Cause of ESKD | 3.3980 |
| HLA-A mismatch | Age | 5.4840 | 433 | Age:HLA-A mismatch | 5.0020 |
| HLA-DR mismatch | Age | 5.3943 | 431 | Age:HLA-DR mismatch | 4.2940 |
| Dialysis duration | Age | 5.2511 | 429 | Age:Dialysis duration | 4.2220 |
| Functional status | Age | 6.5738 | 426 | Age:Functional status | 5.9100 |
| HLA-B mismatch | Age | 5.9078 | 426 | Age:HLA-B mismatch | 5.3220 |
| Steroid use | Age | 6.4615 | 425 | Age:Steroid use | 5.9380 |
| Working for income | Age | 6.6328 | 425 | Age:Working for income | 5.9480 |
| Donor male | Age | 6.6333 | 421 | Age:Donor male | 5.7640 |
| BMI | Cold ischemia time | 4.0932 | 418 | Cold ischemia time:BMI | 3.1920 |
| Age | Cold ischemia time | 4.0842 | 417 | Cold ischemia time:Age | 2.2080 |
| Serum albumin | Cold ischemia time | 4.2897 | 417 | Cold ischemia time:Serum albumin | 3.3020 |
| Kidney pump use | Age | 7.2689 | 416 | Age:Kidney pump use | 6.1100 |
| Allocation.type | Age | 6.4040 | 414 | Age:Allocation type | 5.0260 |
| Male | Age | 7.0507 | 414 | Age:Male | 5.7760 |
| Donor age | Cold ischemia time | 4.5872 | 412 | Cold ischemia time:Donor age | 3.4700 |
| Donor White | Age | 7.3541 | 411 | Age:Donor White | 6.1580 |
| BMI | PRA | 4.1529 | 411 | PRA:BMI | 3.1920 |
| Cold ischemia time | Cold ischemia time | 4.3130 | 407 | Cold ischemia time:Cold ischemia time | 3.1200 |
| Public insurance | Age | 7.6620 | 406 | Age:Public insurance | 6.2720 |
Publisher’s Note: MDPI stays neutral with regard to jurisdictional claims in published maps and institutional affiliations. |
© 2021 by the authors. Licensee MDPI, Basel, Switzerland. This article is an open access article distributed under the terms and conditions of the Creative Commons Attribution (CC BY) license (https://creativecommons.org/licenses/by/4.0/).
Share and Cite
Thongprayoon, C.; Jadlowiec, C.C.; Leeaphorn, N.; Bruminhent, J.; Acharya, P.C.; Acharya, C.; Pattharanitima, P.; Kaewput, W.; Boonpheng, B.; Cheungpasitporn, W. Feature Importance of Acute Rejection among Black Kidney Transplant Recipients by Utilizing Random Forest Analysis: An Analysis of the UNOS Database. Medicines 2021, 8, 66. https://0-doi-org.brum.beds.ac.uk/10.3390/medicines8110066
Thongprayoon C, Jadlowiec CC, Leeaphorn N, Bruminhent J, Acharya PC, Acharya C, Pattharanitima P, Kaewput W, Boonpheng B, Cheungpasitporn W. Feature Importance of Acute Rejection among Black Kidney Transplant Recipients by Utilizing Random Forest Analysis: An Analysis of the UNOS Database. Medicines. 2021; 8(11):66. https://0-doi-org.brum.beds.ac.uk/10.3390/medicines8110066
Chicago/Turabian StyleThongprayoon, Charat, Caroline C. Jadlowiec, Napat Leeaphorn, Jackrapong Bruminhent, Prakrati C. Acharya, Chirag Acharya, Pattharawin Pattharanitima, Wisit Kaewput, Boonphiphop Boonpheng, and Wisit Cheungpasitporn. 2021. "Feature Importance of Acute Rejection among Black Kidney Transplant Recipients by Utilizing Random Forest Analysis: An Analysis of the UNOS Database" Medicines 8, no. 11: 66. https://0-doi-org.brum.beds.ac.uk/10.3390/medicines8110066