
The Impact of the COVID-19 Pandemic on Medical Imaging Case Volumes in Aseer Region: A Retrospective Study

 , , , ,
Abstract
:1. Introduction
2. Materials and Methods
3. Results
4. Discussion
5. Conclusions
Author Contributions
Funding
Institutional Review Board Statement
Informed Consent Statement
Acknowledgments
Conflicts of Interest
References
- Cavallo, J.J.; Forman, H.P. The Economic Impact of the COVID-19 Pandemic on Radiology Practices. Radiology 2020, 296, E141–E144. [Google Scholar] [CrossRef] [PubMed] [Green Version]
- Yezli, S.; Khan, A. COVID-19 social distancing in the Kingdom of Saudi Arabia: Bold measures in the face of political, economic, social and religious challenges. Travel Med. Infect. Dis. 2020, 37, 101692. [Google Scholar] [CrossRef] [PubMed]
- Viner, R.M.; Russell, S.J.; Croker, H.; Packer, J.; Ward, J.; Stansfield, C.; Mytton, O.; Bonell, C.; Booy, R. School closure and management practices during coronavirus outbreaks including COVID-19: A rapid systematic review. Lancet Child Adolesc. Health 2020, 4, 397–404. [Google Scholar] [CrossRef]
- Naidich, J.J.; Boltyenkov, A.; Wang, J.J.; Chusid, J.; Hughes, D.; Sanelli, P.C. Impact of the Coronavirus Disease 2019 (COVID-19) Pandemic on Imaging Case Volumes. J. Am. Coll. Radiol. JACR 2020, 17, 865–872. [Google Scholar] [CrossRef] [PubMed]
- Rubin, G.D.; Ryerson, C.J.; Haramati, L.B.; Sverzellati, N.; Kanne, J.P.; Raoof, S.; Schluger, N.W.; Volpi, A.; Yim, J.-J.; Martin, I.B.K.; et al. The Role of Chest Imaging in Patient Management During the COVID-19 Pandemic: A Multinational Consensus Statement From the Fleischner Society. Radiology 2020, 296, 172–180. [Google Scholar] [CrossRef] [PubMed] [Green Version]
- Mossa-Basha, M.; Deese, J.; Vincic, D.; Sahani, D.V. Coronavirus Disease 2019 (COVID-19): Radiology Department Financial Impact and Planning for Post-COVID Recovery. J. Am. Coll. Radiol. 2020, 17, 894–898. [Google Scholar] [CrossRef] [PubMed]
- Houshyar, R.; Tran-Harding, K.; Glavis-Bloom, J.; Nguyentat, M.; Mongan, J.; Chahine, C.; Loehfelm, T.W.; Kohli, M.D.; Zaragoza, E.J.; Murphy, P.M.; et al. Effect of shelter-in-place on emergency department radiology volumes during the COVID-19 pandemic. Emerg. Radiol. 2020, 27, 781–784. [Google Scholar] [CrossRef] [PubMed]
- Agarwal, M.; Udare, A.; Alabousi, A.; van der Pol, C.B.; Ramonas, L.; Mascola, K.; Edmonds, B.; Ramonas, M. Impact of the COVID-19 pandemic on emergency CT head utilization in Ontario-an observational study of tertiary academic hospitals. Emerg. Radiol. 2020, 27, 791–797. [Google Scholar] [CrossRef] [PubMed]
- Chou, C.; Pan, H.; Yang, T.; Chiang, C.; Huang, J.; Tsai, M. Impact of the COVID-19 pandemic on the volume of mammography examinations in Southern Taiwan. Breast J. 2021, 27, 89–91. [Google Scholar] [CrossRef] [PubMed]
- Hanna, T.N.; Kundu, S.; Singh, K.; Horný, M.; Wood, D.; Prater, A.; Duszak, R. Emergency department imaging superusers. Emerg. Radiol. 2019, 26, 161–168. [Google Scholar] [CrossRef] [PubMed]
- Christey, G.; Amey, J.; Campbell, A.; Smith, A. Variation in volumes and characteristics of trauma patients admitted to a level one trauma centre during national level 4 lockdown for COVID-19 in New Zealand. N. Z. Med. J. 2020, 133, 81–88. [Google Scholar] [PubMed]
- Lazzerini, M.; Barbi, E.; Apicella, A.; Marchetti, F.; Cardinale, F.; Trobia, G. Delayed access or provision of care in Italy resulting from fear of COVID-19. Lancet Child Adolesc. Health 2020, 4, e10–e11. [Google Scholar] [CrossRef]
- Chang, H.-J.; Huang, N.; Lee, C.-H.; Hsu, Y.-J.; Hsieh, C.-J.; Chou, Y.-J. The impact of the SARS epidemic on the utilization of medical services: SARS and the fear of SARS. Am. J. Public Health 2004, 94, 562–564. [Google Scholar] [CrossRef] [PubMed]
- Bres Bullrich, M.; Fridman, S.; Mandzia, J.L.; Mai, L.M.; Khaw, A.; Vargas Gonzalez, J.C.; Bagur, R.; Sposato, L.A. COVID-19: Stroke Admissions, Emergency Department Visits, and Prevention Clinic Referrals. Can. J. Neurol. Sci. 2020, 47, 693–696. [Google Scholar] [CrossRef] [PubMed]
- Feral-Pierssens, A.-L.; Claret, P.-G.; Chouihed, T. Collateral damage of the COVID-19 outbreak: Expression of concern. Eur. J. Emerg. Med. 2020, 27, 233–234. [Google Scholar] [CrossRef] [PubMed]
- Kansagra, A.P.; Goyal, M.S.; Hamilton, S.; Albers, G.W. Collateral Effect of COVID-19 on Stroke Evaluation in the United States. N. Engl. J. Med. 2020, 383, 400–401. [Google Scholar] [CrossRef] [PubMed]


| Year | 2019 | 2020 | ||||||
|---|---|---|---|---|---|---|---|---|
| Months | January–March | April–June | July–September | October–December | January–March | April–June | July–September | October–December |
| Total volume | 50,681 | 47,337 | 48,599 | 55,468 | 53,860 | 27,042 | 27,043 | 51,162 |
| Patient location | ||||||||
| Emergency | 19,431 | 16,128 | 16,564 | 19,062 | 18,533 | 12,075 | 13,486 | 17,528 |
| Inpatient | 9119 | 9051 | 8875 | 8844 | 8936 | 9669 | 5188 | 8190 |
| Outpatient | 22,131 | 22,158 | 23,160 | 27,562 | 26,391 | 5298 | 8326 | 25,444 |
| Modality type | ||||||||
| X-ray | 34,213 | 31,570 | 31,941 | 36,323 | 35,434 | 20,213 | 19,123 | 31,718 |
| CT | 7641 | 7296 | 7903 | 9073 | 8546 | 4676 | 5118 | 9276 |
| MRI | 2484 | 2965 | 3236 | 3672 | 3694 | 788 | 1022 | 3646 |
| Ultrasound | 6046 | 5313 | 5240 | 5989 | 5834 | 1275 | 1669 | 5992 |
| Interventional | 74 | 41 | 45 | 68 | 79 | 33 | 26 | 103 |
| Nuclear Medicine | 6 | 5 | 3 | 7 | 11 | 0 | 5 | 53 |
| Mammography | 217 | 147 | 231 | 336 | 262 | 57 | 80 | 374 |
| Year | Percent Change in 2020 Imaging Volumes Compared to 2019 | |||
|---|---|---|---|---|
| Months | January–March | April–June | July–September | October–December |
| Total volume | +6.27% | −42.87% | −44.35% | −7.76% |
| Patient location | ||||
| Emergency | −4.62% | −25.13% | −18.58% | −8.05% |
| Inpatient | −2.01% | +6.83% | −41.54% | −7.39% |
| Outpatient | +19.25% | −76.09% | −64.05% | −7.68% |
| Modality type | ||||
| X-ray | +3.57% | −35.97% | −40.13% | −12.68% |
| CT | +11.84% | −35.91% | −35.24% | +2.24% |
| MRI | +48.71% | −73.42% | −68.42% | −0.71% |
| Ultrasound | −3.51% | −76% | −68.15% | +0.05% |
| Interventional | +6.76% | −19.51% | −42.22% | +51.47% |
| Nuclear Medicine | +83.33% | −100% | +66.67% | +657.14% |
| Mammography | +20.74% | −61.22% | −65.37% | +11.31% |
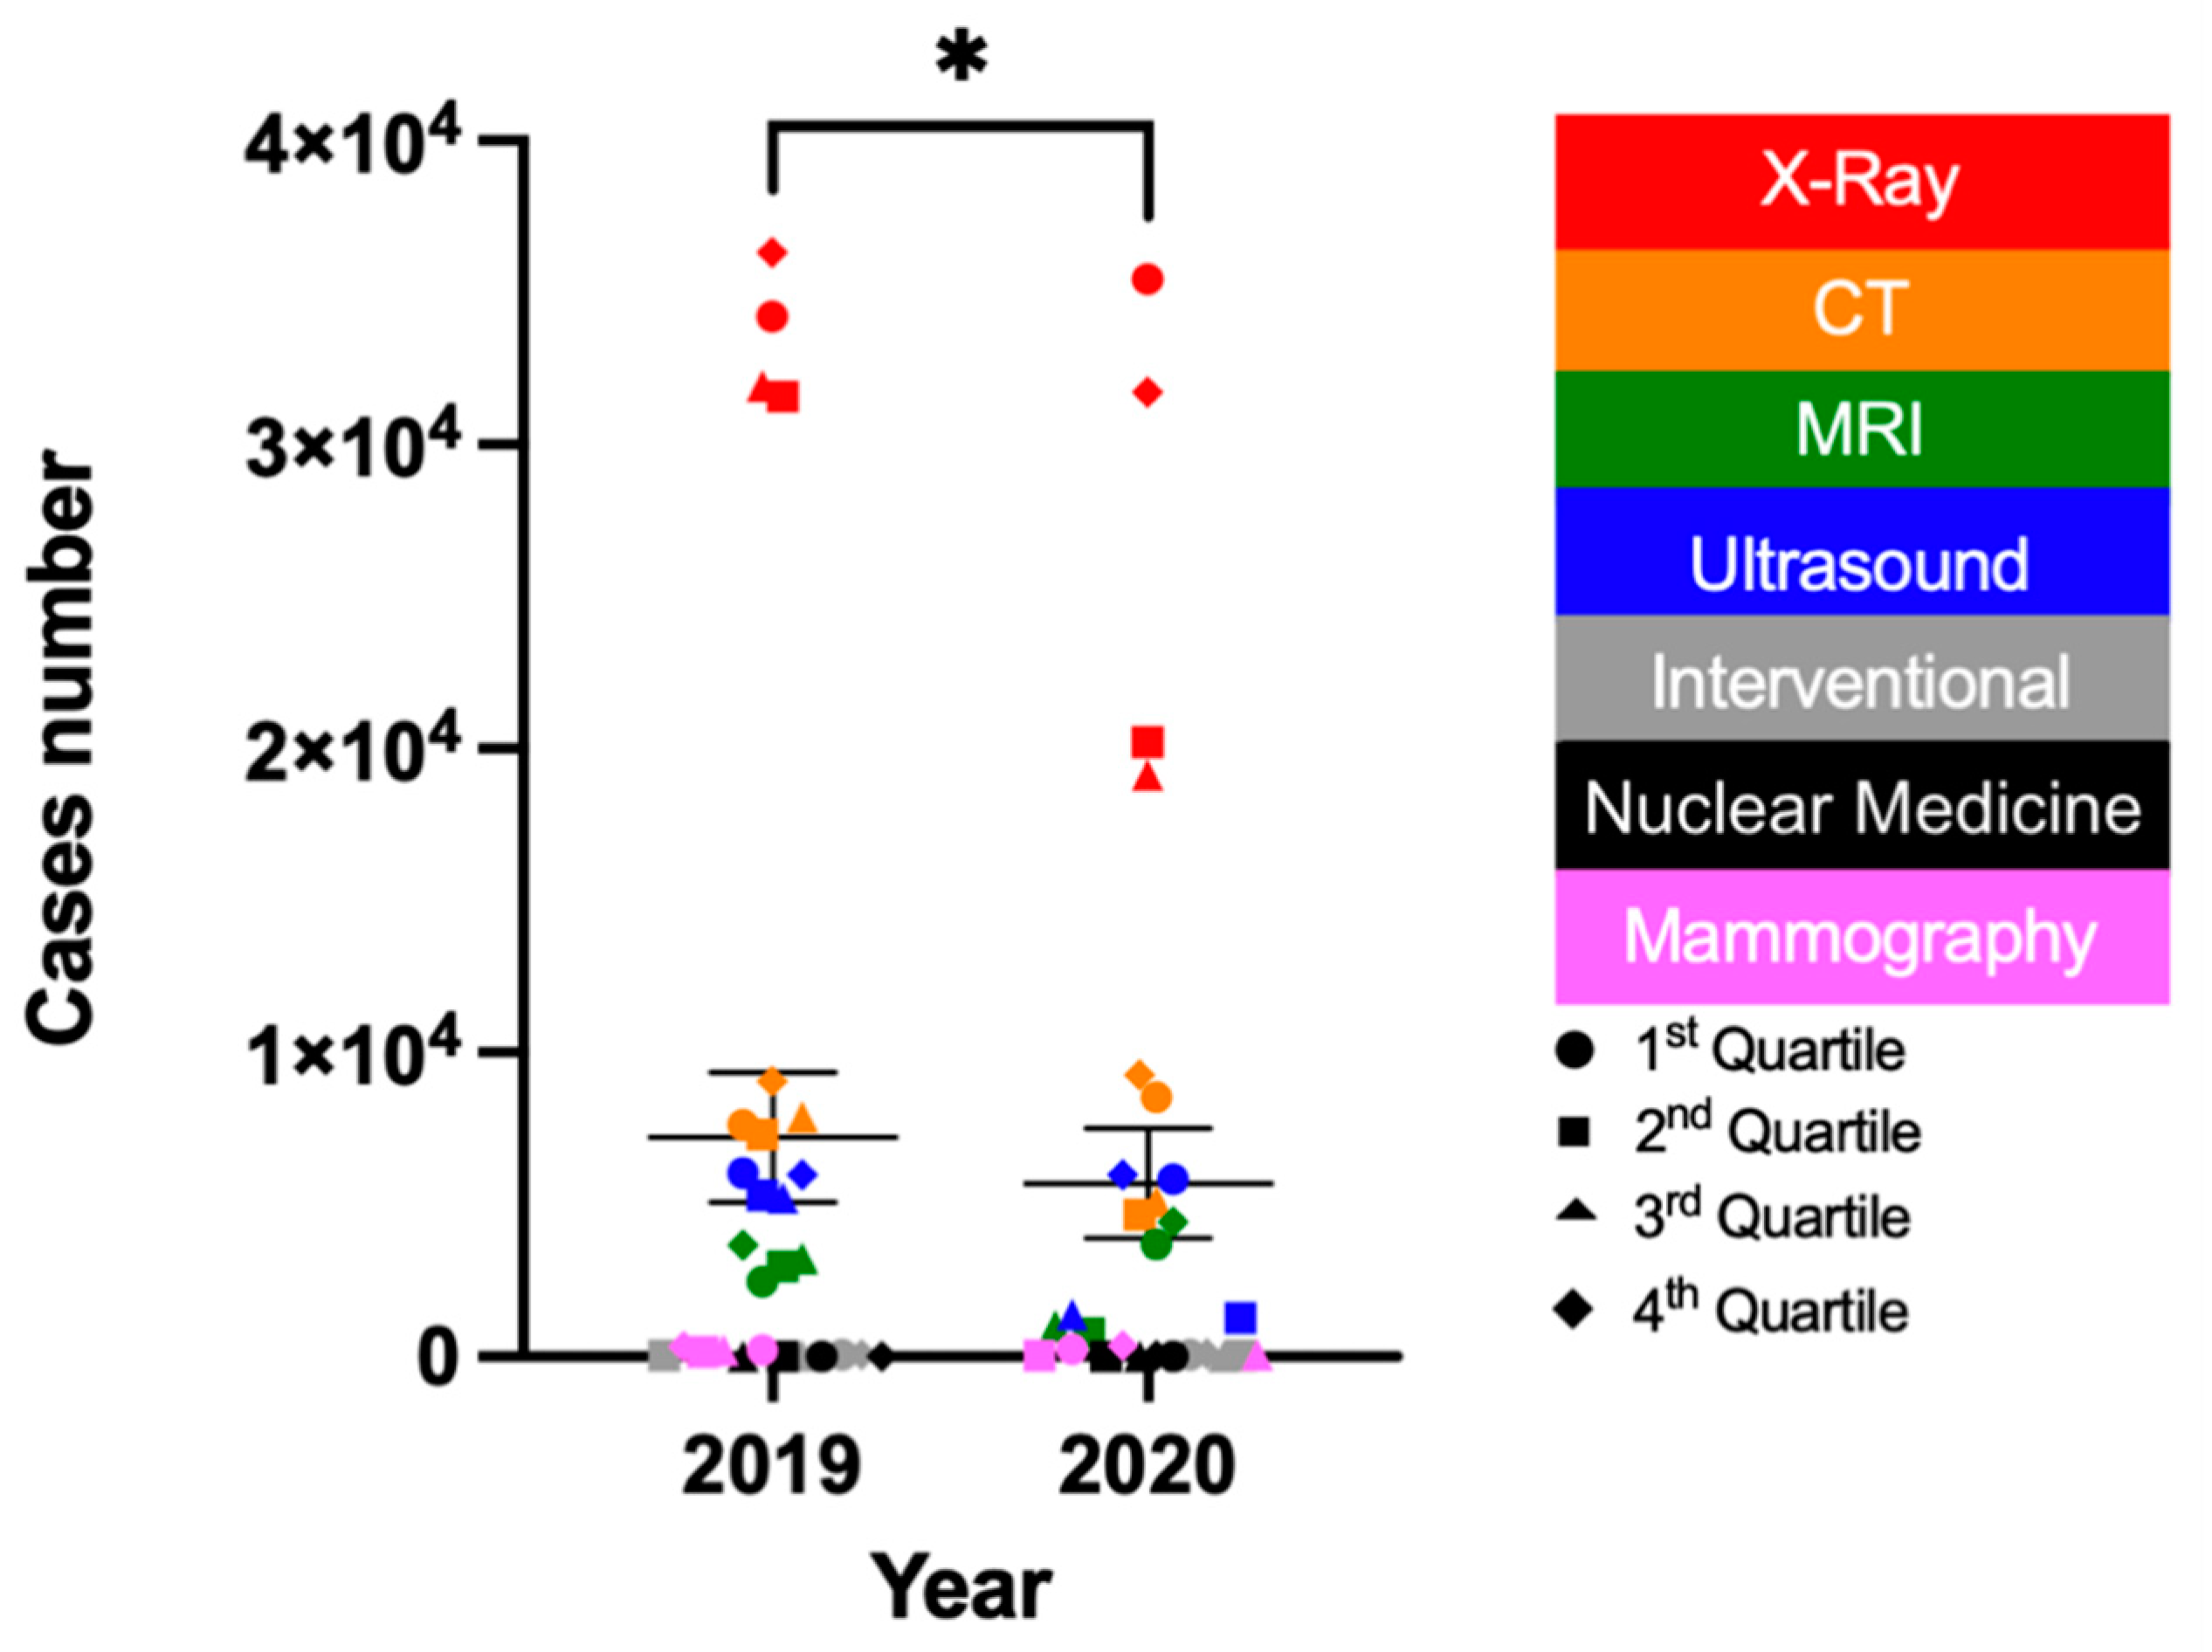
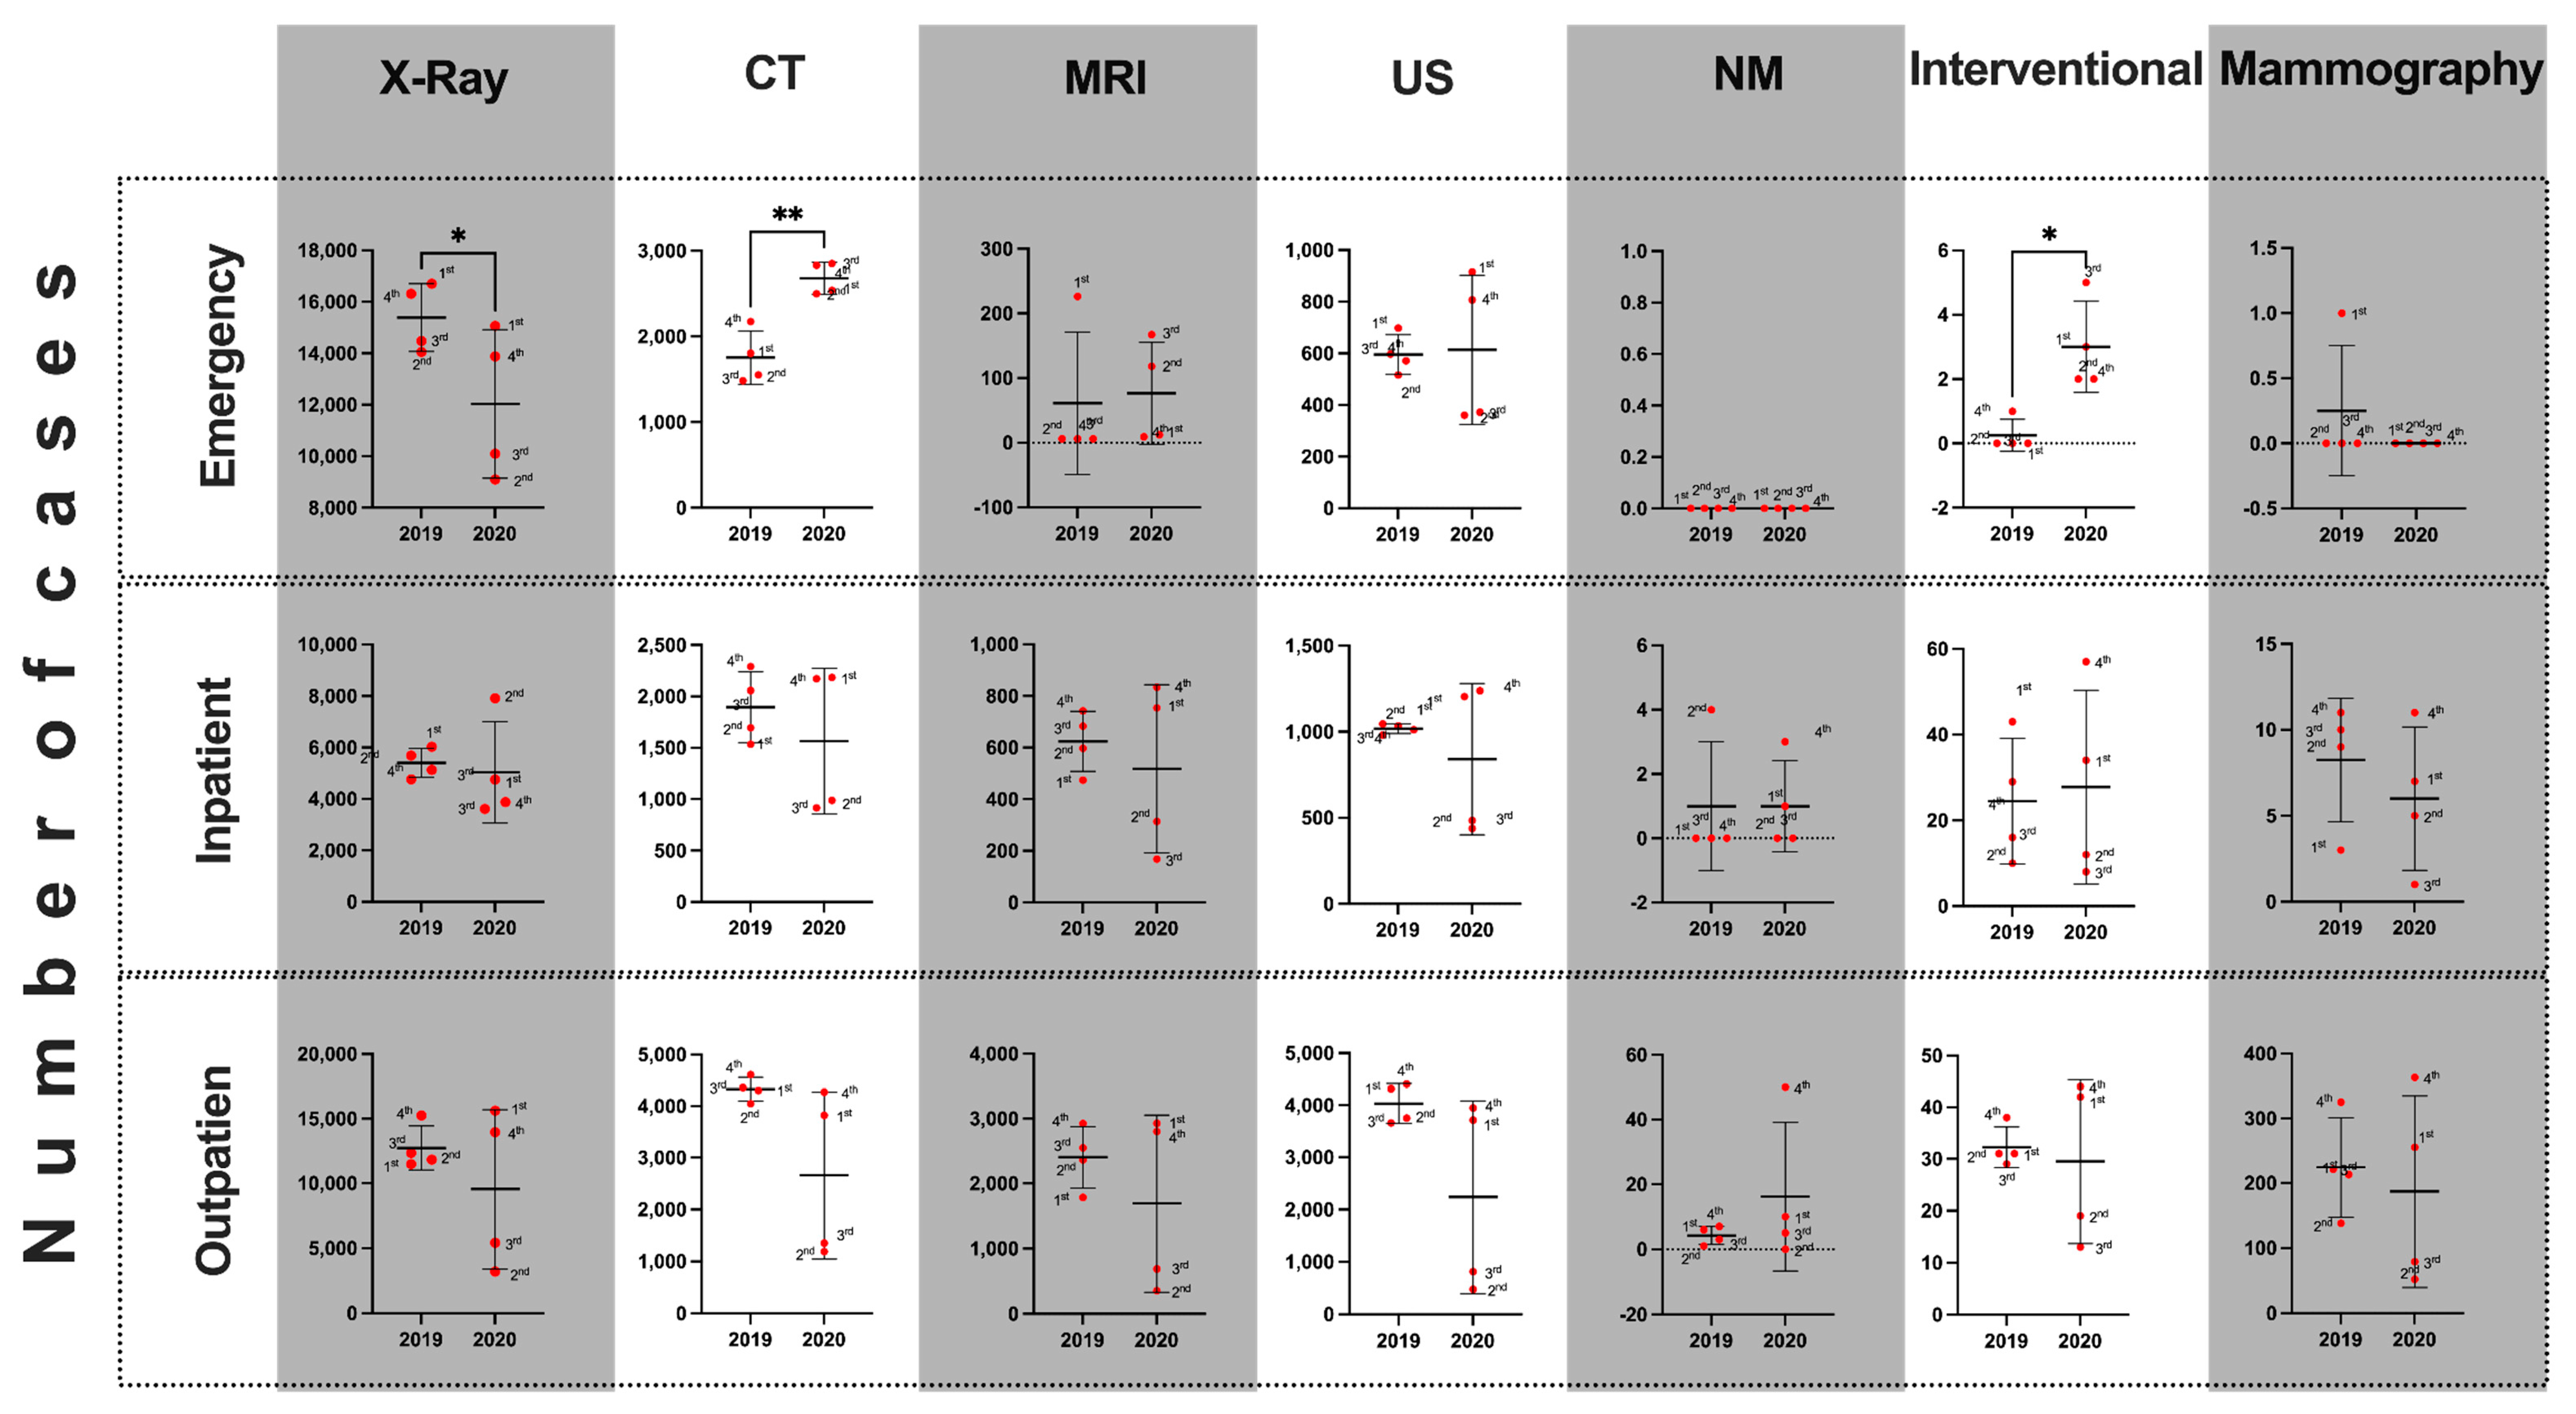
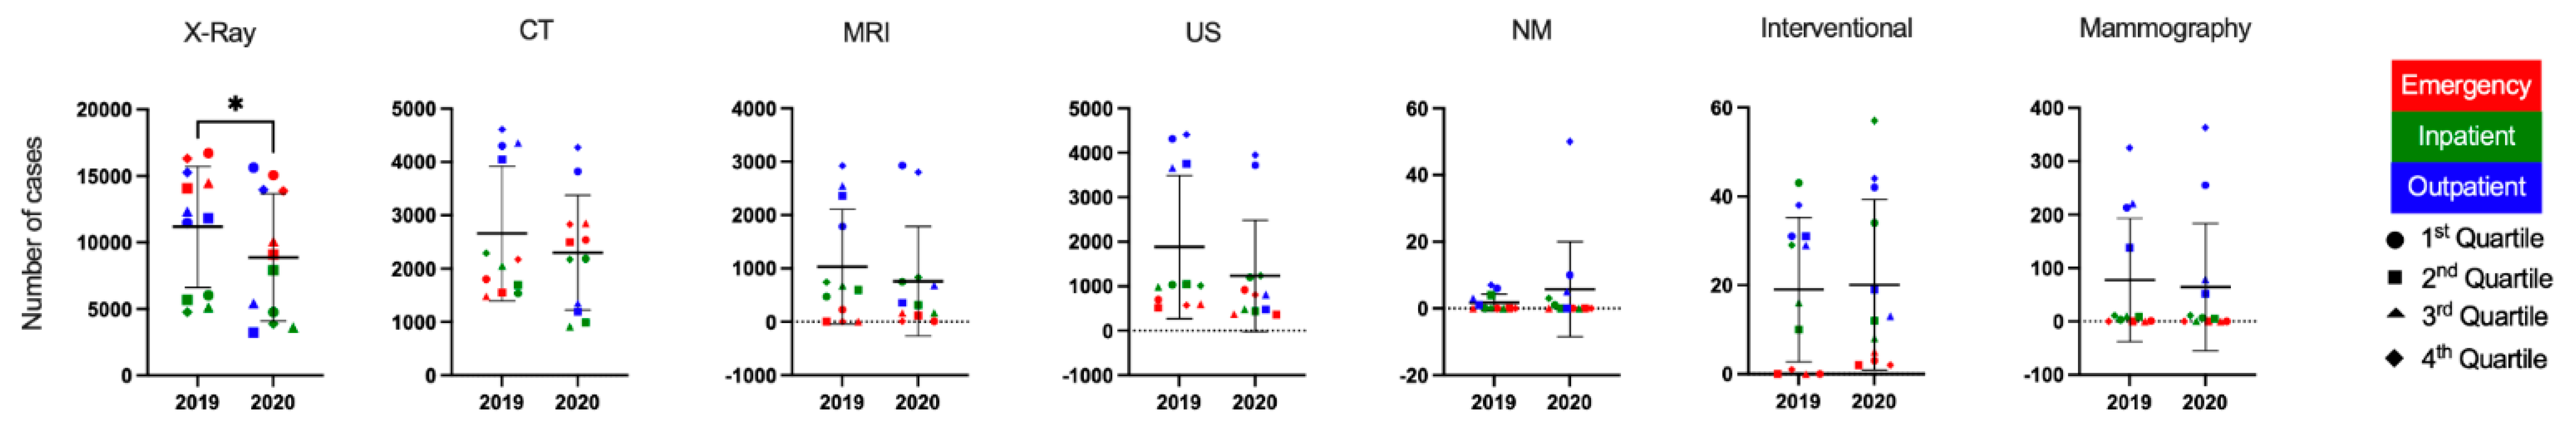
| Year | 2019 | 2020 | p-Value | ||
|---|---|---|---|---|---|
| Mean | 95% CI | Mean | 95% CI | * ≤ 0.05 | |
| Total volume | 7217 | 2820–11,614 | 5701 | 2014–9389 | 0.02 |
| Emergency Department | |||||
| X-ray | 15,386 | 13,293–17,479 | 12,033 | 7441–16,625 | 0.02 * |
| CT | 1753 | 1257–2249 | 2680 | 2381–2978 | 0.01 * |
| MRI | 61 | −114–236 | 76.5 | −48.89–201.9 | 0.86 |
| Ultrasound | 595.5 | 484.2–716.8 | 613.5 | 153.3–1074 | 0.89 |
| Nuclear Medicine | 0 | 0–0 | 0 | 0–0 | N/A |
| Interventional | 0.25 | −0.54–1.04 | 3 | 0.74–5.25 | 0.04 * |
| Mammography | 0.25 | −0.54–1.04 | 0 | 0–0 | 0.39 |
| Inpatient | |||||
| X-ray | 5402 | 4498–6305 | 5037 | 1892–8183 | 0.7 |
| CT | 1895 | 1348–2441 | 1565 | 438.4–2692 | 0.45 |
| MRI | 624 | 438.8–809.2 | 517.5 | −1.92–1037 | 0.59 |
| Ultrasound | 1019 | 973.8–1063 | 841 | 141.8–1540 | 0.47 |
| Nuclear Medicine | 1 | −2.18–4.18 | 1 | −1.25–3.25 | >0.99 |
| Interventional | 24.5 | 1.16–47.83 | 27.75 | −8.21–63.72 | 0.73 |
| Mammography | 8.25 | 2.53–12.62 | 6 | −0.62–12.62 | 0.47 |
| Outpatient | |||||
| X-ray | 12,724 | 9983–15,465 | 9552 | −240.8–19,344 | 0.25 |
| CT | 4331 | 3965–4696 | 2659 | 88.71–5230 | 0.1 |
| MRI | 2404 | 1648–3160 | 1694 | −472.1–3859 | 0.41 |
| Ultrasound | 4033 | 3426–4640 | 2238 | −701–5177 | 0.09 |
| Nuclear Medicine | 4.25 | −0.13–8.63 | 16.25 | −20.14–52.64 | 0.33 |
| Interventional | 32.25 | 25.97–38.53 | 29.5 | 4.35–54.64 | 0.7 |
| Mammography | 224.3 | 101.9–346.6 | 187.3 | −47.85–422.4 | 0.47 |
| All Patient Service Locations | |||||
| X-ray | 11,171 | 8272–14,069 | 8874 | 5839–11,909 | 0.04 * |
| CT | 2659 | 1856–3463 | 2301 | 1619–2984 | 0.39 |
| MRI | 1030 | 346.4–1713 | 762.5 | 113.3–1412 | 0.31 |
| Ultrasound | 1882 | 858.4–2906 | 1231 | 435.1–2027 | 0.08 |
| Interventional | 19 | 8.64–29.36 | 20.08 | 7.89–32.27 | 0.75 |
| Nuclear Medicine | 1.75 | 0.09–3.4 | 5.75 | −3.31–14.81 | 0.28 |
| Mammography | 77.58 | 4.14–151 | 64.42 | −11.28–140.1 | 0.39 |
Publisher’s Note: MDPI stays neutral with regard to jurisdictional claims in published maps and institutional affiliations. |
© 2021 by the authors. Licensee MDPI, Basel, Switzerland. This article is an open access article distributed under the terms and conditions of the Creative Commons Attribution (CC BY) license (https://creativecommons.org/licenses/by/4.0/).
Share and Cite
Alelyani, M.; Alghamdi, A.; Shubayr, N.; Alashban, Y.; Almater, H.; Alamri, S.; Alghamdi, A.J. The Impact of the COVID-19 Pandemic on Medical Imaging Case Volumes in Aseer Region: A Retrospective Study. Medicines 2021, 8, 70. https://0-doi-org.brum.beds.ac.uk/10.3390/medicines8110070
Alelyani M, Alghamdi A, Shubayr N, Alashban Y, Almater H, Alamri S, Alghamdi AJ. The Impact of the COVID-19 Pandemic on Medical Imaging Case Volumes in Aseer Region: A Retrospective Study. Medicines. 2021; 8(11):70. https://0-doi-org.brum.beds.ac.uk/10.3390/medicines8110070
Chicago/Turabian StyleAlelyani, Magbool, Ali Alghamdi, Nasser Shubayr, Yazeed Alashban, Hajar Almater, Sultan Alamri, and Ahmad Joman Alghamdi. 2021. "The Impact of the COVID-19 Pandemic on Medical Imaging Case Volumes in Aseer Region: A Retrospective Study" Medicines 8, no. 11: 70. https://0-doi-org.brum.beds.ac.uk/10.3390/medicines8110070