Influence of Cavitation and Mixing Conditions on Oil Droplet Size in Simultaneous Homogenization and Mixing (SHM)


Institute of Process Engineering in Life Sciences, Food Process Engineering, Karlsruhe Institute of Technology, 76131 Karlsruhe, Germany
*
Author to whom correspondence should be addressed.
ChemEngineering 2020, 4(4), 64; https://0-doi-org.brum.beds.ac.uk/10.3390/chemengineering4040064
Submission received: 30 September 2020
/
Revised: 14 November 2020
/
Accepted: 26 November 2020
/
Published: 9 December 2020
(This article belongs to the Special Issue Emulsion Process Design)
Abstract
:High-pressure homogenizers (HPH) equipped with a Simultaneous Homogenization and Mixing (SHM) orifice allow for inducing a mixing stream directly into the disruption unit. Previous studies show that by doing so, synergies between the unit operations “emulsification” and “mixing” can be used to save energy, e.g., in homogenization of dairy products, or to extend the application range of HPH. Up to now, process design has mainly been based on the trial and error principle due to incomplete understanding of flow conditions and droplet break-up in the SHM unit. This study aims at a higher level of understanding of cavitation and mixing effects on emulsion droplet size. Experimental data were obtained using a model emulsion of low disperse phase concentration in order to avoid coalescence effects. The different flow conditions are created by varying the process and geometric parameters of an SHM unit. The results show that the oil droplet size only depends on mixing conditions when the emulsion droplets are added in the mixing stream. Furthermore, a smaller oil droplet size can be achieved by reducing cavitation, especially for droplets fed in the high-pressure stream.
1. Introduction
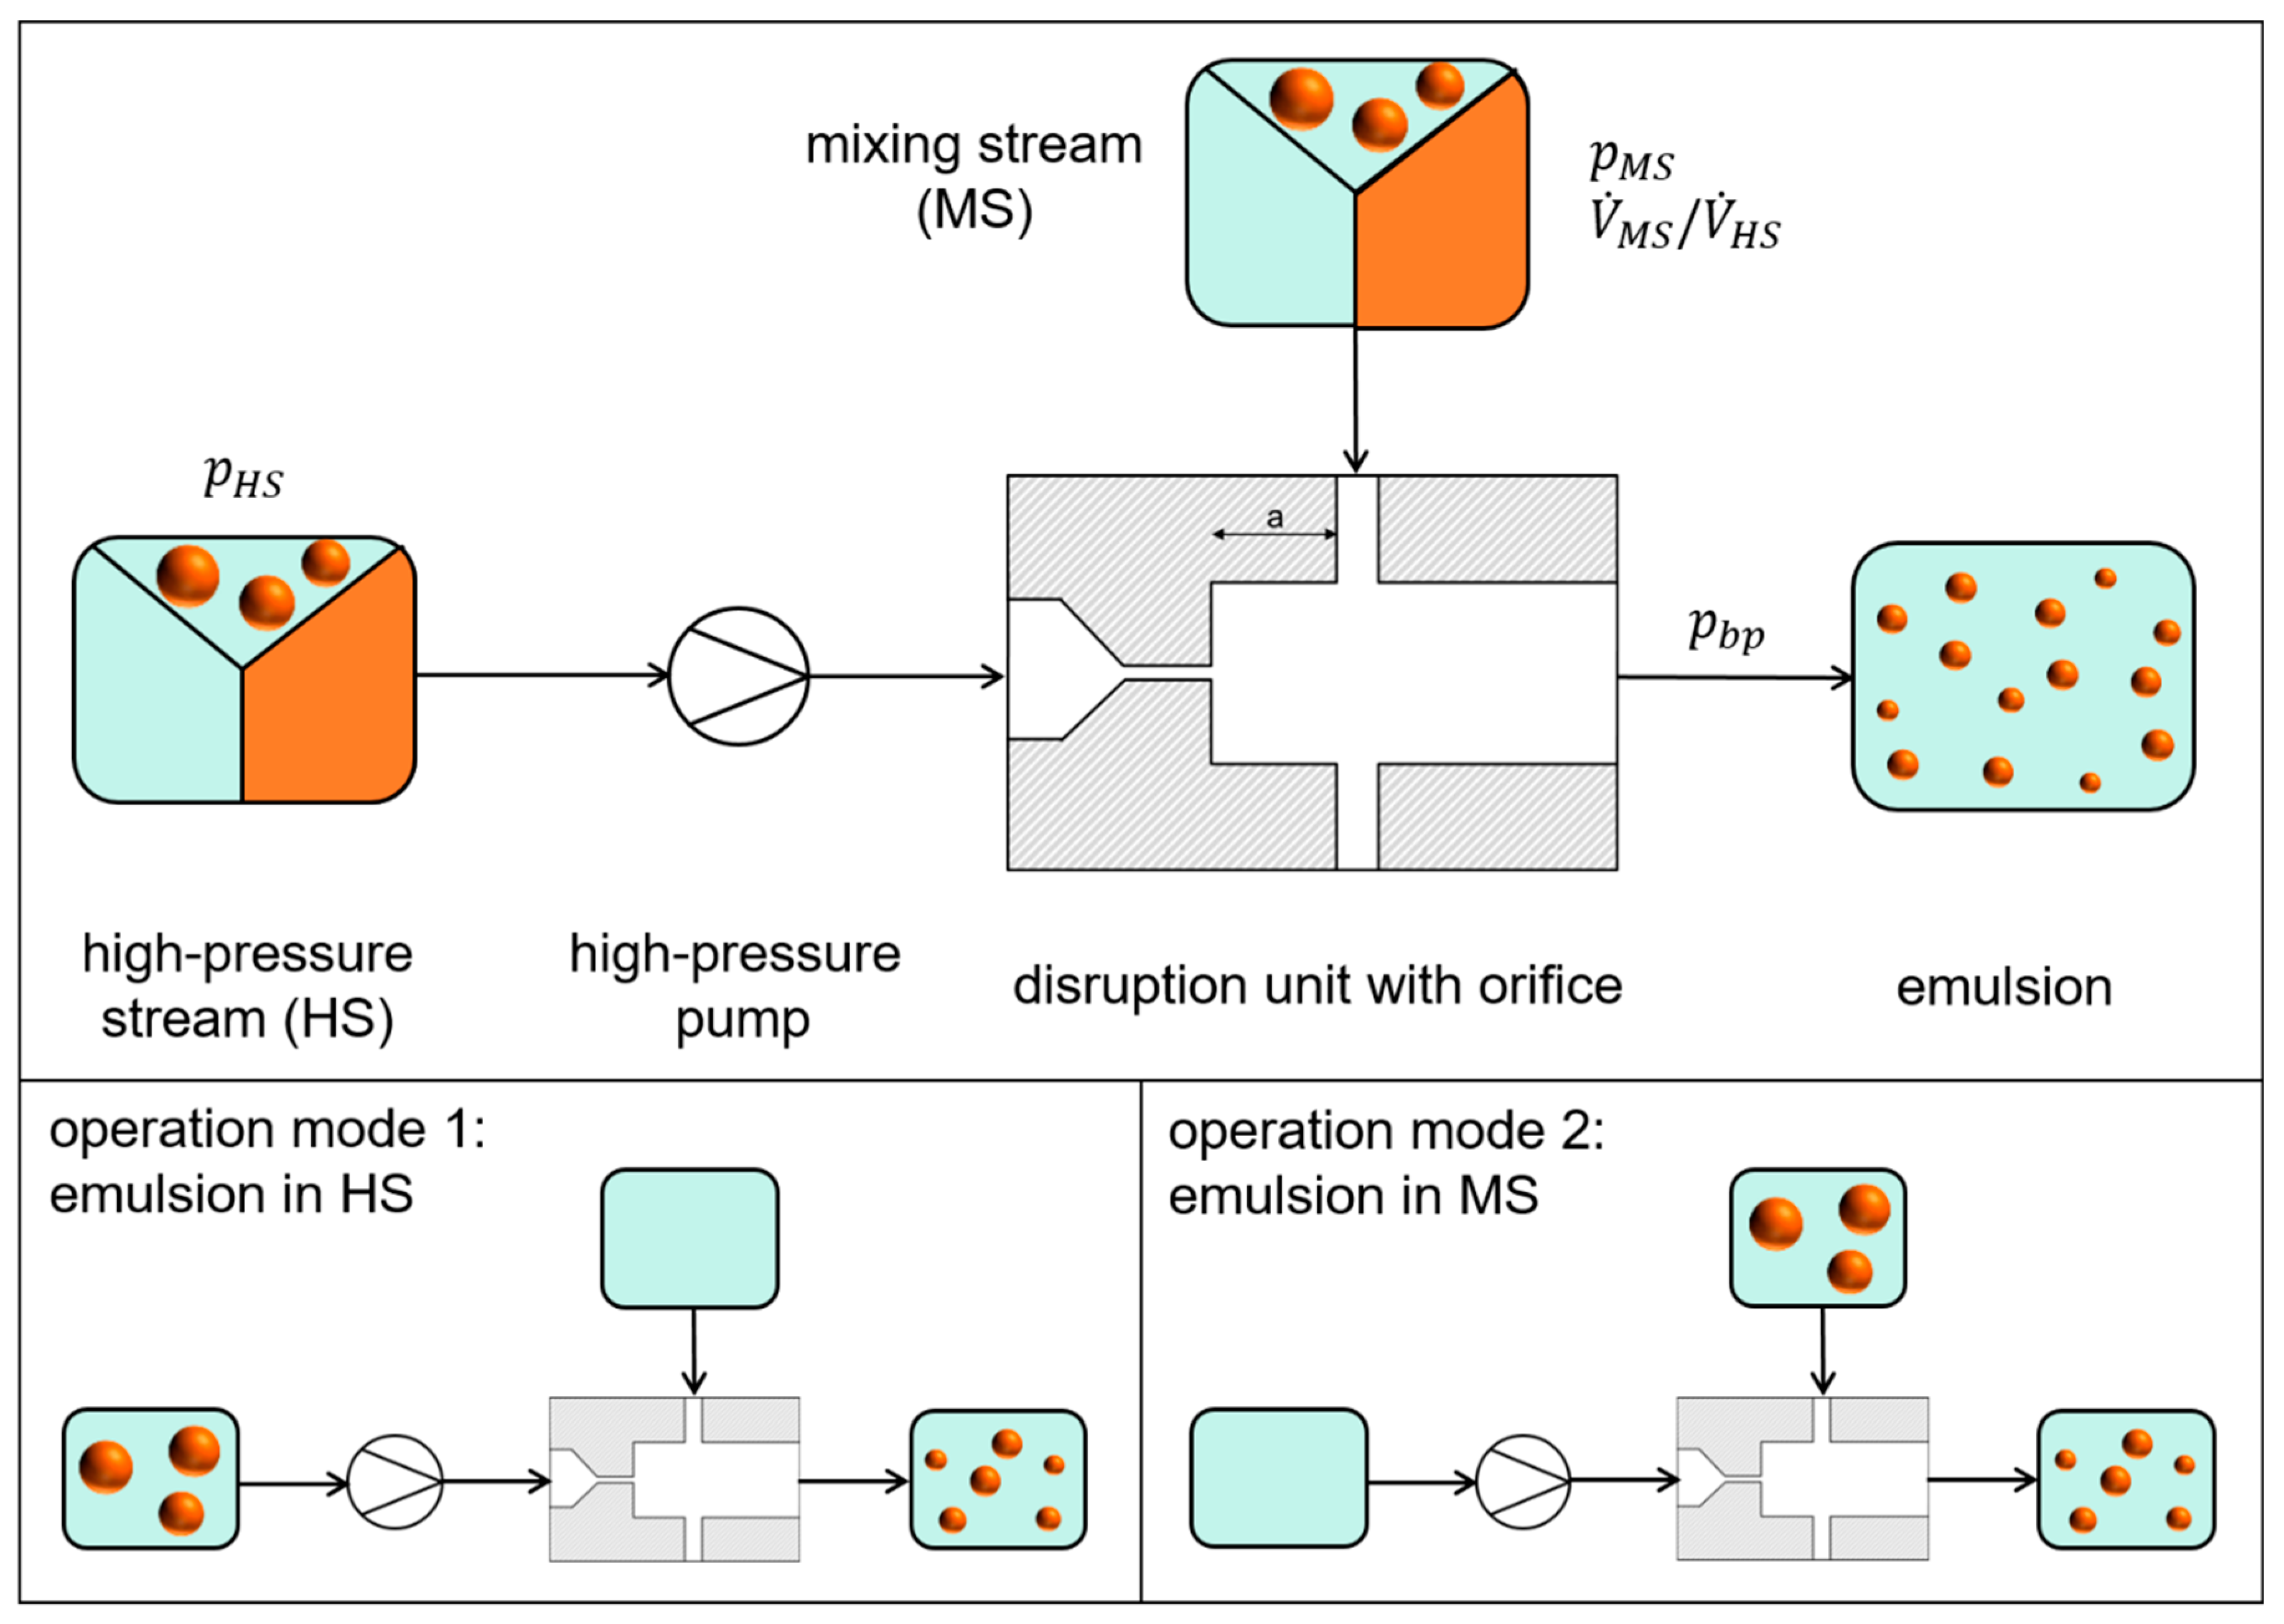
High-pressure homogenization (HPH) is widely used in chemical, pharmaceutical and food industries in order to produce high-quality emulsions with droplet sizes in the submicron scale [1]. In HPH, a pre-emulsion is compressed to pressures of up to several hundred bars and accelerated in a disruption unit containing a sharp constriction of the flow cross-section, e.g., an orifice. By doing so, laminar, transitional and turbulent flow conditions are created which induce hydrodynamic stresses leading to droplet break-up [2]. Simultaneous homogenization and mixing (SHM) was developed in order to extend the application range of HPH and save energy [3,4]. As shown schematically in Figure 1, this process is characterized by the insertion of an additional process stream called mixing stream (MS) just behind the point of the narrowest cross-section.
The MS can be used, for example, to dilute the high-pressure stream (HS) during homogenization of dairy products. Aggregation and coalescence of oil droplets is thus prevented. Energy savings of up to 80% are reported [5,6]. It also makes it possible to add abrasive or clogging components without passing through the orifice, as required for particle stabilized emulsions [7] or melt emulsions [8]. Depending on the application, the process streams therefore can consist of continuous phase, disperse phase or a pre-emulsion. With regard to droplet break-up, a distinction must therefore be made as to whether the droplets are added in the HS (operation mode 1 in Figure 1) or in the MS (operation mode 2 in Figure 1). However, this increased flexibility of the process is also accompanied by an increase in the process parameters. In addition to the process parameters of conventional high-pressure homogenizing such as pressure, temperature, viscosities and geometry of the orifice, further parameters are added. These include the volume ratio of the streams, the geometry of the MS feed and the distance a between orifice outlet and MS feed in the SHM unit.
While the process design has mainly been based on the trial and error principle so far, this work is intended to enable a more comprehension-oriented approach in future. The flow conditions occurring during high-pressure homogenization and their influence on droplet break-up are not yet fully understood and are therefore the subject of current research [9,10,11,12,13], reviewed in [14]. In this context, there are still many open questions for the SHM process regarding flow conditions and droplet break-up.
To date, it has barely been investigated how cavitation influences the oil droplet size in the SHM process. Cavitation is defined as the spontaneous emergence, growth and subsequent implosion of vapor-filled cavities. It occurs in HPH processes equipped with an orifice due to a local pressure drop at the orifice entrance [15]. Depending on the pressures applied before and after the orifice as well as on the geometry of the orifice, different cavitation patterns such as jet cavitation and hydraulic flip induced patterns could be observed [16]. Previous studies dealing with cavitation in conventional HPH have shown that the occurrence of cavitation increases the oil droplet size [17]. A particularly high cavitation intensity leads to hydraulic flip, which has been proven to be particularly damaging to droplet break-up [18]. In previous work we showed that cavitation also occurs in the SHM process and that the addition of the MS can even promote hydraulic flip [19]. By applying a back-pressure after the orifice, visible cavitation in SHM nozzles is reduced and vanishes when about 25–30% of the inlet pressure is applied [19], which agrees with values found in the literature for conventional HPH processes [17,20]. The only work to date on the influence of back-pressure on droplet size in the SHM process was carried out in the field of dairy homogenization [21]. It was found that in the SHM process the reduction in droplet size with an increase in back-pressure was less pronounced than in the conventional HPH process.
In this work, it is investigated whether the effect of cavitation on oil droplet size reported for conventional HPH is also valid for the SHM process, especially if the emulsion is added in the MS. A model system containing a low content of rapeseed oil and the fast emulsifier SDS is used. This allows us to suppress coalescence of droplets after their break-up. Another focus of this work is set on the mixing conditions and their effect on oil droplet size in operation mode 1 and 2 (Figure 1). These are examined by varying the mixing ratio of the streams, the distance a between orifice outlet and MS feed as well as the geometry of the MS feed. While the mixing ratio and the geometry of the feed were not yet discussed, the distance a has already been addressed in earlier studies. It has been shown that the distance a did not influence the droplet size of emulsions prepared in context of the production of zinc nanoparticles by the miniemulsion technique [22]. In contrast, in the homogenization of dairy products, it was observed that the butter fat droplet size has a minimum at a ≈ 4–5 mm if it is plotted over the distance a [21]. Possible reasons for this behavior were discussed, but not investigated. In this study we therefore also consider the influence of changes in the shape of the MS feed and distance a on the cavitation patterns. As a basis for discussing the emulsification results, the existing cavitation patterns were recorded as shadow-graphic images using a high-speed camera and an optically accessible disruption unit as presented in literature [17,23].
2. Background
This chapter covers the basics of droplet break-up and cavitation in HPH processes. It also describes the state of knowledge regarding the influence of cavitation on droplet break-up.
2.1. Droplet Break-Up in SHM
In HPH processes, laminar, transitional and turbulent flow can occur. The Re number in the orifice
serves as a prediction of the flow regime. In this case, the mean velocity in the orifice is calculated using the experimentally measured mass flow rate , the orifice diameter and the density of the liquid :
For cavitation-free flow through orifices it was found that laminar flow is present for Re < 225, transitional flow for 225 < Re < 3600 and turbulent flow for Re > 3600 [24,25]. In principle, laminar shear and elongational stress as well as turbulent inertial forces and cavitation can provoke droplet break-up [2]. It is generally accepted that in HPH processes a superposition of these mechanisms takes place. In several studies, it was observed that droplets are elongated at the entrance of the orifice [25,26]. However, this elongation was not sufficient for the break-up of droplets, which was located downstream the orifice due to turbulence.
2.2. Cavitation in HPH Processes
Optical investigations of cavitation have been conducted in the past using incident lighting [27], by taking shadow-graphic images [23], via laser light induced luminescence combined with mikro-PIV [28] or via sono-chemiluminescence [29]. In HPH processes with an increased back-pressure, the ratio between the applied back-pressure and is often used to describe homogenization results [20]. It is defined as a Thoma number
It has been observed that when a back-pressure is applied downstream the orifice, cavitation decreases [30]. When the Thoma number reaches 0.3 < Th < 0.5 depending on the geometry, cavitation disappears [31]. The cavitation number σ describes the probability of cavitation appearance in an orifice throat and its outlet channel [32]. It is given as ratio between static pressure tending to suppress cavitation and the hydrodynamic pressure tending to support cavitation [33] using the vapor pressure ).
Depending on the quantity and distribution of the vapor generated by cavitation, several cavitation patterns can be distinguished in HPH processes. When the cavitation bubbles appear in the shape of a jet consisting of single bubbles, the cavitation pattern is described as a jet cavitation or a cavitating jet [34]. The cavitation pattern in which the first coherent vapor bubble appears is called chocked cavitation [16]. Choked cavitation can merge into the cavitation pattern “hydraulic flip” by decreasing which occurs when the outlet channel is filled completely by one cohesive vapor bubble [35] in which the HS enters as a liquid jet [18]. Hydraulic flip can also be caused by increasing the diameter ratio at constant [18].
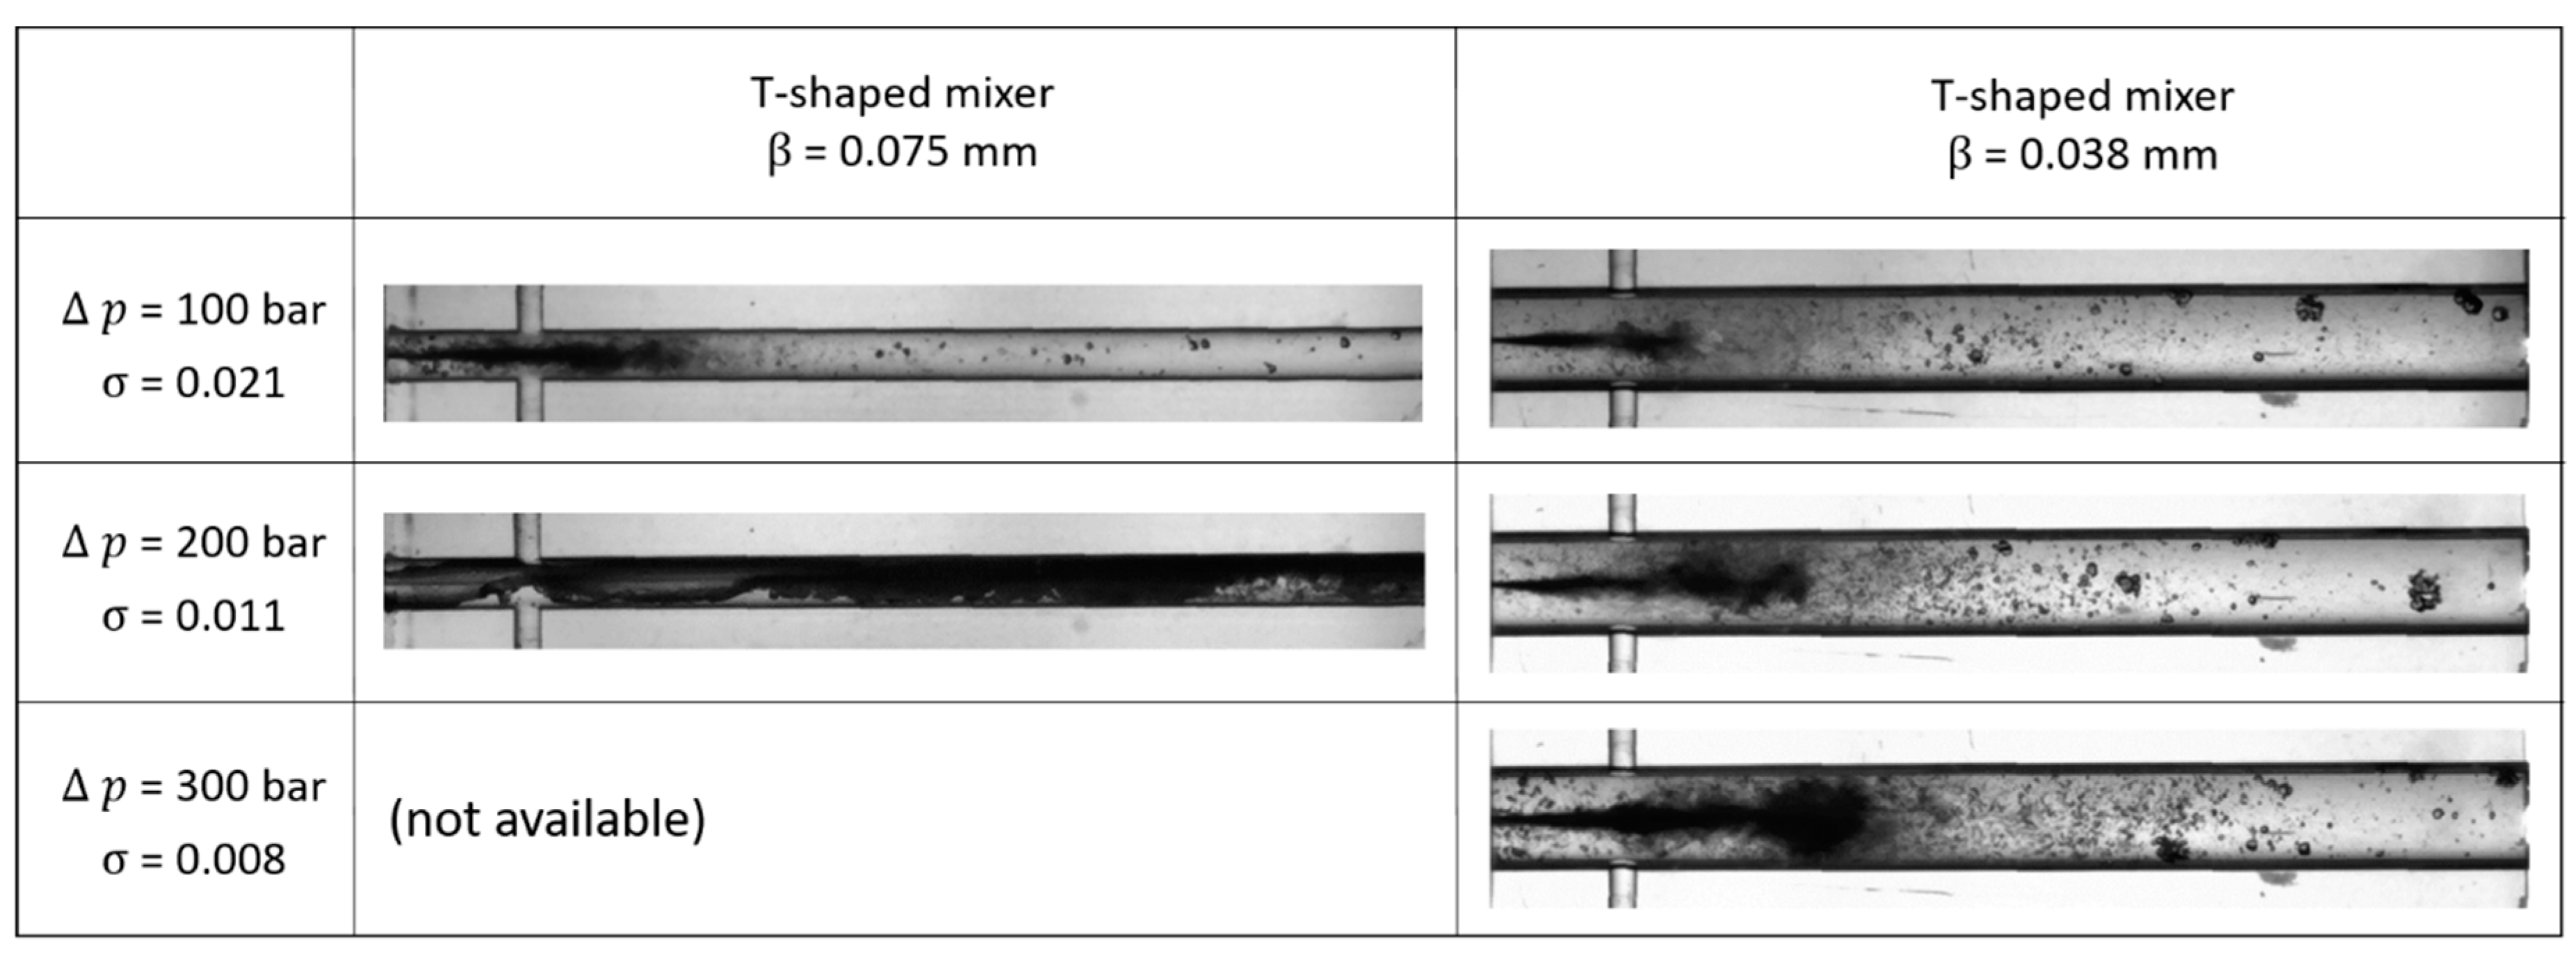
Schlender was able to show that adding a surfactant can prevent the coalescence of single cavitation bubbles, but does not influence the length and change of cavitation patterns [18]. He also demonstrated that adding plant oil up to 10 wt-% to water with an adjusted refractive index showed no influence on the cavitation pattern. In a previous work, the influence of the mixing stream in SHM on the occurrence and the cavitation patterns was determined [19]. Figure 2 illustrates the cavitation patterns hydraulic flip and jet cavitation, which have occurred as a function of and homogenization pressure . It has been shown that the visible occurrence of cavitation can also be suppressed by applying counter pressure at Th ≈ 0.2–0.3. It also became apparent that the insertion of the MS can promote a hydraulic flip similar to an increase in .
2.3. Influence of Droplet Break-Up on Cavitation
The mechanisms in which cavitation affects droplet break-up are still a topic of controversy. On the one hand, it was shown that the implosion of cavities can contribute to droplet break-up. Collapsing cavities near a droplet interface can lead to the formation of a liquid jet with high velocity, which is focused at the interface leading to the disruption of the droplet [36]. The collapse of cavities can also cause interface turbulences that stress droplets. Several studies found a minimum in droplet size at Th = 0.2 to 0.3 [17,37,38,39]. However, Gothsch et al. point out that in these studies the pressure difference Δp was not kept constant. Because of that, the energy input decreases with increasing Th, causing the droplet size to increase again after the minimum [28]. They found that at constant Δp, droplet size decreases with increasing Th until a plateau is reached at Th ≈ 0.2 to 0.25. In addition, Schlender found that the occurrence of a hydraulic flip is particularly harmful for achieving small oil droplet sizes compared to jet cavitation and choked cavitation [18].
3. Materials and Methods
3.1. Plant Setup
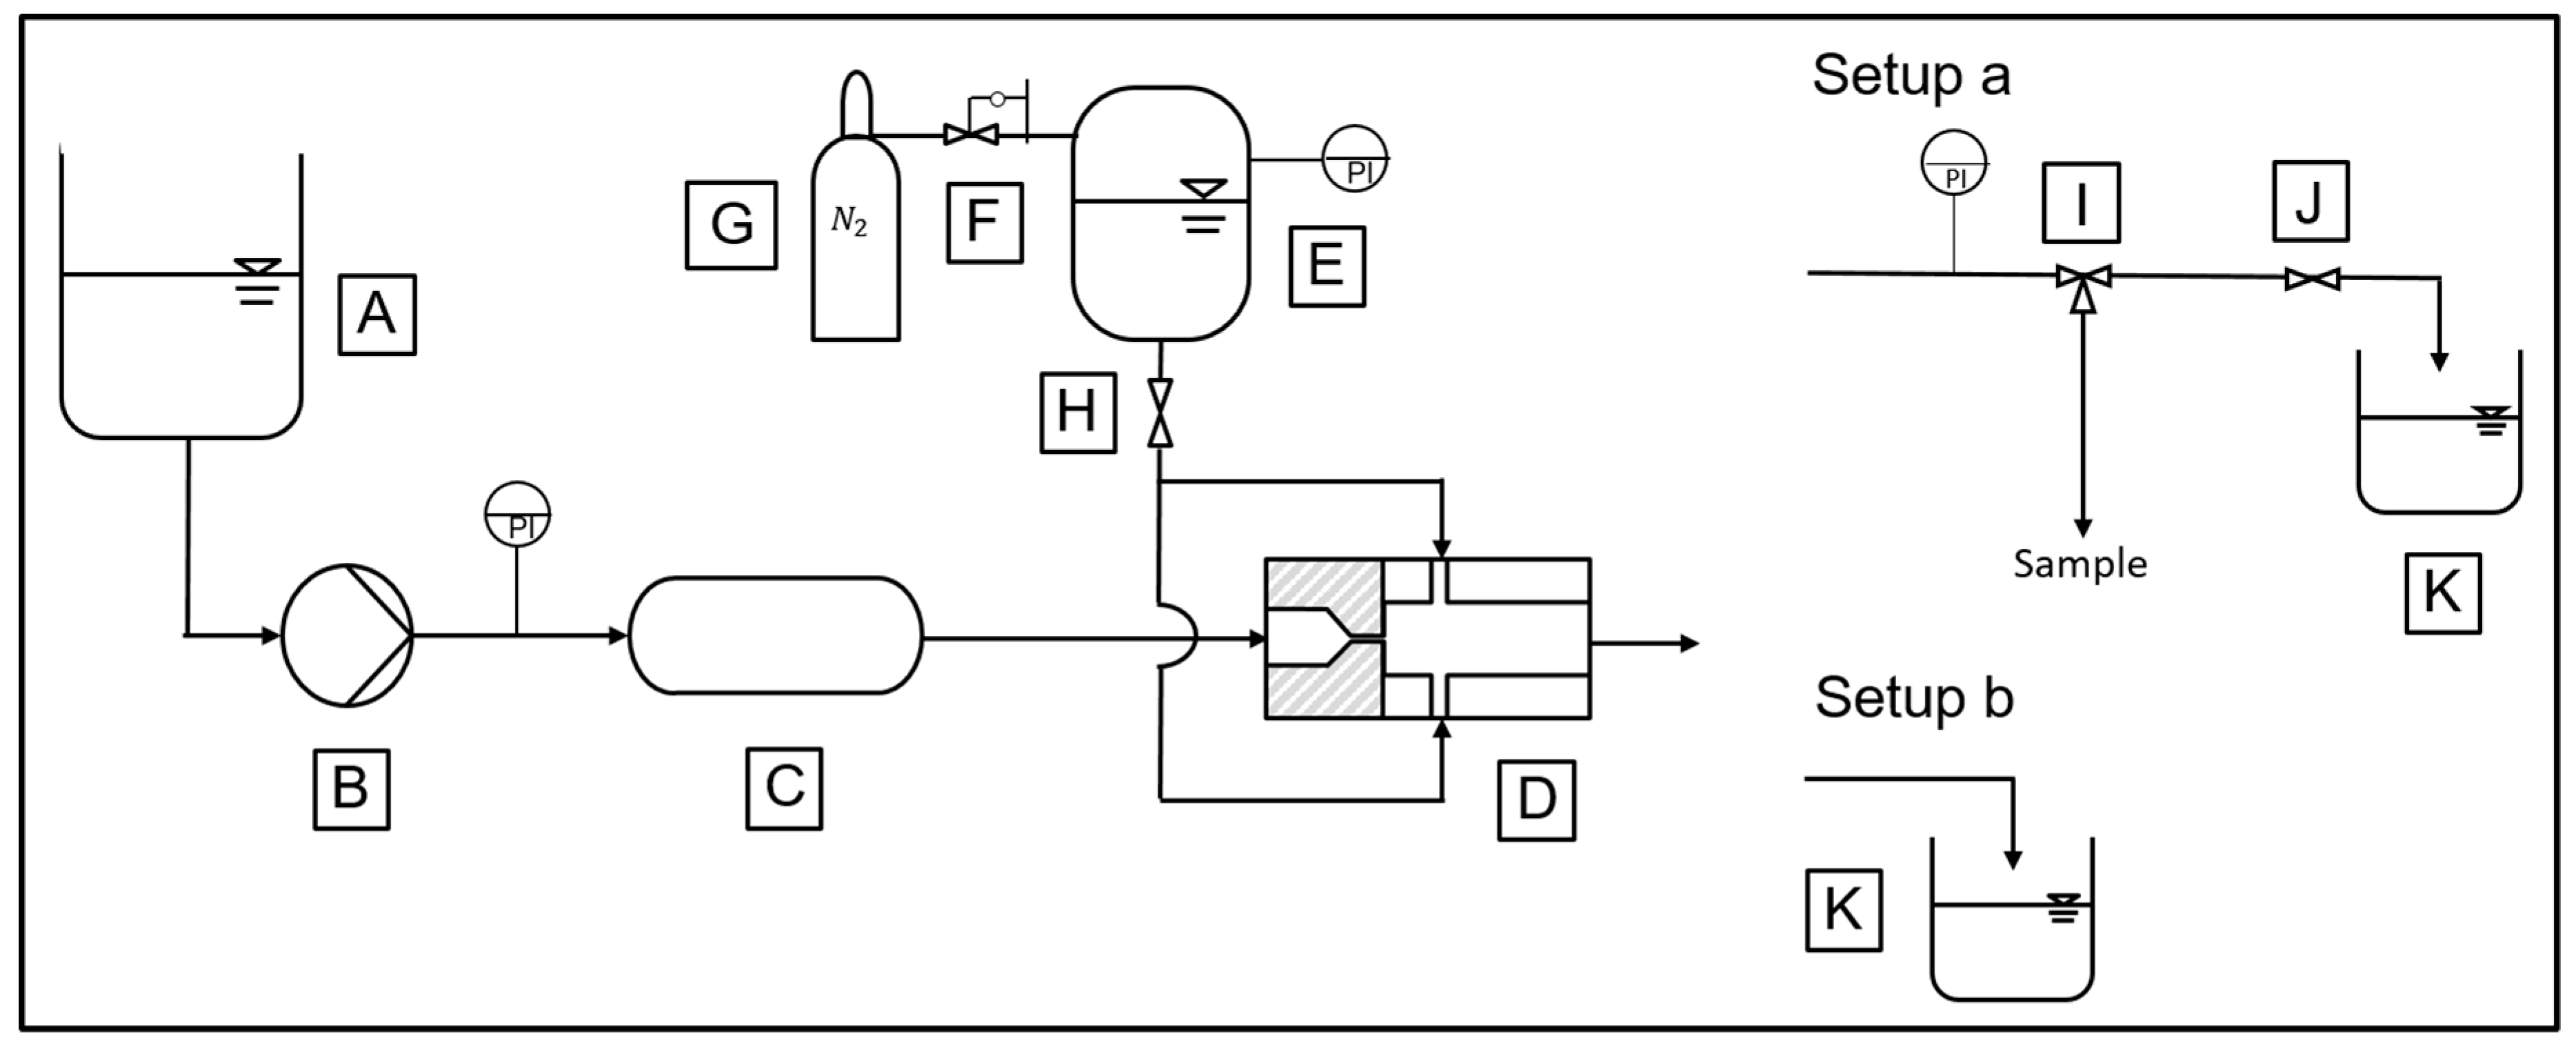
All tests were carried out in a high-pressure plant, which is shown schematically in Figure 3. The HS is provided in a storage tank (A) and then compressed by a hydraulically powered two piston pump (B) (Dunze GmbH, Germany) with a maximal working pressure of 1200 bar. A pulsation damper (C) (Uhde High Pressure Technologies GmbH, Germany) is used to compensate for pressure fluctuations. This is important since previous studies showed that flow pulsation can influence oil droplet size [40]. The MS is conveyed into the disruption unit (D) (KIT, Germany) from a pressure vessel (E), which can be pressurized via a pressure control valve (F) by means of a nitrogen bottle (G). The mixing ratio is adjusted by a control valve (H).
For experiments in which a back-pressure is applied after the disruption unit, plant setup a is used. In this case, the back-pressure is adjusted with a needle valve (J). Since the needle valve could cause additional droplet disruption during the emulsification tests, in this case the sampling is carried out by means of a three-way valve (I) upstream of the needle valve. For trials which do not require back-pressure, plant setup b is used.
3.2. Emulsification Trials
For all emulsification tests, a pre-emulsion was first prepared using a toothed rim dispersing machine (Disperser T25, IKA, Staufen, Germany). The pre-emulsion consisted of 1 wt-% rapeseed oil, 0.5 wt-% sodium lauryl sulfate (SDS) and 98.5 wt-% destilled water. According to the literature, at an oil concentration of 1 wt-% coalescence plays a negligible role [41,42].
For operation mode 1, the pre-emulsion was supplied in the HS storage tank (A) while the mixing stream consisted of pure distilled water. For operation mode 2 on the other hand, the pre-emulsion was fed as MS while the HS consisted of pure distilled water. No additional emulsifier was added in the pure water phase to prevent additional air stabilized by the emulsifier from being introduced into the system. In this way, a better comparability of the results with the cavitation images taken in pure water is ensured. The emulsifier concentration in the pre-emulsion was adjusted so that at a mixing ratio = 1 and the emulsifier concentration in the total flow remains above the cmc [43]. All trials were conducted three times. The droplet size distributions of the emulsions were measured using a laser light diffraction spectrometer including polarization intensity differential scattering (LS 13320® Beckman-Coulter, Brea, CA, USA). The droplet size distribution was calculated by the Mie-theory with a refractive index for the continuous phase of 1.333 and for the disperse phase of 1.473 (imaginary part set to zero). All samples were measured threefold. Results are discussed using the volume-weighted size distribution. From these, the Sauter mean diameter d3,2 [44] was calculated as the characteristic mean droplet size. In the case that the latter did not sufficiently describe the changes in the droplet size distribution, the characteristic values and were used in addition. Here, indicates the droplet diameter, under which x% of the total volume of the distribution lies.
In all trials, the homogenization pressure was set to 100 bar, 200 bar, and 300 bar. By doing so, the volume stream is set automatically with and the geometry of the orifice. The influence of cavitation patterns on oil droplet size was investigated by varying the diameter ratio . While was kept constant, was fixed at 2 or 4 mm which results in = 0.038 and = 0.075. As illustrated in Figure 2, we observed that at = 0.038 and 100–300 bar jet cavitation is present [19]. At = 0.075 on the other hand, the cavitation intensity is significantly higher and a hydraulic flip was observed at 200 bar and higher.
Furthermore, the mixing ratio is varied at constant = 100 bar to = 1, 2 and 5. During these experiments the oil and emulsifier content in the total flow changes slightly. Since the wt-% of oil remains < 1 wt-% in the total flow and the emulsifier is inserted in excess, this should not affect the result. For investigating the geometry of the MS feed, a T-shaped mixer with a = 4.5 9 mm and a circular shaped mixer with a = 0; 4.5 mm came into use. Thus, two distances were examined for each mixer, which, however, differed due to constructional limitations of the disruption unit. The distance a = 4.5 mm still allows the direct comparison of both mixers.
3.3. Shadow-Graphic Images for Cavitation Observations
The cavitation patterns were visualized using opposing light imaging (shadow-graphic) as performed in the literature [18,23]. As a light source, an LED lamp (Constellation 120 E, IDT Inc., San José, CA, USA) was installed on the opposite site of the camera. The OAMC was coated with a diffuse film to even out the light. The high-speed camera OS3-S3 (IDT Inc., San José, CA, USA) combined with a 100 mm macro objective (Canon Inc., Tokyo, Japan) was used to take pictures of the cavitation patterns in the OAMC. The frequency of the recording was set to 10,000 fps and the exposure time ranged between 50 to 70 µs. For each set of parameters, 2000 images were taken. For these trials, both streams consisted of pure distilled water, which was not degassed. Cavitation patterns were observed varying both the shape of the mixing stream and the distance a. The cavitation patterns at the other sets of parameters were already presented in [19].
4. Results and Discussion
4.1. Influence of β on Oil Droplet Size
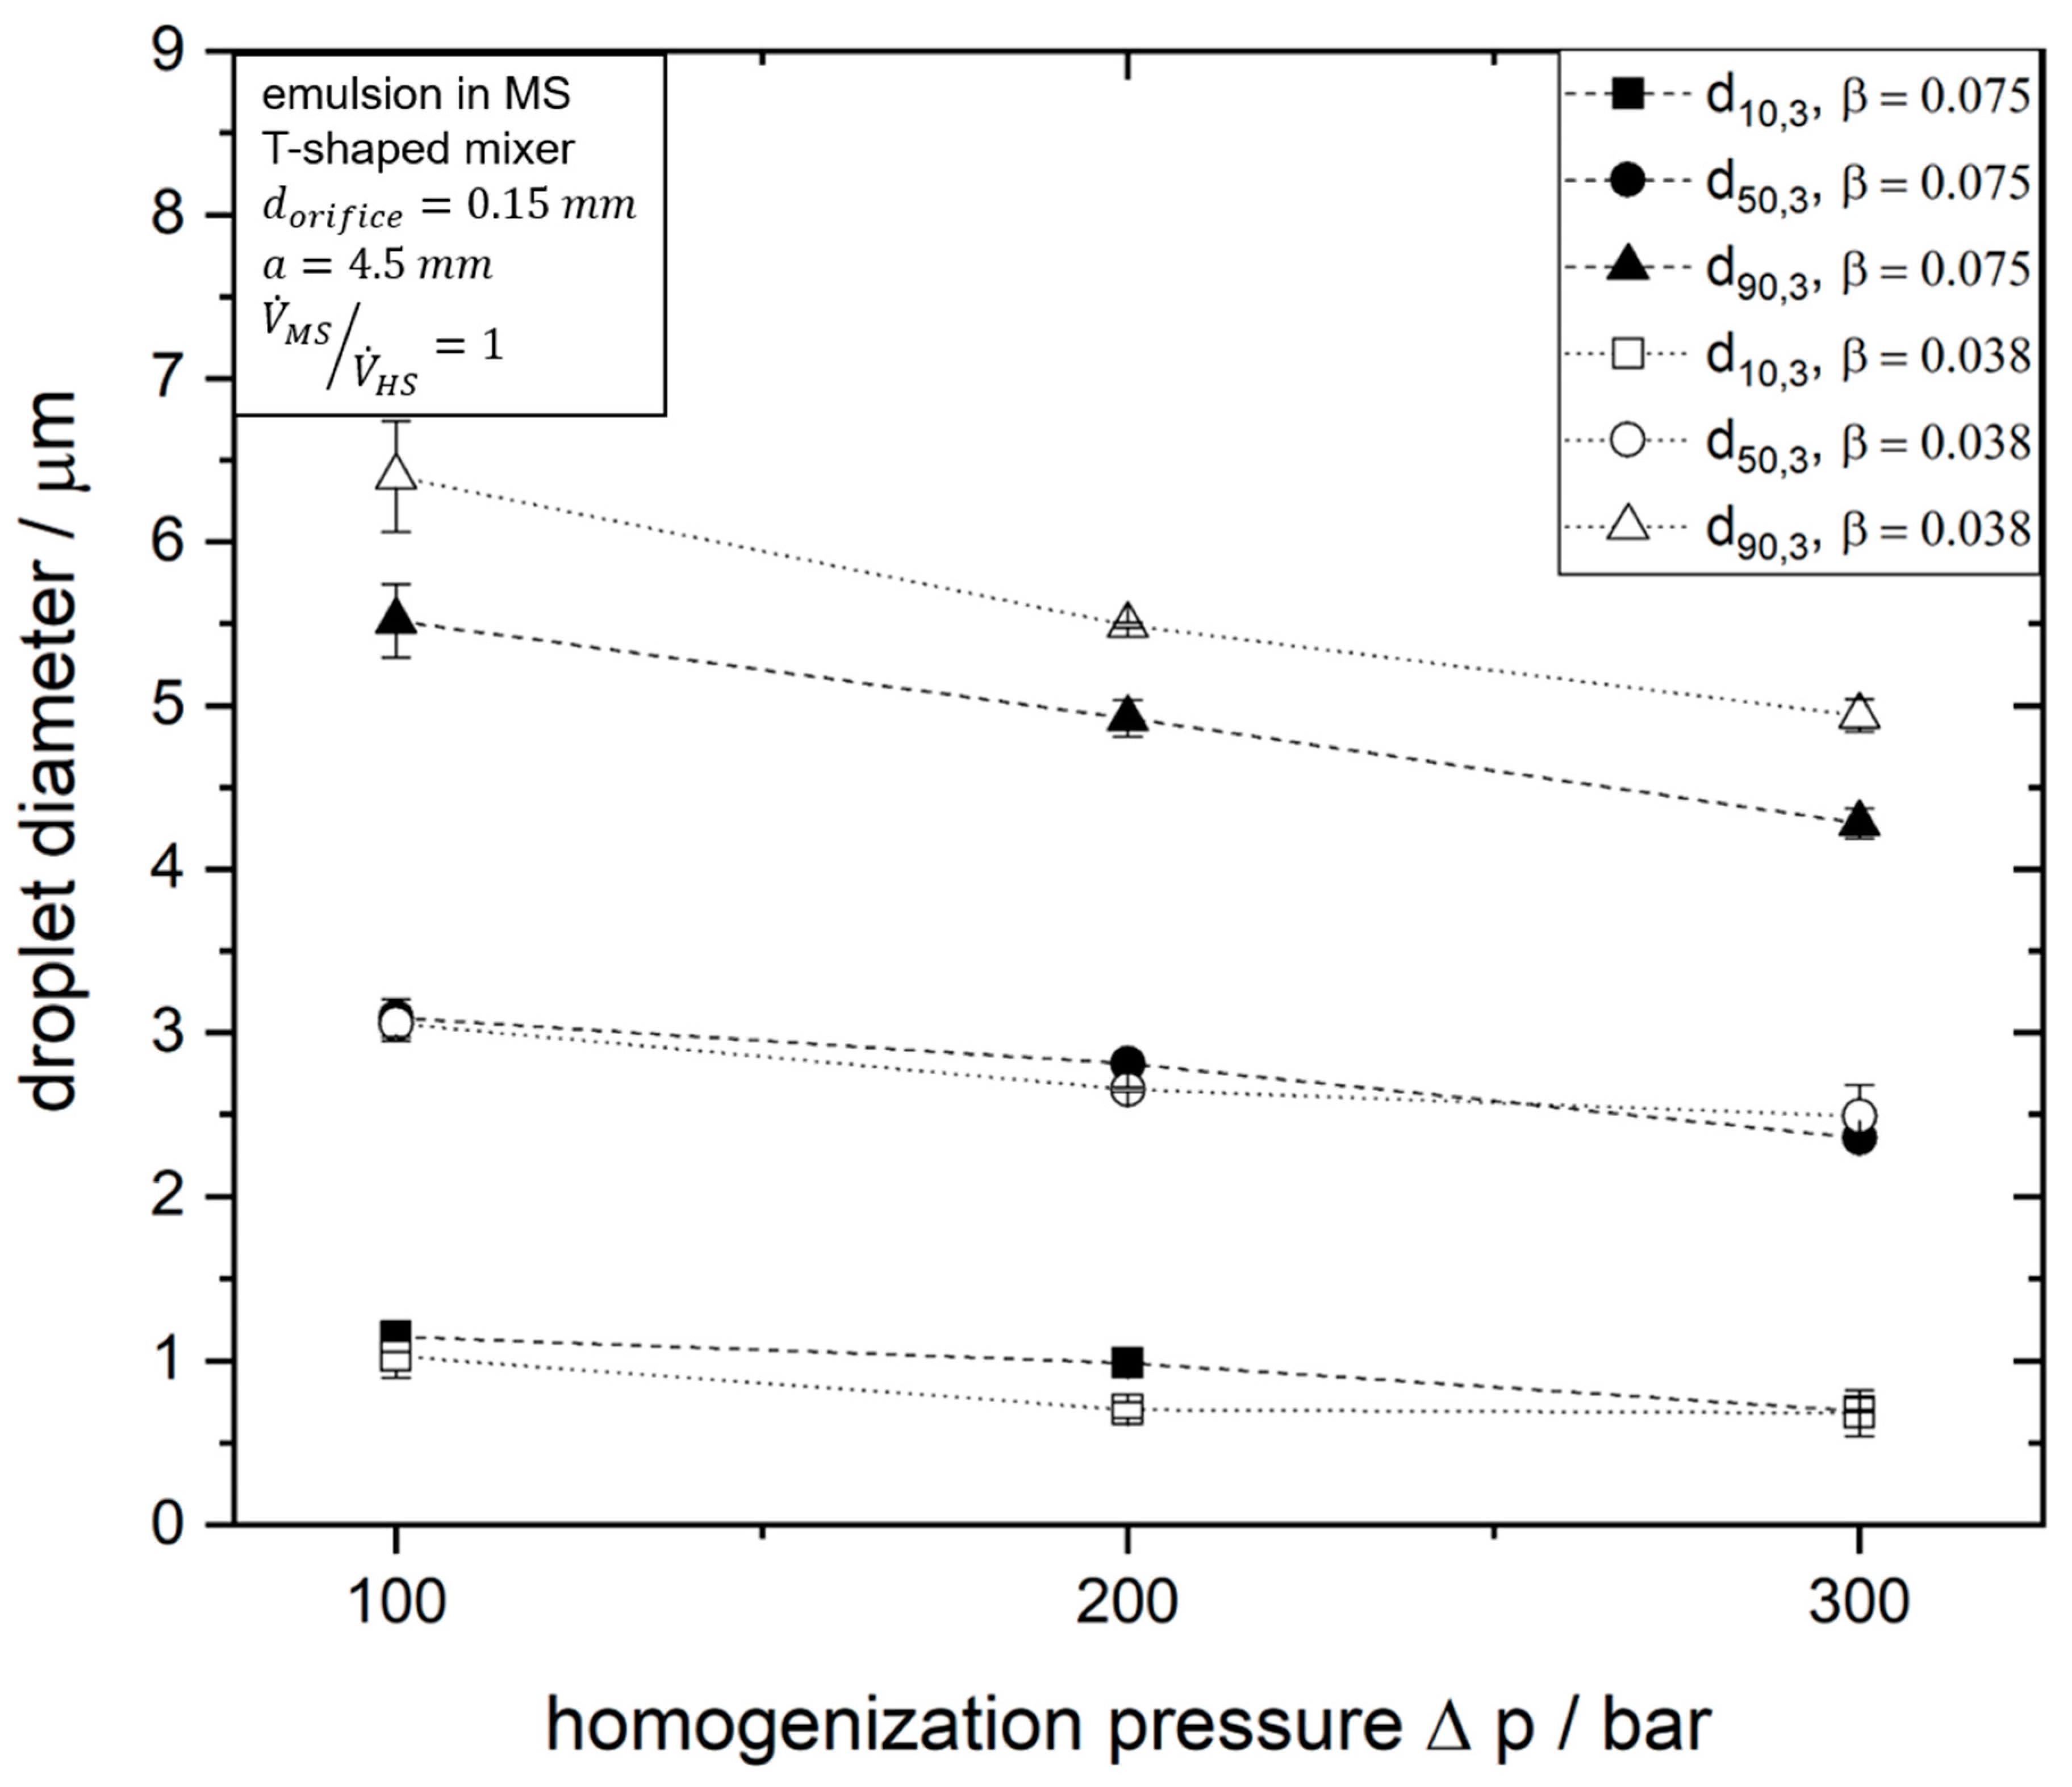
In this chapter it is discussed how the cavitation patterns jet cavitation and hydraulic flip affect the oil droplet size. Figure 5 shows the Sauter mean diameter plotted versus the homogenization pressure . When looking at the values of measured for = 0.075, it becomes apparent that feeding the pre-emulsion in the HS causes smaller droplets than feeding it in the MS. This can easily be explained by the fact that the droplets in the HS are subjected to additional shear and elongational stresses while passing the orifice. The droplets which were fed in the MS for = 0.075 display a decreasing with increasing pressure . This meets the expectations for disruption dominated emulsification processes [45]. However, this trend cannot be seen with the droplets that were added in the high-pressure stream at = 0.075. If increases from 100 to 200 bar, the droplets will not become smaller, but larger if at all. A possible explanation for this is provided by the cavitation patterns recorded under identical process conditions in [19]. While jet cavitation was observed for = 100 bar, hydraulic flip, which is described as harmful for droplet break-up [18] was present at = 200 bar and higher [19]. It should be noted, however, that in this case the hydraulic flip has no clear effect on the droplet size of droplets added to the mixing stream.
Figure 5 also shows that decreasing to = 0.038 has different effects depending on whether the emulsion is added in the HS or MS. For the droplets fed in the HS a strong reduction in d3,2 can be observed. This corresponds to the expectations of the literature [18] and can likely be attributed to the fact that jet cavitation is present instead of hydraulic flip. It can also be seen that d3,2 tends to decrease with increasing for = 0.038 in this case. On the other hand, it can be seen that the reduction of does not have a significant effect on d3,2 when the droplets are added in the MS.
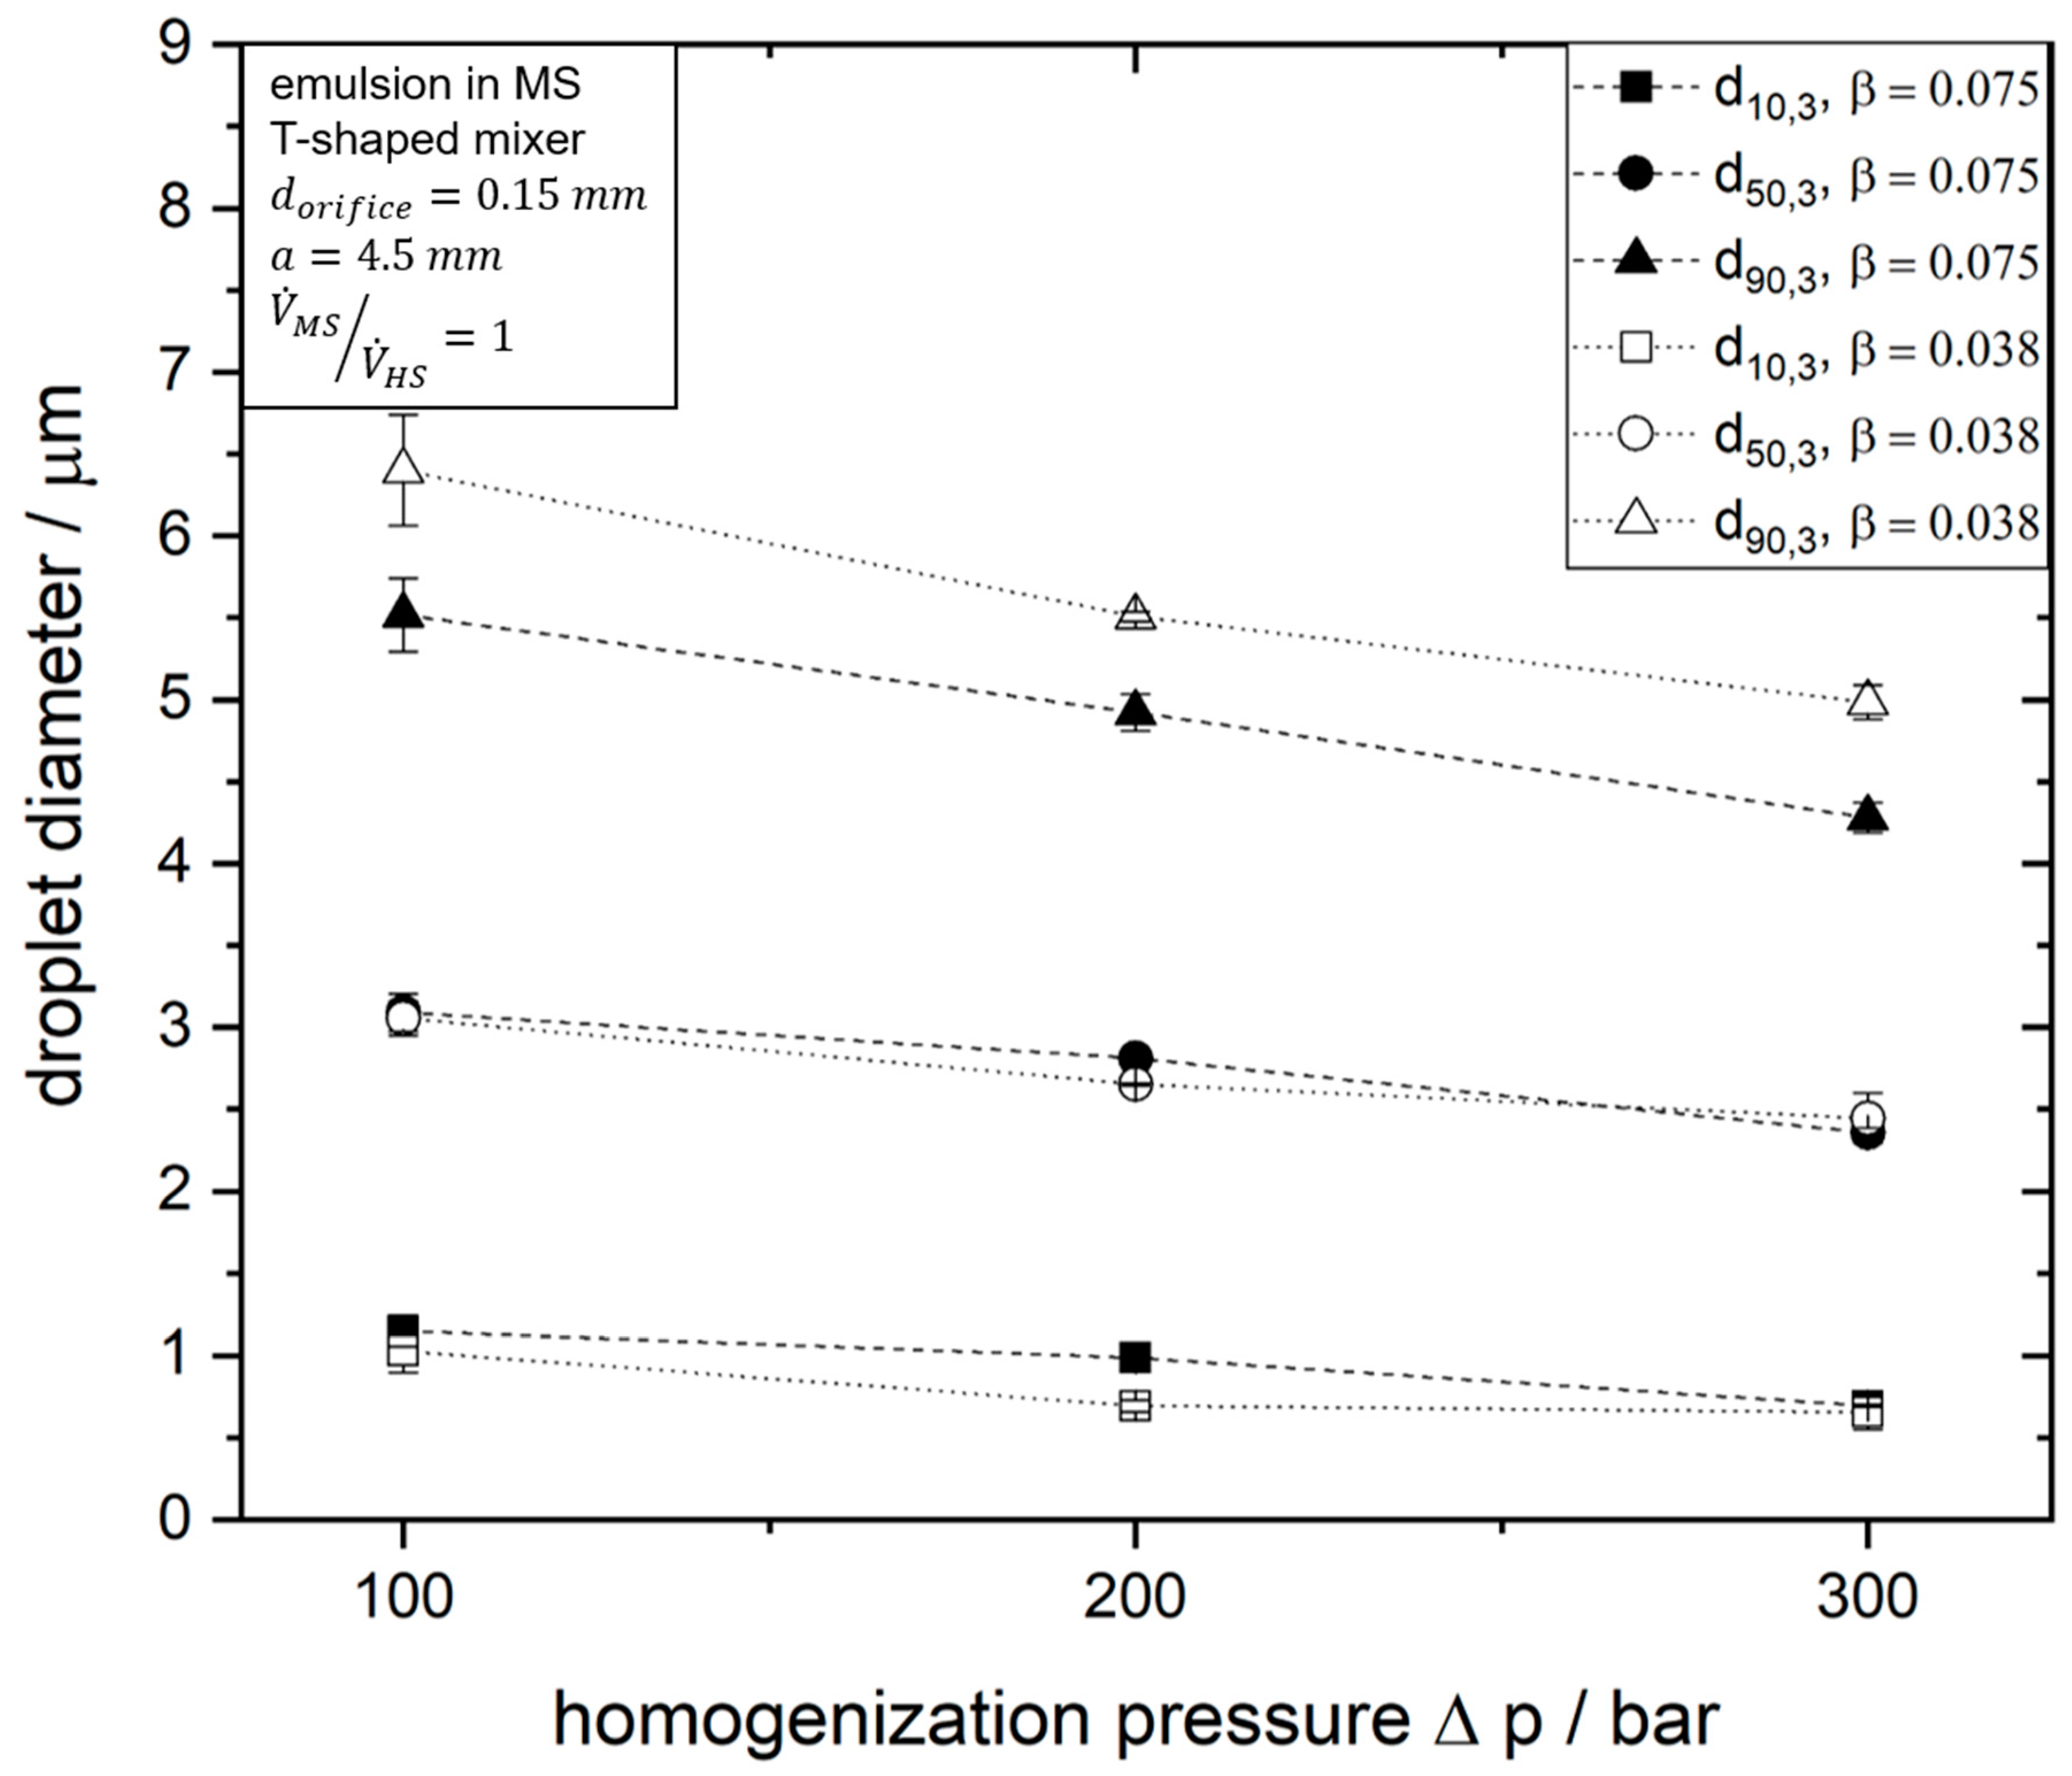
Figure 6 allows a more precise observation of the droplet size distribution based on the characteristic values d10,3, d50,3, d90,3 for the droplets in MS. On the basis of these characteristic values it can be seen that with a reduction of a slight shift from d90,3 to larger values has taken place at all . Thus the correlation between and the oil droplet size found in [18] for HPH is only valid if the droplets are added in the HS. The fact that the droplet size in the MS hardly changes at all and that d90,3 even increases slightly may be explained by two facts: Either the changed cavitation patterns have no significant effect on the break-up of droplets fed in the MS. However, it is more likely that this observation is due to the increase in doutlet associated with the reduction of . This geometric change will also change the streamlines that the droplets fed into the MS will take in the mixing chamber. With a larger doutlet, it may happen that some droplets pass through streamlines at the edge of the mixing chamber with lower disruptive forces. This presumption has to be verified in future work using different measurement techniques.
In any case, we can conclude that droplet breakup is not only influenced by the cavitation pattern in the mixing chamber of a SHM unit. Changing the streamlines of the droplets will also have an effect, especially when droplets are added in the MS.
4.2. Influence of Th Number on Oil Droplet Size
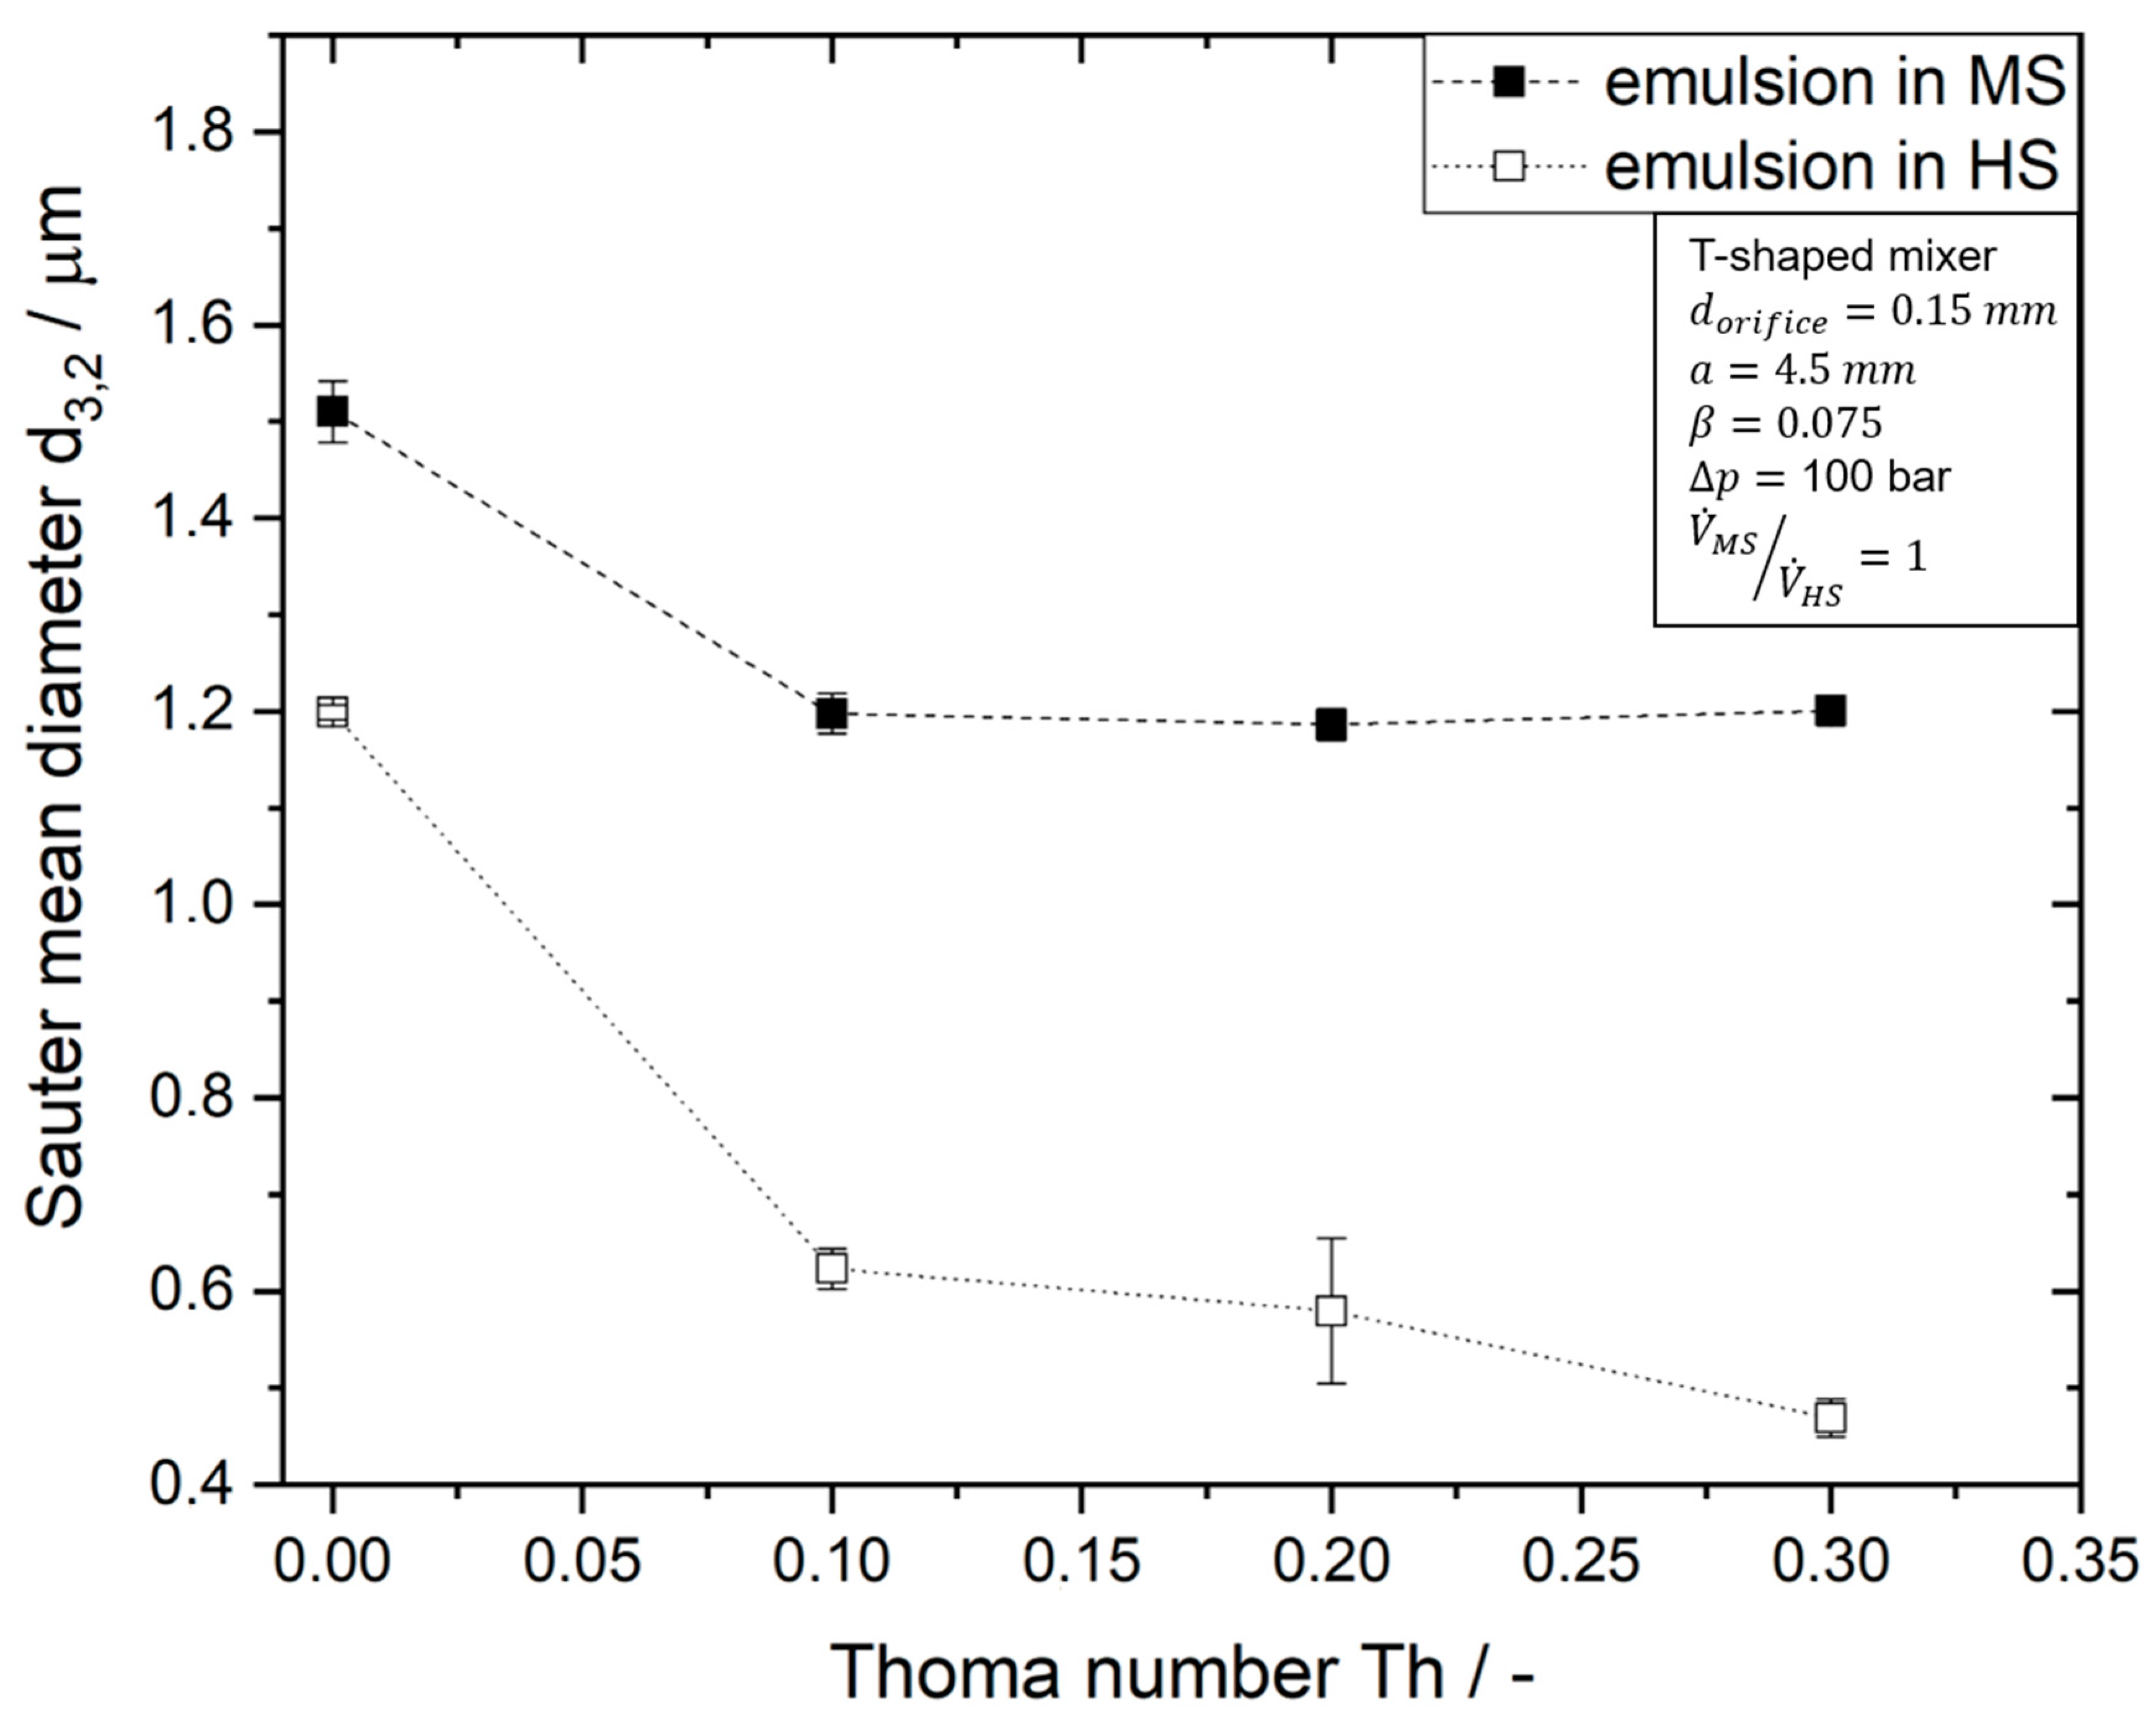
As cavitation is influenced by back-pressure, it is discussed how back-pressure and thus the Thoma number affects the oil droplet size. In Figure 7 the Sauter mean diameter is plotted over the Thoma number Th. Irrespective of whether the droplets are fed in the MS or HS, the Sauter mean diameter can be reduced by applying back-pressure. In previous works on HPH it is described that the droplet size decreases continuously with Th up to Th ≈ 0.25 at constant [28]. This observation generally also applies in the SHM unit to the droplets that are added in the HS. An increase of Th from 0 to 0.1 also causes a reduction of the d3,2 of droplets fed in the MS, but the decrease in the Sauter mean diameter is less pronounced. Increasing the Thoma number from 0 to 0.1 reduces the d3,2 of droplets in the HS from 1.20 ± 0.01 µm to 0.62 ± 0.02 µm, corresponding to 48%. For droplets in the MS, the decrease is from 1.51 ± 0.04 µm to 1.20 ± 0.02 µm or 21%. In addition, if Th is increased further, no further reduction in droplet size can be detected for droplets in the MS. The reason for this could be that the achievable droplet size in this case is limited because the droplets do not pass through the orifice and are therefore exposed to lower shear and elongational stresses. To explain the mechanisms of droplet break-up in detail, however, locally resolved investigations of the disruptive forces will be essential in the future.
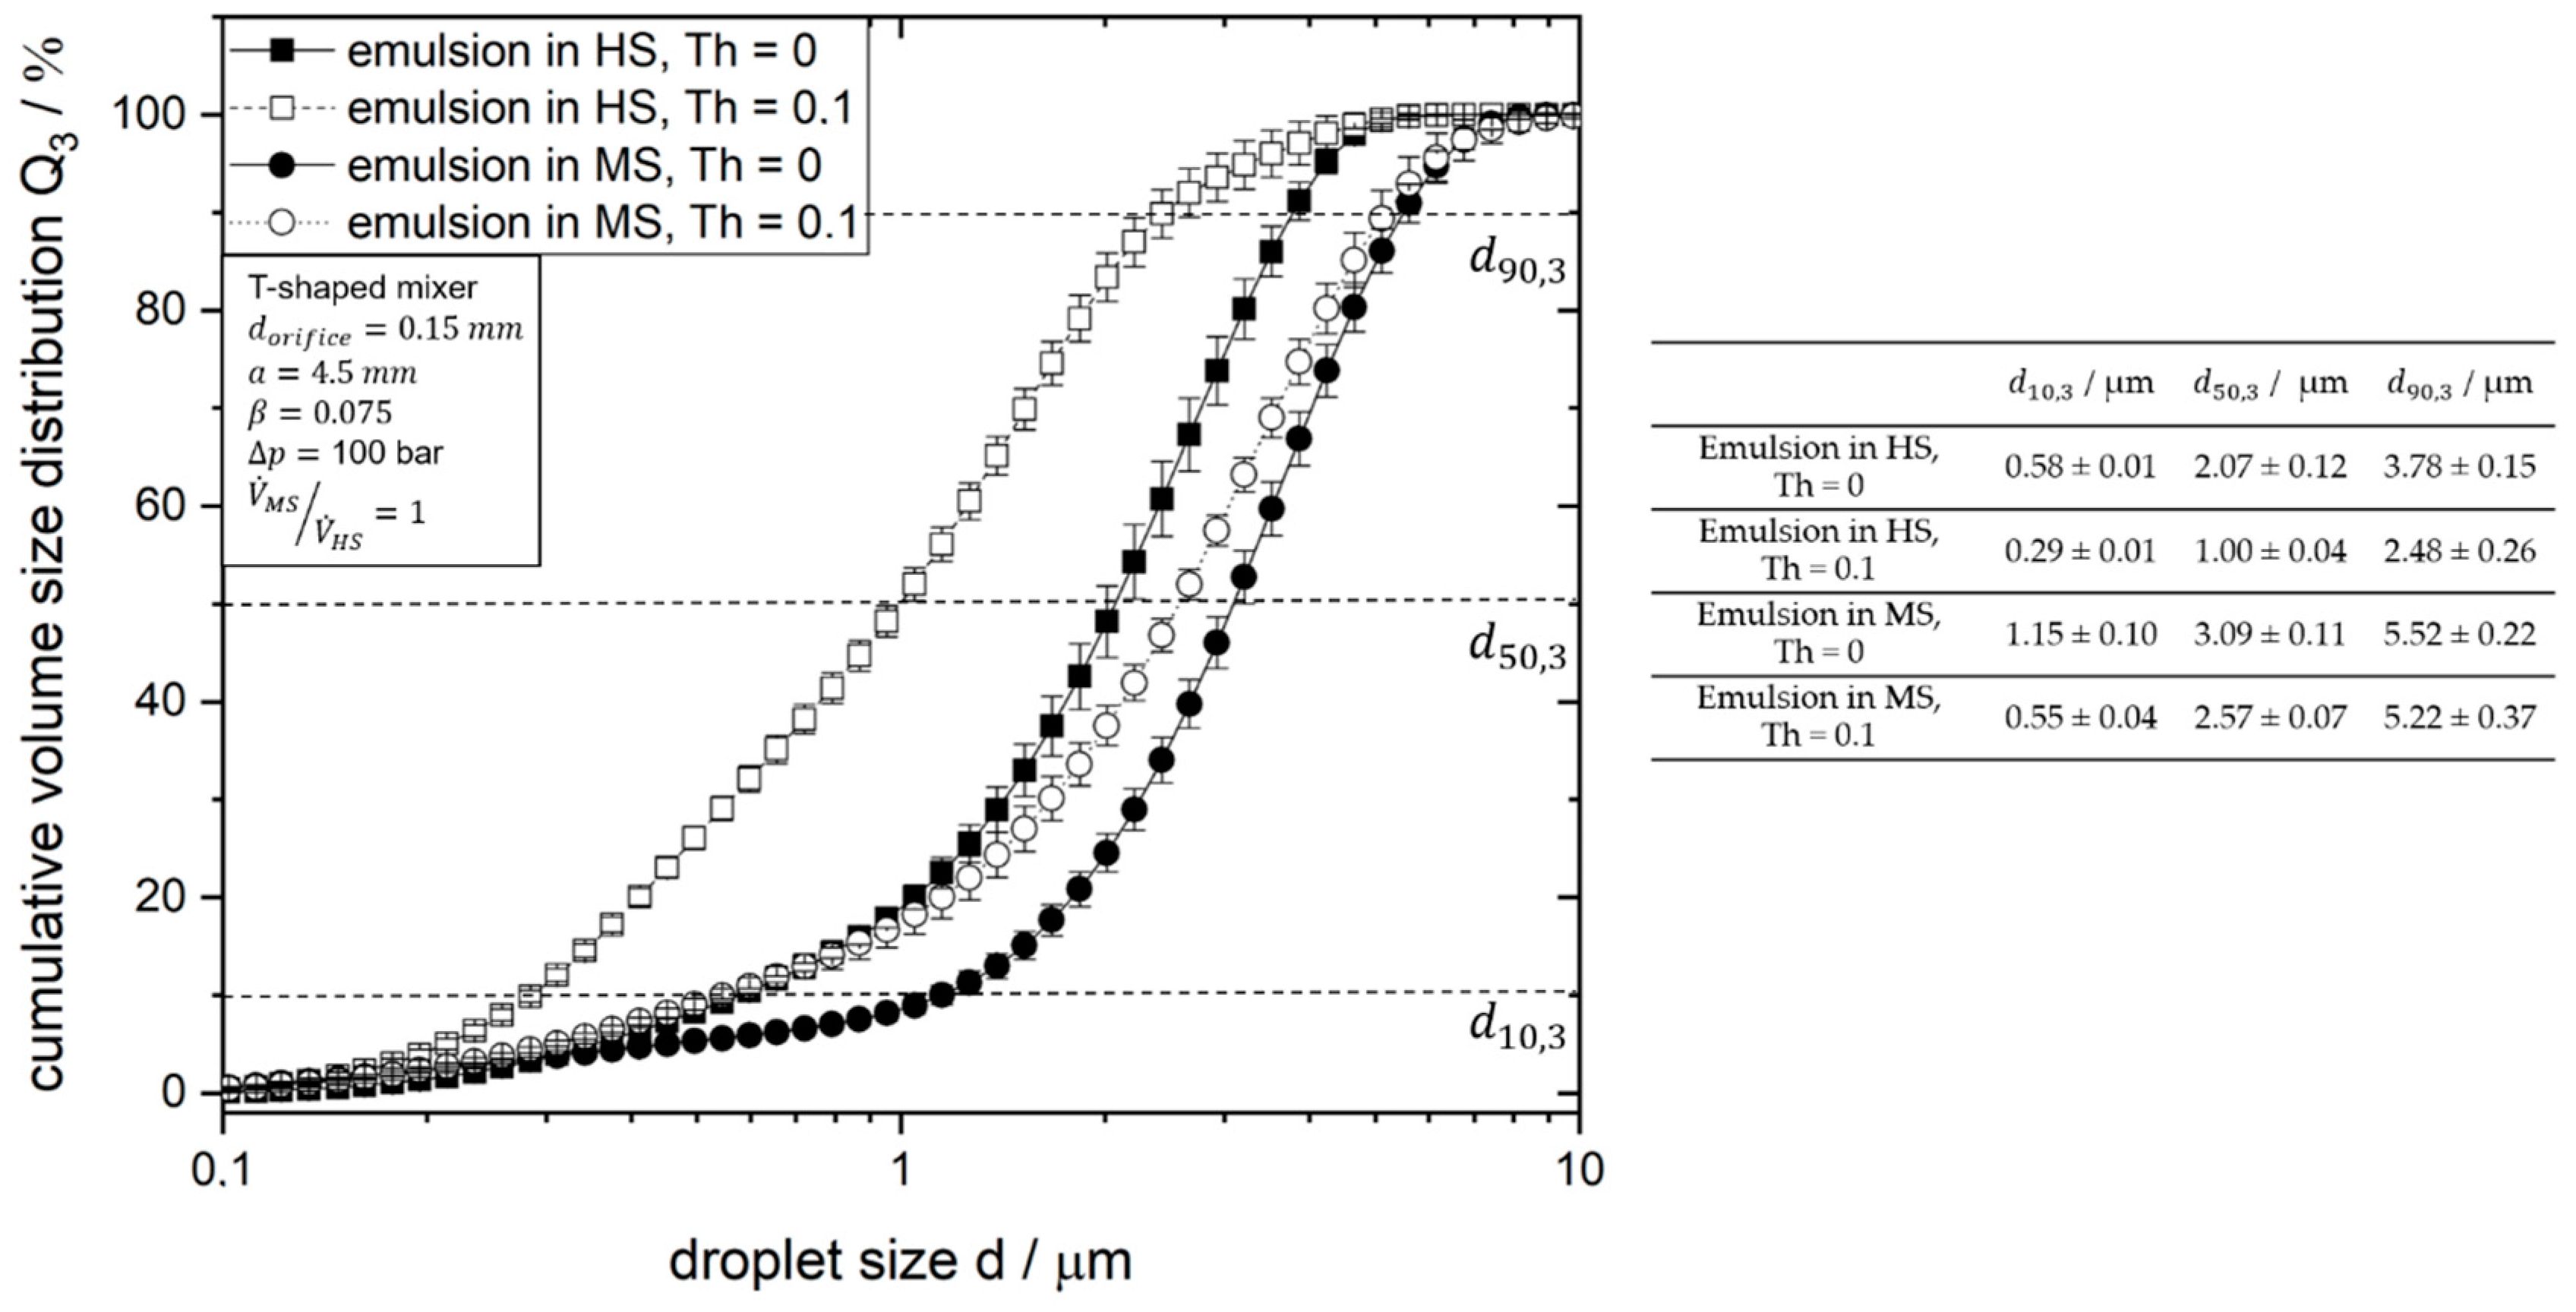
Figure 8 illustrates the total cumulative volume size distribution Q3 for Th = 0 and Th = 0.1. It is apparent that the increase in Th causes a shift of the entire distribution to smaller values and thus also a reduction of all characteristic values for droplets fed in the HS. However, the distribution of the droplets fed in the MS shows that although the smaller and middle sized droplets became smaller (represented by d10,3 and d50,3), the d3,90 remains unchanged. This suggests that the largest droplets which have passed through streamlines with comparatively low disruptive forces have not benefited from better disruption by decreased cavitation. For product design, this could be critical, as bigger droplets will lead to stability problems such as creaming or coalescence.
4.3. Influence of Mixing Ratio on Droplet Break-Up
As the droplet size distributions seem to be influenced by the mixing behavior in the SHM unit (especially for processing droplets in the MS), we investigated the influence of the mixing ratio on the oil droplet size. Figure 9 shows the change in the Sauter mean diameter as the mixing ratio varies from 1 to 5 at = 100 bar. It can be clearly seen that an increase in the mixing ratio leads to a strong increase in d3,2 if the droplets are added to the MS: From 1.51 ± 0.04 µm at = 1 to 3.08 ± 0.20 µm at = 5, the Sauter mean diameter doubles in size.
This observation can be attributed to the fact that the total mass flow downstream the orifice is increased sixfold due to the constant . It is to be expected that the increase of the MS will affect the flow field and the streamlines traversed by the MS. It is conceivable that fewer droplets will reach the area of high disruptive forces directly behind the orifice plate. The increase of the MS is also accompanied by a reduction of the residence time of the droplets in the mixing chamber and thus in the area of high disruptive forces. Looking at the characteristic values given in Table 1, it is noticeable that the increase in the mixing ratio causes an increase of d90 in the first line. This leads to the conclusion that by shortening the residence time in the mixing chamber some droplets remain in the area of the disruption-relevant flow for a shorter time.
For droplets that are added in a HS and thus pass the orifice plate, no influence of the mixing ratio on the oil droplet size distribution can be determined on the other side. Here, the d3,2 as well as d10,3, d50,30 and d90,3 remain constant despite the reduction of the residence time and the assumed change of the flow field. This can be explained by the fact that as the droplets pass through the orifice, they automatically pass through the streamlines of higher disruptive forces in the orifice and in the center of the mixing chamber.
4.4. Influence of Geometry of Mixing Unit on Cavitation Pattern and Droplet Size
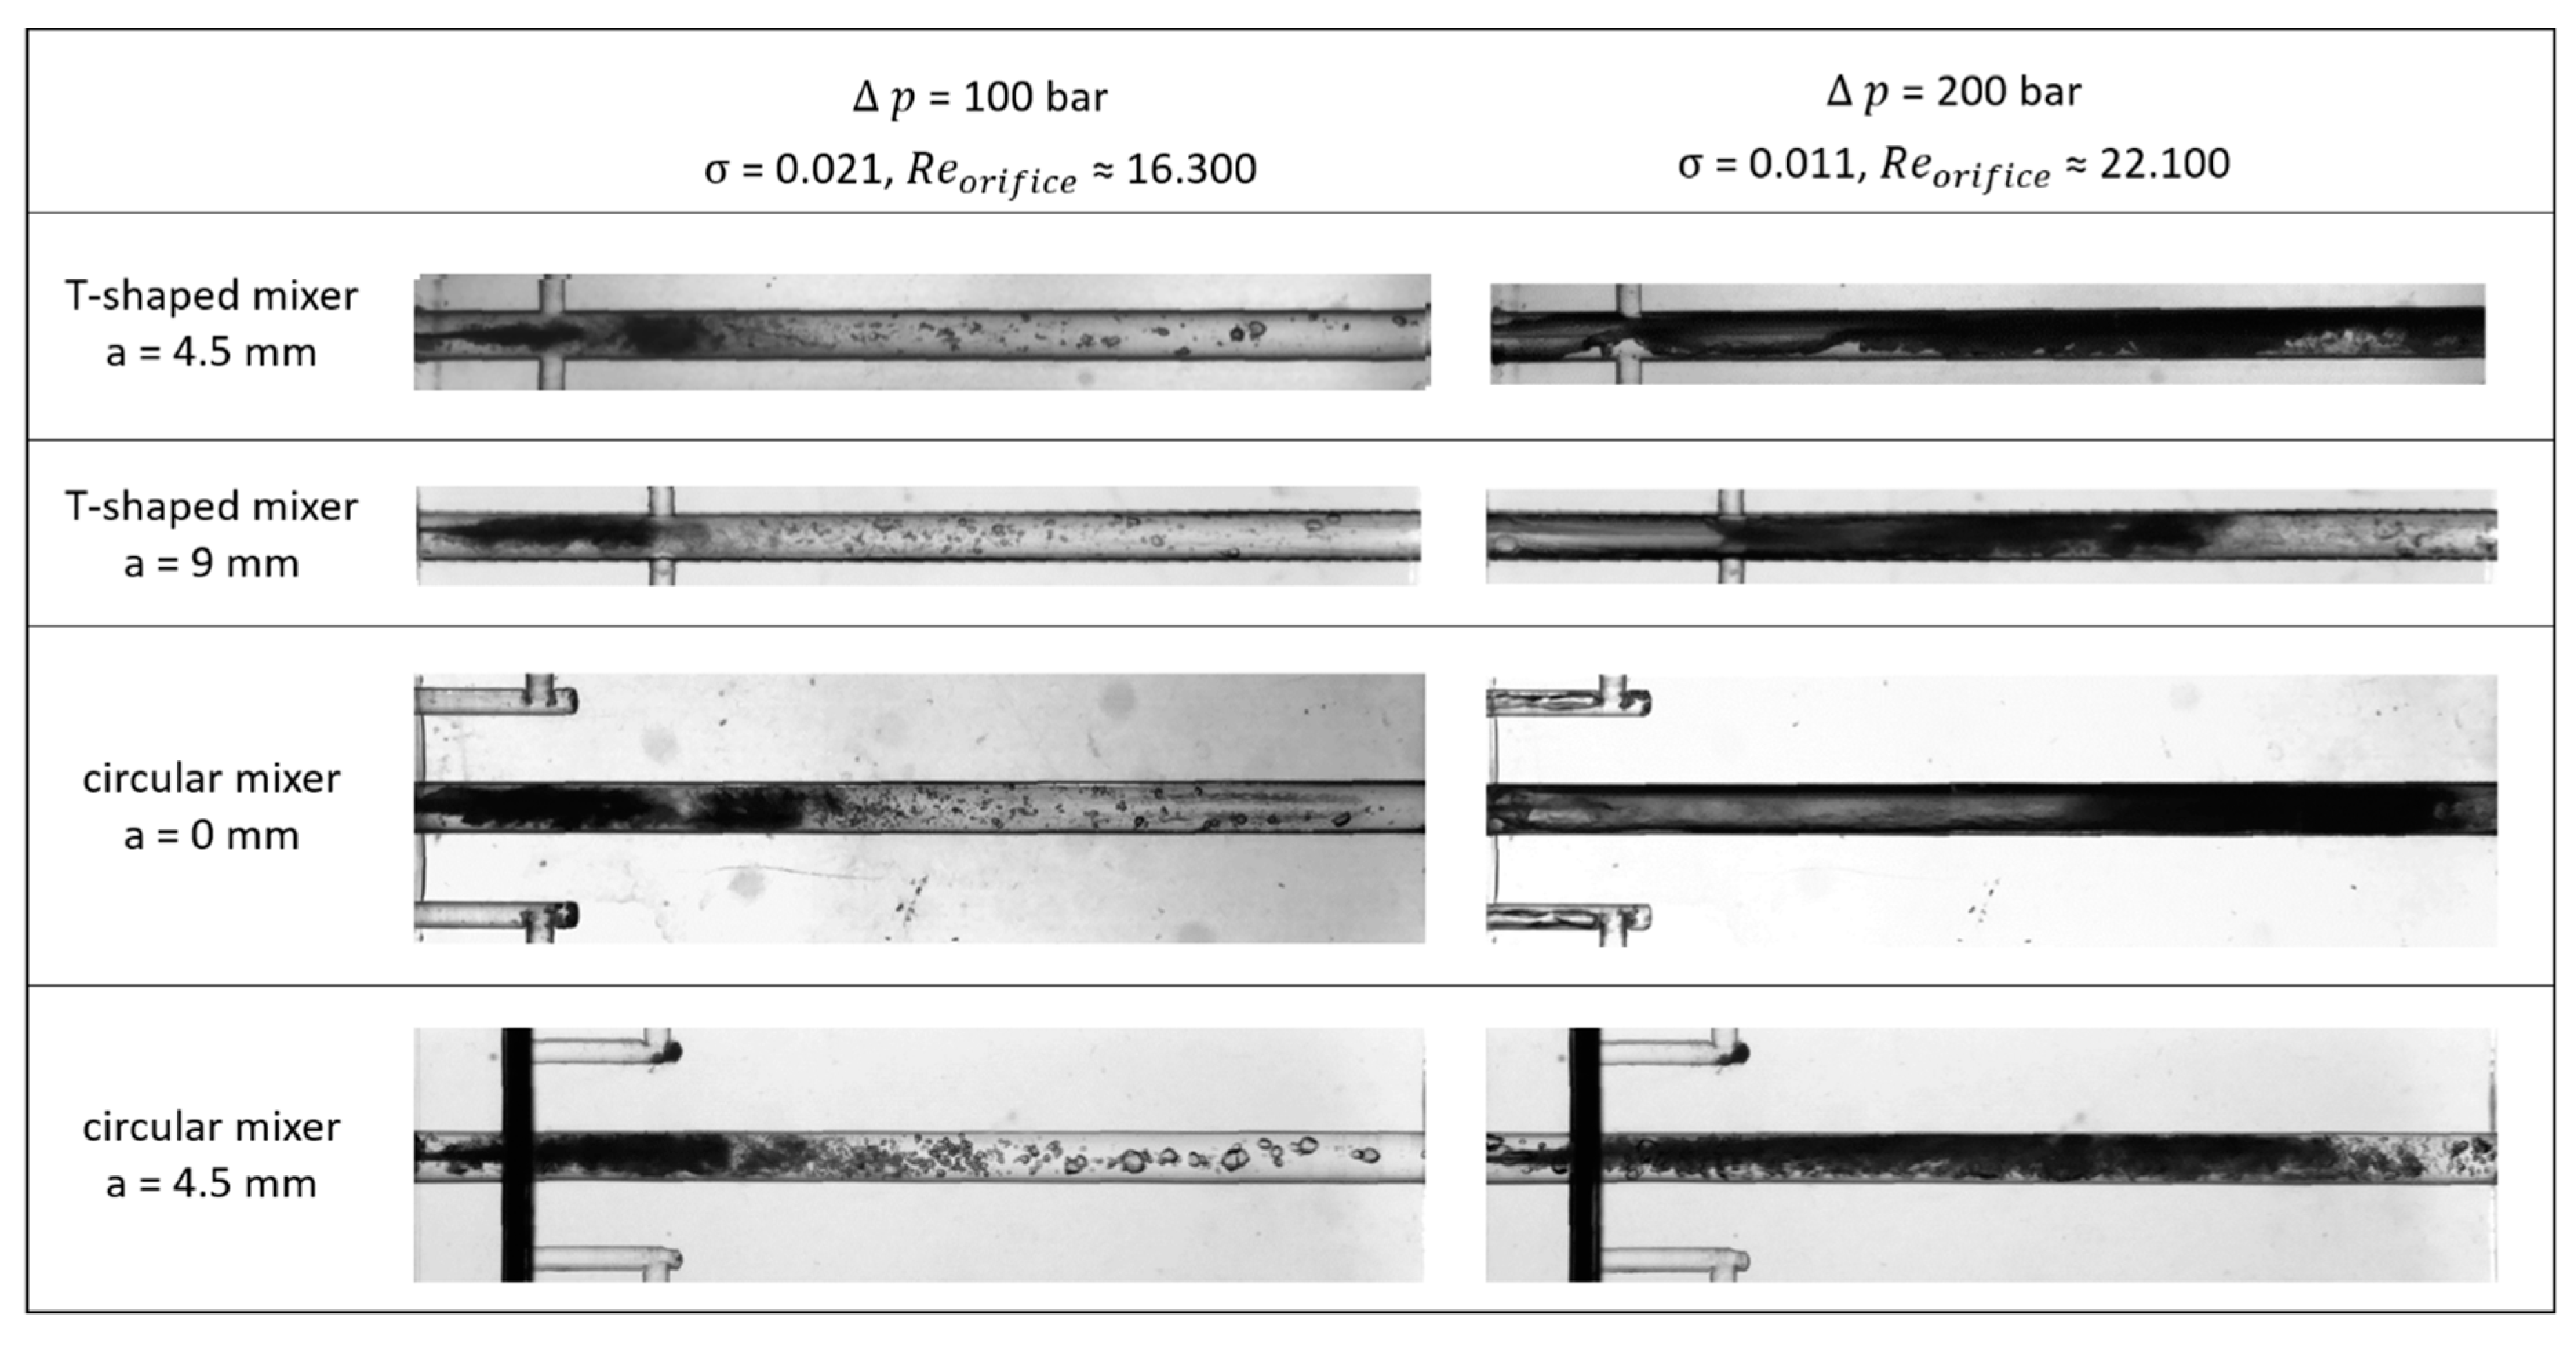
Changing the geometry of the mixing unit may influence cavitation patterns and mixing behavior. As we intended to investigate the influence of mixing effects at constant cavitation pattern, we had to ensure that the geometric changes do not affect the cavitation patterns. Figure 10 illustrates the shadow-graphic images captured for the different shapes of the MS feed (T-shape/circular shape). The illustrated cutout illustrates the optically accessible mixing chamber directly after the orifice. Dark areas in the mixing chamber are showing steam while the light areas show water. It becomes clear that for the T-shaped mixers and the circular mixer with a = 0 mm, at = 100 bar jet cavitation and at 200 bar and above, a hydraulic flip is observed. Jet cavitation consists of single cavities, while hydraulic flip is characterized by a large vapor bubble filling most of the outlet channel. For the circular mixer with a distance of a = 4.5 mm, however, no hydraulic flip was observed at 200 bar. In this case, choked cavitation is present and may have to be taken into account when discussing the emulsification results.
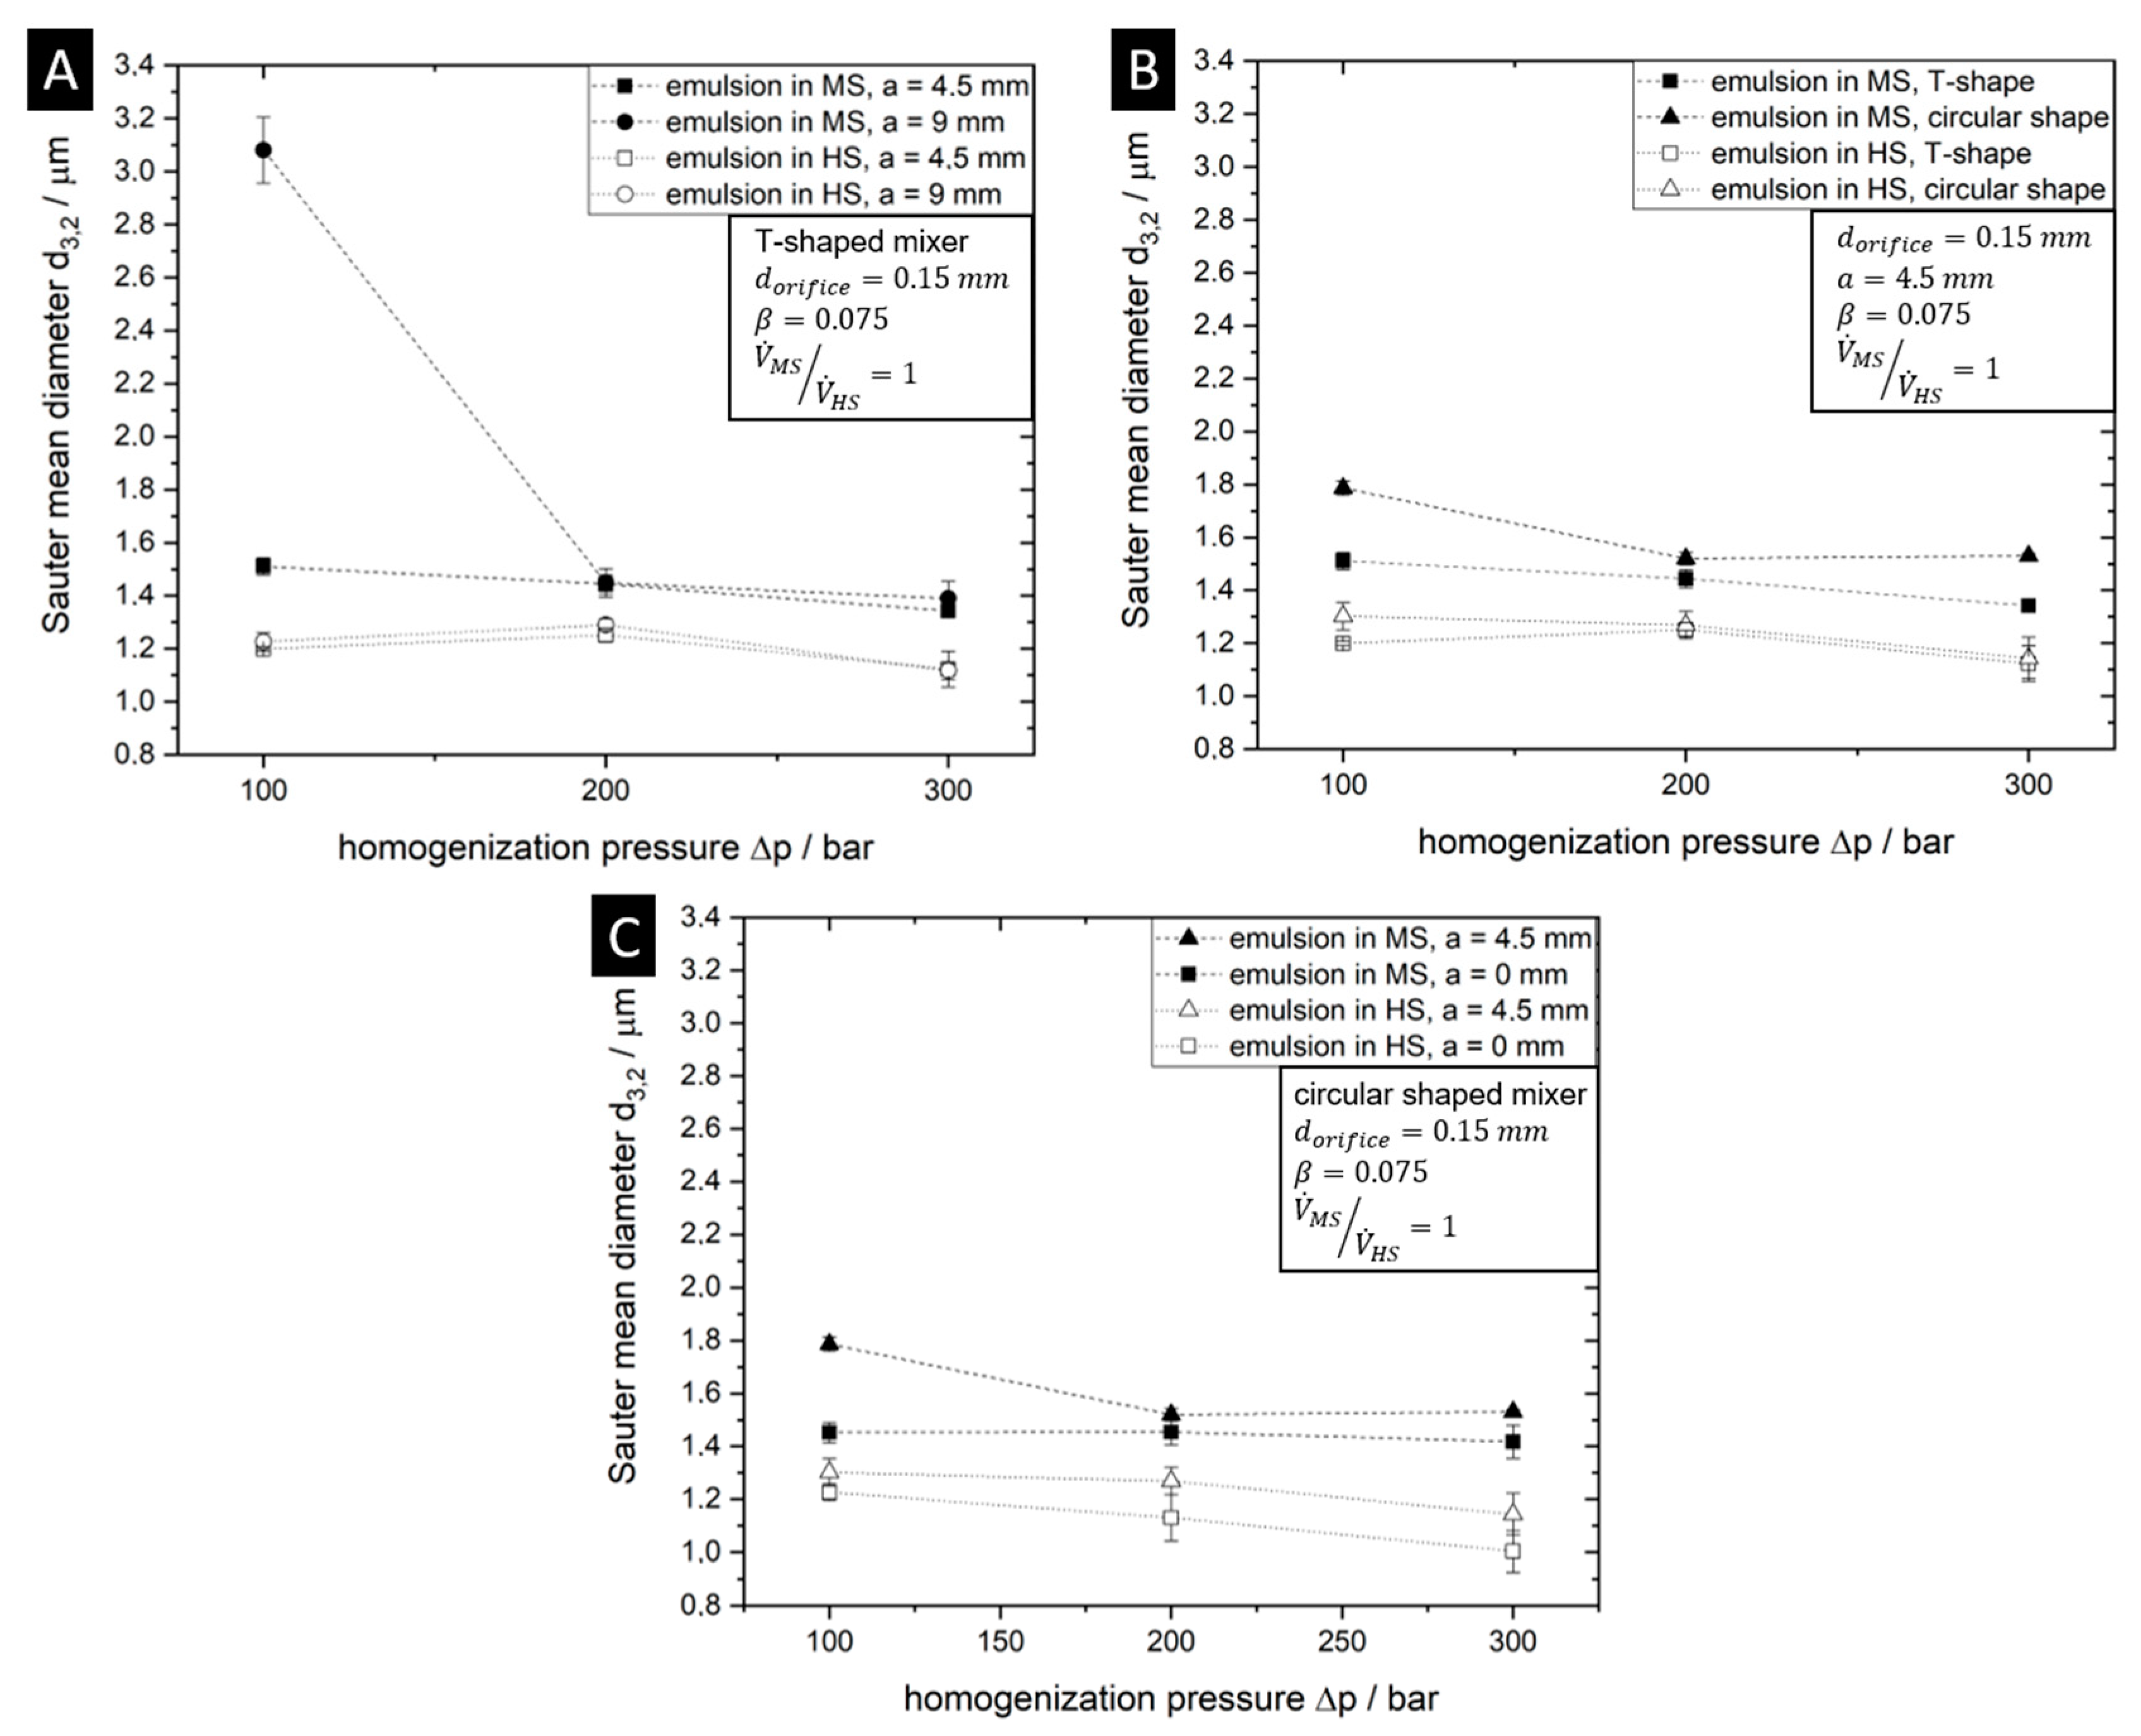
In the next paragraph, the effect of increasing the distance between orifice outlet and MS entrance is analyzed using the T-shaped mixer geometry. In Figure 11A, d3,2 is displayed above for a = 4.5 and a = 9 mm. It is immediately visible that the size of oil droplets added in HS is not changed by increasing the distance a. This underlines the observations of the previous chapter. Oil droplets fed in HS seem to be mainly affected by stresses in the middle of the mixing stream. In Figure 11A) it also immediately catches the eye that the increase in distance a causes considerable increase in d3,2 of droplets added to the MS: Values increase from 1.51 ± 0.03 µm (a = 4.5 mm) to 3.08 ± 0.12 µm (a = 9 mm) at = 100 bar. Yet at a pressure difference of = 200 and 300 bar no influence of a can be identified. This may be related to the cavitation patterns present at these process conditions, which are shown in Figure 10. At = 100 bar the droplets are added to a cavitating jet, and apparently the increase in distance in this case causes a considerable deterioration in d3,2. The two higher are each associated with a hydraulic flip. As can be seen in Figure 10, the droplets are added at both distances at a point where the cross-section is almost completely filled by a gas core. It should therefore be noted that when adding droplets in the MS, the influence of the distance depends on the cavitation pattern.
The mixing conditions can also be influenced by using different mixer shapes. In Figure 11B, d3,2 values achieved by using either a circular or T-mixer at a = 4.5 mm are compared. Again, there is no change of d3,2 for droplets added to the HS, which underlines the hypothesis that these droplets are mainly deformed and broken in the middle of the mixing stream. For droplets added in the MS, the use of a circular mixer leads to an increase in d3,2, especially at 100 bar. The effect could be caused by the fact that the MS in the inlet channel of the T-shaped mixer has a higher velocity for the same volume flow influencing the local velocity profile.
Finally, Figure 11c shows the effect of varying the distance a from a = 0 to a = 4.5 mm when using the circular mixer. Again, reducing a improves d3,2 to smaller values for droplets fed in the MS. In summary, a change in the mixing conditions and thus a change in the flow field within the scope of the examined parameters only has an effect if droplets are added to the MS.
5. Conclusions and Outlook
The results presented in this article clearly show that local flow conditions in the mixing chamber of SHM units are highly sensitive to parameters influencing cavitation patterns and local mixing of both streams. Both cavitation and mixing conditions influence oil droplet size distributions in the SHM process.
When the oil droplets are added in the HS, the effects of cavitation on droplet size described in the literature for HPH processes can be transferred to SHM processing. Both the avoidance of hydraulic flip by reducing and the avoidance of cavitation by applying a back-pressure resulted in a strong reduction of the mean Sauter diameter achieved. This effect should therefore be used in SHM applications where droplets are added in the HS. For processes with droplets fed in the MS, however, it is questionable whether the additional energy expenditure for applying back-pressure is worthwhile, as the stability-determining parameter d90,3 is barely effected by a reduction of the cavitation.
Furthermore, the size of droplets fed in the MS reacted sensitively to a change in the mixing conditions and therefore the flow field in the mixing chamber. Yet, the mixing conditions had hardly any influence on the size of droplets fed in the HS. We conclude that droplets fed in the HS apparently pass the areas of high disruptive forces in the orifice and the center of the mixing chamber independent of the set parameters. Droplets fed in the MS are more sensitive to the mixing conditions as these change their streamlines and the disruptive forces passed through. In order to obtain a small d3,2, a low mixing ratio and a small distance a between orifice and MS feed should be selected.
Hence, the focus of process design for SHM processes should either be on reducing cavitation or on adjusting the mixing conditions depending on which stream the droplets are fed.
With regard to further improving the understanding of droplet break-up in HPH processes, locally resolved investigations of the flow velocities and resulting stresses will be necessary in the future. Experimental methods like Micro-PIV and CFD simulations including cavitation models are promising approaches.
Author Contributions
Conceptualization, V.G. and H.P.K.; investigation, V.G.; resources, H.P.K.; writing—original draft preparation, V.G.; writing—review and editing, H.P.K.; supervision, H.P.K. All authors have read and agreed to the published version of the manuscript.
Funding
Part of this work was financed by DFG SPP 1934 (project no 425332181). The authors gratefully acknowledge the DFG for financial support.
Conflicts of Interest
The authors declare no conflict of interest.
References
- Schuchmann, H.P. Advances in Hydrodynamic Pressure Processing for Enhancing Emulsification and Dispersion. In Innovative Food Processing Technologies: Extraction, Separation, Component Modification and Process Intensification; Knoerzer, K., Juliano, P., Smithers, G., Eds.; Woodhead Publishing Series in Food Science, Technology and Nutrition; Woodhead Publishing: Sawston, UK, 2016; pp. 387–412. [Google Scholar]
- Walstra, P. Principles of emulsion formation. Chem. Eng. Sci. 1993, 48, 333–349. [Google Scholar] [CrossRef]
- Köhler, K.; Aguilar, F.A.; Hensel, A.; Schubert, K.; Schubert, H.; Schuchmann, H.P. Design of a Microstructured System for Homogenization of Dairy Products with High Fat Content. Chem. Eng.Technol. 2007, 30, 1590–1595. [Google Scholar] [CrossRef] [Green Version]
- Köhler, K.; Schuchmann, H.P. Simultanes Emulgieren und Mischen. CIT 2012, 84, 1538–1544. [Google Scholar] [CrossRef] [Green Version]
- Köhler, K.; Karasch, S.; Schuchmann, H.P.; Kulozik, U. Energiesparende Homogenisierung von Milch mit etablierten sowie neuartigen Verfahren. CIT 2008, 80, 1107–1116. [Google Scholar] [CrossRef]
- Gall, V.; Runde, M.; Schuchmann, H.P. Extending Applications of High-Pressure Homogenization by Using Simultaneous Emulsification and Mixing (SEM)—An Overview. Processes 2016, 4, 46. [Google Scholar] [CrossRef] [Green Version]
- Köhler, K.; Santana, A.S.; Braisch, B.; Preis, R.; Schuchmann, H.P. High pressure emulsification with nano-particles as stabilizing agents. Chem. Eng. Sci. 2010, 65, 2957–2964. [Google Scholar] [CrossRef]
- Köhler, K.; Hensel, A.; Kraut, M.; Schuchmann, H.P. Melt emulsification—Is there a chance to produce particles without additives? Particuology 2011, 9, 506–509. [Google Scholar] [CrossRef]
- Bisten, A.; Schuchmann, H.P. Optical Measuring Methods for the Investigation of High-Pressure Homogenisation. Processes 2016, 4, 41. [Google Scholar] [CrossRef] [Green Version]
- Kelemen, K.; Crowther, F.E.; Cierpka, C.; Hecht, L.L.; Kähler, C.J.; Schuchmann, H.P. Investigations on the characterization of laminar and transitional flow conditions after high pressure homogenization orifices. Microfluid. Nanofluid. 2014, 18, 599–612. [Google Scholar] [CrossRef]
- Bisten, A.; Rudolf, D.; Karbstein, H.P. Comparison of flow patterns and droplet deformations of modified sharp-edged and conical orifices during high-pressure homogenisation using µPIV. Microfluid. Nanofluid. 2018, 22, 607. [Google Scholar] [CrossRef]
- Innings, F.; Trägårdh, C. Analysis of the flow field in a high-pressure homogenizer. Exp. Therm. Fluid. Sci. 2007, 32, 345–354. [Google Scholar] [CrossRef]
- Håkansson, A.; Fuchs, L.; Innings, F.; Revstedt, J.; Trägårdh, C.; Bergenståhl, B. High resolution experimental measurement of turbulent flow field in a high pressure homogenizer model and its implications on turbulent drop fragmentation. Chem. Eng. Sci. 2011, 66, 1790–1801. [Google Scholar] [CrossRef]
- Håkansson, A. Emulsion Formation by Homogenization: Current Understanding and Future Perspectives. Annu. Rev. Food. Sci. Technol. 2019, 10, 239–258. [Google Scholar] [CrossRef] [PubMed]
- Franc, J.-P.; Michel, J.-M. Fundamentals of Cavitation; Fluid Mechanics and Its Applications, v. 76; Kluwer Academic Publishers: Dordrecht, The Netherlands; Boston, MA, USA, 2005. [Google Scholar]
- Yan, Y.; Thorpe, R.B. Flow regime transitions due to cavitation in the flow through an orifice. Int. J. Multiph. Flow 1990, 16, 1023–1045. [Google Scholar] [CrossRef]
- Schlender, M.; Minke, K.; Spiegel, B.; Schuchmann, H.P. High-pressure double stage homogenization processes: Influences of plant setup on oil droplet size. Chem. Eng. Sci. 2015, 131, 162–171. [Google Scholar] [CrossRef]
- Schlender, M.; Spengler, A.; Schuchmann, H.P. High-pressure emulsion formation in cylindrical coaxial orifices: Influence of cavitation induced pattern on oil drop size. Int. J. Multiph. Flow 2015, 74, 84–95. [Google Scholar] [CrossRef]
- Gall, V.; Ruetten, E.; Karbstein, H.P. Cavitation patterns in high-pressure homogenization nozzles with cylindrical orifices: Influence of mixing stream in Simultaneous Homogenization and Mixing. ECMF. (accepted).
- Kurzhals, H.A.; Reuter, H. Untersuchungen über die physikalisch-technischen Vorgänge beim Homogenisieren von Milch in Hochdruck-Homogenisiermaschinen. CIT 1979, 51, 325. [Google Scholar] [CrossRef]
- Köhler, K.; Aguilar, F.A.; Hensel, A.; Schubert, H.; Schuchmann, H.P. Design of a Micro-Structured System for the Homogenization of Dairy Producs at High Fat Content- Part III: Influence of Geometric Parameters. Chem. Eng. Techol. 2009, 32, 1120–1126. [Google Scholar] [CrossRef]
- Winkelmann, M.; Schuler, T.; Uzunogullari, P.; Winkler, C.A.; Gerlinger, W.; Sachweh, B.; Schuchmann, H.P. Influence of mixing on the precipitation of zinc oxide nanoparticles with the miniemulsion technique. Chem. Eng. Sci. 2012, 81, 209–219. [Google Scholar] [CrossRef]
- Sato, K.; Taguchi, Y.; Hayashi, S. High Speed Observation of Periodic Cavity Behavior in a Convergent-Divergent Nozzle for Cavitating Water Jet. JFCMV 2013, 1, 102–107. [Google Scholar] [CrossRef] [Green Version]
- Johansen, F.C. Flow through pipe orifices at low Reynolds numbers. Proc. R. Soc. Lond. A 1930, 126, 231–245. [Google Scholar]
- Innings, F.; Trägårdh, C. Visualization of the drop deformation and break-up process in a high pressure homogenizer. Chem. Eng. Technol. 2005, 28, 882–891. [Google Scholar] [CrossRef]
- Kelemen, K.; Schuch, A.; Schuchmann, H.P. Influence of flow conditions in high pressure orifices on droplet disruption of O/W emulsions. Chem. Eng. Technol. 2014, 37, 1227–1234. [Google Scholar] [CrossRef]
- De Giorgi, M.G.; Ficarella, A.; Tarantino, M. Evaluating cavitation regimes in an internal orifice at different temperatures using frequency analysis and visualization. Int. J. Heat Fluid Flow 2013, 39, 160–172. [Google Scholar] [CrossRef]
- Gothsch, T.; Richter, C.; Beinert, S.; Schilcher, C.; Schilde, C.; Büttgenbach, S.; Kwade, A. Effect of cavitation on dispersion and emulsification process in high-pressure microsystems (HPMS). Chem. Eng. Sci. 2016, 144, 239–248. [Google Scholar] [CrossRef]
- Schlender, M.; Minke, K.; Schuchmann, H.P. Sono-chemiluminescence (SCL) in a high-pressure double stage homogenization processes. Chem. Eng. Sci. 2016, 142, 1–11. [Google Scholar] [CrossRef]
- McKillop, A.A.; Dunkley, W.L.; Brockmeyer, R.L.; Perry, R.L. The Cavitation Theory of Homogenization. J. Dairy Sci. 1955, 38, 273–283. [Google Scholar] [CrossRef]
- Jahnke, S. The theory of high-pressure homogenization. In Emulsions and Nanosuspensions for the Formulation of Poorly Soluble Drugs; Benita, S., Bohm, B., Eds.; CRC Press: Boca Raton, FL, USA, 1998. [Google Scholar]
- Numachi, F.; Yamabe, M.; O-ba, R. Cavitation Effect on the Discharge Coefficient of the Sharp-Edged Orifice Plate. J. Fluids Eng. 1960, 82, 1–6. [Google Scholar] [CrossRef]
- Stanley, C. Experimental Investigation of Cavitation in a Cylindrical Orifice. Ph.D. Thesis, University of New South Wales, Kensington, Australia, 2012. [Google Scholar]
- Soyama, H.; Yanauchi, Y.; Sato, K.; Ikohagi, T.; Oba, R.; Oshima, R. High-speed observation of ultrahigh-speed submerged water jets. Exp. Therm. Fluid Sci. 1996, 12, 411–416. [Google Scholar] [CrossRef]
- Sou, A.; Hosokawa, S.; Tomiyama, A. Effects of cavitation in a nozzle on liquid jet atomization. Int. J. Heat Mass Transf. 2007, 50, 3575–3582. [Google Scholar] [CrossRef] [Green Version]
- Gogate, P.R.; Pandit, A.B. Hydrodynamic Cavitation Reactors: A State of the Art Review. Rev. Chem. 2001, 17, 1–85. [Google Scholar] [CrossRef]
- Finke, J.H.; Niemann, S.; Richter, C.; Gothsch, T.; Kwade, A.; Büttgenbach, S.; Müller-Goymann, C.C. Multiple orifices in customized microsystem high-pressure emulsification: The impact of design and counter pressure on homogenization efficiency. Chem. Eng. J. 2014, 248, 107–121. [Google Scholar] [CrossRef]
- Freudig, B.; Tesch, S.; Schubert, H. Production of emulsions in high-pressure homogenizers—Part II: Influence of Cavitation on Droplet Breakup. Eng. Life Sci. 2003, 6, 266–270. [Google Scholar] [CrossRef]
- Mohr, K.-H. High-pressure homogenization. Part II. The influence of cavitation on liquid-liquid dispersion in turbulence fields of high energy density. J. Food Eng. 1987, 6, 311–324. [Google Scholar] [CrossRef]
- Håkansson, A. Flow pulsation plays an important role for high-pressure homogenization in laboratory-scale. Chem. Eng. Res. Des. 2018, 138, 472–481. [Google Scholar] [CrossRef]
- Danner, T. Tropfenkoaleszenz in Emulsionen. Ph.D. Thesis, Universität Karlsruhe (TH), Karlsruhe, Germany, 2001. [Google Scholar]
- Tesch, S. Charakterisieren mechanischer Emulgierverfahren: Herstellen und Stabilisieren von Tropfen als Teilschritte Beim Formulieren von Emulsionen. Ph.D. Thesis, Universität Karlsruhe (TH), Karlsruhe, Germany, 2002. [Google Scholar]
- Rahman, A.; Brown, C.W. Effect of pH on the critical micelle concentration of sodium dodecyl sulphate. J. Appl. Polym. Sci. 1983, 28, 1331–1334. [Google Scholar] [CrossRef]
- Pacek, A.W.; Man, C.C.; Nienow, A.W. On the Sauter mean diameter and size distributions in turbulent liquid/liquid dispersions in a stirred vessel. Chem. Eng. Sci. 1998, 53, 2005–2011. [Google Scholar] [CrossRef]
- Schuchmann, H.P.; Köhler, K. (Eds.) Emulgiertechnik; Behr‘s: Hamburg, Germany, 2012; Volume 3. [Google Scholar]
Figure 1.
Scheme of the SHM process. Operation modes are differentiated depending on whether emulsion droplets are fed in the HS or MS.
Figure 1.
Scheme of the SHM process. Operation modes are differentiated depending on whether emulsion droplets are fed in the HS or MS.

Figure 2.
Cavitation patterns at different homogenization pressures for β = 0.038 and β = 0.075 (images newly arranged from [19]).
Figure 2.
Cavitation patterns at different homogenization pressures for β = 0.038 and β = 0.075 (images newly arranged from [19]).

Figure 3.
Setup of the experimental plant. Setup a is used for trials with applied back-pressure, setup b for trials in which the outlet pressure equals atmospheric pressure.
Figure 3.
Setup of the experimental plant. Setup a is used for trials with applied back-pressure, setup b for trials in which the outlet pressure equals atmospheric pressure.

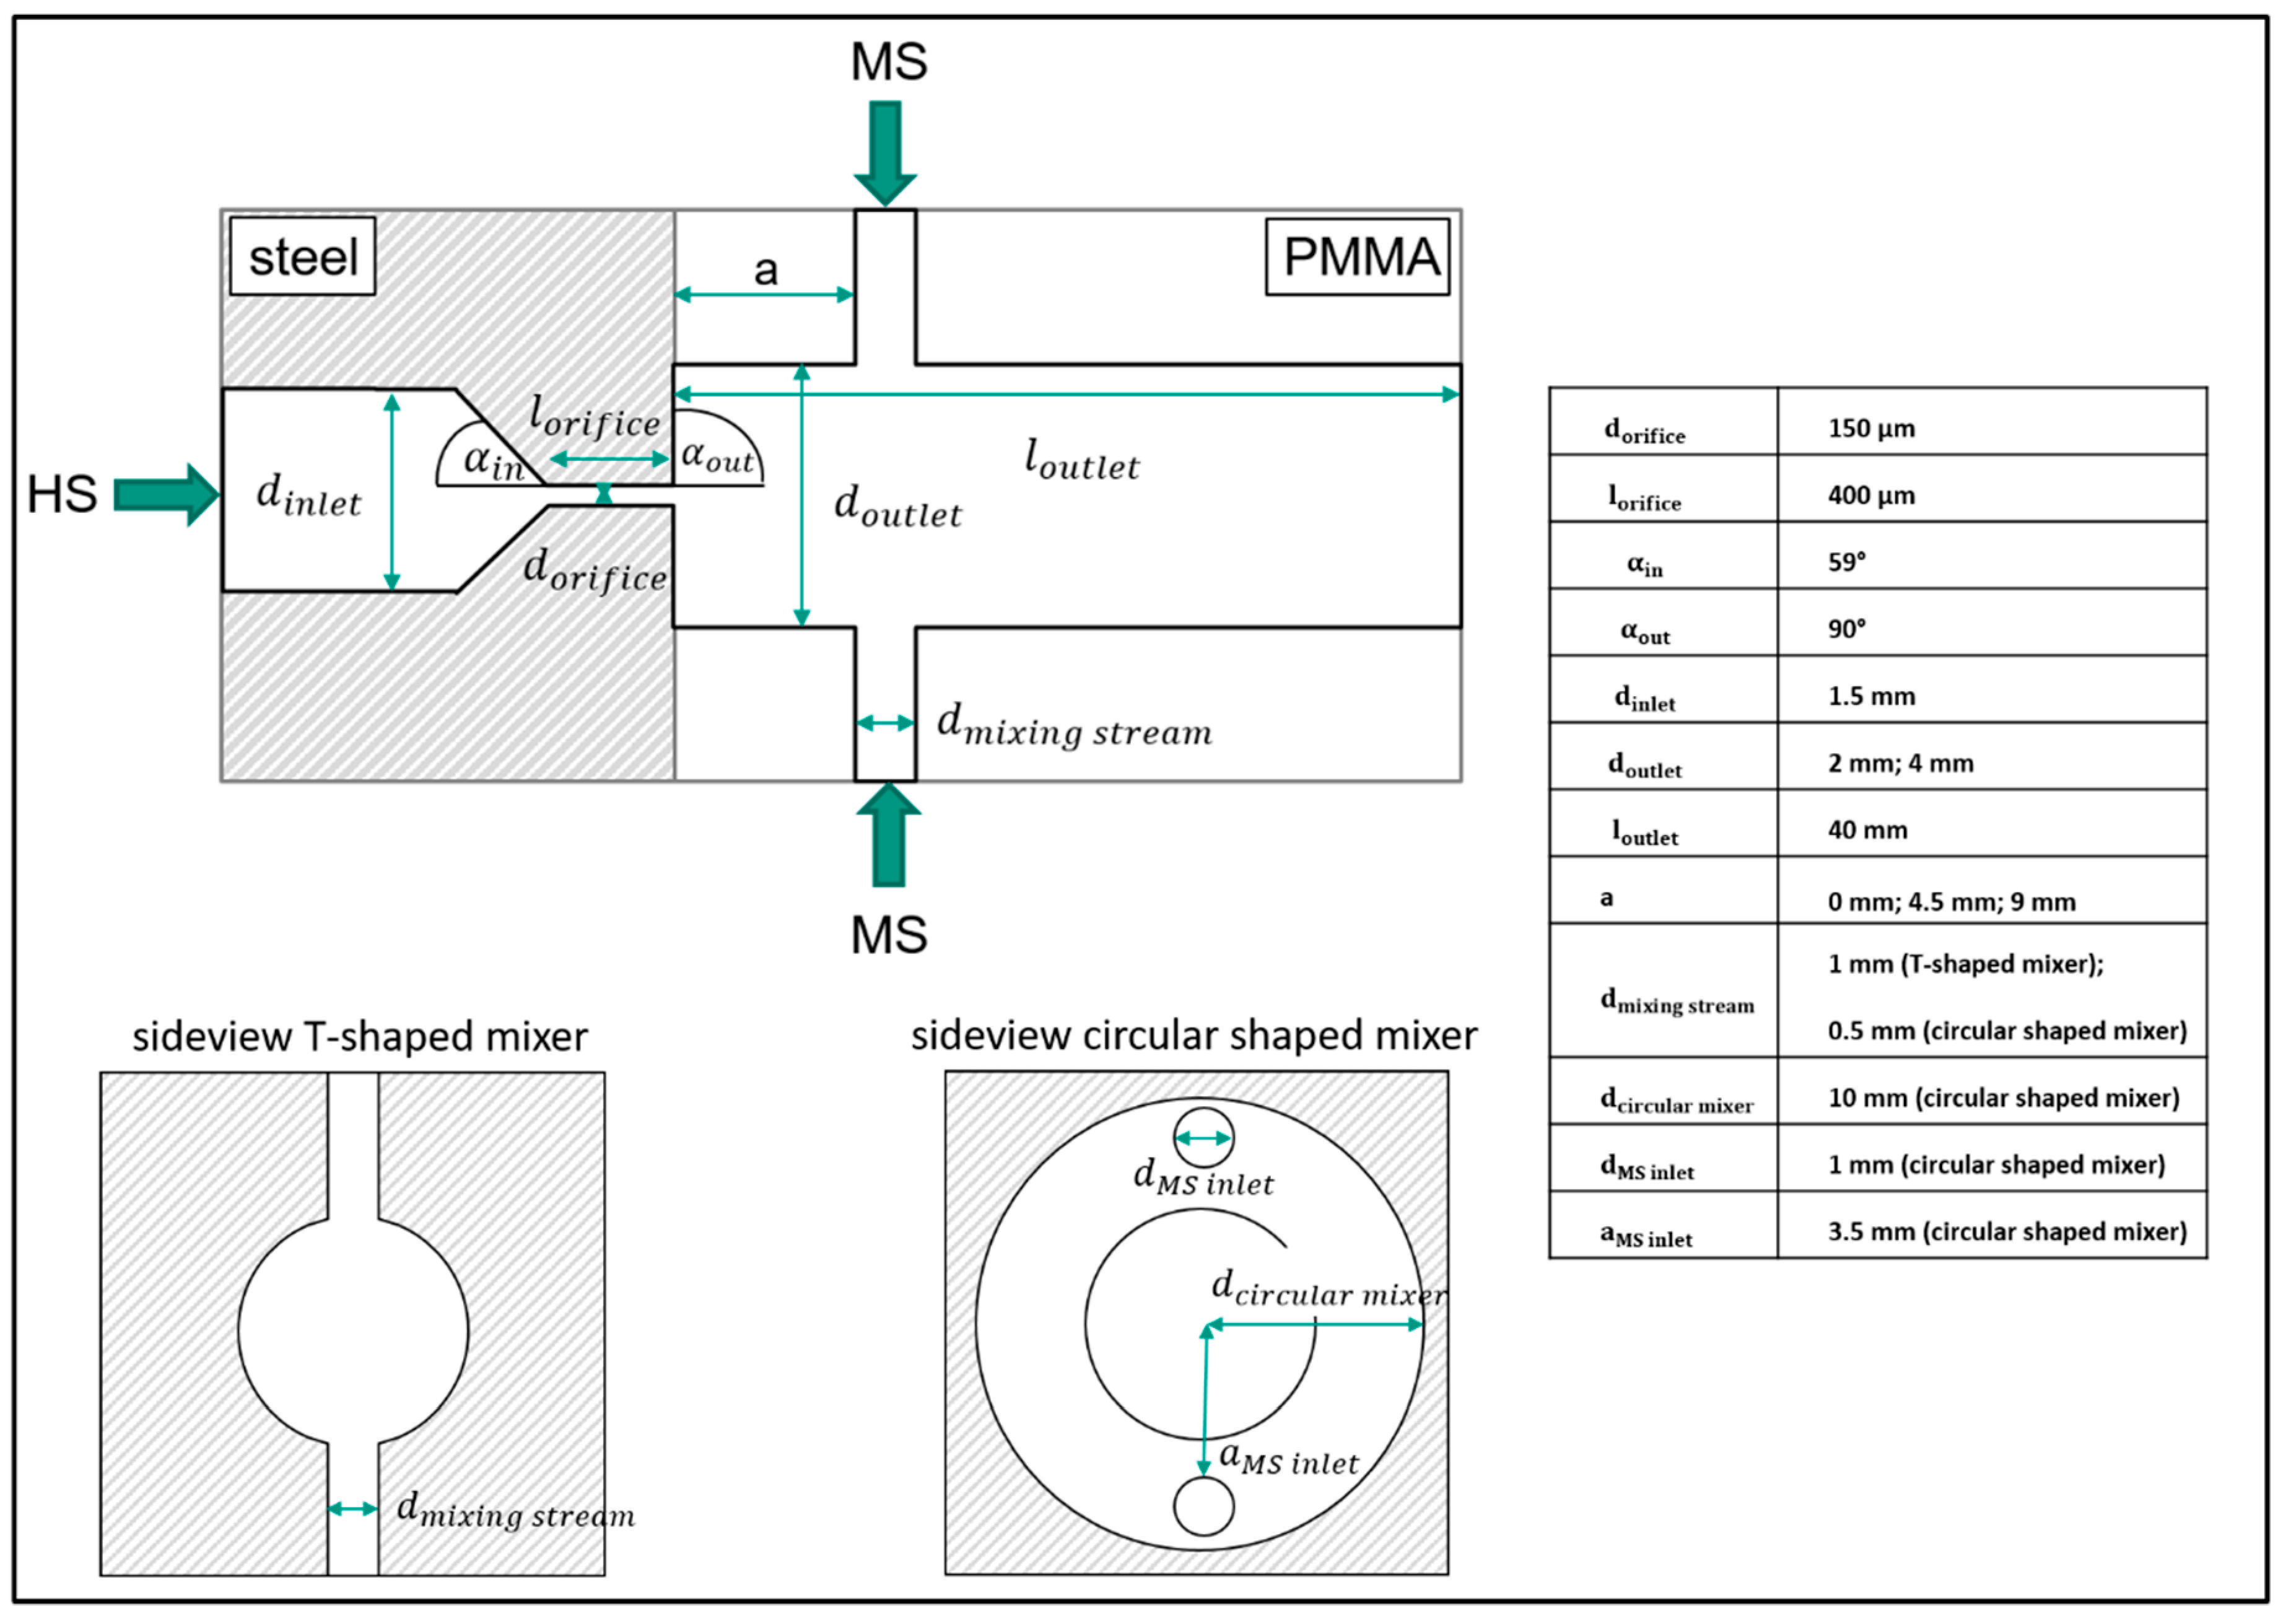
Figure 4.
Geometry of disruption unit.

Figure 5.
Influence of homogenization pressure and β on d3,2. The cavitation patterns determined in [19] have been supplemented for better readability.
Figure 5.
Influence of homogenization pressure and β on d3,2. The cavitation patterns determined in [19] have been supplemented for better readability.

Figure 6.
Influence of homogenization pressure and β on d90,3, d50,3 and d90,3 for droplets fed in the MS.
Figure 6.
Influence of homogenization pressure and β on d90,3, d50,3 and d90,3 for droplets fed in the MS.

Figure 7.
Influence of Thoma number Th on d3,2 for Δp = 100 bar.

Figure 8.
Influence of Th on droplet size distribution and its characteristic values for Δp = 100 bar.
Figure 8.
Influence of Th on droplet size distribution and its characteristic values for Δp = 100 bar.

Figure 9.
Influence of mixing ratio on d3,2 for Δp = 100 bar.

Figure 10.
Cavitation patterns captured for different geometries of the mixing unit.

Figure 11.
Influence of geometry of mixing unit on d3,2. (A) displays for the T-shaped mixer under variation of a, (B) compares for both mixers and a = 4.5 mm and (C) displays for the circular shaped mixer under variation of a.
Figure 11.
Influence of geometry of mixing unit on d3,2. (A) displays for the T-shaped mixer under variation of a, (B) compares for both mixers and a = 4.5 mm and (C) displays for the circular shaped mixer under variation of a.


Table 1.
Influence of mixing ratio on characteristic values.
| Emulsion in MS, = 1 | 1.15 ± 0.10 | 3.09 ± 0.11 | 5.52 ± 0.22 |
| Emulsion in MS, = 2 | 1.32 ± 0.13 | 3.32 ± 0.04 | 5.92 ± 0.19 |
| Emulsion in MS, = 5 | 1.82 ± 0.05 | 3.92 ± 0.02 | 7.90 ± 0.14 |
| Emulsion in HS, = 1 | 0.58 ± 0.01 | 2.07 ± 0.12 | 3.78 ± 0.15 |
| Emulsion in HS, = 2 | 0.57± 0.05 | 2.13 ± 0.18 | 3.85 ± 0.27 |
| Emulsion in HS, = 5 | 0.56 ± 0.02 | 2,10 ± 0.10 | 3.89 ± 0.05 |
Publisher’s Note: MDPI stays neutral with regard to jurisdictional claims in published maps and institutional affiliations. |
© 2020 by the authors. Licensee MDPI, Basel, Switzerland. This article is an open access article distributed under the terms and conditions of the Creative Commons Attribution (CC BY) license (http://creativecommons.org/licenses/by/4.0/).
Share and Cite
MDPI and ACS Style
Gall, V.; Karbstein, H.P. Influence of Cavitation and Mixing Conditions on Oil Droplet Size in Simultaneous Homogenization and Mixing (SHM). ChemEngineering 2020, 4, 64. https://0-doi-org.brum.beds.ac.uk/10.3390/chemengineering4040064
AMA Style
Gall V, Karbstein HP. Influence of Cavitation and Mixing Conditions on Oil Droplet Size in Simultaneous Homogenization and Mixing (SHM). ChemEngineering. 2020; 4(4):64. https://0-doi-org.brum.beds.ac.uk/10.3390/chemengineering4040064
Chicago/Turabian StyleGall, Vanessa, and Heike P. Karbstein. 2020. "Influence of Cavitation and Mixing Conditions on Oil Droplet Size in Simultaneous Homogenization and Mixing (SHM)" ChemEngineering 4, no. 4: 64. https://0-doi-org.brum.beds.ac.uk/10.3390/chemengineering4040064