3.1.1. Time Resolved Investigation at the Macro Scale
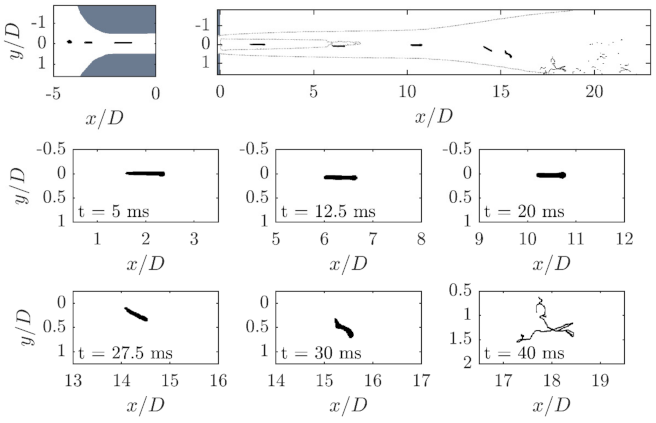
Figure 6 shows a time series of droplet image recordings before, inside and behind the orifice. These images correspond to a strictly scaled material system with a viscosity ratio
and
. The coordinate origin is in all representations the axis of symmetry of the orifice bore at the height of the orifice outlet. It is clear that the droplet is strongly deformed when passing through the orifice, but does not disintegrate. The aspect ratio (
) of the elongated drop, which is the filament length divided by the diameter of the undeformed drop, is approximately 4.5. The deformation is caused by the shear and elongation flows in the inlet area, just upstream of and at the beginning of the constriction of the orifice. The droplet breaks up after the orifice, as it transitions from the laminar core area of the jet to the turbulent area of the free jet boundary layer. This happens in the
range between 10 and
.
Until the droplet reaches this area, it travels relatively undisturbed within the core flow. Due to the absence of external stresses, the droplet can partially relax because the internal or restoring forces dominate. To visualize this process, three images of the same droplet at different times are shown in
Figure 7. The decrease in length can be clearly seen in these enlarged views.
.
When the stable jet breaks down, the droplet follows the free jet, whereby the previously straight path is deflected. Due to the steadily increasing turbulence of the flow, the stretched droplet is deformed three-dimensionally. During this process, the filament is significantly stretched. The stretching of the filament due to the turbulent action is achieved by many simultaneously occurring drop-vortex interactions, which is why the filament is highly stretched within a very short time. This process is mainly dominated by turbulence and is highly three-dimensional and chaotic. The filament diameters can become very small, making an exact detection with the camera setup impossible.
Nevertheless, it is possible to observe single spherical secondary droplets in the wake of the free jet, which are caused by pinching of the filament. In the area of low velocity and turbulence downstream of the orifice, the stresses are no longer strong enough to stretch or break the stretched filament further, so that the fragments relax into round secondary droplets.
The localization of the droplet break-up on the area of the turbulent shear layer can be carried out by superimposing flow fields determined by PIV and the droplet position and has already been shown in Mutsch and Kähler [
44]. Furthermore, this is shown by the temporally resolved turbulent droplet movement.
The droplet breakup occurs because the vortices deform and stretch the drop. The first vortices with which the droplet interacts are relatively large, since they are relatively undisturbed Kelvin-Helmholtz vortices, and therefore lead to a viscous 3D deformation and twisting of the droplet filaments. This drop-vortex interaction can also cause the droplet to stretch. As the process continues, the vortices become smaller in accordance with the vortex cascade, whereas the droplet or droplet filament becomes longer. Due to this increasing spatial extension compared to the eddies, the droplet interacts with several eddies simultaneously, which leads to a turbulent 3D twisting and stretching of the filament. Since the vortices stress the filament spatially differently, the elongation and the associated reduction in cross-section of the filament are not uniform. At a certain point, the filament breaks up into fine secondary droplets. However, this break-up does not take place simultaneously over the entire droplet filament, but occurs locally, depending on the stress ratio.
3.1.2. Comparison of the Droplet Trajectory
The droplet shown in
Figure 6 flows through the orifice almost on the axis of symmetry. In the test plant used, the droplet feed point can be shifted relative to the orifice or the axis of symmetry, so that it is possible to investigate the influence of the droplet trajectory on droplet break-up. The droplet trajectory is characterized by the dimensionless radius of the droplet injection point:
These investigations on the influence of the droplet trajectory show that the droplet feeding position or, in production plants, the statistical droplet distribution over the inflow cross-section has an important influence on the resulting droplet break-up.
Figure 8 and
Figure 9 show the evolution of droplets that have passed through the orifice on different trajectories compared to the path shown in
Figure 6.
Droplets passing through the orifice close to the axis of symmetry (see
Figure 6) are mainly pre-stretched by the elongational flow in the inlet area of the orifice. Due to the smooth flow along the axis of symmetry inside the orifice and in the core region of the free jet, this droplet has the longest time to relax, since the free jet core is statistically longest along the axis of symmetry. The droplet break-up therefore occurs comparatively far downstream. Droplets flowing further outside through the orifice reach the shear layer faster due to slight fluctuations in velocity and therefore break-up earlier.
.
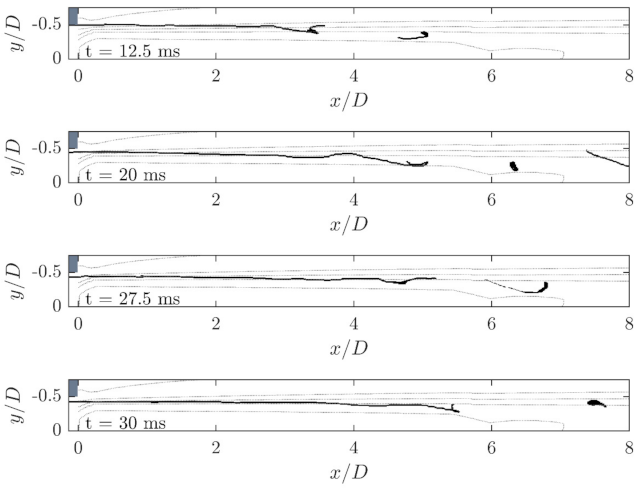
The droplet shown in
Figure 8 is injected on a trajectory close to the edge of the channel (
) and is highly affected by the shear layer. The initially symmetrical droplet passes through the orifice in the area of the boundary layer. As a result, half of the droplet facing the axis of symmetry of the orifice is exposed to a higher flow velocity than the side facing away from the axis of symmetry of the orifice. As a result of this shear field, the droplet is deformed. In the time series shown in
Figure 8, the inner trailing edge of the initially approximately cylindrical droplet filament appears to be shifted forward relative to the center of the drop. The outer trailing edge of the droplet stops according to the slow ambient flow, thus stretching the filament. As a result of this process, the filament length increases to a multiple of the cylindrical filament length created by the elongational flow in the inlet area of the orifice. From a running length of
, the first vortices collide with the filament which is stretched further and further by the shear, so that a deformation perpendicular to the flow direction also occurs. This might be the effect of the Kelvin-Helmholtz vortex rings building up, whereby a slight wave movement of the filament is initially visible. As the turbulence of the free jet increases, the relatively ordered deformation of the droplet by the shear flow is replaced by a turbulence-induced deformation process. This causes a three-dimensional deformation process as described above in connection with the break-up of the droplet moving on the axis of symmetry of the orifice. The filament length increases very rapidly and the filament is simultaneously twisted three-dimensionally until it finally disintegrates.
Droplets that pass the orifice very close to the wall (
), like the one shown in
Figure 9, experience a very high shear and elongation flow already at the entry, which is why the droplets are elongated to very high aspect ratios. Within the cylindrical part of the orifice, they continue to experience high shear flow, which is why the droplets can hardly relax. When leaving the orifice, the droplets quasi-immediately reach the developing shear layer and are influenced by it. The Kelvin-Helmholtz instabilities caused by the extreme velocity gradient at the edge of the free jet represent the starting point for all other vortices contained downstream in the free jet. Droplets, which already penetrate the shear layer early on, follow these first Kelvin-Helmholtz vortices very clearly. In some cases, several vortices can be visualized simultaneously, as well as the growth of these vortices by twisting of the filament.
To illustrate this process,
Figure 10 depicts four snapshots of a time series of the Kelvin-Helmholtz vortex–droplet interaction. It appears that the droplet filament is periodically deformed. When the filament reaches the center of the vortex, it becomes twisted into a very tight loop, resulting in a local compression or thickening of the filament. This shape is caused by the vortex accelerating the filament front outwards from the free jet. As the vortices move with the free jet in the direction of flow, this filament structure migrates downstream. In the area between two such Kelvin-Helmholtz vortex rings, the filament is stretched more strongly by the interaction with the vortices. This stretching is so strong that the filament periodically migrating in the range of
to
can no longer be clearly resolved.
Due to the extreme elongation which is already achieved within the orifice for droplets on these trajectories, the droplets disintegrate very quickly at small running lengths behind the orifice. With these trajectories, it is particularly clear that the droplet front disintegrates, while the rear part of the droplet filament is still unaffected and partly still within the orifice.
When comparing the time series in
Figure 6,
Figure 8 and
Figure 9, it becomes clear that droplet break-up is dependent on the trajectory of the orifice. The closer the droplets are to the edge as they travel through the orifice, i.e., at the shear layer of the free jet flow, the easier the droplet break-up occurs. Based on this observation, it can again be confirmed that droplet break-up during high-pressure homogenization does not occur spontaneously or simultaneously for the entire droplet as a result of the Plateau-Rayleigh instability.
The extent of droplet deformation in the inlet area not only depends on the droplet viscosity or viscosity ratio and the initial droplet diameter, but also on the Reynolds number or flow conditions. In addition, the droplet trajectory plays a decisive role on the deformation when entering the orifice. The shear rates are very high particularly at the edge area of the orifice, causing the initially round primary droplet to be stretched to a long filament when passing through the cylindrical part of the orifice. A break-up of the droplet in this area of the orifice could not be observed in any measurement despite locally very high stresses.
Within the cylindrical constriction and in the core area of the free jet behind the orifice, there is, apart from the boundary layer close to the wall, a largely laminar flow without significant temporal and spatial fluctuations. Due to the absence of external stresses, a slight relaxation of the droplet filament occurs in this area. Only in the area behind the orifice, when the droplet enters the turbulent shear layer of the collapsing laminar free jet core, is the droplet subjected to a second stress period. The turbulent vortices cause a chaotic droplet deformation compared to the inlet into the orifice. In addition, the intensity of the deformation is significantly greater in most cases. The turbulent vortices lead to a further stretching of the in most of the time elongated droplet filament. Depending on the elongation, the filament is captured by several eddies at the same time from the onset, since the extent of the droplet is already so great that the droplet develops into several structures simultaneously. In the case of relaxed droplets, the interaction with the first high-intensity, large eddies cause renewed stretching. In the course of the droplet through the shear layer, in which the droplet or filament interacts with vortices again and again and is stretched further, the filament twists three-dimensionally until, at a certain point, the droplet breaks up into fine secondary droplets. At this range, the sequence of drop-vortex-interactions is so fast that no relaxation occurs. The observed break-up does not necessarily take place in the entire filament at the same time, but takes place depending on local elongation or superimposed external stress. After the primary droplet has broken up into smaller secondary droplets, no further disintegration of the resulting droplets can be observed, but the secondary droplets are transported downstream only by the superimposed convection. With increasing distance from the orifice, the intensity of the turbulent eddies decreases, so that no further break-up step takes place downstream. This is also unlikely due to the higher energy required for breaking up smaller droplet diameters, so that a single-stage break-up process can be assumed at the investigated process conditions.
3.1.4. Scale Comparison
The phenomena detected at the macro scale can also be observed on non time-resolved images at the two smaller experimental facilities, M1 and M5. Since PIV cameras, that can record double image, are used for droplet visualization at these scales, individual droplets can sometimes be observed over two time steps, so that not only individual snapshots but also droplet movements and deformations can be detected.
Therefore, in the following section, the phenomena are first presented in their original scale as evidence of the processes shown above.
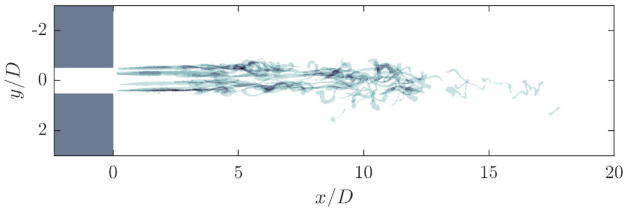
Figure 13 depicts a superposition of several droplet images from the original system downstream of the orifice exit. The grey intensities are intended to show the overlapping of several droplets and help to better follow the individual filaments. The Reynolds number of the flow from the droplet images shown is
, while the viscosity ratio equals
. The deformation of the droplets is clearly visible and fits well with the droplet filaments observed on the macro scale, which are deformed by several vortices.
Due to the shown superposition of the individual droplet images, it appears that the droplet break-up occurs closer to the orifice than on the macro scale. This conclusion is supported by the fact that only larger or clearly recognized and deformed droplets are shown as droplets; this is necessary due to the lower spatial resolution. The comparison of the flow fields (Preiss et al. [
41]) shows, however, that the flow fields are spatially similar, so that a coincident droplet break-up location can be assumed.
On the original scale as well, the Kelvin-Helmholtz vortices play an important role in the breakup of the droplets. This is due to the fact that droplets break-up directly within this vortex structure, but also because the further vortex cascade has its origin here.
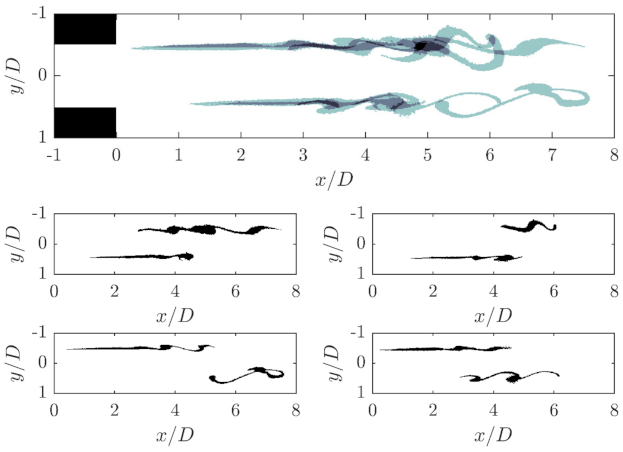
The deformation of droplets due to the interaction with the Kelvin-Helmholtz vortices that have not yet detached is shown in
Figure 14. The central figure again shows a superposition of several droplets deformed by the Kelvin-Helmholtz vortices, whereas in the other figures below, individual droplets are shown in pairs for the sake of a better overview.
It becomes very clear that the elongated filaments leaving the orifice at the edge are deformed by the vortex structure. In addition, the growth of the vortex structures becomes visible with increasing length. At first, the filaments only oscillate slightly, which can be seen in a slight wave motion of the otherwise straight droplets. With longer drop-vortex interaction, the filaments increasingly follow the vortex structure and are sometimes even twisted into loops. This process is accompanied by a slight further stretching of the filaments in addition to the deformation. Since the images can only be taken from one viewing direction and the free jet diameter exceeds the depth of field of the images, only droplets that are deformed in the xy-plane are shown, but it seems plausible, especially through the investigations in the macro scale, that these processes occur similarly in the entire free jet mantle area.
Figure 15 shows double images of droplets taken at different times to show several deformation phenomena already seen at the macro scale to prove the similarity between the different scales. In this illustration, the images of the two time steps are superimposed so that the individual droplets of the different time steps can be seen as well as the evolution of the deformation process. The second droplet is displayed darker. These images clearly show the movement of the droplets and the twisting of the droplets. Again, due to the optical restrictions in this setup, it can only be assumed that the filaments are twisted three-dimensionally, which is considered very reasonable.
In the experimental system scaled with a scale factor of 5, two trajectories, namely at the axis of symmetry of the orifice (
) and at a position further to the edge (
), can be investigated in the investigations on droplet break-up. The primary droplet size was set to about 200 µm.
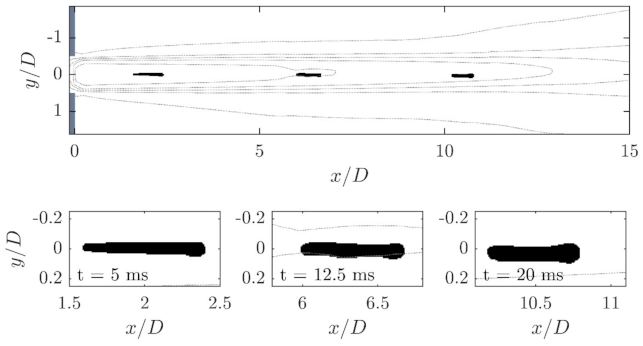
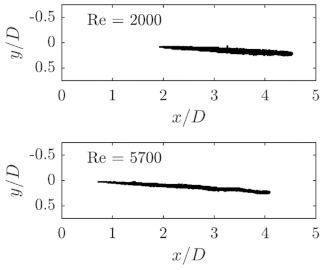
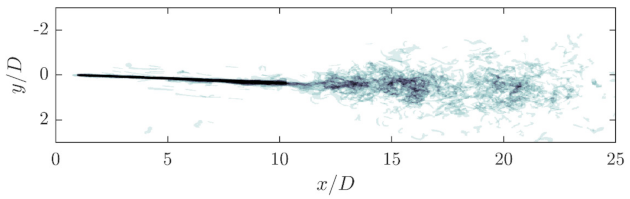
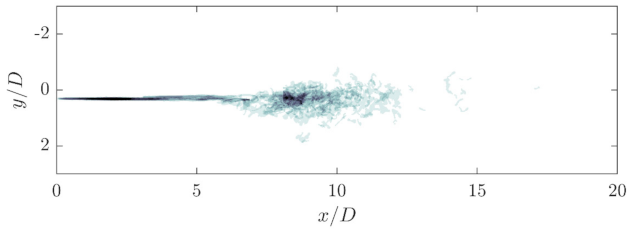
Figure 16 shows a superposition of about 700 individual droplets entering the orifice on the axis of symmetry in the area of the free jet behind the orifice.
Only deformed droplets are shown. It is clear that most of the droplets exit the orifice on a narrowly defined path. On this scale also, a stable free jet core is initially seen, in which the droplets are hardly stressed three-dimensionally. However, the figure also shows that the droplet path is slightly inclined and is also true for the exiting jet (not shown here). This may be due to the fact that the orifice bore is not exactly parallel to the channel due to manufacturing or alignment inaccuracies. In the range of , the droplet swarm begins to expand and leave the uniform trajectory because the droplets follow the turbulent decaying free jet, whereby they are also deformed. Due to the fact that not all droplets pass through the orifice on the same trajectory, or because already broken-up droplets are returned to the free jet by the recirculation flow, the break-up of the droplet trajectory in the range of can be somewhat overestimated.
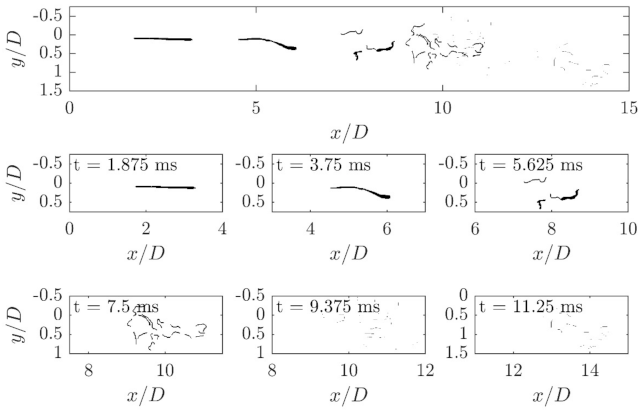
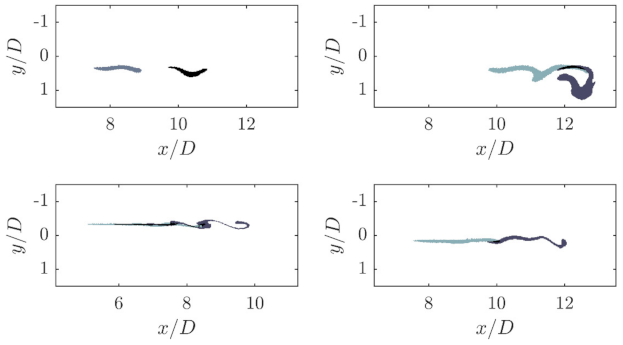
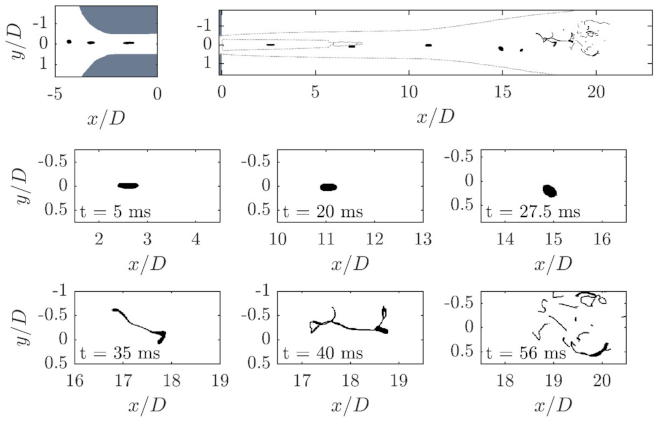
Figure 17 shows individual droplets from different stages in the free jet. At first, the elongated droplet can be seen in the core area of the free jet. In the further course, large scale deformations of the droplet are visible at a run length of
. Since the deformations in the turbulent area of the free jet are very fast, the droplet shown in the next step is already deformed to a much greater extent by small-scale vortices. The droplet shown in the last figure is so strongly deformed that no clear structure can be seen. This image may be affected by the fact that fine structures, such as filaments, are either not resolved or are not recognized as droplet filaments during the digital evaluation. It is also possible that several fragments are superimposed and thus create the impression of a very large droplet fragment. Furthermore, when comparing the displayed individual images, it must be noted that the temporal course of a droplet is not shown, rather four individual droplets at different points in time and space are displayed. The droplets may differ slightly in their initial size and trajectory.
The influence the droplet trajectory has on the droplet breakup can be seen by comparing
Figure 16 and
Figure 18.
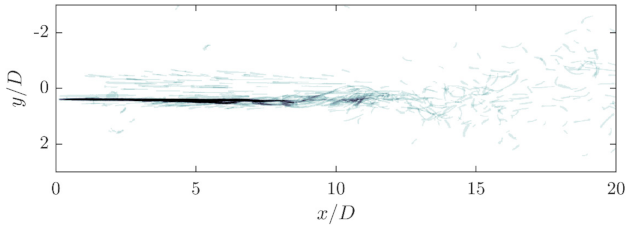
Figure 18 shows the summed-up images of droplets exiting the orifice closer to the edge of the orifice.
It can again clearly be seen that most of the droplets pass the orifice on the same path. Beside this main trajectory, however, some single droplets are also visible, which do not run on this trajectory, but are distributed over the entire free jet cross-section and pass the orifice. These droplets can be already broken-up droplets that are drawn inwards into the free jet from the surrounding area. With the droplets moving on the desired trajectory, it is clearly visible that the droplet shape or the initially straight path is twisted at
and the free jet breaks up. In the range of
, a clear wave motion of the trajectory can be seen, which is caused by an increasing Kelvin-Helmholtz vortex, which at this running length of the free jet is apparently large enough to deflect the droplets along their trajectory.
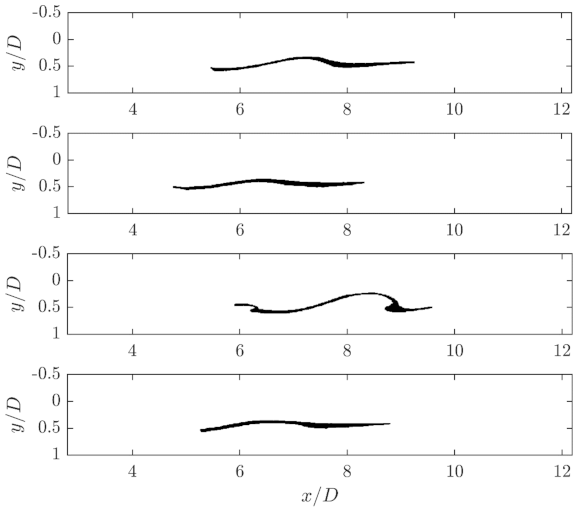
Figure 19 shows four droplets that are deformed by these Kelvin-Helmholtz vortices. Downstream, the droplets break-up into smaller filaments that follow the turbulent flow in the free jet layer.
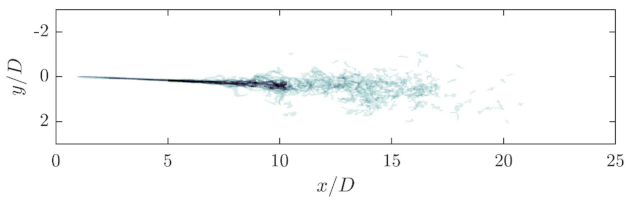
In the case of
(see
Figure 20), the trajectories of the droplets in the beginning are also clearly recognizable. However, especially in the case of the droplet injection on the axis of symmetry, a clear shift of the point of break-up of the droplets towards the orifice can be seen. This observation fits very well with the observations of the flow fields [
41]. In the case of the droplets that are not dosed on the axis of symmetry of the orifice but rather at the edge of the orifice (see
Figure 21), the free jet or the point of break-up does not appear to be shifted forward at first, but this may be due to the visualization or superposition of the droplets. A closer look reveals that the droplets deviate from the uniform path already at a run length of
. In addition, the droplet break-up seems to have already been completed at a run length of
, as filaments are no longer visualized.
In the investigations on the droplet break-up of eccentrically dosed droplets at
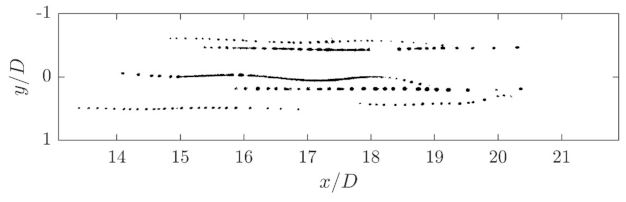
, a different break-up mechanism than what is observed on the macro scale can be seen for certain droplets. These droplets do not break up according to the turbulent decay pattern described above, but rather to the Plateau-Rayleigh instability. To illustrate this principle, a compilation of individual droplet break-up images is shown in
Figure 22. This break-up mechanism can only be observed under these operating conditions and only for measurements from a distance of
onward. Consequently, it can be stated that this break-up mechanism takes more time compared to the turbulent break-up mechanism and a critical stretching is required.
It can be clearly seen that the droplets that are stretched into long filaments break-up into a series of droplets of almost the same size. Therefore, when a very narrow size distribution is desired, this instability mechanism should be used to generate the droplets. The disintegration begins at the ends and continues towards the middle over the entire length of the filament. The droplets are distributed over the entire free jet and are not particularly strongly deformed three-dimensionally. Therefore, it does not appear to be the primary droplets on the set droplet trajectory, but rather droplets drawn into the free jet from outside. These can be partially unbroken droplet fragments or larger droplets in the backflow area due to coalescence of smaller droplets.
3.1.5. Influence of Viscosity Ratio
In order to further investigate the influence of the droplet viscosity or the viscosity ratio between the disperse and continuous phases, additional experiments were carried out with oil droplets of various viscosities. Here, the elongation of the droplet in the inlet area of the orifice can be identified as the main difference.
Figure 23 shows three droplets shortly after passing through the orifice close to the axis of symmetry of the orifice at
. The viscosity ratios in these experiments are
,
and
. It is clear that the low viscosity droplet was stretched the most. The droplets with higher viscosity ratios are significantly less stretched. The primary reason for the noticeable droplet elongation is the superposition of the shear and elongational flow in the inlet area of the orifice. Although
is comparatively low, the elongation of the low viscosity droplet is already very high. The
droplet is stretched to a thin filament, but it remains only about half as long as the low viscosity drop. The
droplet is also stretched, but the elongation is rather small. The aspect ratios based on the length of the filament and the primary droplet diameter are approximately 8, 6 and 3.5, in order of increasing viscosity ratios.
A more detailed investigation of the elongation behavior of the droplets as they pass through the orifice and a comparison to numerical models can be found in Mutsch et al. [
49].
As the droplets shown are still in the core area of the free jet, they have hardly undergone any further deformation up to this point. Only when the droplet filaments enter the turbulent flow area of the free jet do the droplets undergo further deformation and elongation, as shown above. The influence of viscosity is shown by the fact that the low viscosity droplet is elongated into a long filament due to the laminar flow into the orifice and the associated stresses, whereas the droplets of higher viscosity are significantly less elongated. Due to this large linear elongation, the droplet already extends over a wide range at the beginning of the drop-vortex interaction, so that several vortices act simultaneously on the droplet already at the beginning of its entry into the turbulent shear layer. In addition, the droplet diameter is comparatively small due to the pre-expansion. Furthermore, these first vortices have a very high intensity and contribute to a very strong deformation and elongation of the drop. The highly viscous drop, on the other hand, is hardly spatially stretched due to the laminar flow in the inlet of the orifice. Therefore, the first vortices mainly interact with the droplet individually and their high intensity initially contributes to stretching and elongating the rather round or elliptical drop. In order to illustrate the different break-up processes at different viscosity ratios,
Figure 24 and
Figure 25 portray two time series of the droplet break-up process behind the orifice of both a low and a high viscosity drop, respectively.
The figures show that the highly viscous droplet in the core area of the free jet initially relaxes almost completely. The low viscosity droplet could also relax in this low-stress area, but the time span is too short-and the restoring force is too small-to reverse the very high elongation, so that complete relaxation of the filament does not occur. When the turbulent shear layer is reached, the relaxation ends and both droplets are deformed again as the external forces predominate. As described above, the low viscosity droplet disintegrates very quickly due to the stress of several vortices, whereby it is first stretched to form a long, thin and twisted filament. The diameter of the three-dimensionally stretched filament is too small to be visualized clearly with this measurement technique or setup.
The highly viscous droplet initially meanders with the fluid, since the first, individual eddies are not sufficient to deform the droplet by shear. Only when several eddies meet is the droplet stretched. Similarly, the droplet is, in this case, twisted into a three-dimensional filament, but this filament is neither as long nor as thin as in the drop. Finally, the can also be broken up at , but the droplet size achieved appears to be much larger than in the case of low viscous droplets.


 ,
, 


