
Modelling Particle Agglomeration on through Elastic Valves under Flow
by
 , and
, and
Hosam Alden Baksamawi
1,* ,
,
Mostapha Ariane
2,
Alexander Brill
3,
Daniele Vigolo
1,4,5 and
Alessio Alexiadis
1,* 1
School of Chemical Engineering, University of Birmingham, Birmingham B15 2TT, UK
2
Laboratoire Interdisciplinaire Carnot de Bourgogne, Université Bourgogne, 9 Avenue Alain Savary, BP 47 870, 21078 Dijon, France
3
Institute of Cardiovascular Sciences, College of Medical and Dental Sciences, University of Birmingham, Birmingham B15 2TT, UK
4
School of Biomedical Engineering, The University of Sydney, Sydney, NSW 2006, Australia
5
The University of Sydney Nano Institute, University of Sydney, Sydney, NSW 2006, Australia
*
Authors to whom correspondence should be addressed.
ChemEngineering 2021, 5(3), 40; https://0-doi-org.brum.beds.ac.uk/10.3390/chemengineering5030040
Submission received: 31 May 2021
/
Revised: 15 July 2021
/
Accepted: 19 July 2021
/
Published: 26 July 2021
(This article belongs to the Special Issue Discrete Multiphysics: Modelling Complex Systems with Particle Methods)
Abstract
:This work proposes a model of particle agglomeration in elastic valves replicating the geometry and the fluid dynamics of a venous valve. The fluid dynamics is simulated with Smooth Particle Hydrodynamics, the elastic leaflets of the valve with the Lattice Spring Model, while agglomeration is modelled with a 4-2 Lennard-Jones potential. All the models are combined together within a single Discrete Multiphysics framework. The results show that particle agglomeration occurs near the leaflets, supporting the hypothesis, proposed in previous experimental work, that clot formation in deep venous thrombosis is driven by the fluid dynamics in the valve.
1. Introduction
Various ‘non-return’ valves are found in our leg veins [1]. These valves consist of two elastic leaflets that open and close in conjunction with the musculoskeletal system. When we are physically active, the muscles in the leg constantly contract and relax, causing the vein valves to open, allowing blood to return to the heart, and close to avoid blood flowing back in the opposite direction [2,3].
Deep Vein Thrombosis (DVT) occurs when a thrombus forms in the veins as an aggregation of blood components [4]. One hypothesis suggests that these thrombi initially form in the venous valves [5], and subsequently detach from the veins and travel within the blood flow until they reach the pulmonary vascular system. Here, they cause blockage of the pulmonary artery branches, resulting in death or significant disabilities [6,7,8,9]. Moreover, it is recognised that the lack of physical activity or long static position causes poor blood circulation, thus increasing the risk of DVT. This suggests that fluid dynamics in the valve play an important role in causing DVT [10].
To understand the flow in venous valves, we carried out a computer simulation of various valve typologies both without [11] and with the presence of thrombi [12]. However, the role of the flow in the initiation of the venous clot due to the aggregation of blood components is still not clear. For this reason, in a previous study conducted by Schofield et al. [10], we developed an in vitro model of DVT. The model comprises a microchannel fabricated out of polydimethylsiloxane (PDMS) by means of soft lithography. Within the microchannel, we fabricated a flexible valve made of cured polyethylene glycol diacrylate (PEGDA). An aqueous dispersion of polystyrene particles was perfused within the microfluidic device using pulsed flow to simulate rhythmic contractions of the leg muscles. In the in vitro models, polystyrene particles tend to form aggregates due to van der Waals and electrostatic interactions between themselves and the solid surfaces, and this simulated the formation of aggregates. We also compared these results with experiments of perfusing blood flow with fluorescently labelled platelets, where platelets tended to form aggregates when activated [13,14].
The results show that the agglomeration of polystyrene particles and platelets occurs near the valve leaflets. These results support that a thrombus forms in the venous valves at least in part due to altered flow. However, they open a new question that could not be answered in the in vitro experiments. Can hydrodynamic alone explain agglomeration?
In the valve, when the leaflets close, the flow streamlines converge and subsequently the probability of particles colliding enhances agglomeration. Moreover, both polystyrene particles and platelets accrue at the leaflet’s surface. Therefore, it is not clear how much of the observed agglomeration is caused by hydrodynamics and how much is simply due to the particle sticking to the leaflets surface.
Therefore, in this study, we further developed our original DVT model [11,12] to include particle agglomeration. Since, in the computer model, we can arbitrarily tune the properties of the particles, we can account for ‘fictional’ particles that are sticky only with each other and not with the leaflets. By studying this virtual system, we can answer the research question of this paper: when removing particle-leaflets adhesion, can hydrodynamics alone explain at least part of the agglomeration observed by Schofield et al. [10]. If, in the virtual system set up in the computer simulations, we observe agglomeration near the leaflets, we can conclude that hydrodynamics play a role; if not, this means that, in Schofield et al. [10], agglomeration is mostly due to the interaction between the particles and the leaflet surface. Thus, this study proposes a novel model (to the best of our knowledge, this is the first DVT model that accounts for agglomeration) and uses this model to answer a specific research question from a medical-related area.
This paper is organized as follows. Firstly, we introduce the general theory behind Discrete Multiphysics (DMP), the modelling approach used to simulate the system. Then, we show how the theory is applied to the concrete case of flow in flexible valves. Lastly, we use the model to simulate particle agglomeration in the valve and show that larger clusters are formed near the leaflets.
2. Methodology
2.1. The Theory of Discrete Multiphysics
Discrete Multiphysics (DMP) is a computational approach on computational particles rather than computational mesh [15]. It links together different discrete models such as Smoothed Particle Hydrodynamics (SPH) [16], Lattice Spring Model (LSM) [17,18], Discrete Element Method (DEM) [19], and Peridynamics [20], which can be used for a range of applications ranging from biological to energy application [21,22,23,24]. In particular, DMP was previously used to simulate the flow in cardiovascular [25] and venous valves [11], including the presence of emboli in the blood flow circulation [18].
In this work, we combine the hydrodynamic venous valve model of Ariane et al. [11] and Ariane et al. [18] with the model of particle agglomeration in shear flow of Rahmat et al. [24]. The DMP model combines SPH for the fluid, LSM for the valve and a pseudo-Lennard-Jones potential for particle agglomeration. This section introduces the theory behind these computational methods and explains how they are combined together.
2.1.1. Smoothed Particle Hydrodynamics (SPH)
Smoothed Particle Hydrodynamics is a computational meshless Lagrangian method independently developed by Lucy [26] and Gingold and Monaghan [27], which is used here to simulate the fluid dynamics. Each particle in the SPH domain represents a set of properties such as positions r, mass m, density ρ, pressure p, velocity v and viscosity μ, which are updated at each timestep. For a desired group of computational particles, the SPH equation of motion is achieved from the discrete approximations of the Navier–Stokes equation [28,29]:
where are the masses of the particles , , respectively, is the velocity of the particle , is the pressure, is the density of particle i, and is the sum of all external forces applied to the system. is the smoothing kernel function and W is a bell-shaped function that describes how the interaction between particle and decays with their distance . is the so-called artificial viscosity [30]:
where is the dynamic viscosity and . In this work, we use the so-called Lucy kernel [29]:
where is the so-called smoothing length and is a parameter used to normalise the kernel function.
An equation of state (EOS) is required to link the pressure p with the density ρ. In this study, the Tait’s equation is used:
where is a reference density and is a reference for fluid velocity. This formulation refers to the so-called weakly compressible SPH. To keep the variation of the fluid density in the domain less than 1 per cent, is normally set as ten times the maximum velocity in the flow [31]. This produces repulsive forces between particles aimed at approximately conserving their distance during the simulation [32]
2.1.2. Lattice Spring Model (LSM)
The elastic leaflets and moving walls of the membrane are simulated with the so-called Lattice Spring Model (LSM) or Mass Spring Models (MSM) [33]. The elastic body is subdivided in computational particles which are linked together by Hookean springs. The force between two particles i and j connected with a Hookean spring is given by
where is the Hookean elasticity coefficient, is the equilibrium distance between the particles and their instantaneous distance. The spring coefficients is determined by the physical properties (e.g., Young’s modulus) of the modelled materials as discussed in Kot, Nagahashi and Szymczak [33] and Pazdniakou and Adler [34].
2.1.3. Coupling SPH and LSM (Fluid–Structure Interaction)
In the model, SPH is used to simulate the fluid and LSM used for the elastic structure (valve leaflets). SPH provides the forces acting between two fluid computational particles, where LSM provides the forces between two solid particles. To model the fluid structure interaction, we need to set the forces between liquid and solid computational particles. These forces must ensure no-penetration, no-slip, and continuity of stresses between the solid–liquid interface. In continuum mechanics, these conditions are often represented as
where is the normal to the boundary, the displacement of the solid, the velocity of the liquid, the stresses in the solid and in the fluid [15].
In DMP, these conditions need to be ‘translated’ in terms of forces Fi,j in order to be introduced in the model. Here, we use the same approach employed in other DMP studies such as Schütt et al. [35], M. Ariane et al. [12] and Alexiadis [15]. The no-penetration conditions are implemented by means of a repulsive Lennard-Jones potential between SPH and LSM particles:
where r is a reference distance between particles and K is chosen to guarantee no penetration between SPH and LSM particles.
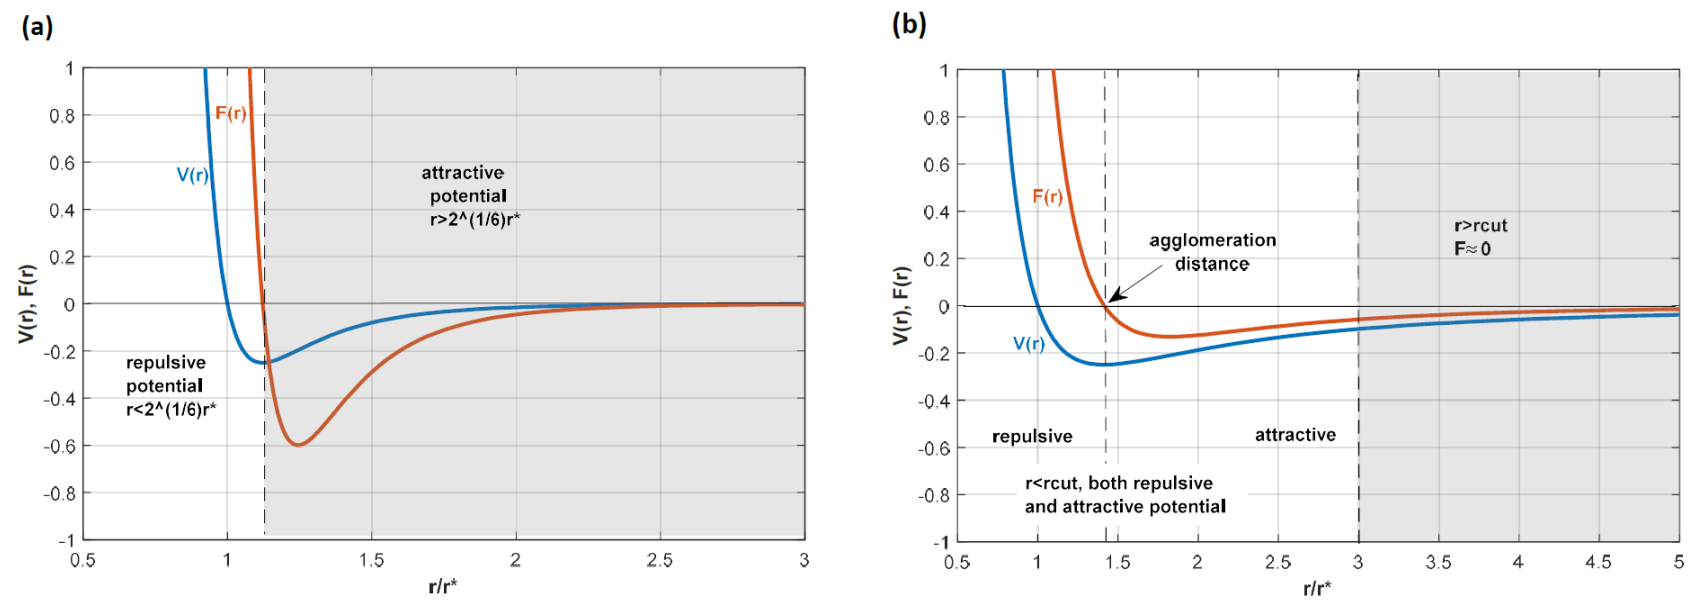
From the potential V(r), the force between two particles is calculated from the potential:
Figure 1a shows the potential V(r) and the force F(r) applied between the SPH and LSM, with only values for r < 21/6r∗ being studied so that only the repulsive potential is considered.
No-slip conditions are enforced by imposing SPH-like viscous forces at the solid–liquid interface. Once both the no-penetration and no-slip boundary conditions are enforced, the continuity of stress is automatically satisfied by the fact that particle methods satisfy the Newton equation of motion. The numerical scheme used to solve the resulting equations is reported in Ganzenmüller and Steinhauser [29].
2.1.4. Solid-Solid Interaction (Agglomeration)
Besides fluid–structure interaction, the model also accounts for solid particles moving within the flow. These particles are ‘sticky’ and prone to agglomeration. To model this phenomenon, we use a similar approach to Rhamat et al. [24] that used soft, pseudo-Lennard-Jones, potentials of the type:
where ε provides the strength of the agglomeration, to model the interaction between sticky particles. In this case, we consider both repulsive and attractive parts (Figure 1b); this produces a minimum in the potential that represents the equilibrium distance between two agglomerating particles. The value of the cut-off is selected at 3r∗. For r > 3r∗, we assume F(r) ≈ 0, which simplifies the calculations. Equation (11) is a numerically convenient way to implement agglomeration avoiding the sharp minima of the DLVO theory [36], but it does not represent a very accurate model of agglomeration. As in Rhamat et al. [24], this does not constitute a problem here since we are not interested in a specific type of interaction (the actual potential among particles/platelets in Schofield et al. [10] is unknown anyway); rather, we hope to enable particle–particle agglomeration in our virtual environment. For the same reason, ε is left as a free parameter, and simulations with different values of ε are compared. For a theoretically more accurate approach based on the concept of surface energy, the reader can refer to Ariane et al. [19].
2.2. The Valve Model and Geometry
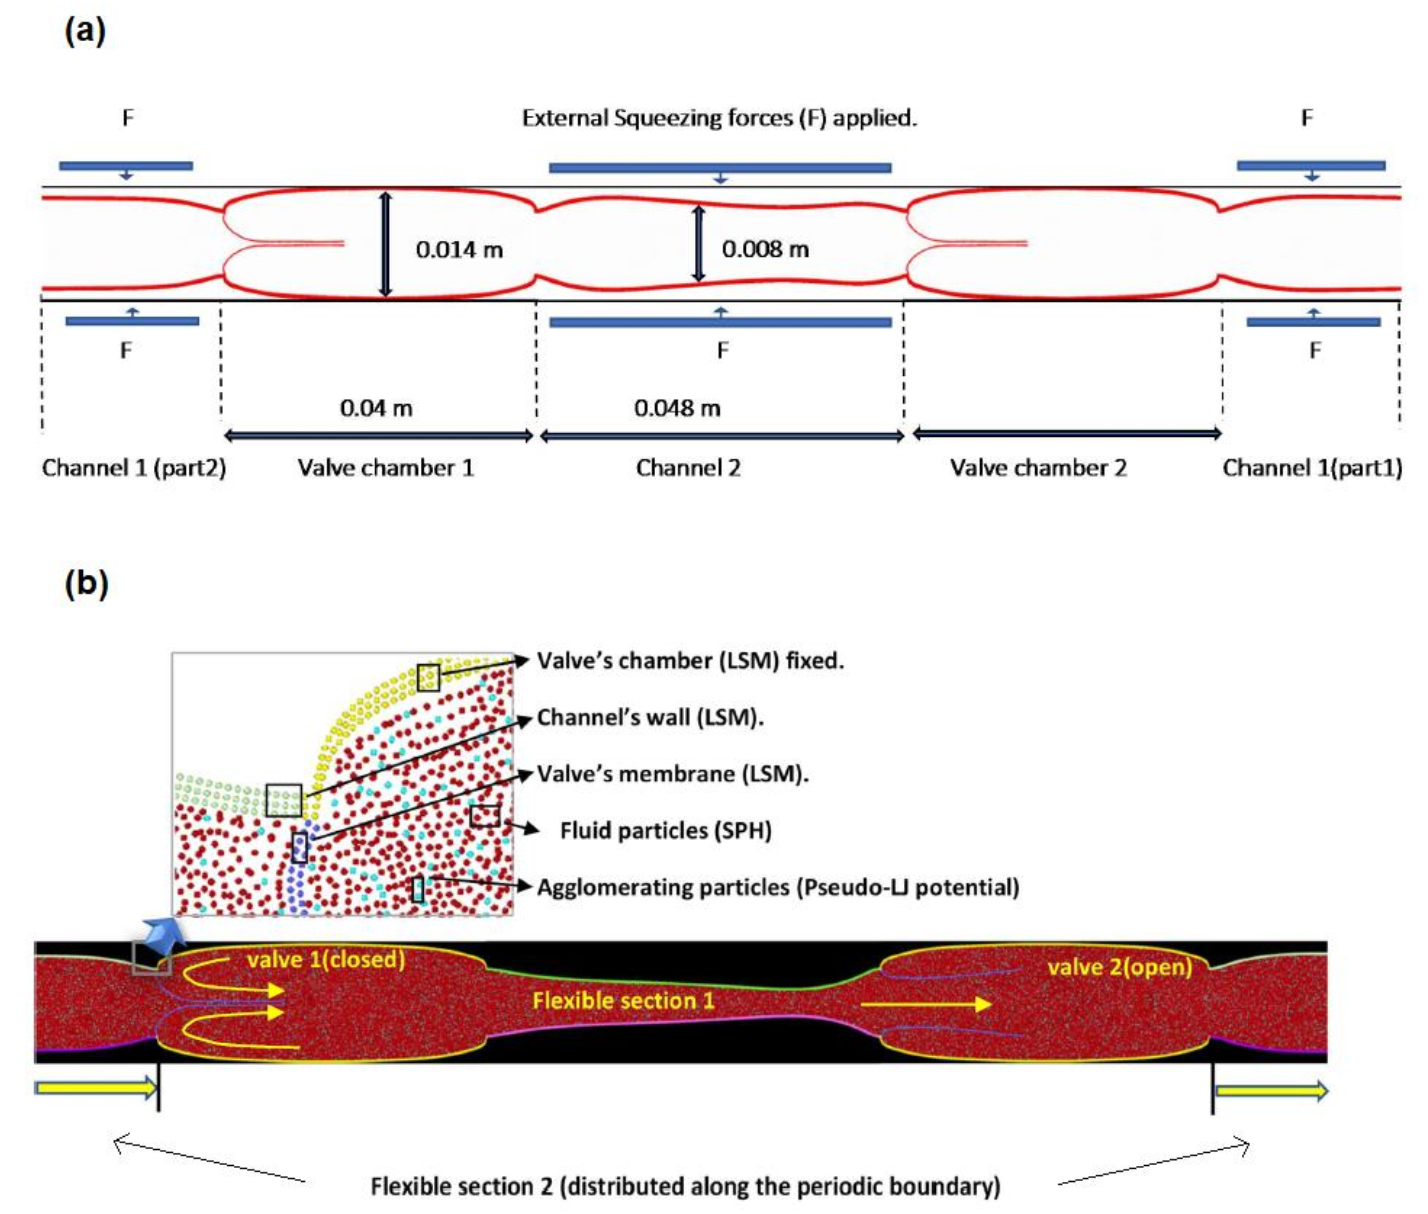
The DMP methodology discussed previously is applied to a system of flexible valves (Figure 2a), which represents a series of venous valves distributed along a venous vessel located in the leg. The geometry is two-dimensional and adapted from previous work by Ariane [18] and Wijeratne and Hoo [37].
Two consecutive valves are connected by a channel with flexible walls. The model is periodic, meaning that the flow exiting the system from the right boundary re-enters it from the left boundary and vice versa. Therefore, the system is composed of two valves and two flexible sections. These sections are contracted periodically to simulate pulsatile blood flow. During typical daily activities, when the muscles in the leg contract, they squeeze the blood flow which promotes blood circulation [2,3]. The pressure generated by the contraction, opens the valve on the right (Figure 2b) and closes the valve on the left. This mechanism allows flow to circulate in one direction and prevents backflow. The opening and closing rate of the venous valve is around twenty rounds for each minute [38]. To save computational time, in the model, the rhythm is slightly accelerated by considering five cycles in 15 s.
As Figure 2b shows, there are different types of computational particles in the model: SPH particles modelling the blood flow; LSM particles modelling the leaflets and the flexible sections between two valves. The walls that encase the valves are also made of solid particles, but they are fixed and do not change their position during the simulation. Additionally, a certain number of ‘sticky’ particles are randomly dispersed in the flow at the beginning of the simulation.
In the model the fluid is considered Newtonian and the flow laminar. Table 1 shows all the numerical parameters used in the simulation. The simulations were carried out with the open-source code LAMMPS [39] and the open-source code of OVITO [40] was used for the visualisation and analysis of the data.
3. Results and Discussion:
3.1. Hydrodynamics
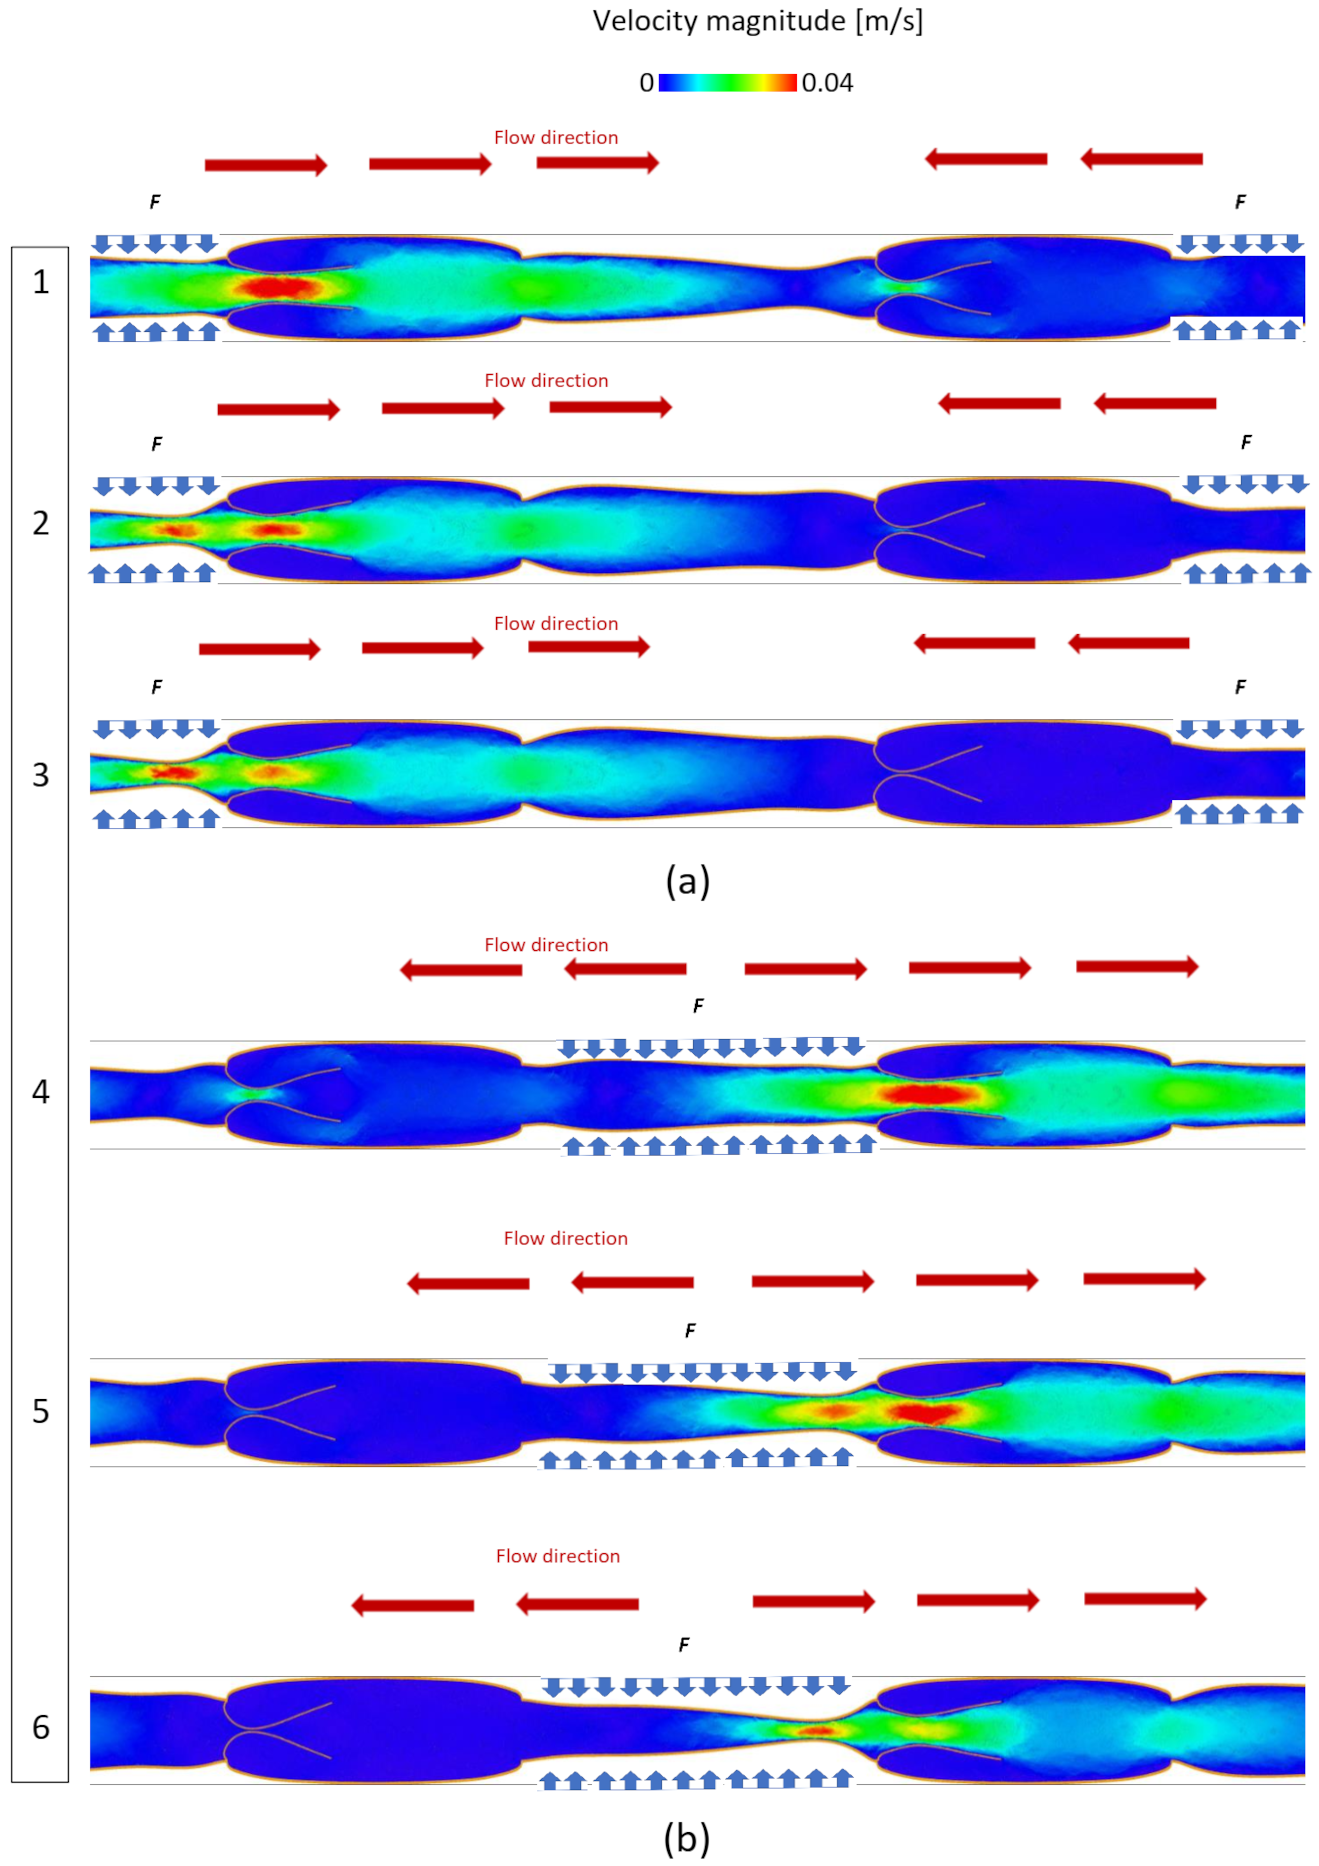
The blood flow moves from left to right (Figure 3) under the pressure generated by applying the force F to the flexible sections. As mentioned, F simulates the effect of muscles in the leg contracting around the vein. The higher pressure generated by F opens the valve on the left and simultaneously closes the valve on the right of the contracted section, as is illustrated in Figure 3a, where periodic boundary conditions are applied to the system. Subsequently, the contracted section is released, and F is applied to the other section, causing the open valve to close and the closed valve to open. This prevents backflow and produces a unidirectional flow in Figure 3b from left to right.
In our model, the force F is calibrated to produce a maximal blood velocity of around 0.04 m s−1, which is a reasonable value for blood flow in human veins as it can vary during average physical activity [11]. The velocity magnitude during the closing and opening phases is reported in Figure 3. In all the simulations discussed in the next system, the system is simulated for 15 s, representing five opening and closing cycles.
3.2. Particle Agglomeration
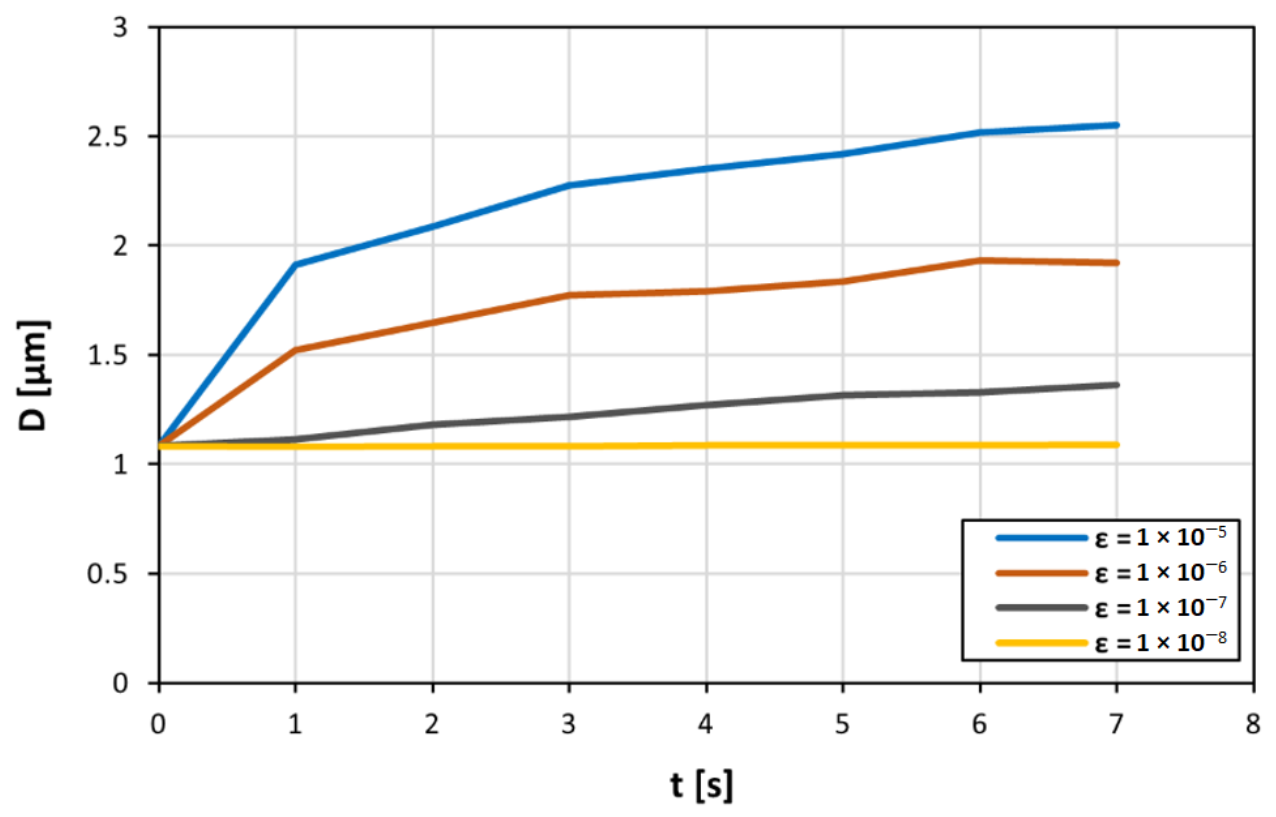
At the beginning of the simulation, ‘sticky’ elemental particles are uniformly distributed in the liquid domain with a concentration of ~10% in the flow. When the simulation runs, these sticky particles start to aggregate in larger clusters depending on their ‘stickiness’, which is controlled by the value of ε in Equation (11). The goal of this study is not to replicate the physiochemical property of actual clots, but to separate the effect of hydrodynamics from the particle–wall interaction in the in vitro experiments by Schofield et al. [10] and verify that agglomeration occurs near the valve even when attractive forces between the leaflets and the particles are arbitrarily removed. The surface energy of the elemental particles is used in the in vitro experiment, and therefore their ‘stickiness’ is not known. For this reason, in this study, we use the value of ε as a free parameter. Figure 4 shows how the size of the average aggregate changes during the simulation
Initially, all particles are separated, and the average size is equal to one, which represents the size of a solid single particle. As time progresses, particles randomly collide in the flow and form agglomerates. Therefore, the average size of the agglomerate increases. As particles lump into larger and larger agglomerates, the number of agglomerates in the flow decreases, reducing their collision probability. Therefore, the average size tends to plateau as the simulation progresses (Figure 4). An explanation for this is that there are greater attractive forces, as a result of the higher pair potential energy. However, there is a minimum pair potential energy where the attractive forces are not enough for particle agglomeration.
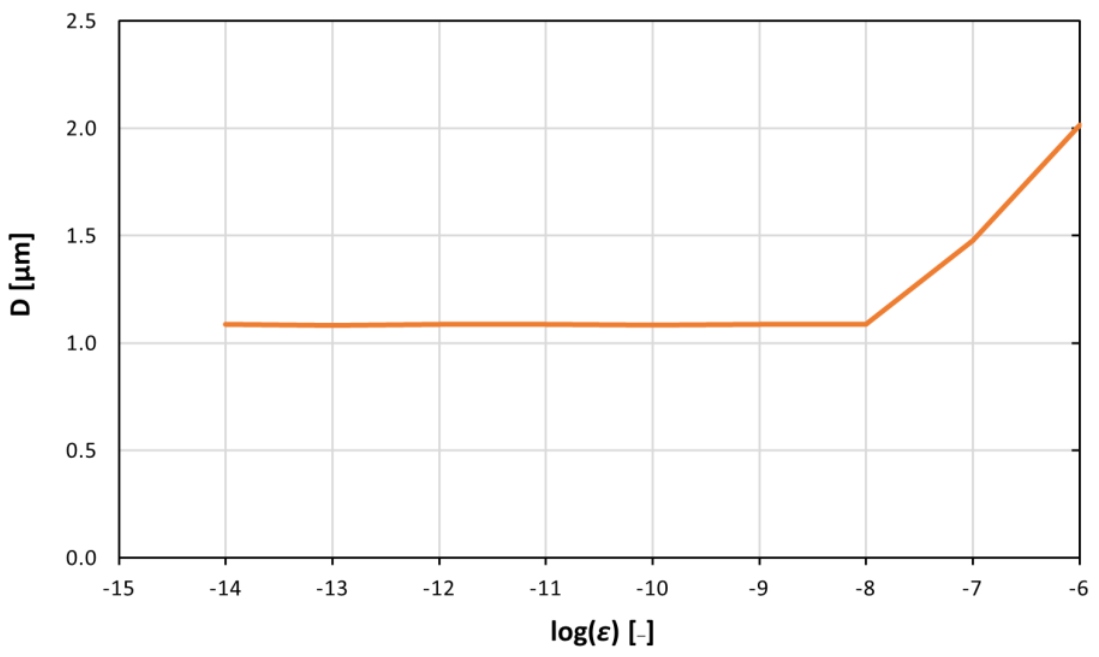
As expected, the higher the value of ε (and, therefore, the ‘stickiness’ of the particles), the higher the average size of the aggregate. Figure 4 shows that for small values of ε, no agglomeration occurs in the flow. The particles are not sticky enough, and the inertial forces generated in the flow prevent the formation of larger agglomerates. Above the value ε = 10−8 J, agglomeration starts, and the size of the agglomerates increases linearly with log(ε) (Figure 5).
3.3. Larger Agglomerates
In Figure 5, the average size of the agglomerates is presented. The size distribution, however, is not uniform. Figure 6 shows how the size is distributed in the valve during the simulation.
Moreover, larger agglomerates form near the leaflets. During their motion, the leaflets temporarily reduce the section of the channel available to the flow. This increases the probability of collision between particles forming larger agglomerates. Some of the agglomerates move into the main flow, whereas others remain trapped in the valve district and accumulate in this area. This is very similar to what we observe in the experiments. Therefore, hydrodynamics plays an important role in the in vitro model in a previous study by Schofield et al. (2020) (Figure 6).
4. Conclusions
In this study, we developed a Discrete Multiphysics model combining the fluid–structure interaction model of [11,12] with the agglomeration model of Rhamat et al. [24]. It combines an element of novelty (first DVT model that accounts for agglomeration) with a specific research question concerning the potential role of hydrodynamics in the early stages of agglomeration in DVT.
We investigated agglomeration around the valve leaflets and how this is affected by the hydrodynamics. The results show that larger agglomerates are likely to form near valve leaflets even when the interaction potential between the valve leaflet and the particles is removed. This supports our previous hypothesis [10] that the combination of blood hydrodynamics and the valve’s mechanical characteristic is a key factor during agglomeration in venous valves.
Besides its specific results, this study is also a good example of how in vitro and in silico modelling can work together in research areas such as biology and medicine. In vitro models aim at providing a physical replica of a biological system. However, it is sometimes difficult to understand all the interrelated mechanical features of this physical model. At this point, in silico models can offer virtual replicas of the biological system where certain mechanical features can be switched on or off ad libitum. In this way, we can somehow ‘dissect’ the physics of the system and discern what the most important features are that regulate the system under investigation. In practice, the model can be used to assess which factors can enhance or decrease the tendency of agglomerates to form in the valve.
Author Contributions
Conceptualization, H.A.B. and A.A.; methodology, H.A.B., M.A., A.A. and D.V.; software, H.A.B., A.A. and M.A.; validation, H.A.B., A.A., M.A., A.B. and D.V.; formal analysis, H.A.B., M.A., A.B. and A.A.; investigation, H.A.B., A.B., D.V. and A.A.; resources, H.A.B., M.A., A.B., D.V. and A.A.; data curation, H.A.B., A.A., M.A., A.B. and D.V.; writing—original draft preparation, H.A.B.; writing—review and editing, H.A.B., A.A., M.A., A.B. and D.V.; visualization, H.A.B. and A.A; supervision, M.A., A.B., D.V. and A.A.; project administration, A.B., D.V. and A.A.; funding acquisition, A.B., D.V. and A.A. All authors have read and agreed to the published version of the manuscript.
Funding
This research was funded by NC3Rs and the British Heart Foundation (NC/S001360/1 and FS/18/68/34226).
Acknowledgments
A.B. is supported by the British Heart Foundation Senior Basic Science Research Fellowship (FS/19/30/34173). H.A.B. is supported by NC3Rs and the British Heart Foundation (NC/S001360/1 and FS/18/68/34226).
Conflicts of Interest
The authors declare no conflict of interest.
References
- Raskob, G.E.; Spyropoulos, A.C.; Cohen, A.T.; Weitz, J.I.; Ageno, W.; De Sanctis, Y.; Lu, W.; Xu, J.; Albanese, J.; Sugarmann, C.; et al. Association between Asymptomatic Proximal Deep Vein Thrombosis and Mortality in Acutely Ill Medical Patients. J. Am. Hear. Assoc. 2021, 10, e019459. [Google Scholar]
- Wu, W.T.; Zhussupbekov, M.; Aubry, N.; Antaki, J.F.; Massoudi, M. Simulation of thrombosis in a stenotic microchannel: The effects of vWF-enhanced shear activation of platelets. Int. J. Eng. Sci. 2020, 147, 103206. [Google Scholar] [CrossRef]
- Lurie, F.; Kistner, R.L.; Eklof, B.; Kessler, D. Mechanism of venous valve closure and role of the valve in circulation: A new concept. J. Vasc. Surg. 2003, 38, 955–961. [Google Scholar] [CrossRef]
- Shen, R.; Gao, M.; Tao, Y.; Chen, Q.; Wu, G.; Guo, X.; Xia, Z.; You, G.; Hong, Z.; Huang, K. Prognostic nomogram for 30-day mortality of deep vein thrombosis patients in intensive care unit. BMC Cardiovasc. Disord. 2021, 21, 11. [Google Scholar] [CrossRef]
- Bovill, E.G.; van der Vliet, A. Venous valvular stasis–associated hypoxia and thrombosis: What is the link? Annu. Rev. Physiol. 2011, 73, 527–545. [Google Scholar] [CrossRef] [PubMed]
- Siegal, D.M.; Eikelboom, J.W.; Lee, S.F.; Rangarajan, S.; Bosch, J.; Zhu, J.; Yusuf, S.; the Venous Thromboembolism Collaboration. Variations in incidence of venous thromboembolism in low-, middle-, and high-income countries. Cardiovasc. Res. 2021, 117, 576–584. [Google Scholar] [CrossRef]
- Das, K.; Biradar, M.S. (Eds.) Hypoxia and Anoxia; BoD–Books on Demand; IntechOpen: London, UK, 2018; ISBN 978-1-78984-828-1. [Google Scholar]
- Payne, H.; Brill, A. Stenosis of the Inferior Vena Cava: A Murine Model of Deep Vein Thrombosis. J. Vis. Exp. 2017, 2017, e56697. [Google Scholar] [CrossRef] [Green Version]
- Cook, D.J.; Crowther, M.A. Thromboprophylaxis in the intensive care unit: Focus on medical–surgical patients. Critical Care Med. 2010, 38, S76–S82. [Google Scholar] [CrossRef] [PubMed]
- Schofield, Z.; Baksamawi, H.A.; Campos, J.; Alexiadis, A.; Nash, G.B.; Brill, A.; Vigolo, D. The role of valve stiffness in the insurgence of deep vein thrombosis. Commun. Mater. 2020, 1, 1–10. [Google Scholar] [CrossRef]
- Ariane, M.; Wen, W.; Vigolo, D.; Brill, A.; Nash, F.G.B.; Barigou, M.; Alexiadis, A. Modelling and simulation of flow and agglomeration in deep veins valves using discrete multi physics. Comput. Biol. Med. 2017, 89, 96–103. [Google Scholar] [CrossRef]
- Ariane, M.; Allouche, H.; Bussone, M.; Giacosa, F.; Bernard, F.; Barigou, M.; Alexiadis, A. Discrete Multiphysics: A mesh-free approach to model biological valves including the formation of solid aggregates at the membrane surface and in the flow. PLoS ONE 2017, 12, e0174795. [Google Scholar] [CrossRef] [Green Version]
- Bain, B.J. Structure and function of red and white blood cells and platelets. Medicine 2021, 49, 183–188. [Google Scholar] [CrossRef]
- Cattaneo, M. Light Transmission Aggregometry and ATP Release for the Diagnostic Assessment of Platelet Function. Semin. Thromb. Hemost. 2009, 35, 158–167. [Google Scholar] [CrossRef]
- Alexiadis, A. The discrete multi-hybrid system for the simulation of solid-liquid flows. PLoS ONE 2015, 10, e0124678. [Google Scholar] [CrossRef] [Green Version]
- Alexiadis, A.; Stamatopoulos, K.; Wen, W.; Batchelor, H.; Bakalis, S.; Barigou, M.; Simmons, M. Using discrete multi-physics for detailed exploration of hydrodynamics in an in vitro colon system. Comput. Biol. Med. 2017, 81, 188–198. [Google Scholar] [CrossRef]
- Ariane, M.; Kassinos, S.; Velaga, S.; Alexiadis, A. Discrete multi-physics simulations of diffusive and convective mass transfer in boundary layers containing motile cilia in lungs. Comput. Biol. Med. 2018, 95, 34–42. [Google Scholar] [CrossRef] [PubMed]
- Ariane, M.; Vigolo, D.; Brill, A.; Nash, F.; Barigou, M.; Alexiadis, A. Using Discrete Multi-Physics for studying the dynamics of emboli in flexible venous valves. Comput. Fluids 2018, 166, 57–63. [Google Scholar] [CrossRef]
- Ariane, M.; Sommerfeld, M.; Alexiadis, A. Wall collision and drug-carrier detachment in dry powder inhalers: Using DEM to devise a sub-scale model for CFD calculations. Powder Technol. 2018, 334, 65–75. [Google Scholar] [CrossRef]
- Sanfilippo, D.; Ghiassi, B.; Alexiadis, A.; Hernandez, A.G. Combined peridynamics and discrete multiphysics to study the effects of air voids and freeze-thaw on the mechanical properties of asphalt. Materials 2021, 14, 1579. [Google Scholar] [CrossRef] [PubMed]
- Alexiadis, A.; Simmons, M.J.H.; Stamatopoulos, K.; Batchelor, H.K.; Moulitsas, I. The virtual physiological human gets nerves! How to account for the action of the nervous system in multiphysics simulations of human organs. J. R. Soc. Interface 2021, 18, 20201024. [Google Scholar] [CrossRef] [PubMed]
- Ruiz-Riancho, I.N.; Alexiadis, A.; Zhang, Z.; Hernandez, A.G. A discrete multi-physics model to simulate fluid structure interaction and breakage of capsules filled with liquid under coaxial load. Processes 2021, 9, 354. [Google Scholar] [CrossRef]
- Ng, K.C.; Alexiadis, A.; Chen, H.; Sheu, T.W.H. A coupled Smoothed Particle Hydrodynamics-Volume Compensated Particle Method (SPH-VCPM) for Fluid Structure Interaction (FSI) modelling. Ocean Eng. 2020, 218, 107923. [Google Scholar] [CrossRef]
- Rahmat, A.; Weston, D.; Madden, D.; Usher, S.; Barigou, M.; Alexiadis, A. Modeling the agglomeration of settling particles in a dewatering process. Phys. Fluids 2020, 32, 123314. [Google Scholar] [CrossRef]
- Mohammed, A.M.; Ariane, M.; Alexiadis, A. Using discrete multiphysics modelling to assess the effect of calcification on hemodynamic and mechanical deformation of aortic valve. ChemEngineering 2020, 4, 48. [Google Scholar] [CrossRef]
- Lucy, L.B. A numerical approach to the testing of the fission hypothesis. Astron. J. 1977, 82, 1013–1024. [Google Scholar] [CrossRef]
- Gingold, R.A.; Monaghan, J.J. Smoothed particle hydrodynamics: Theory and application to non-spherical stars. Mon. Not. R. Astron. Soc. 1977, 181, 375–389. [Google Scholar] [CrossRef]
- Liu, G.R.; Liu, M.B. Smoothed Particle Hydrodynamics: A Meshfree Particle Method; World Scientific: Singapore, 2003. [Google Scholar]
- Ganzenmüller, G.C.; Steinhauser, M.O.; Van Liedekerke, P.; Leuven, K.U. The implementation of Smooth Particle Hydrodynamics in LAMMPS. Paul Van Liedekerke Kathol. Univ. Leuven 2011, 1, 1–26. [Google Scholar]
- Morris, J.P.; Fox, P.J.; Zhu, Y. Modeling Low Reynolds Number Incompressible Flows Using SPH. J. Comput. Phys. 1997, 136, 214–226. [Google Scholar] [CrossRef]
- Monaghan, J.J. Simulating Free Surface. J. Comput. Phys. 1994, 110, 399–406. [Google Scholar] [CrossRef]
- Lee, E.S.; Moulinec, C.; Xu, R.; Violeau, D.; Laurence, D.; Stansby, P. Comparisons of weakly compressible and truly incompressible algorithms for the SPH mesh free particle method. J. Comput. Phys. 2008, 227, 8417–8436. [Google Scholar] [CrossRef]
- Kot, M.; Nagahashi, H.; Szymczak, P. Elastic moduli of simple mass spring models. Vis. Comput. 2015, 31, 1339–1350. [Google Scholar] [CrossRef]
- Pazdniakou, A.; Adler, P.M. Lattice Spring Models. Transp. Porous Media 2012, 93, 243–262. [Google Scholar] [CrossRef]
- Schütt, M.; Stamatopoulos, K.; Simmons, M.; Batchelor, H.; Alexiadis, A. Modelling and simulation of the hydrodynamics and mixing profiles in the human proximal colon using Discrete Multiphysics. Comput. Biol. Med. 2020, 121, 103819. [Google Scholar] [CrossRef] [PubMed]
- Boström, M.; Deniz, V.; Franks, G.; Ninham, B. Extended DLVO theory: Electrostatic and non-electrostatic forces in oxide suspensions. Adv. Colloid Interface Sci. 2006, 123–126, 5–15. [Google Scholar] [CrossRef] [PubMed]
- Wijeratne, N.S.; Hoo, K.A. Numerical studies on the hemodynamics in the human vein and venous valve. In Proceedings of the 2008 American Control Conference, Seattle, DC, USA, 11–13 June 2008; IEEE: New York, NY, USA, 2008; pp. 147–152. [Google Scholar]
- Aird, W.C. Vascular bed-specific thrombosis. J. Thromb. Haemost. 2007, 5, 283–291. [Google Scholar] [CrossRef]
- Plimpton, S. Fast parallel algorithms for short-range molecular dynamics. J. Comput. Phys. 1995, 117, 1–19. [Google Scholar] [CrossRef] [Green Version]
- Stukowski, A. Visualization and analysis of atomistic simulation data with OVITO-the Open Visualization Tool. Model. Simul. Mater. Sci. Eng. 2010, 18, 015012. [Google Scholar] [CrossRef]
Figure 1.
Diagram illustrating (a) the 12-6 potential used for the no-penetration conditions and (b) the 4-2 potential used for particle agglomeration. In both cases, the cut-off is selected so that only the white area of the diagram is used in the potential. This implies that (a) is only repulsive because only the positive part is considered, while in (b) the negative part of the force, which is attractive, is considered; particles tend to agglomerate at the location where the force is zero, which is where is the minimum of the potential is located.

Figure 2.
Two-dimensional geometry and structure of a dual venous valve: (a) geometry showing the location of the contraction forces and (b) geometry showing the computational particles and their location in the model.
Figure 2.
Two-dimensional geometry and structure of a dual venous valve: (a) geometry showing the location of the contraction forces and (b) geometry showing the computational particles and their location in the model.

Figure 3.
Velocity magnitude in the valve during opening and closing phases: (a) F is applied to the channel 1 and (b) F is applied to the channel 2.
Figure 3.
Velocity magnitude in the valve during opening and closing phases: (a) F is applied to the channel 1 and (b) F is applied to the channel 2.

Figure 4.
Dependence of the average size of particle agglomerates on the pair potential values between ε = 10−⁸ J and ε = 10−⁵ J as the simulation is running.
Figure 4.
Dependence of the average size of particle agglomerates on the pair potential values between ε = 10−⁸ J and ε = 10−⁵ J as the simulation is running.

Figure 5.
Average size of the agglomerates associated with different pair potential values between ε = 10−⁸ J and ε = 10−⁶ J at specific times (t = 12.5 s). Above the value of ε = 10−⁸ J, agglomeration starts, and the size of the agglomerates increases linearly with log(ε).
Figure 5.
Average size of the agglomerates associated with different pair potential values between ε = 10−⁸ J and ε = 10−⁶ J at specific times (t = 12.5 s). Above the value of ε = 10−⁸ J, agglomeration starts, and the size of the agglomerates increases linearly with log(ε).

Figure 6.
Simulation and experiment (platelets, fluorescently labelled, agglomeration in Schofield et al., 2020) snapshots illustrating the aggregates near the valve’s leaflet at different time points. The arrows indicate the aggregates near the valve leaflets.
Figure 6.
Simulation and experiment (platelets, fluorescently labelled, agglomeration in Schofield et al., 2020) snapshots illustrating the aggregates near the valve’s leaflet at different time points. The arrows indicate the aggregates near the valve leaflets.


Table 1.
Model’s numerical parameters.
| Parameter | Values and Units | |
|---|---|---|
| SPH | ||
| Number of all particles that created our model domain. | 168,676 | |
| Number of wall stationary particles (SPH particles), three layers. | 4972 | |
| Number of wall flexible particles (LSM particles), three layers. | 5750 | |
| Number of the valve’s particles (LSM particles), two layers. | Valve particles | 1404 |
| Each leaflet | 351 | |
| Number of SPH fluid particles | 141,030 | |
| Number of SPH agglomerating particles | 15,520 | |
| Mass of each particle (Fluid) | 1.056 × 10⁻⁵ kg | |
| Mass of each particle (Solid) | 2 × 10⁻⁵ kg | |
| Initial distance between particles | 10−4 m | |
| Density | 1056 kg m−3 | |
| Smoothing length | 2.5 × 10⁻⁴ m | |
| Dynamic viscosity | 0.0035 Pa s | |
| Virtual sound speed | 10 m s−1 | |
| Contraction Forces F | 0.008 N | |
| Max velocity in the valve | 0.04 m s−1 | |
| Time step | 10−6 s | |
| LSM | ||
| Hookian coefficient | Flexible wall | 1 × 10⁵ J m−2 |
| Valve’s membrane | 5 × 10⁶ J m−2 | |
| Viscous damping coefficient | Flexible wall | 1 kg s−1 |
| Valve’s membrane | 0.1 kg s−1 | |
| Equilibrium distance | 10−4 m | |
| Boundaries | ||
| Repulsive radius | 1 × 10⁻⁴ m | |
| Constant | 1 × 10⁻⁴ J | |
| Attractive forces potential | ||
| Mass of solid particles | 1.056 × 10⁻⁵ kg | |
| Solid diameter | 10−4 m | |
| Particle density | 1056 kg m−3 | |
| Pair potential | 2 × 10⁻⁵ J − 1 × 10⁻¹⁶ J | |
Publisher’s Note: MDPI stays neutral with regard to jurisdictional claims in published maps and institutional affiliations. |
© 2021 by the authors. Licensee MDPI, Basel, Switzerland. This article is an open access article distributed under the terms and conditions of the Creative Commons Attribution (CC BY) license (https://creativecommons.org/licenses/by/4.0/).
Share and Cite
MDPI and ACS Style
Baksamawi, H.A.; Ariane, M.; Brill, A.; Vigolo, D.; Alexiadis, A. Modelling Particle Agglomeration on through Elastic Valves under Flow. ChemEngineering 2021, 5, 40. https://0-doi-org.brum.beds.ac.uk/10.3390/chemengineering5030040
AMA Style
Baksamawi HA, Ariane M, Brill A, Vigolo D, Alexiadis A. Modelling Particle Agglomeration on through Elastic Valves under Flow. ChemEngineering. 2021; 5(3):40. https://0-doi-org.brum.beds.ac.uk/10.3390/chemengineering5030040
Chicago/Turabian StyleBaksamawi, Hosam Alden, Mostapha Ariane, Alexander Brill, Daniele Vigolo, and Alessio Alexiadis. 2021. "Modelling Particle Agglomeration on through Elastic Valves under Flow" ChemEngineering 5, no. 3: 40. https://0-doi-org.brum.beds.ac.uk/10.3390/chemengineering5030040