
Experimental Investigation and Computational Fluid Dynamic Simulation of Hydrodynamics of Liquid–Solid Fluidized Beds

 ,
,  ,
,  ,
,
Abstract
:1. Introduction
Classification of Particles for Liquid Fluidization
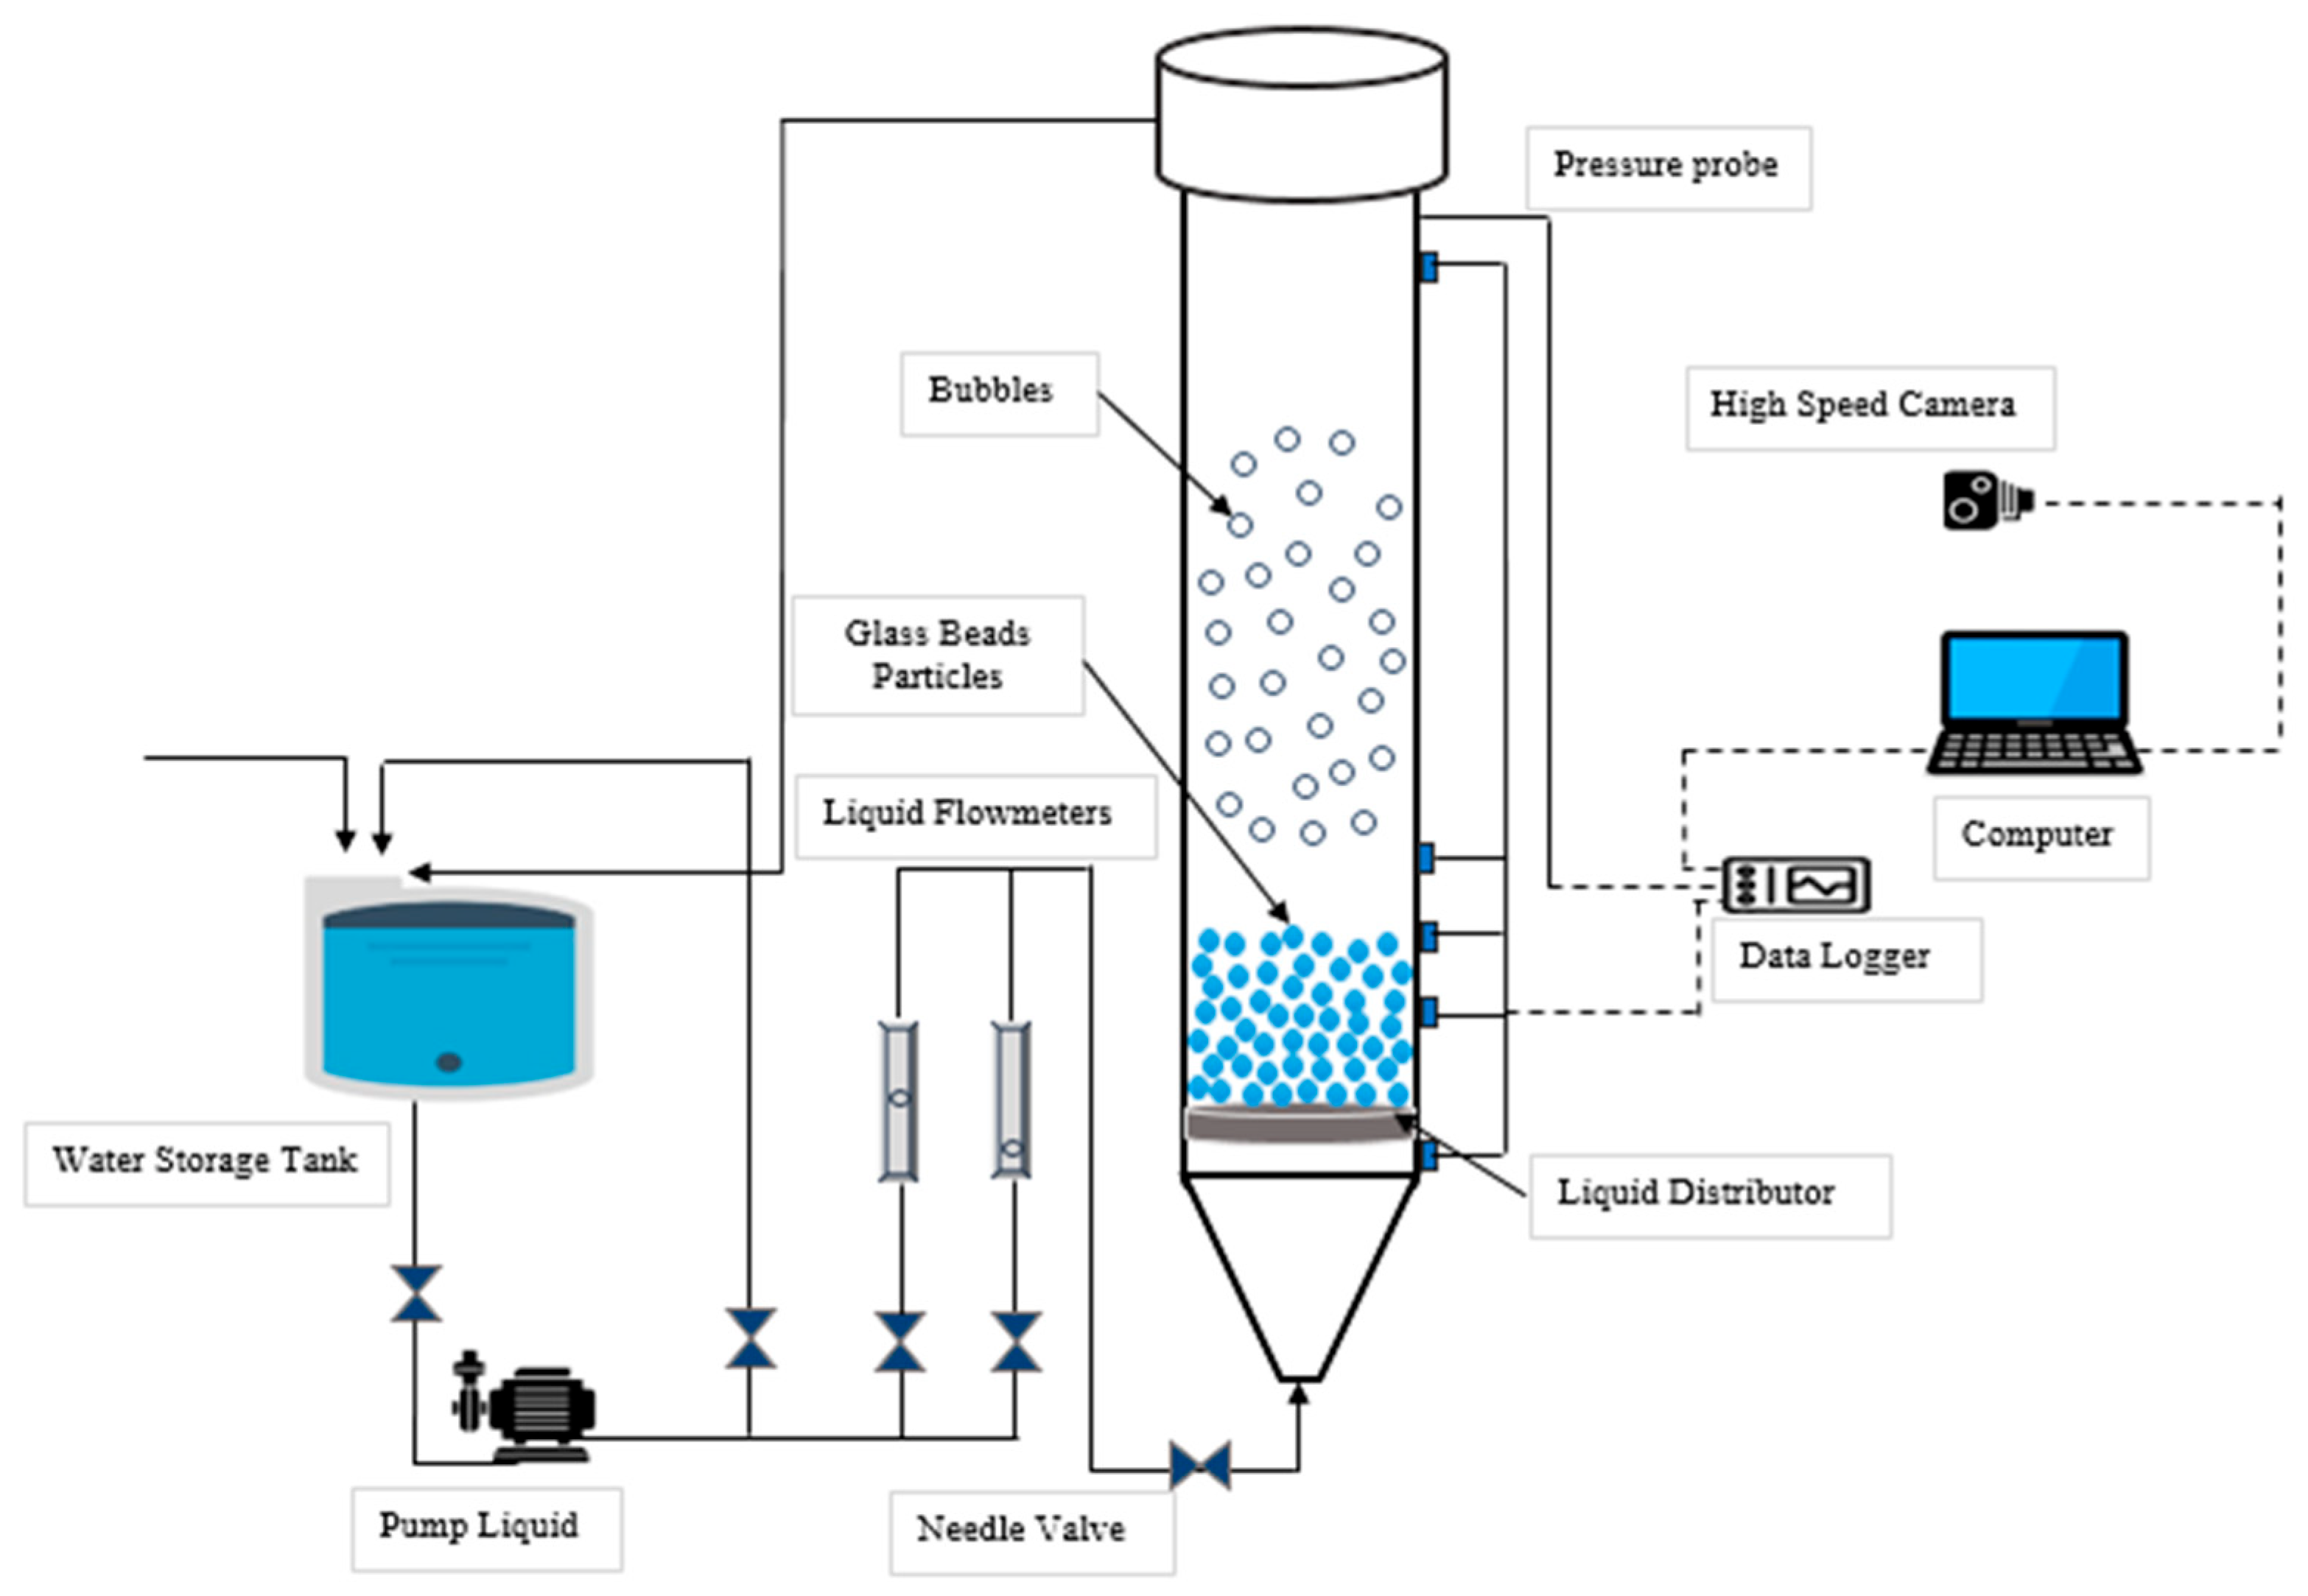
2. Experimental Setup
3. Computational Model
3.1. Simulation Details
3.2. Governing Equations
3.3. Drag Models
4. Discussion
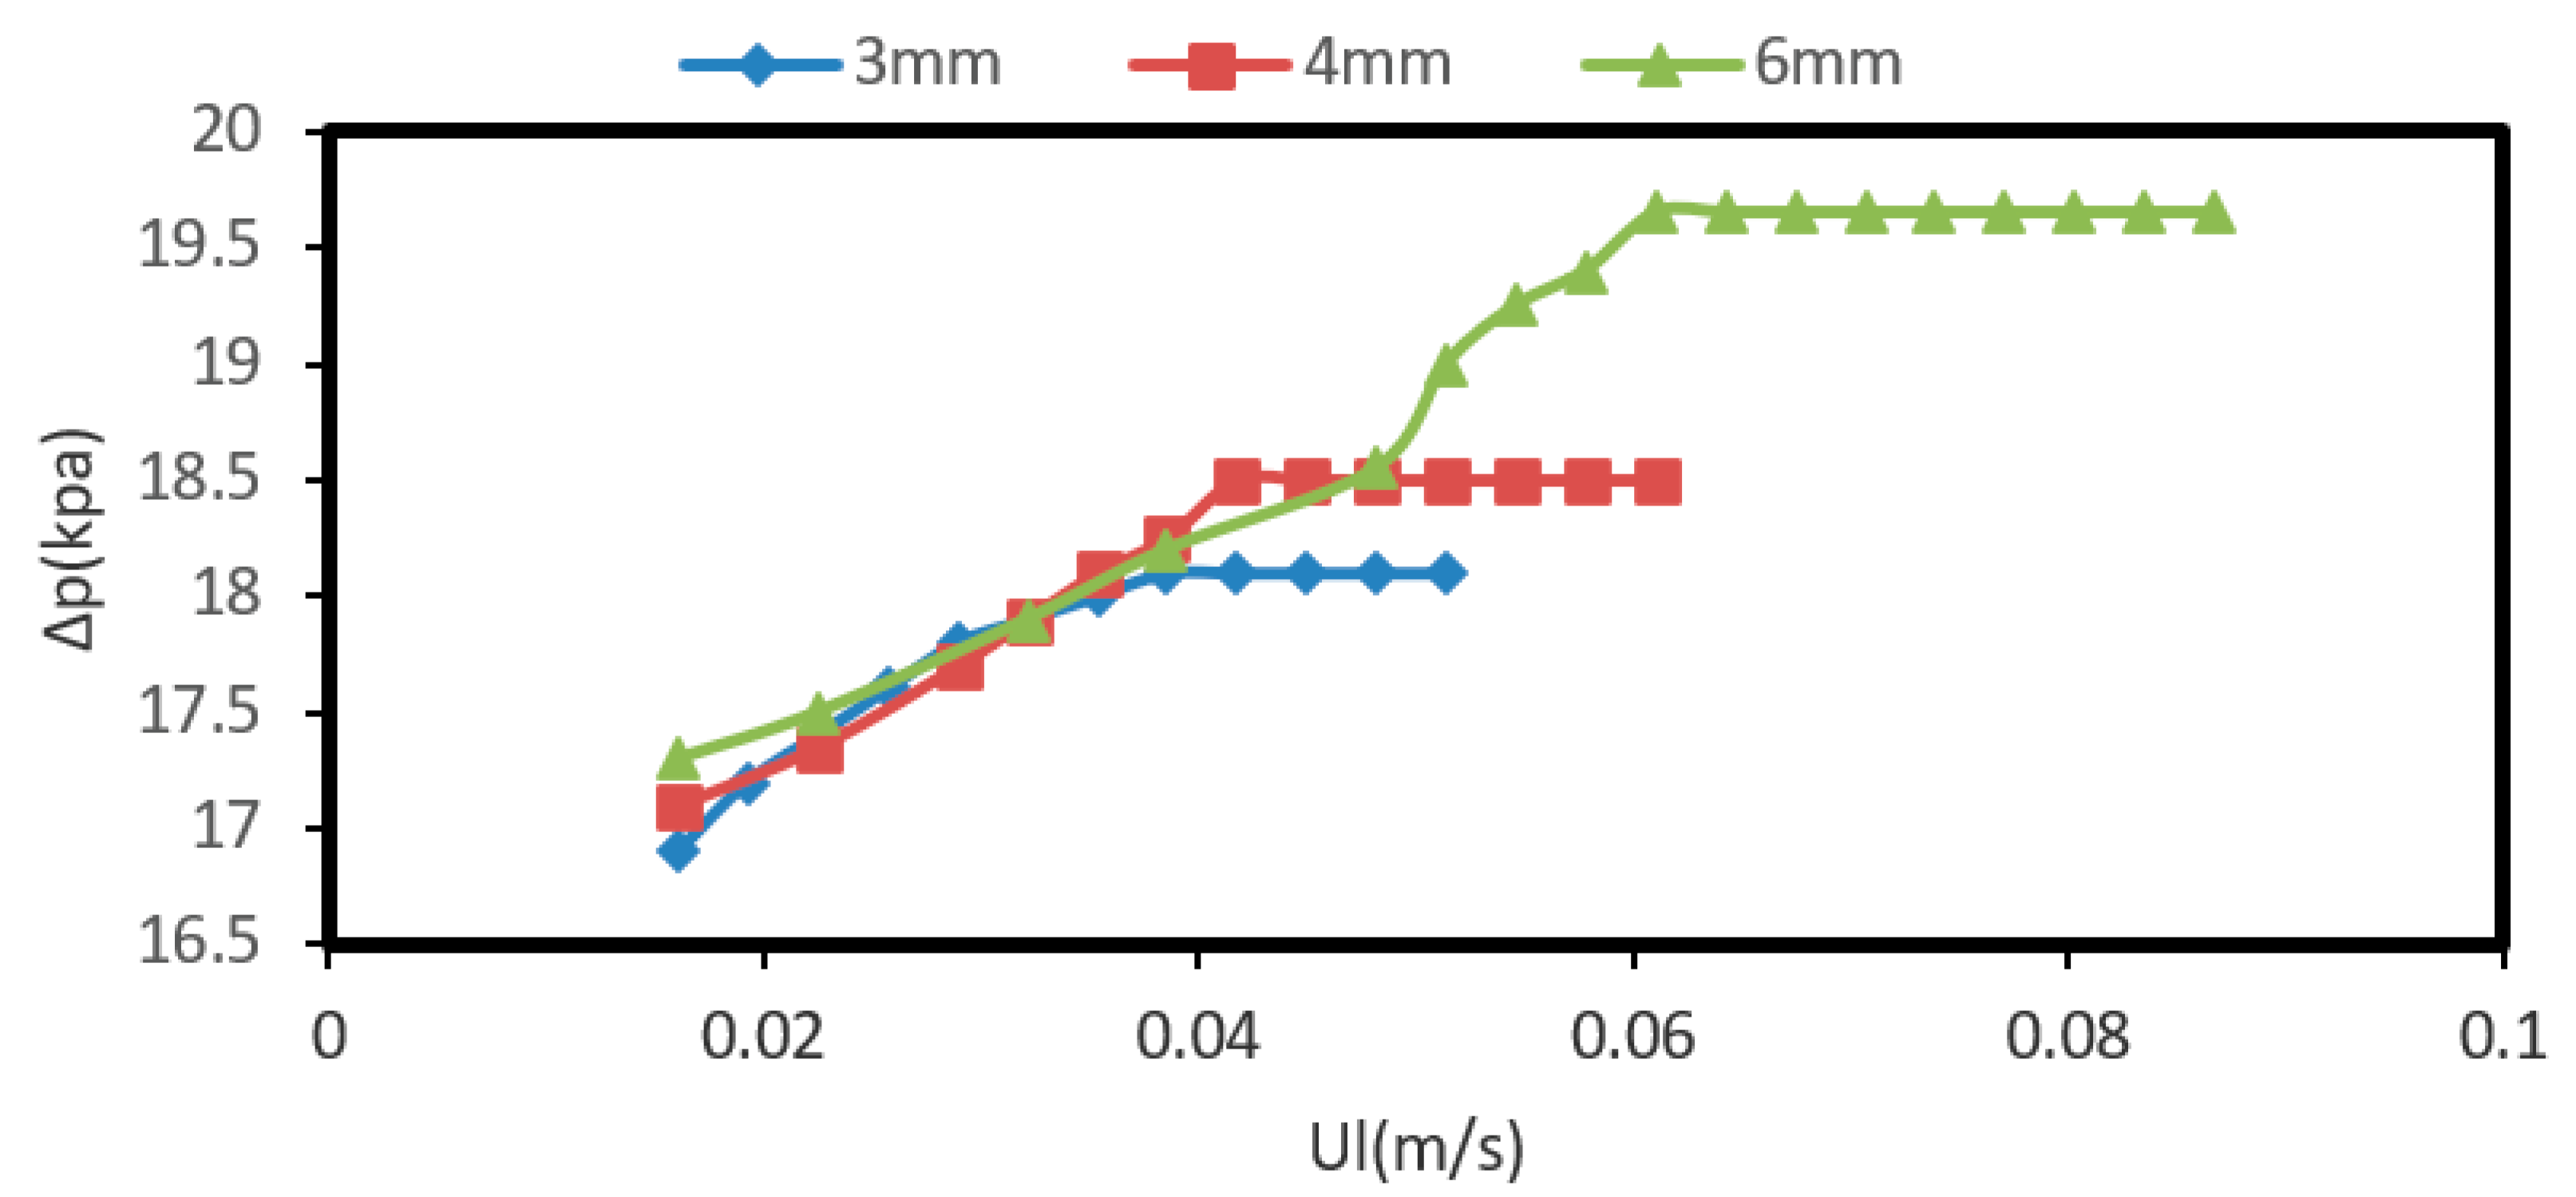
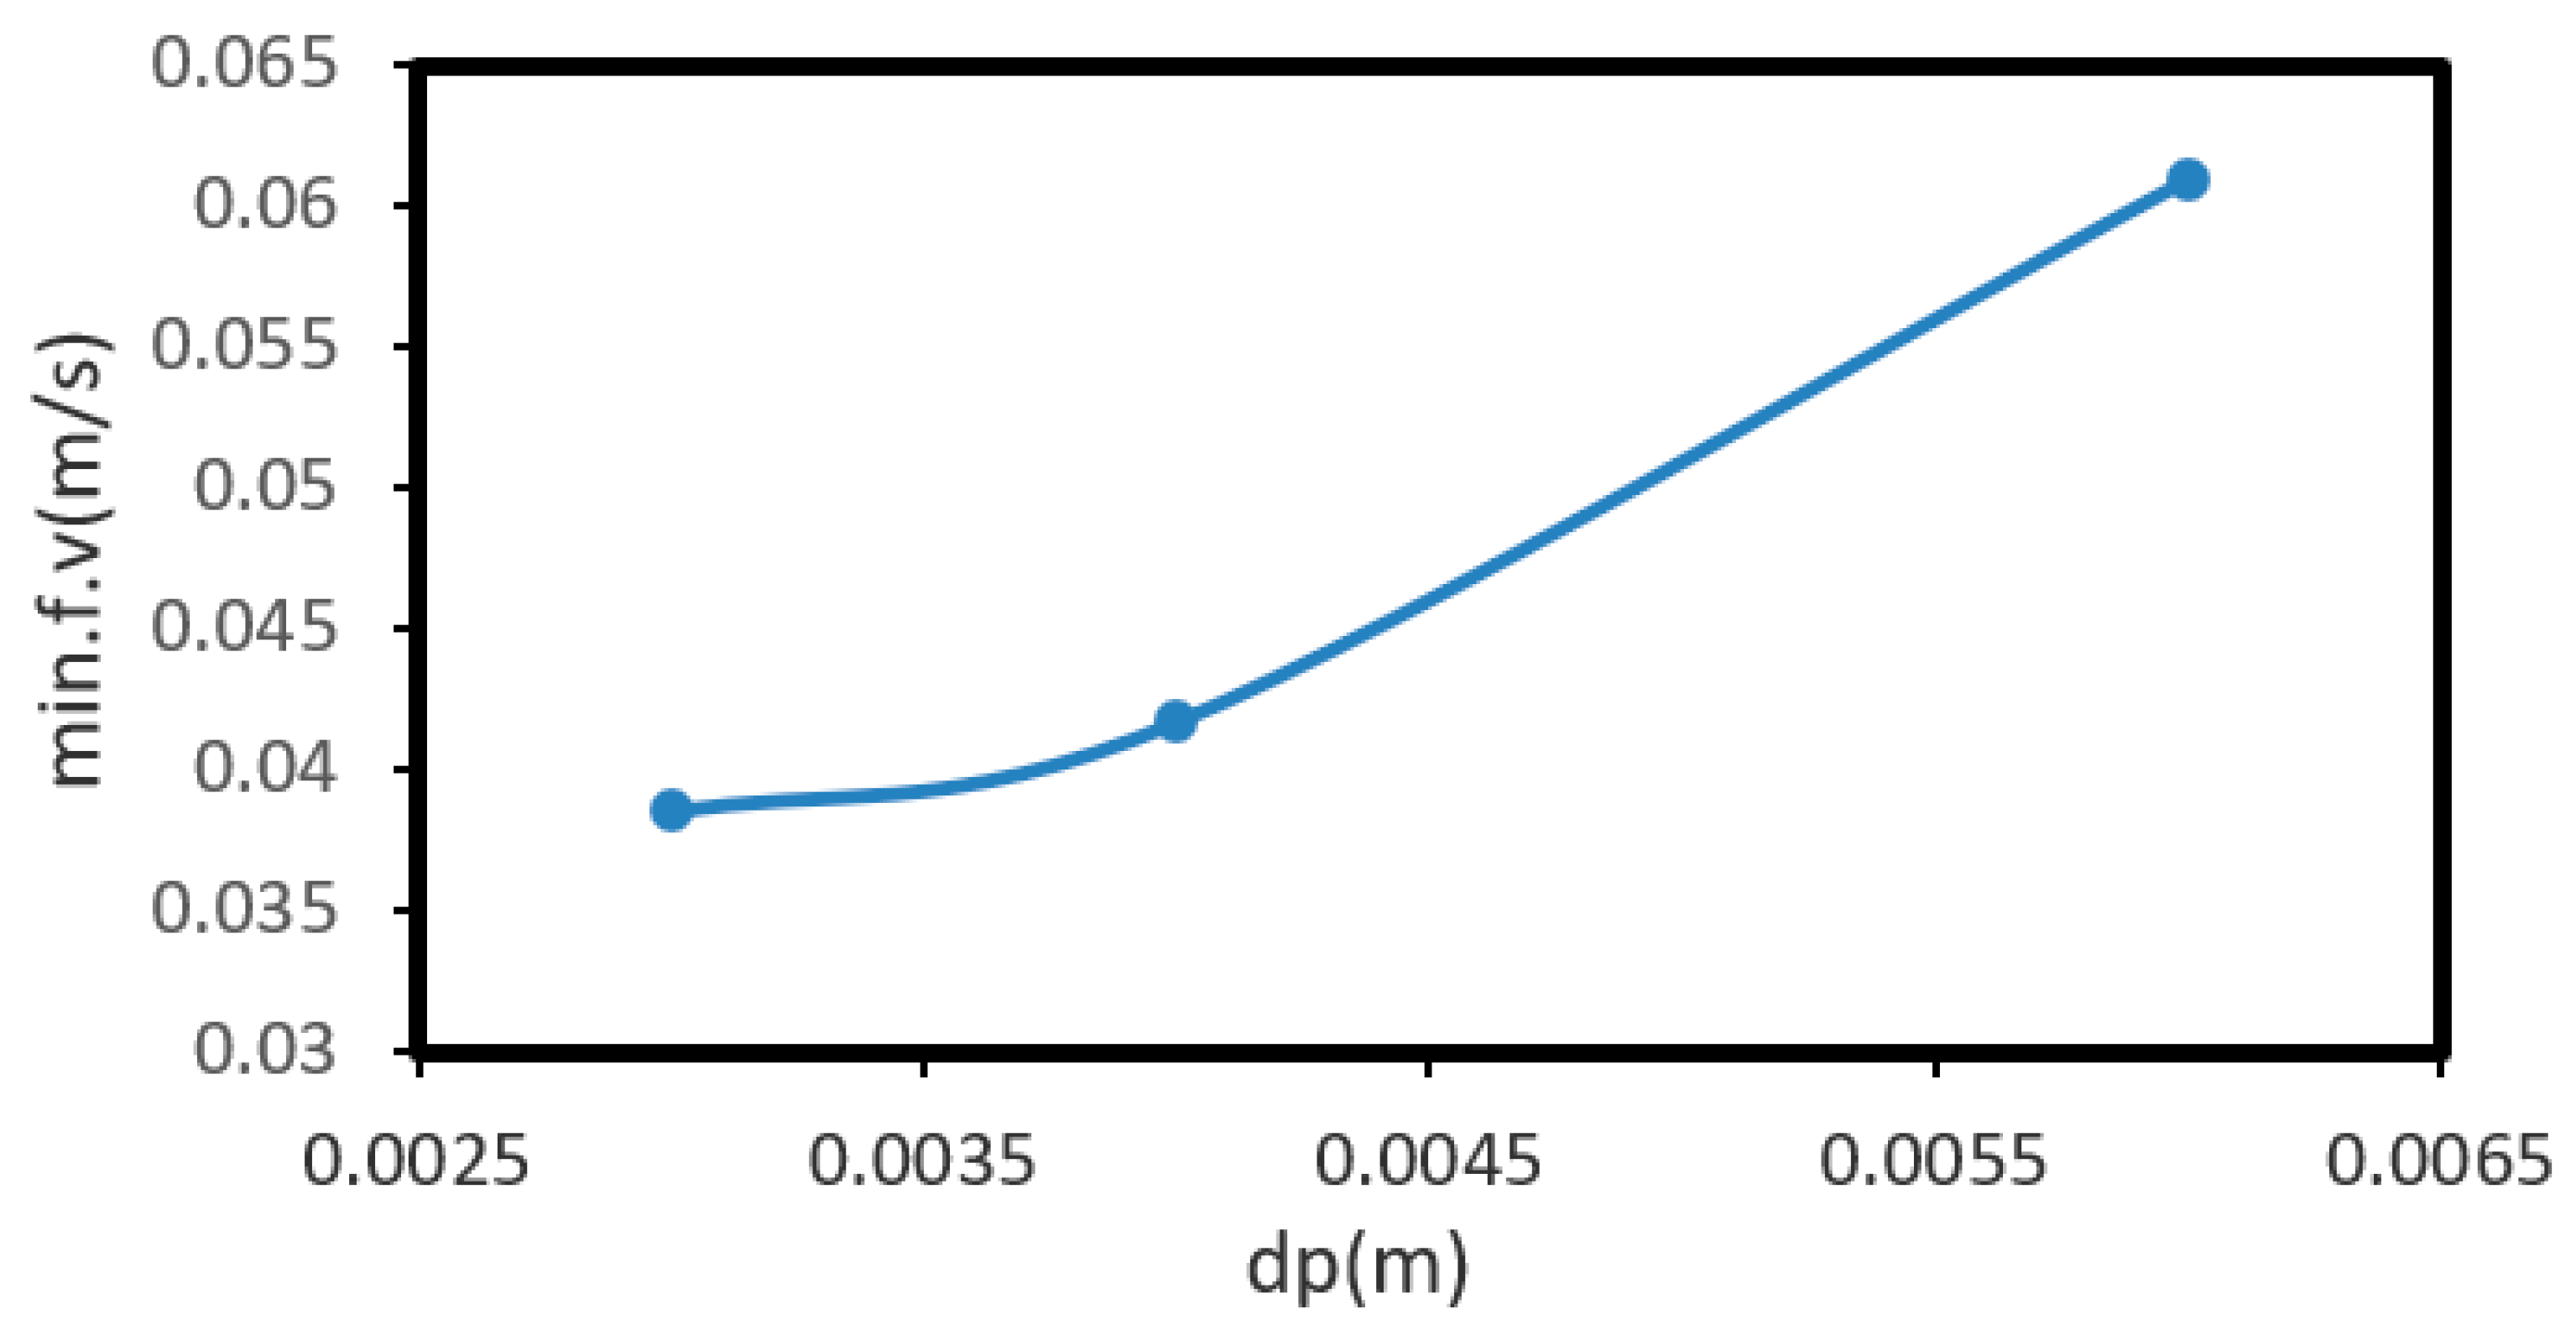
4.1. Bed Pressure Drop and Minimum Fluidization Velocity (Umf)
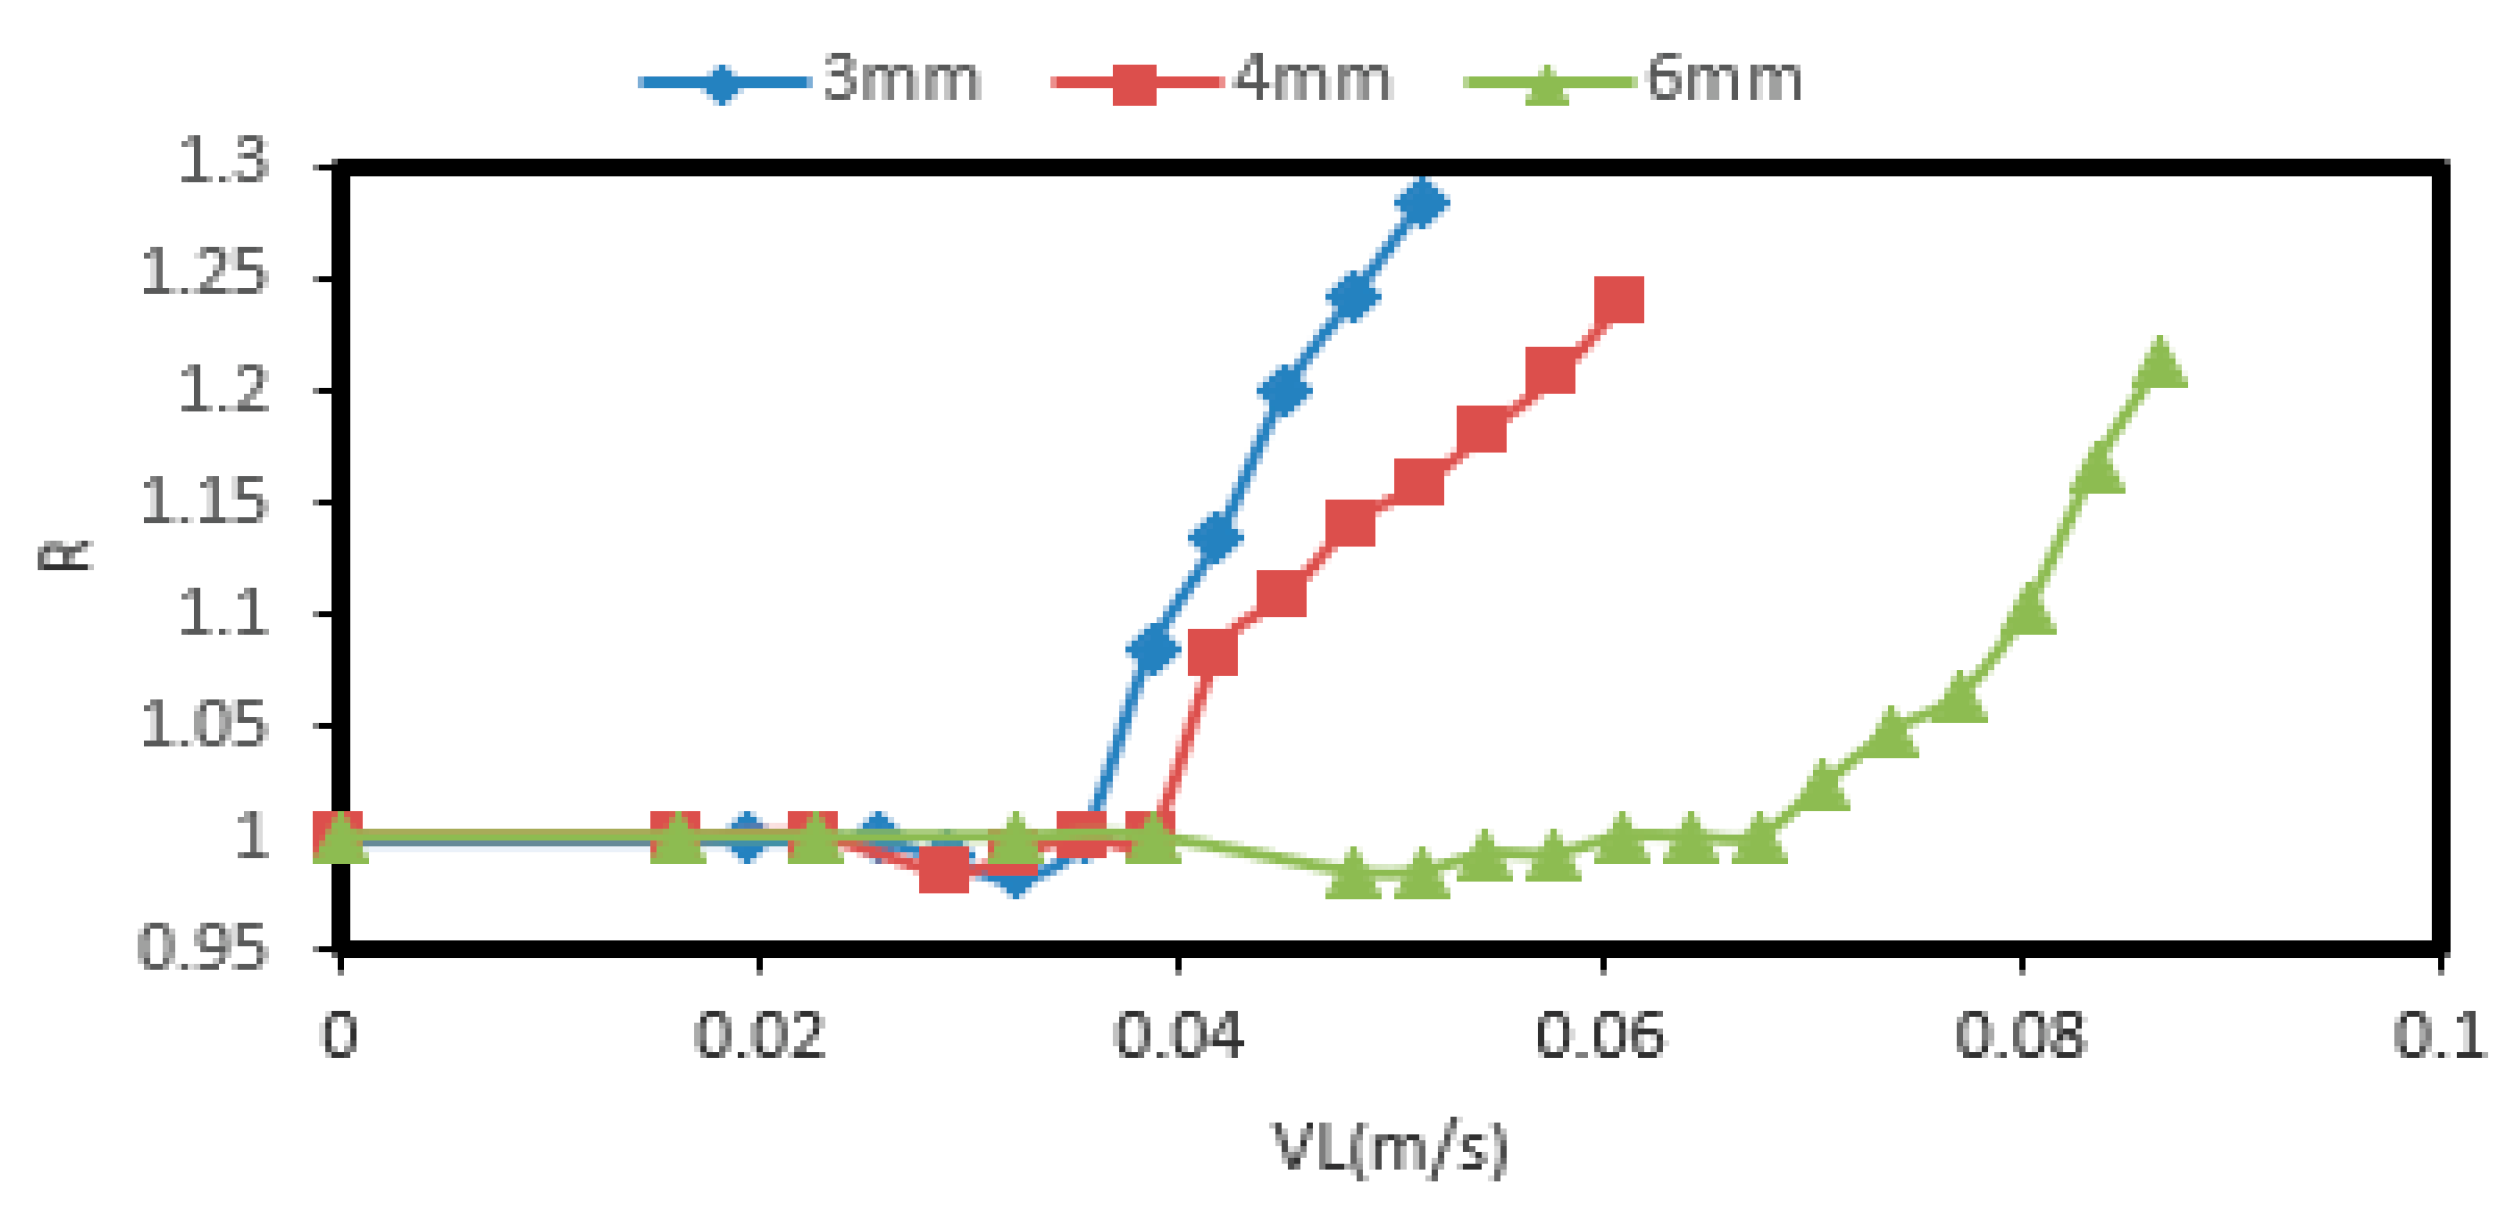
4.2. Bed Expansion
4.3. Phase Holdup
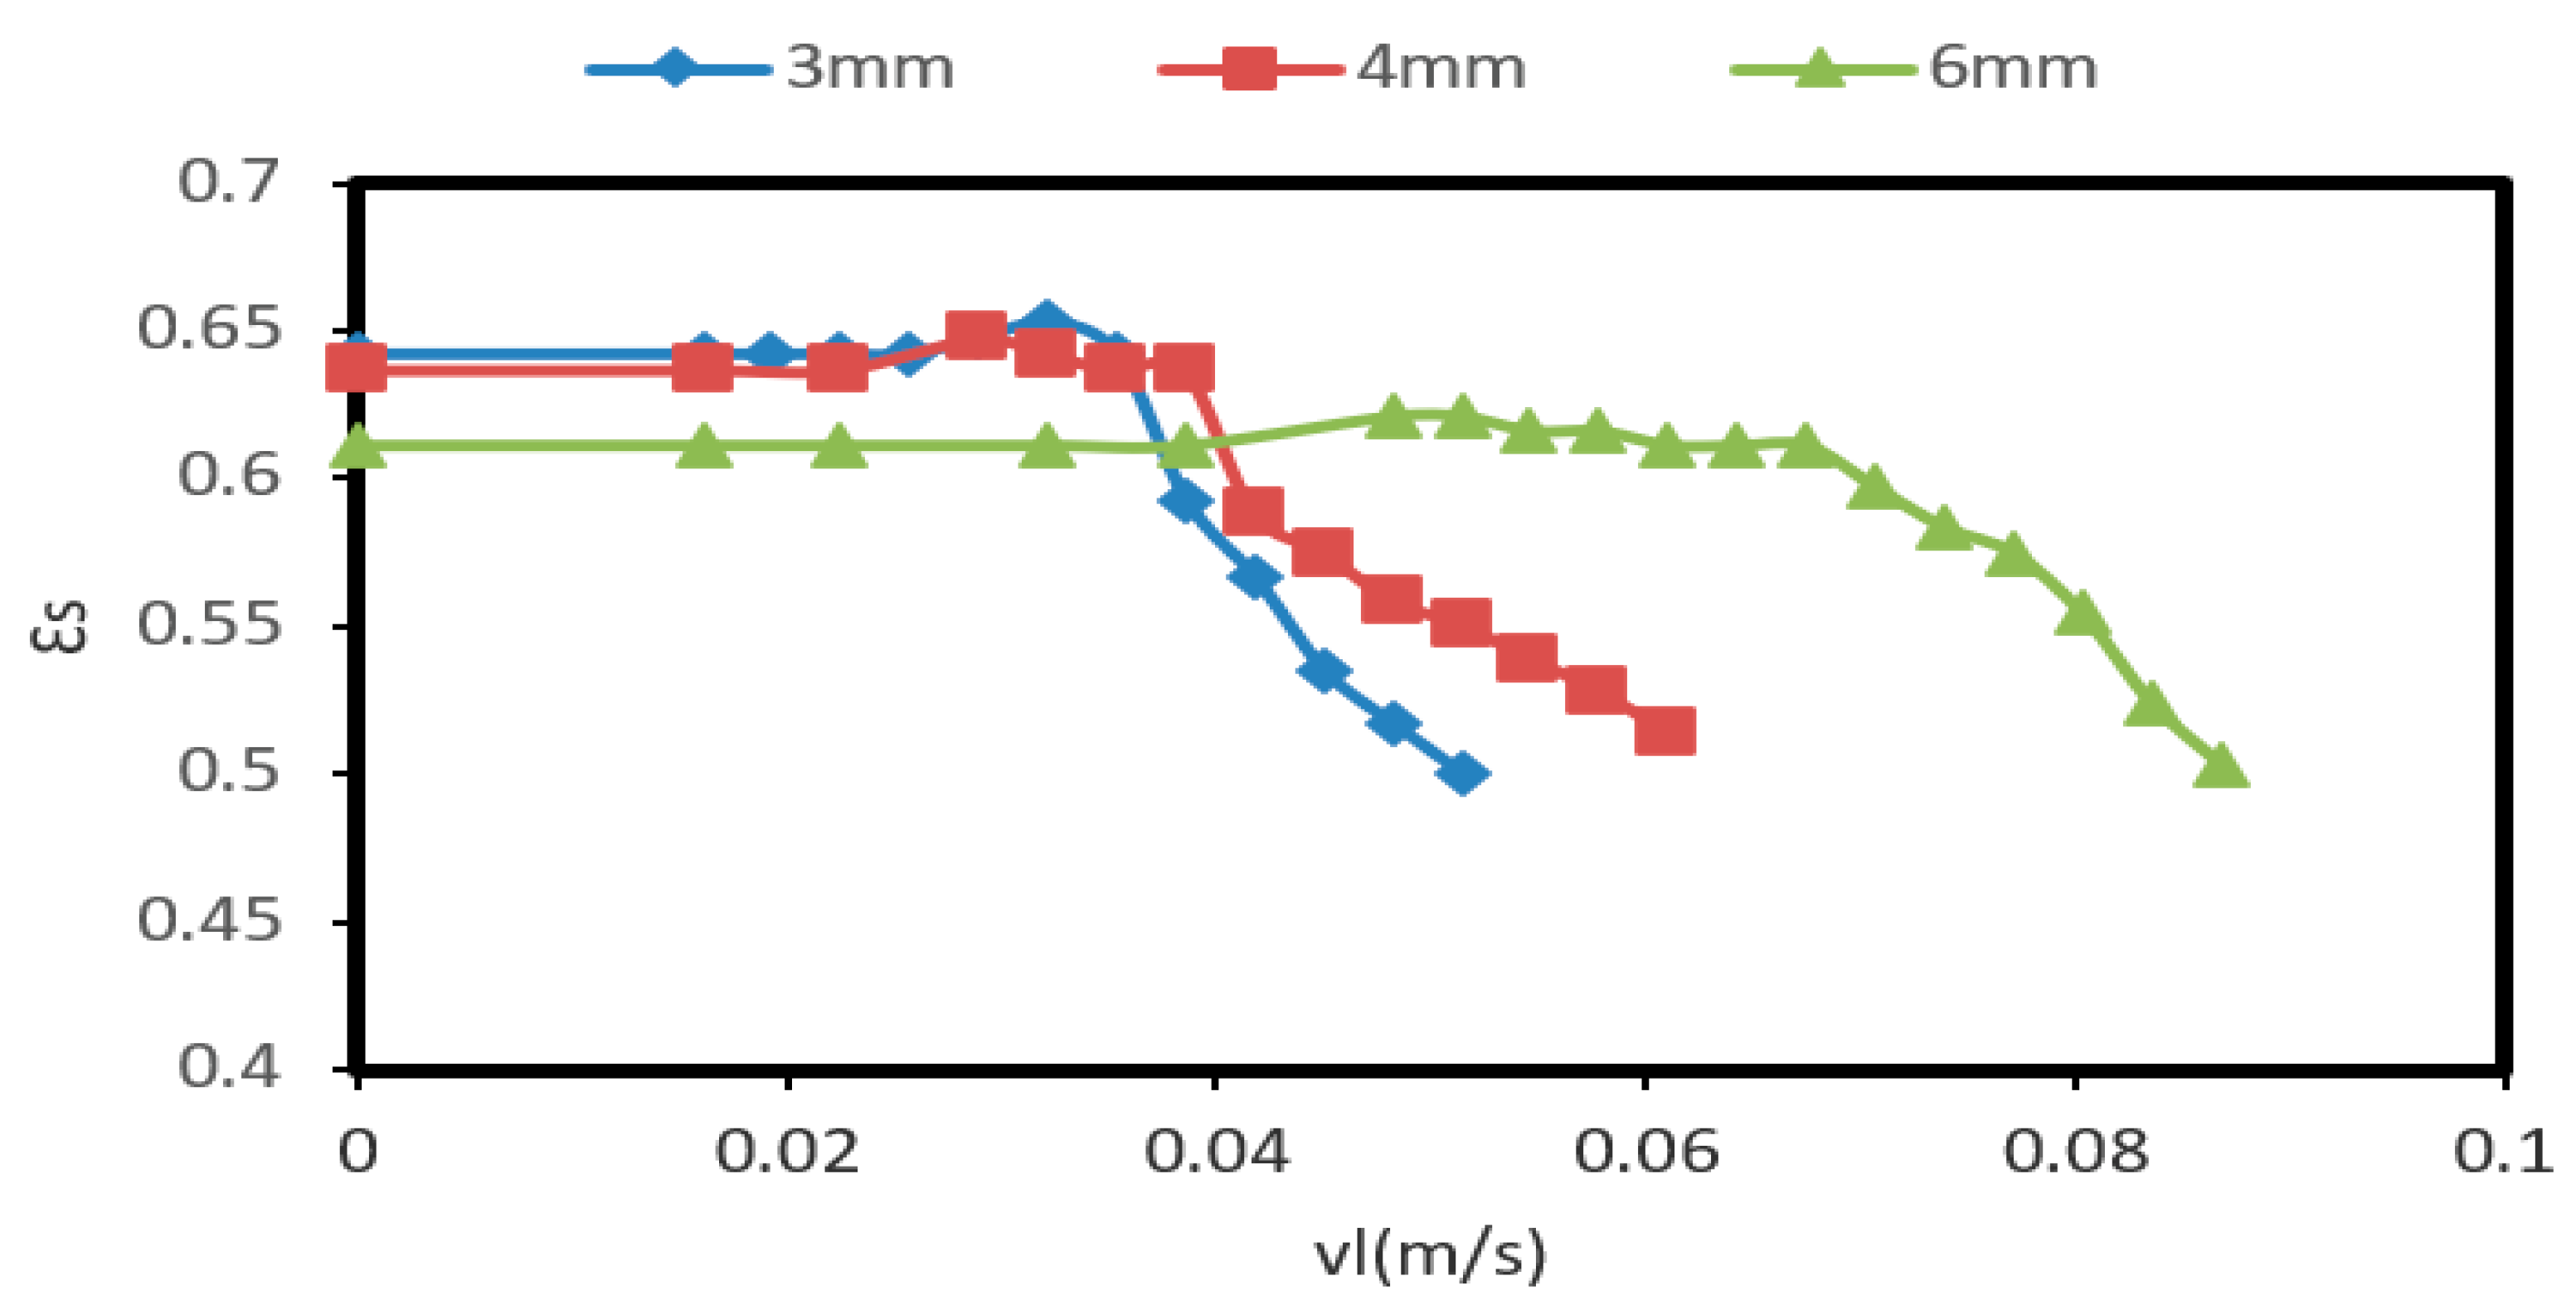
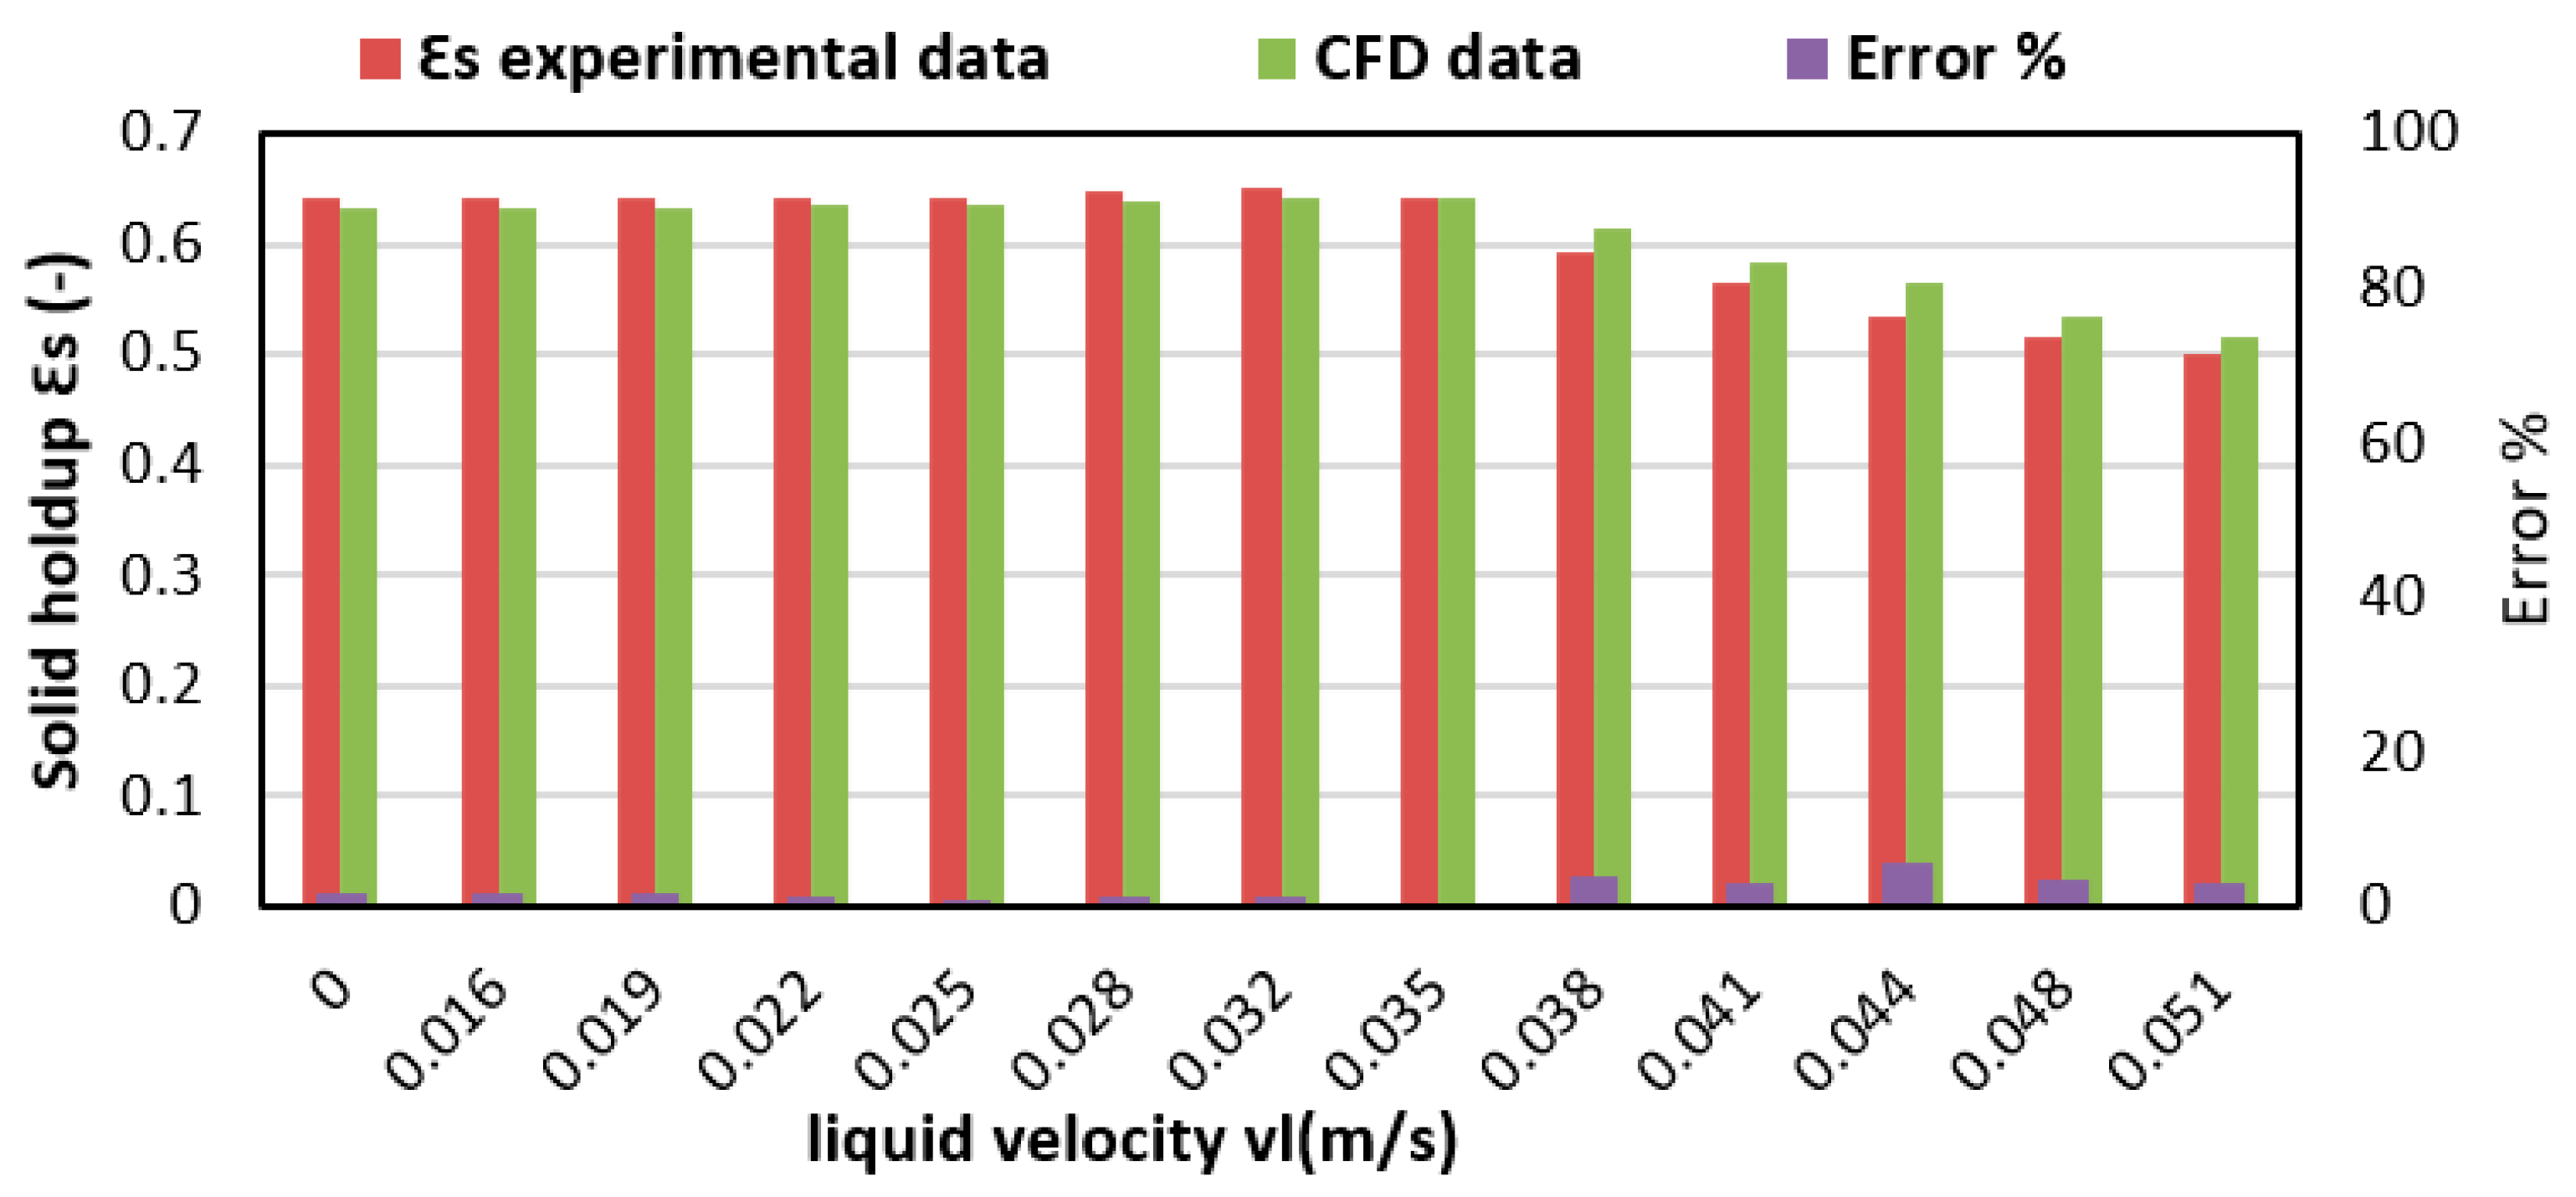
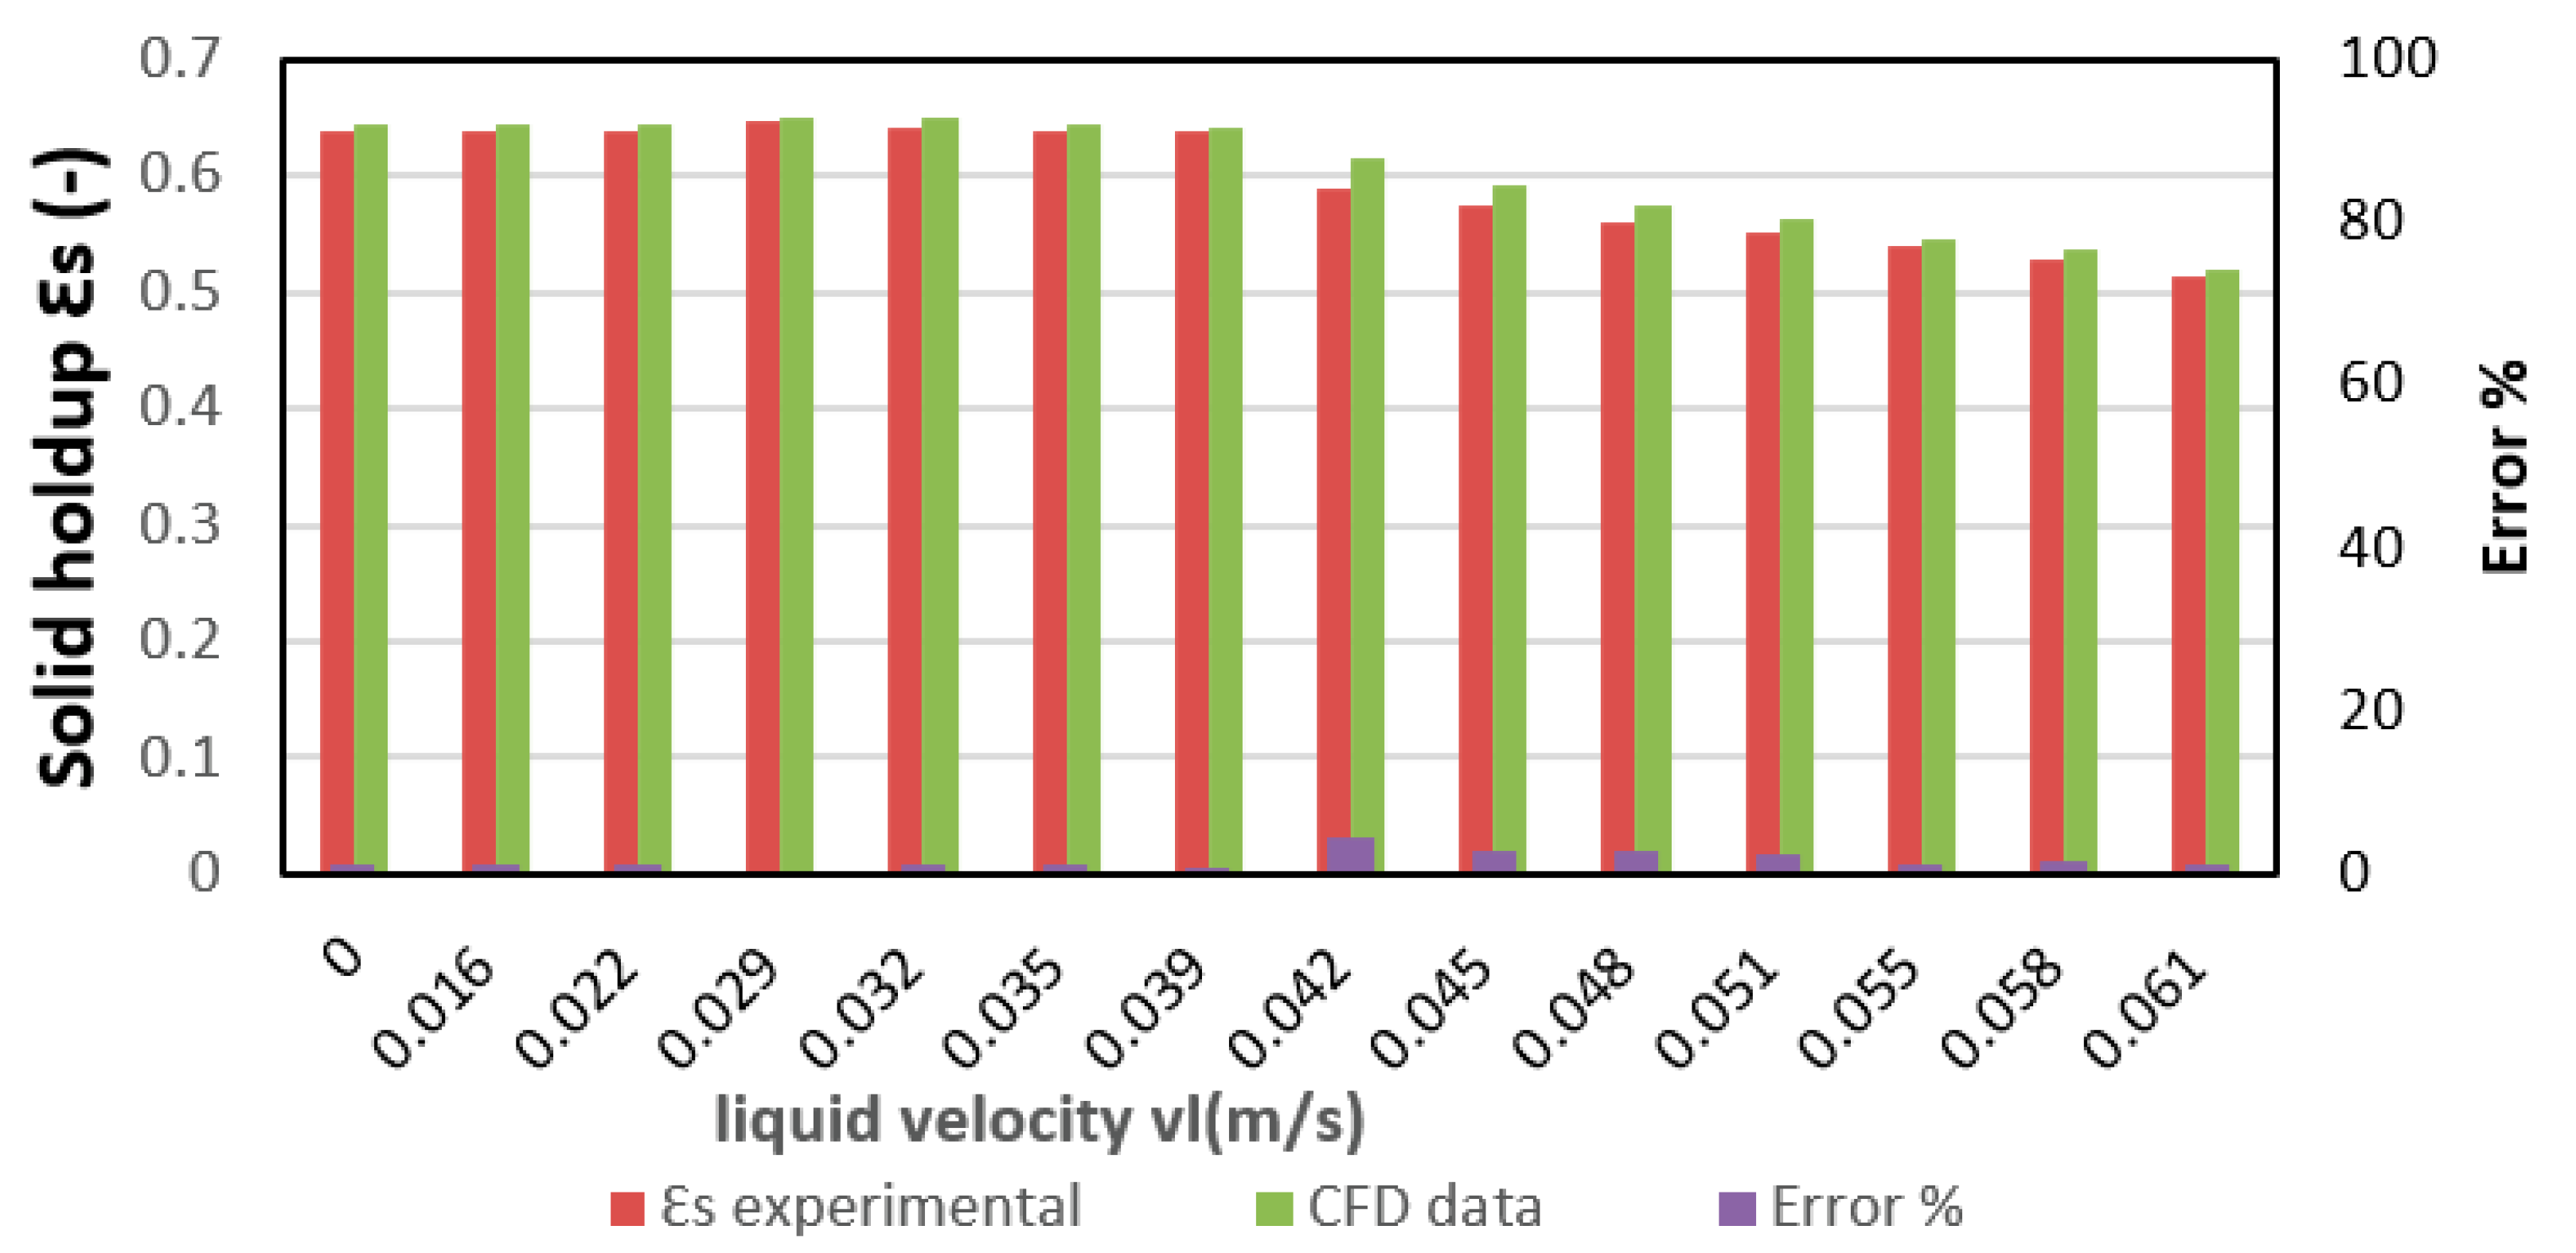
4.3.1. Solid Holdup
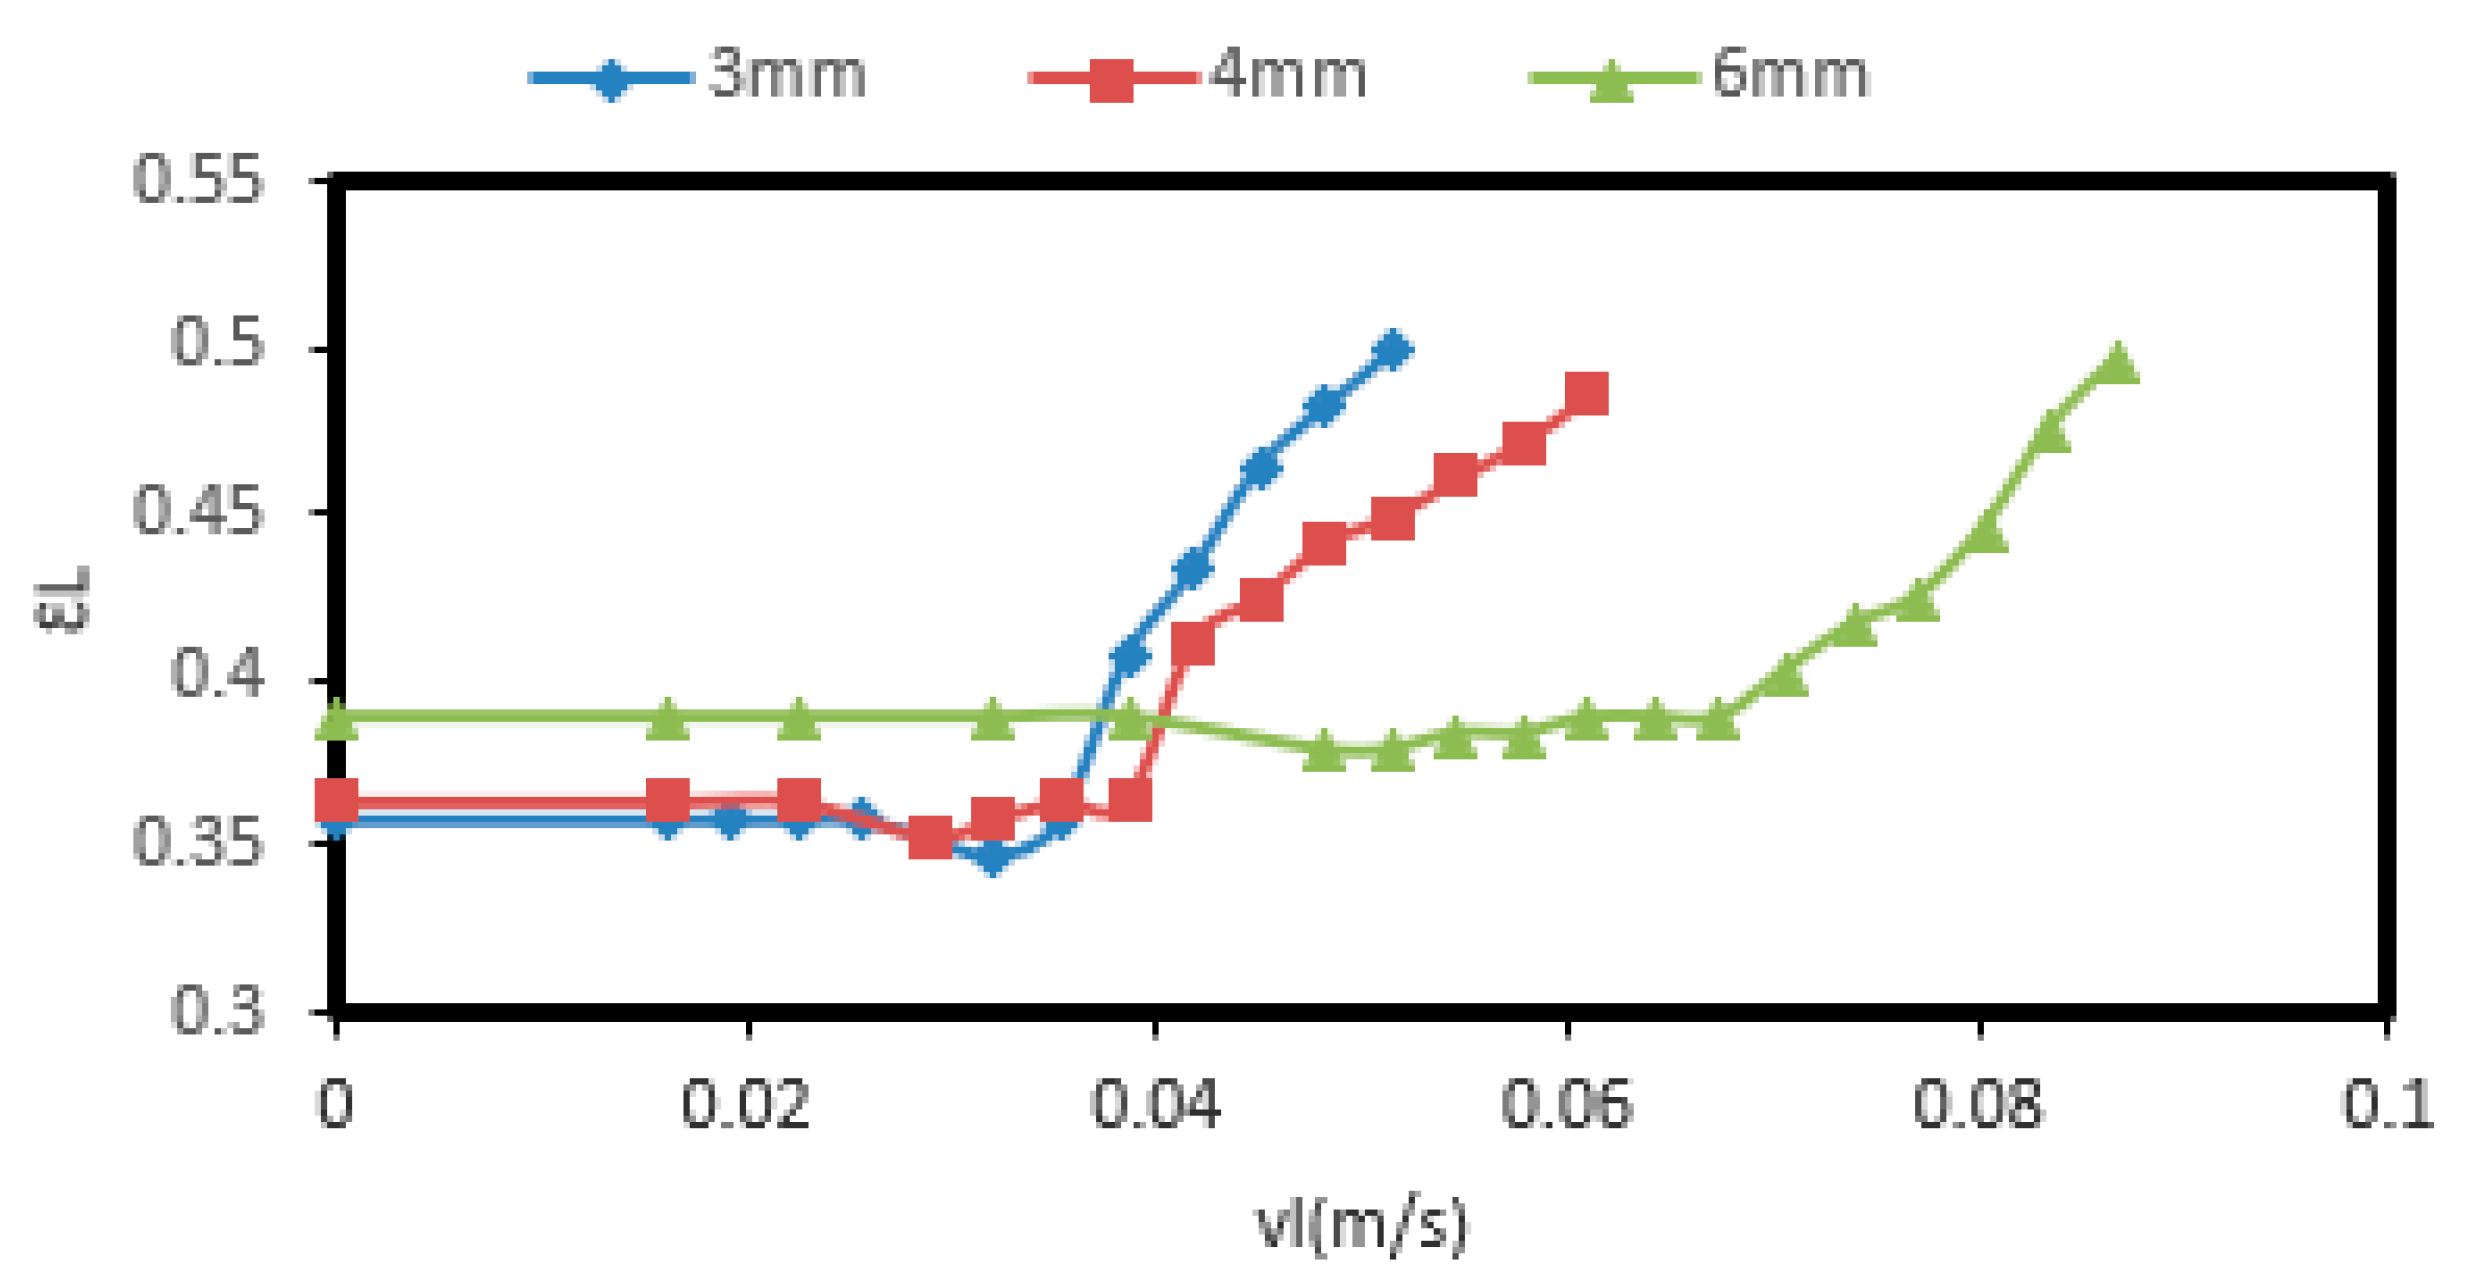
4.3.2. Liquid Holdup
4.4. CFD Simulation Results
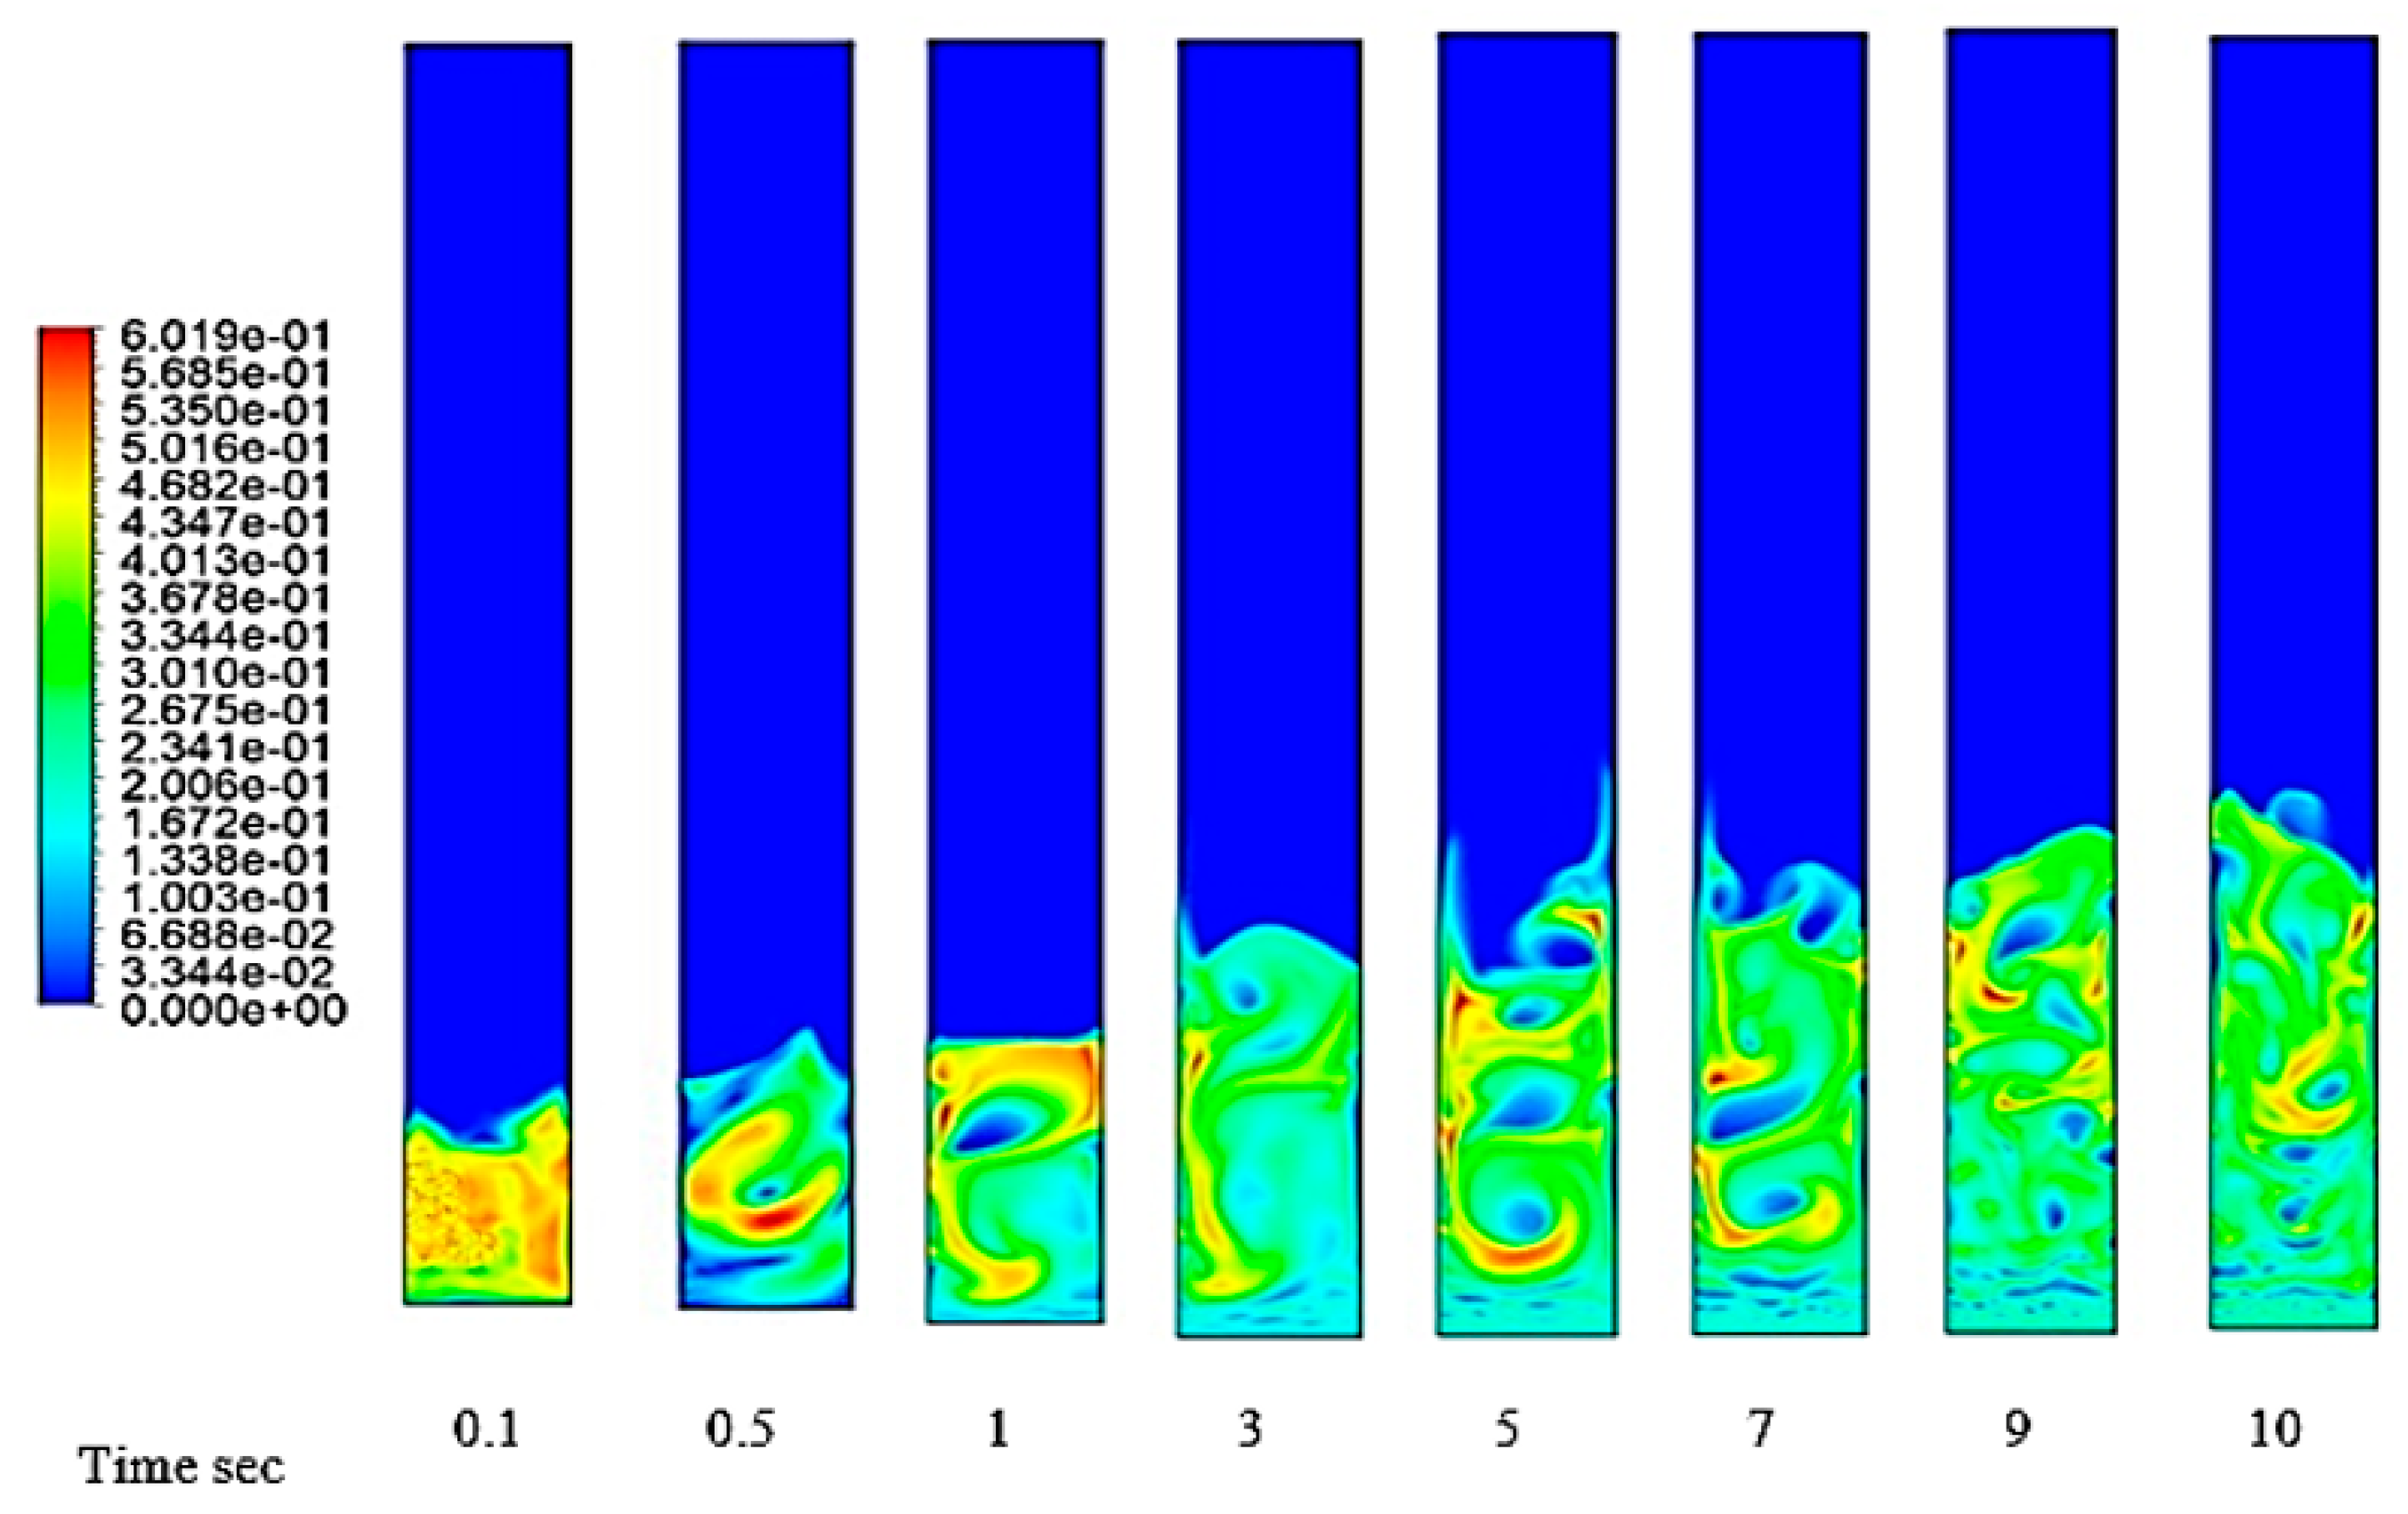
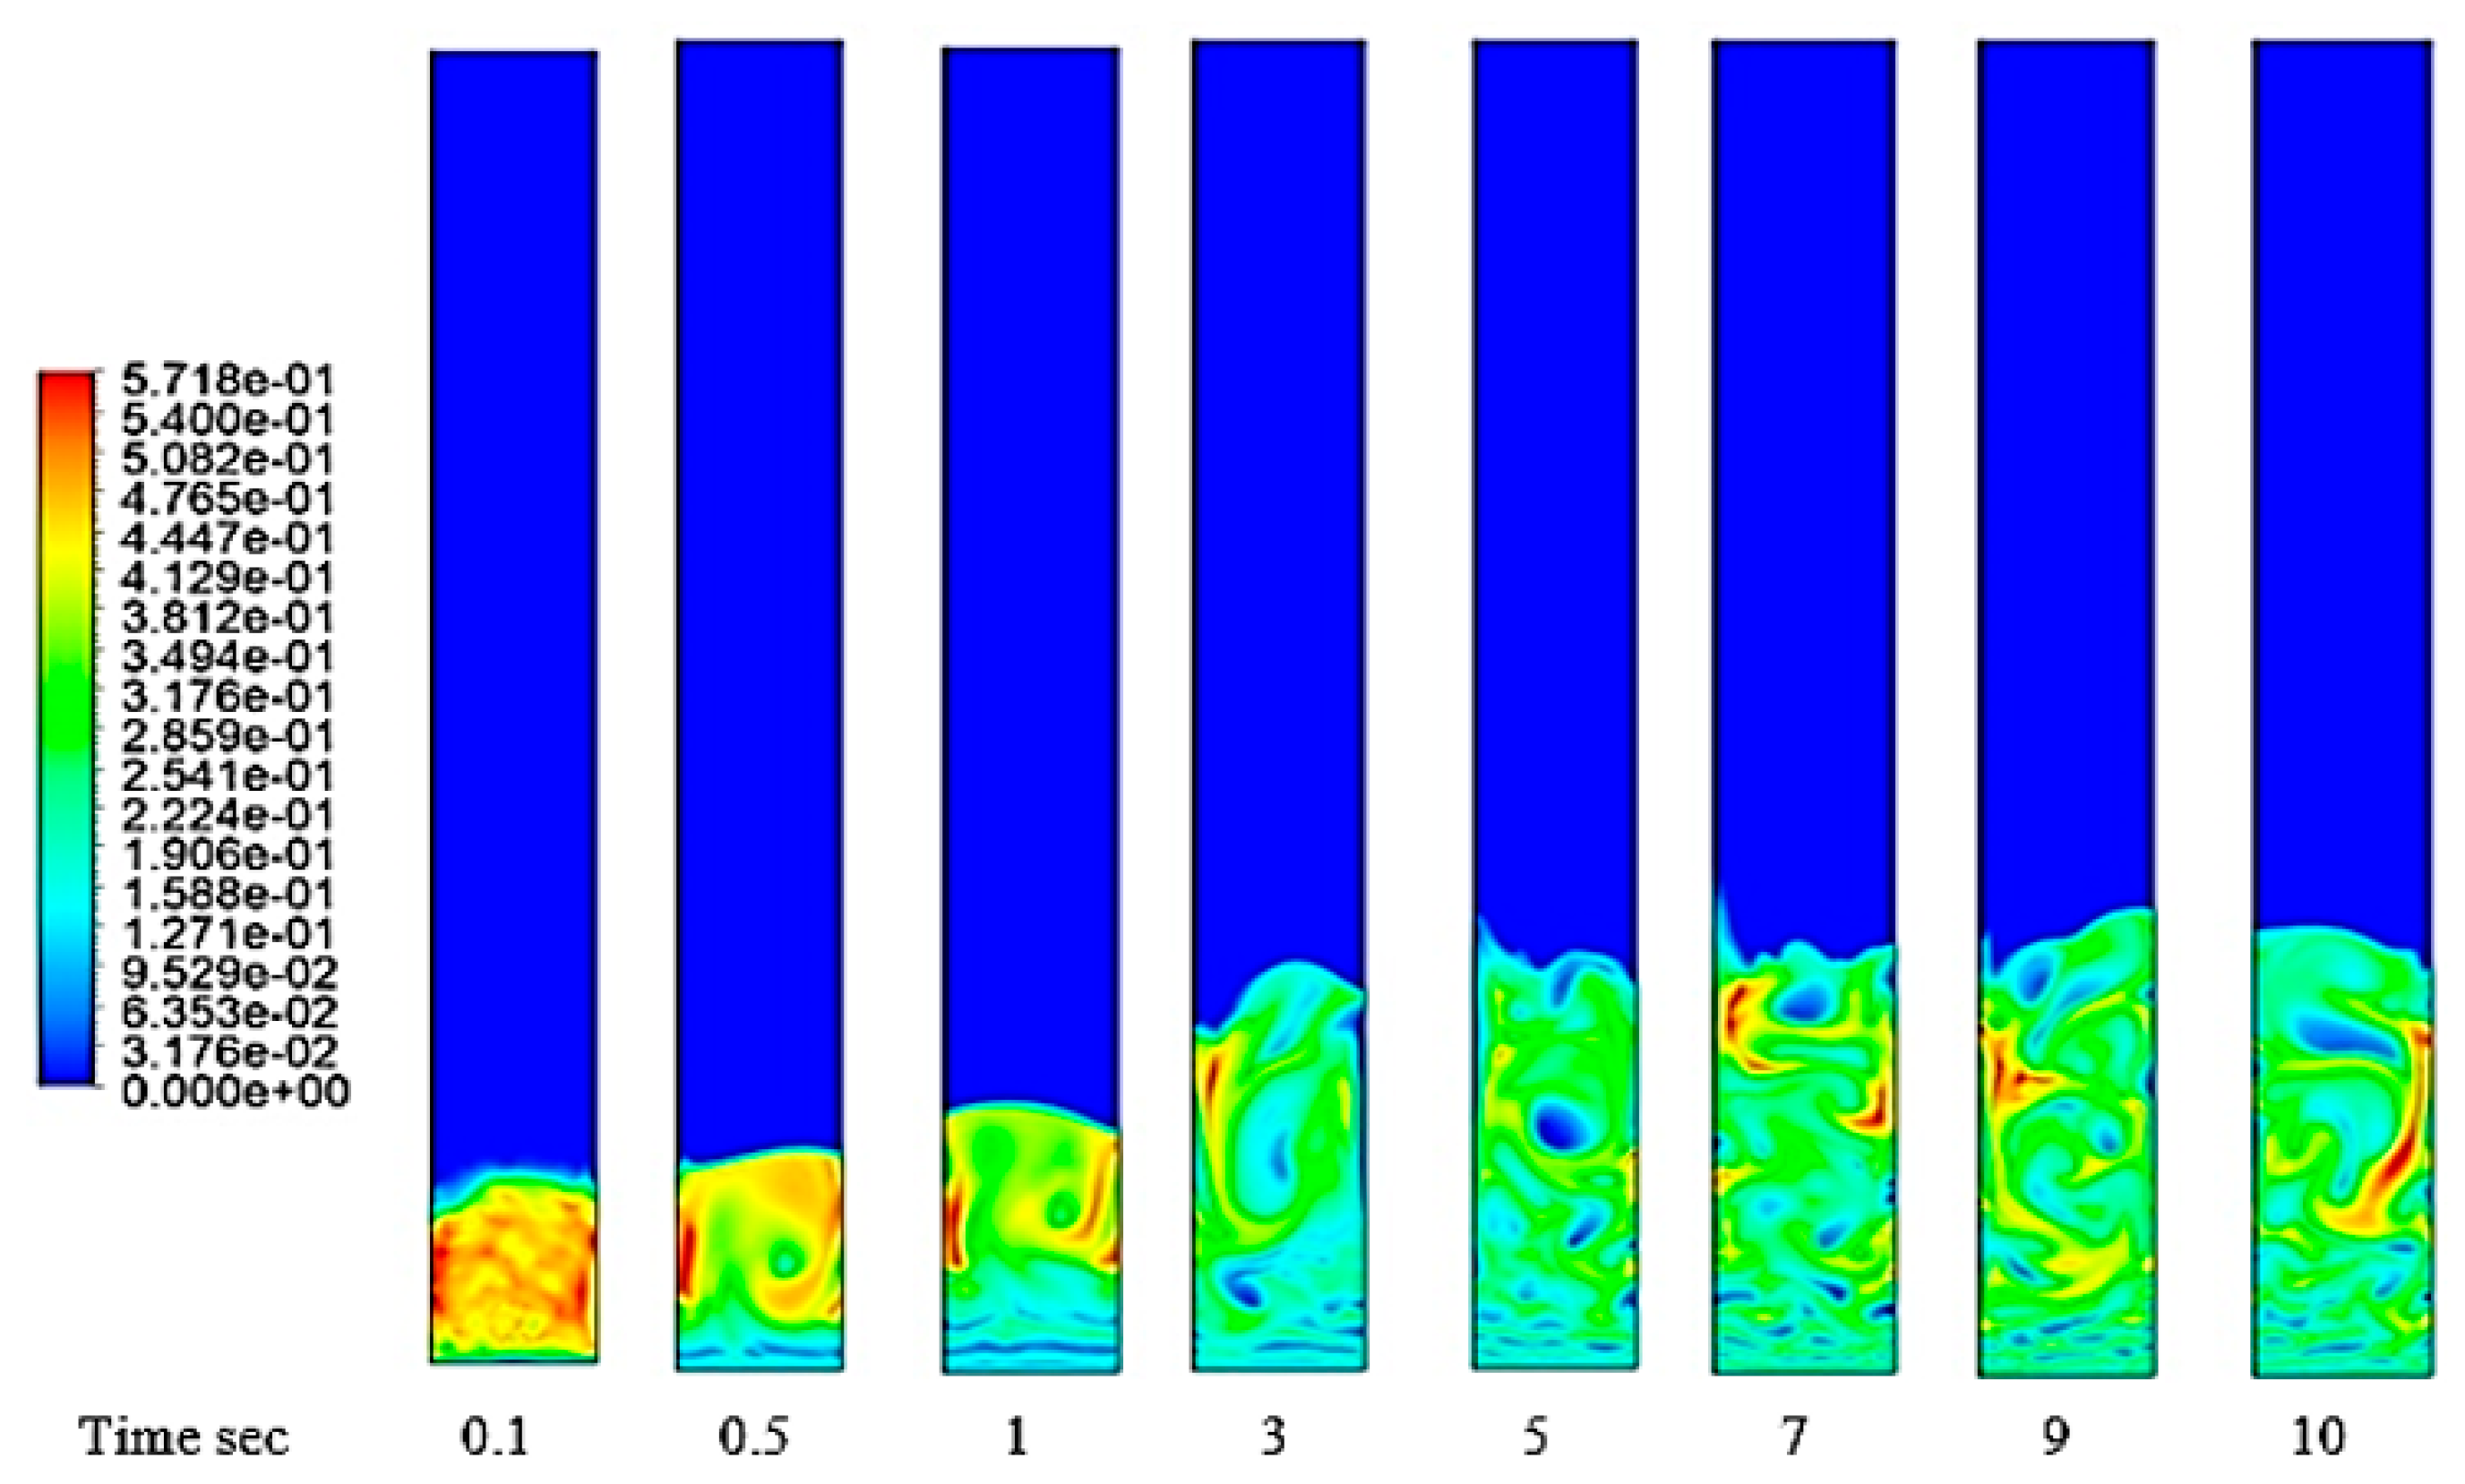
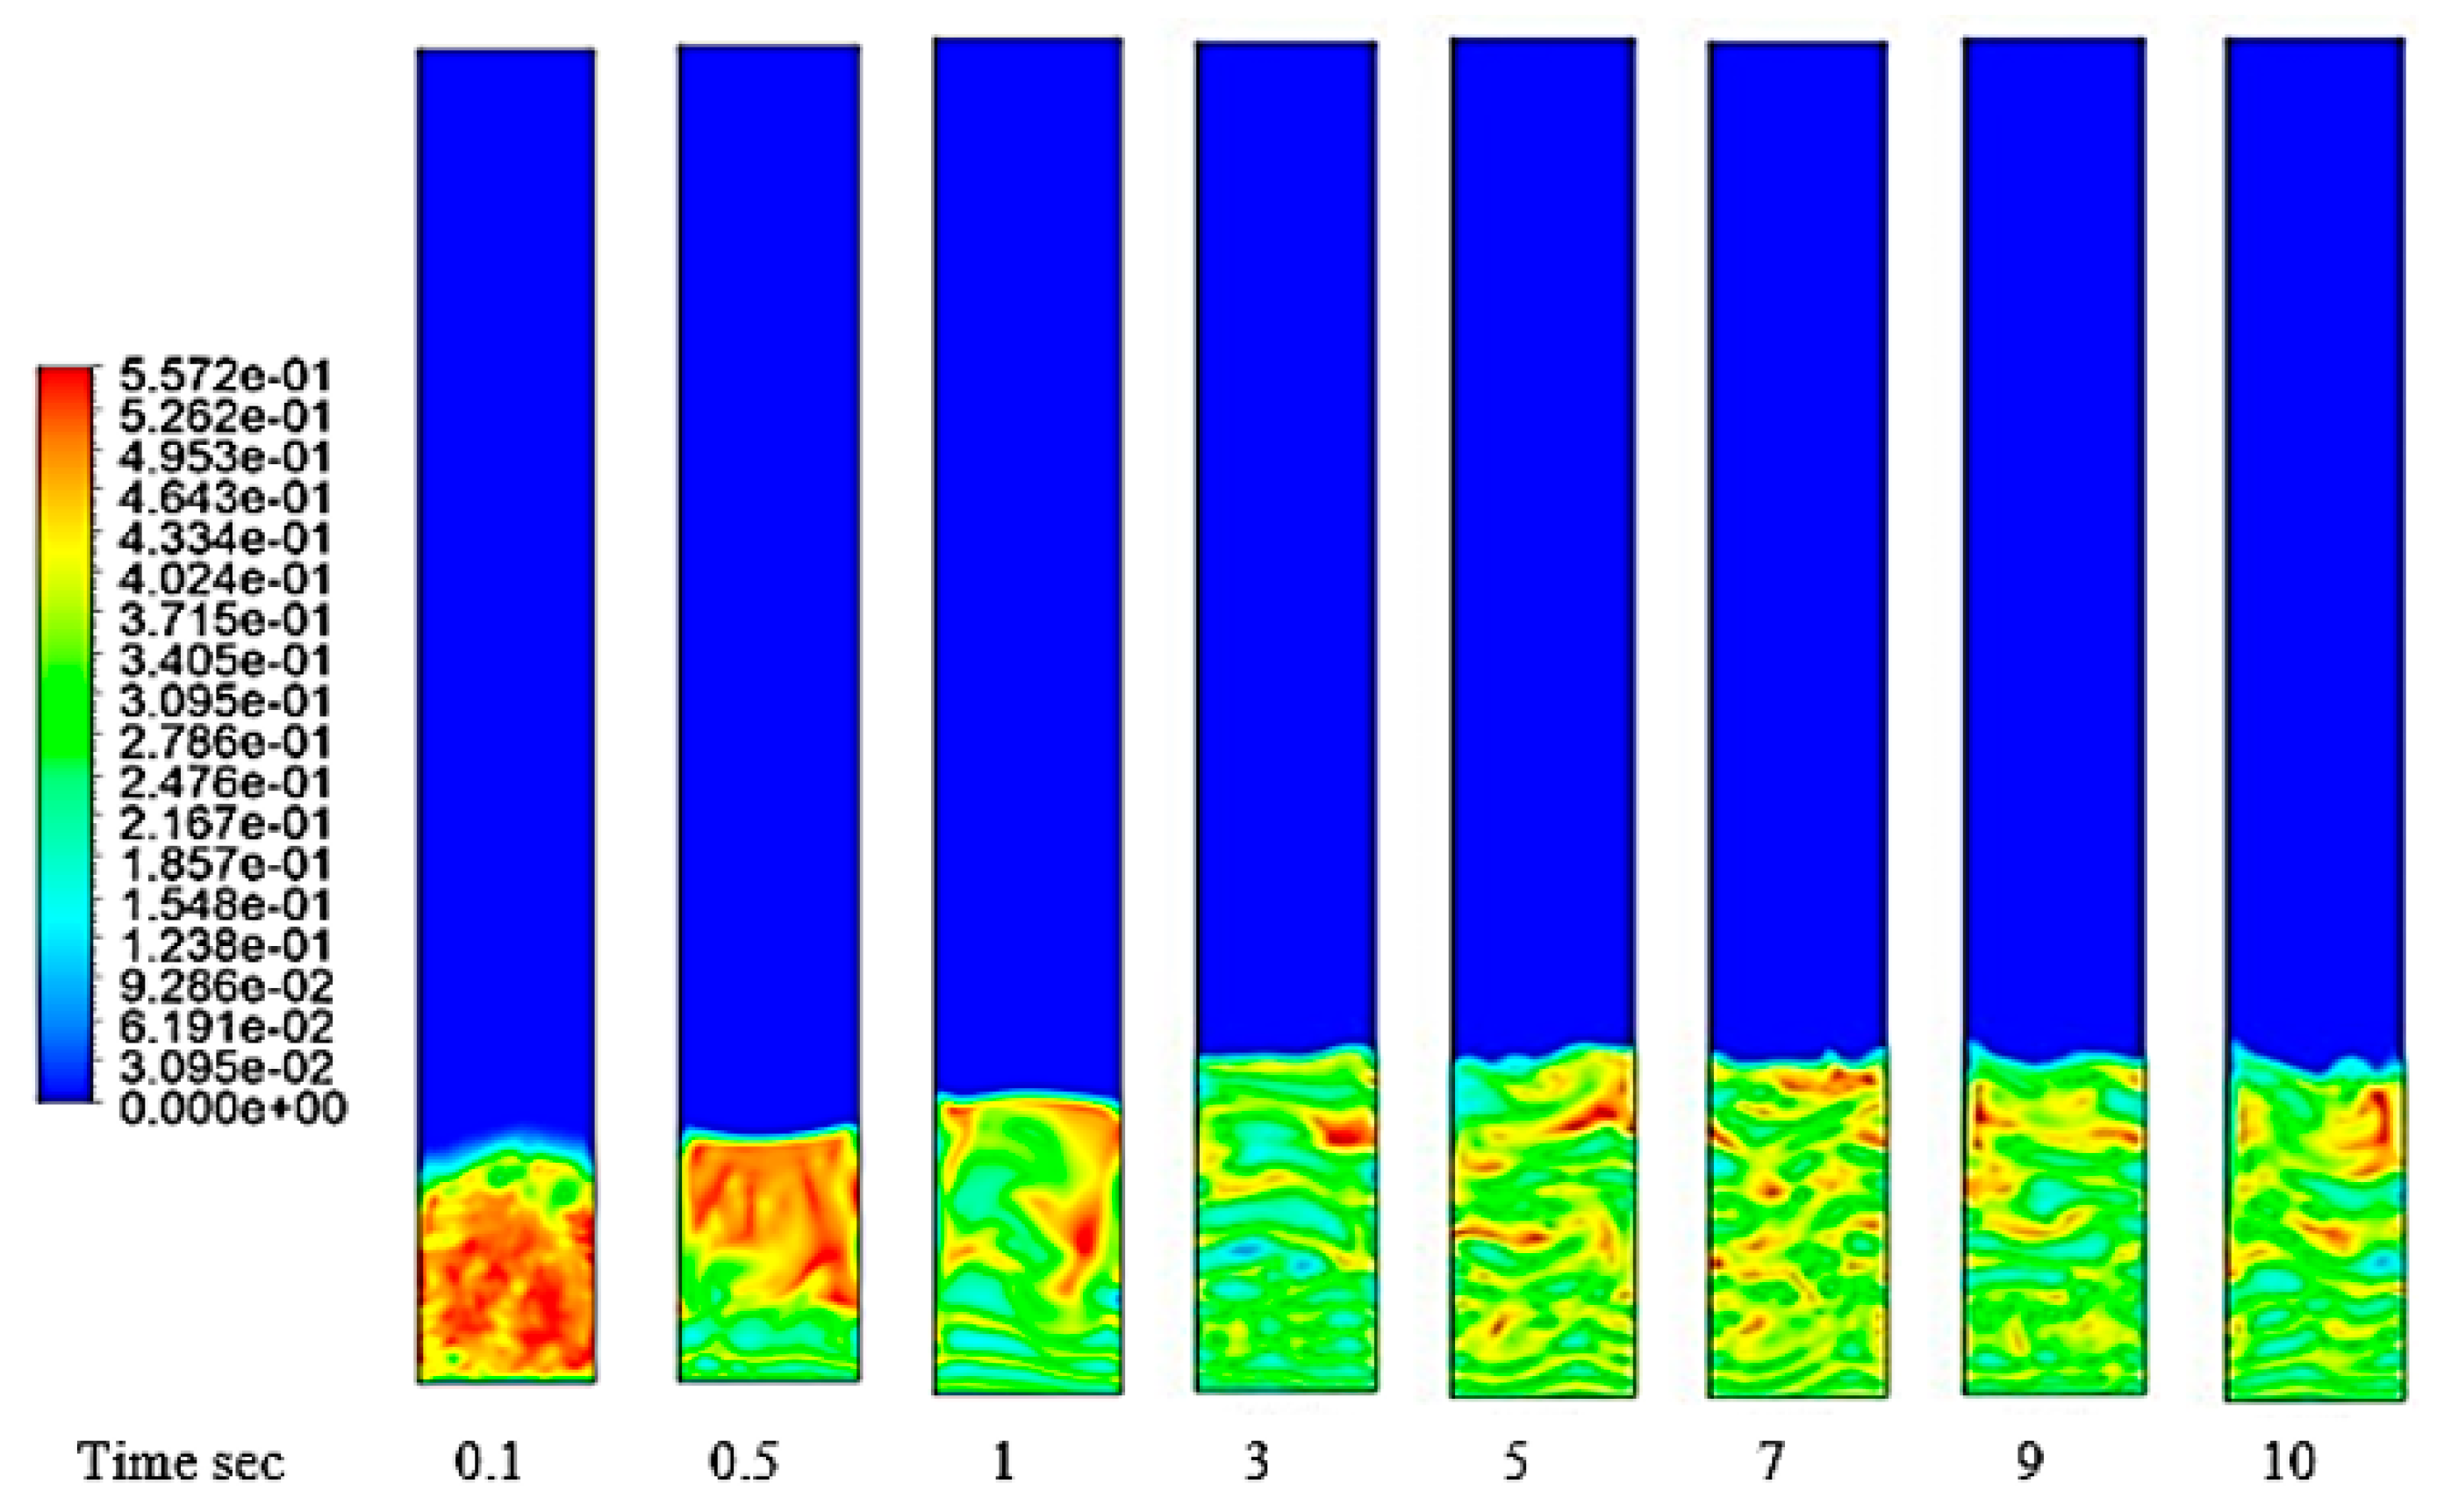
4.4.1. Particle Volume Fraction
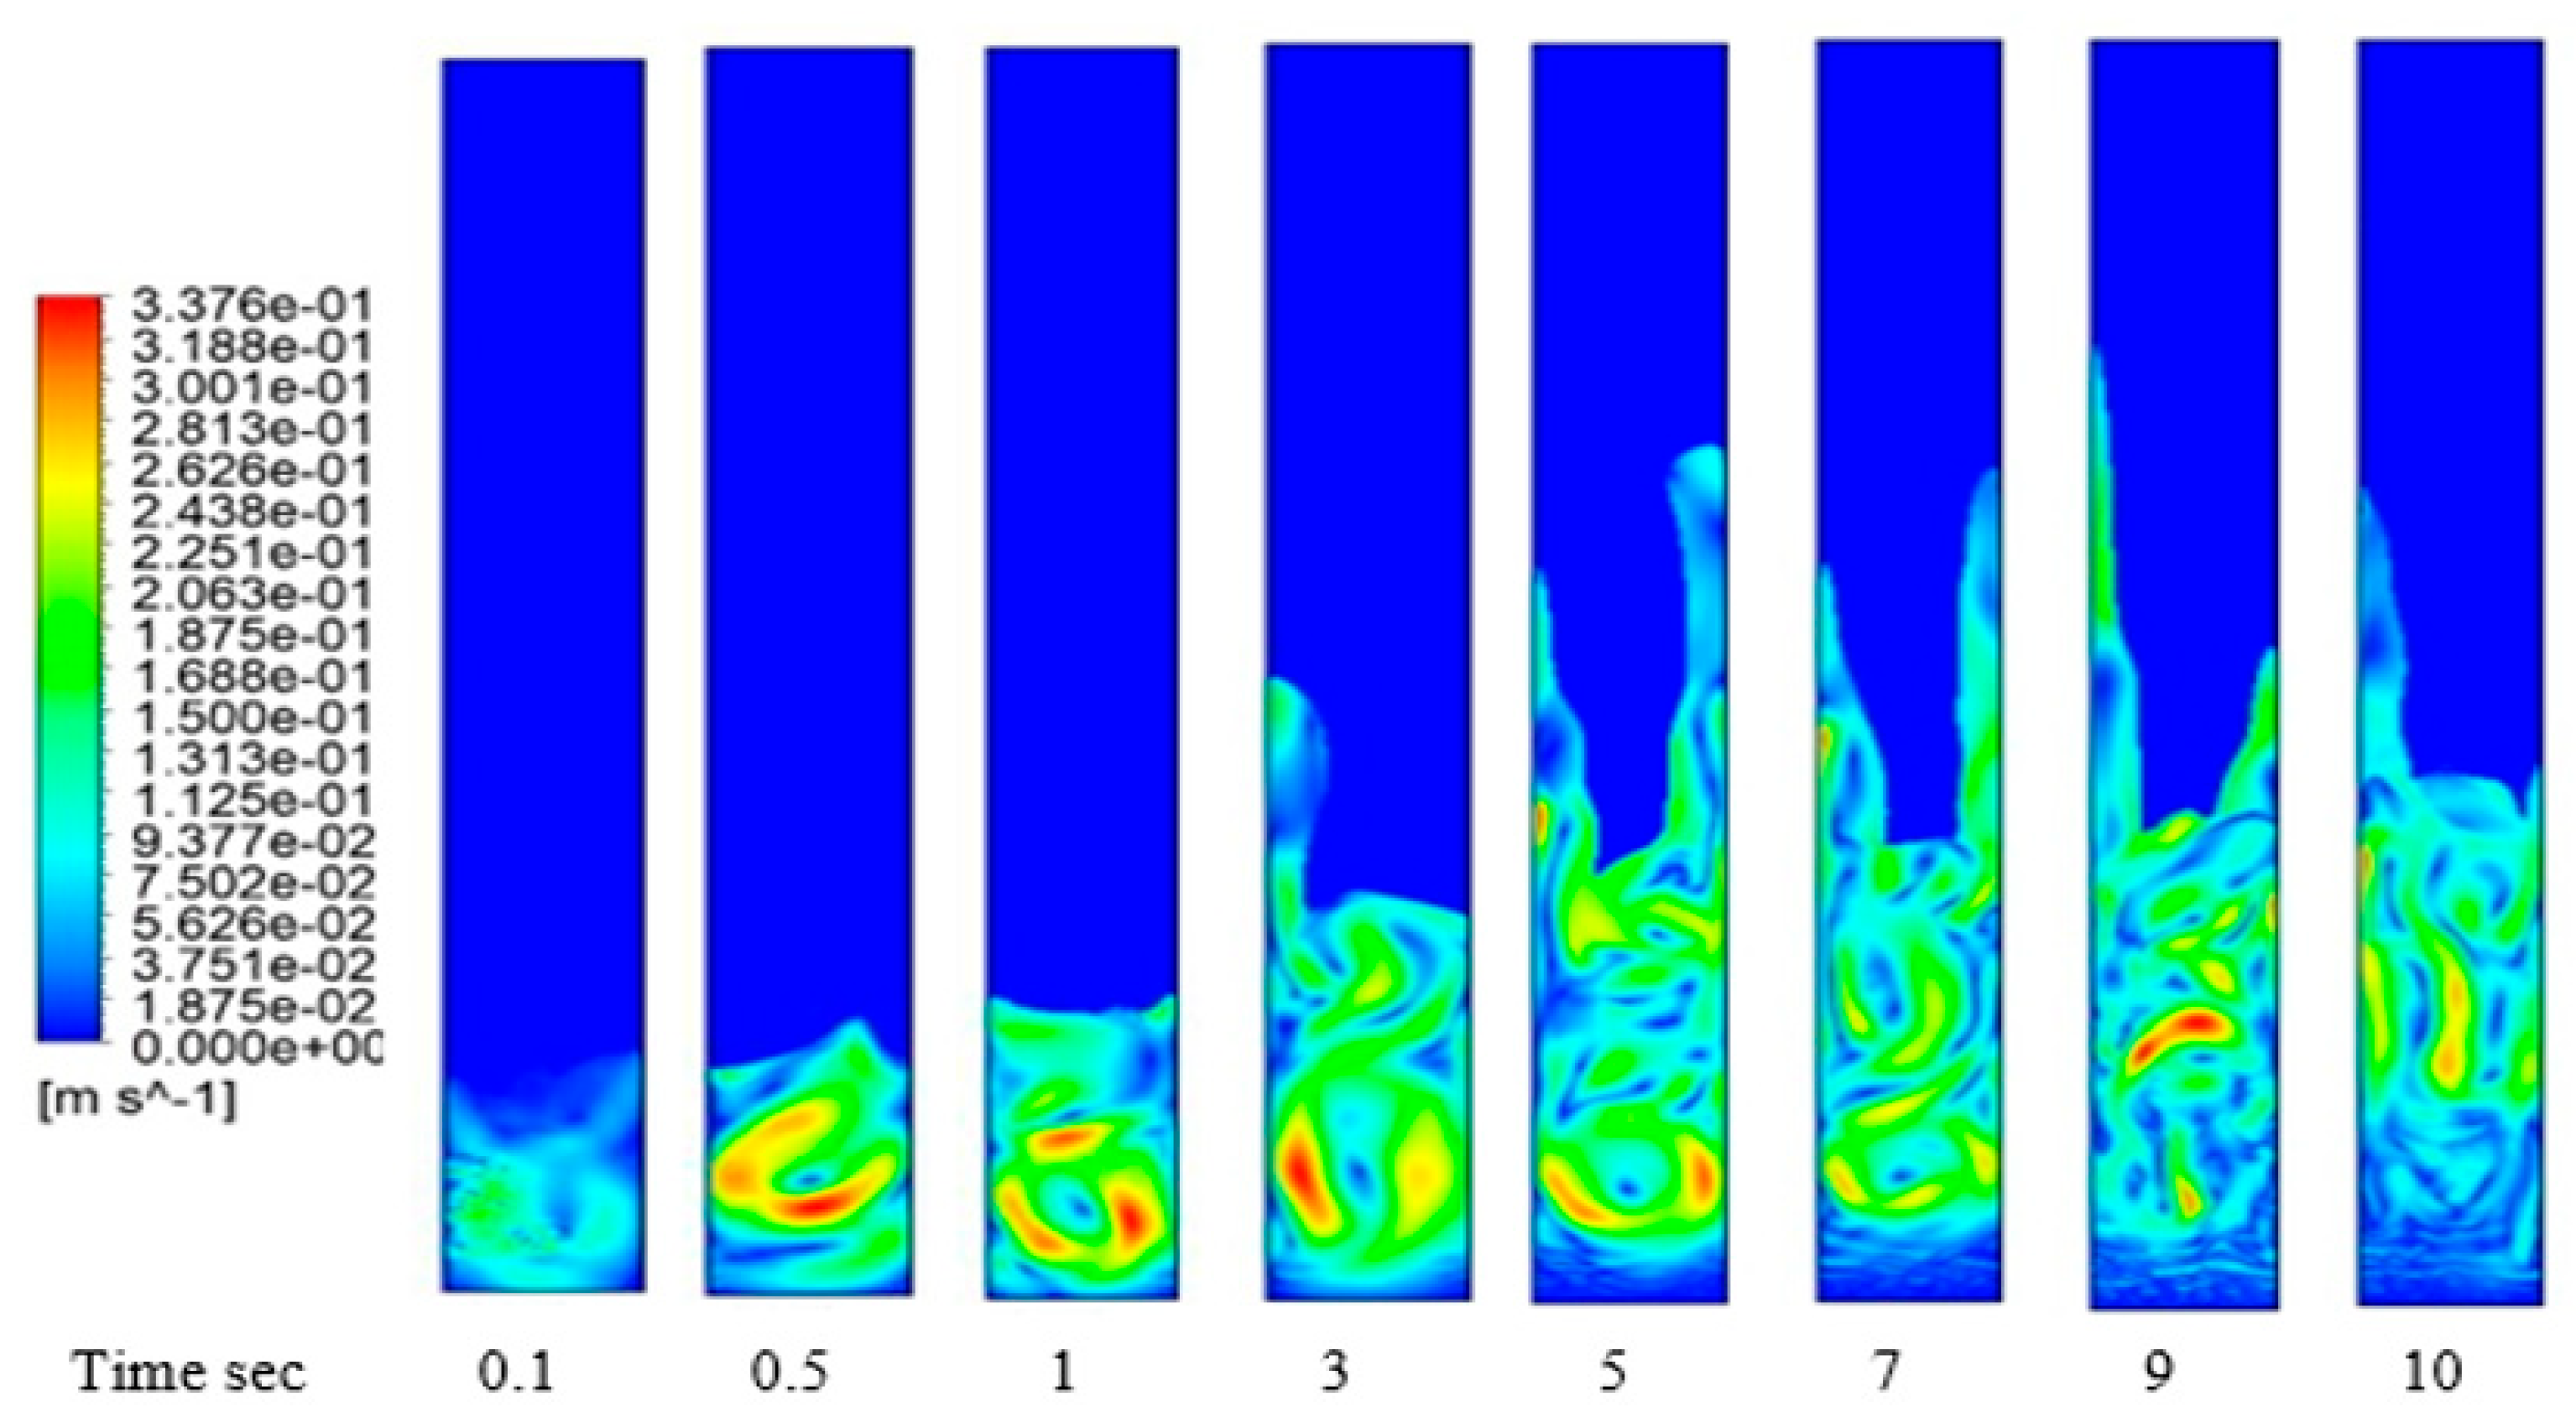
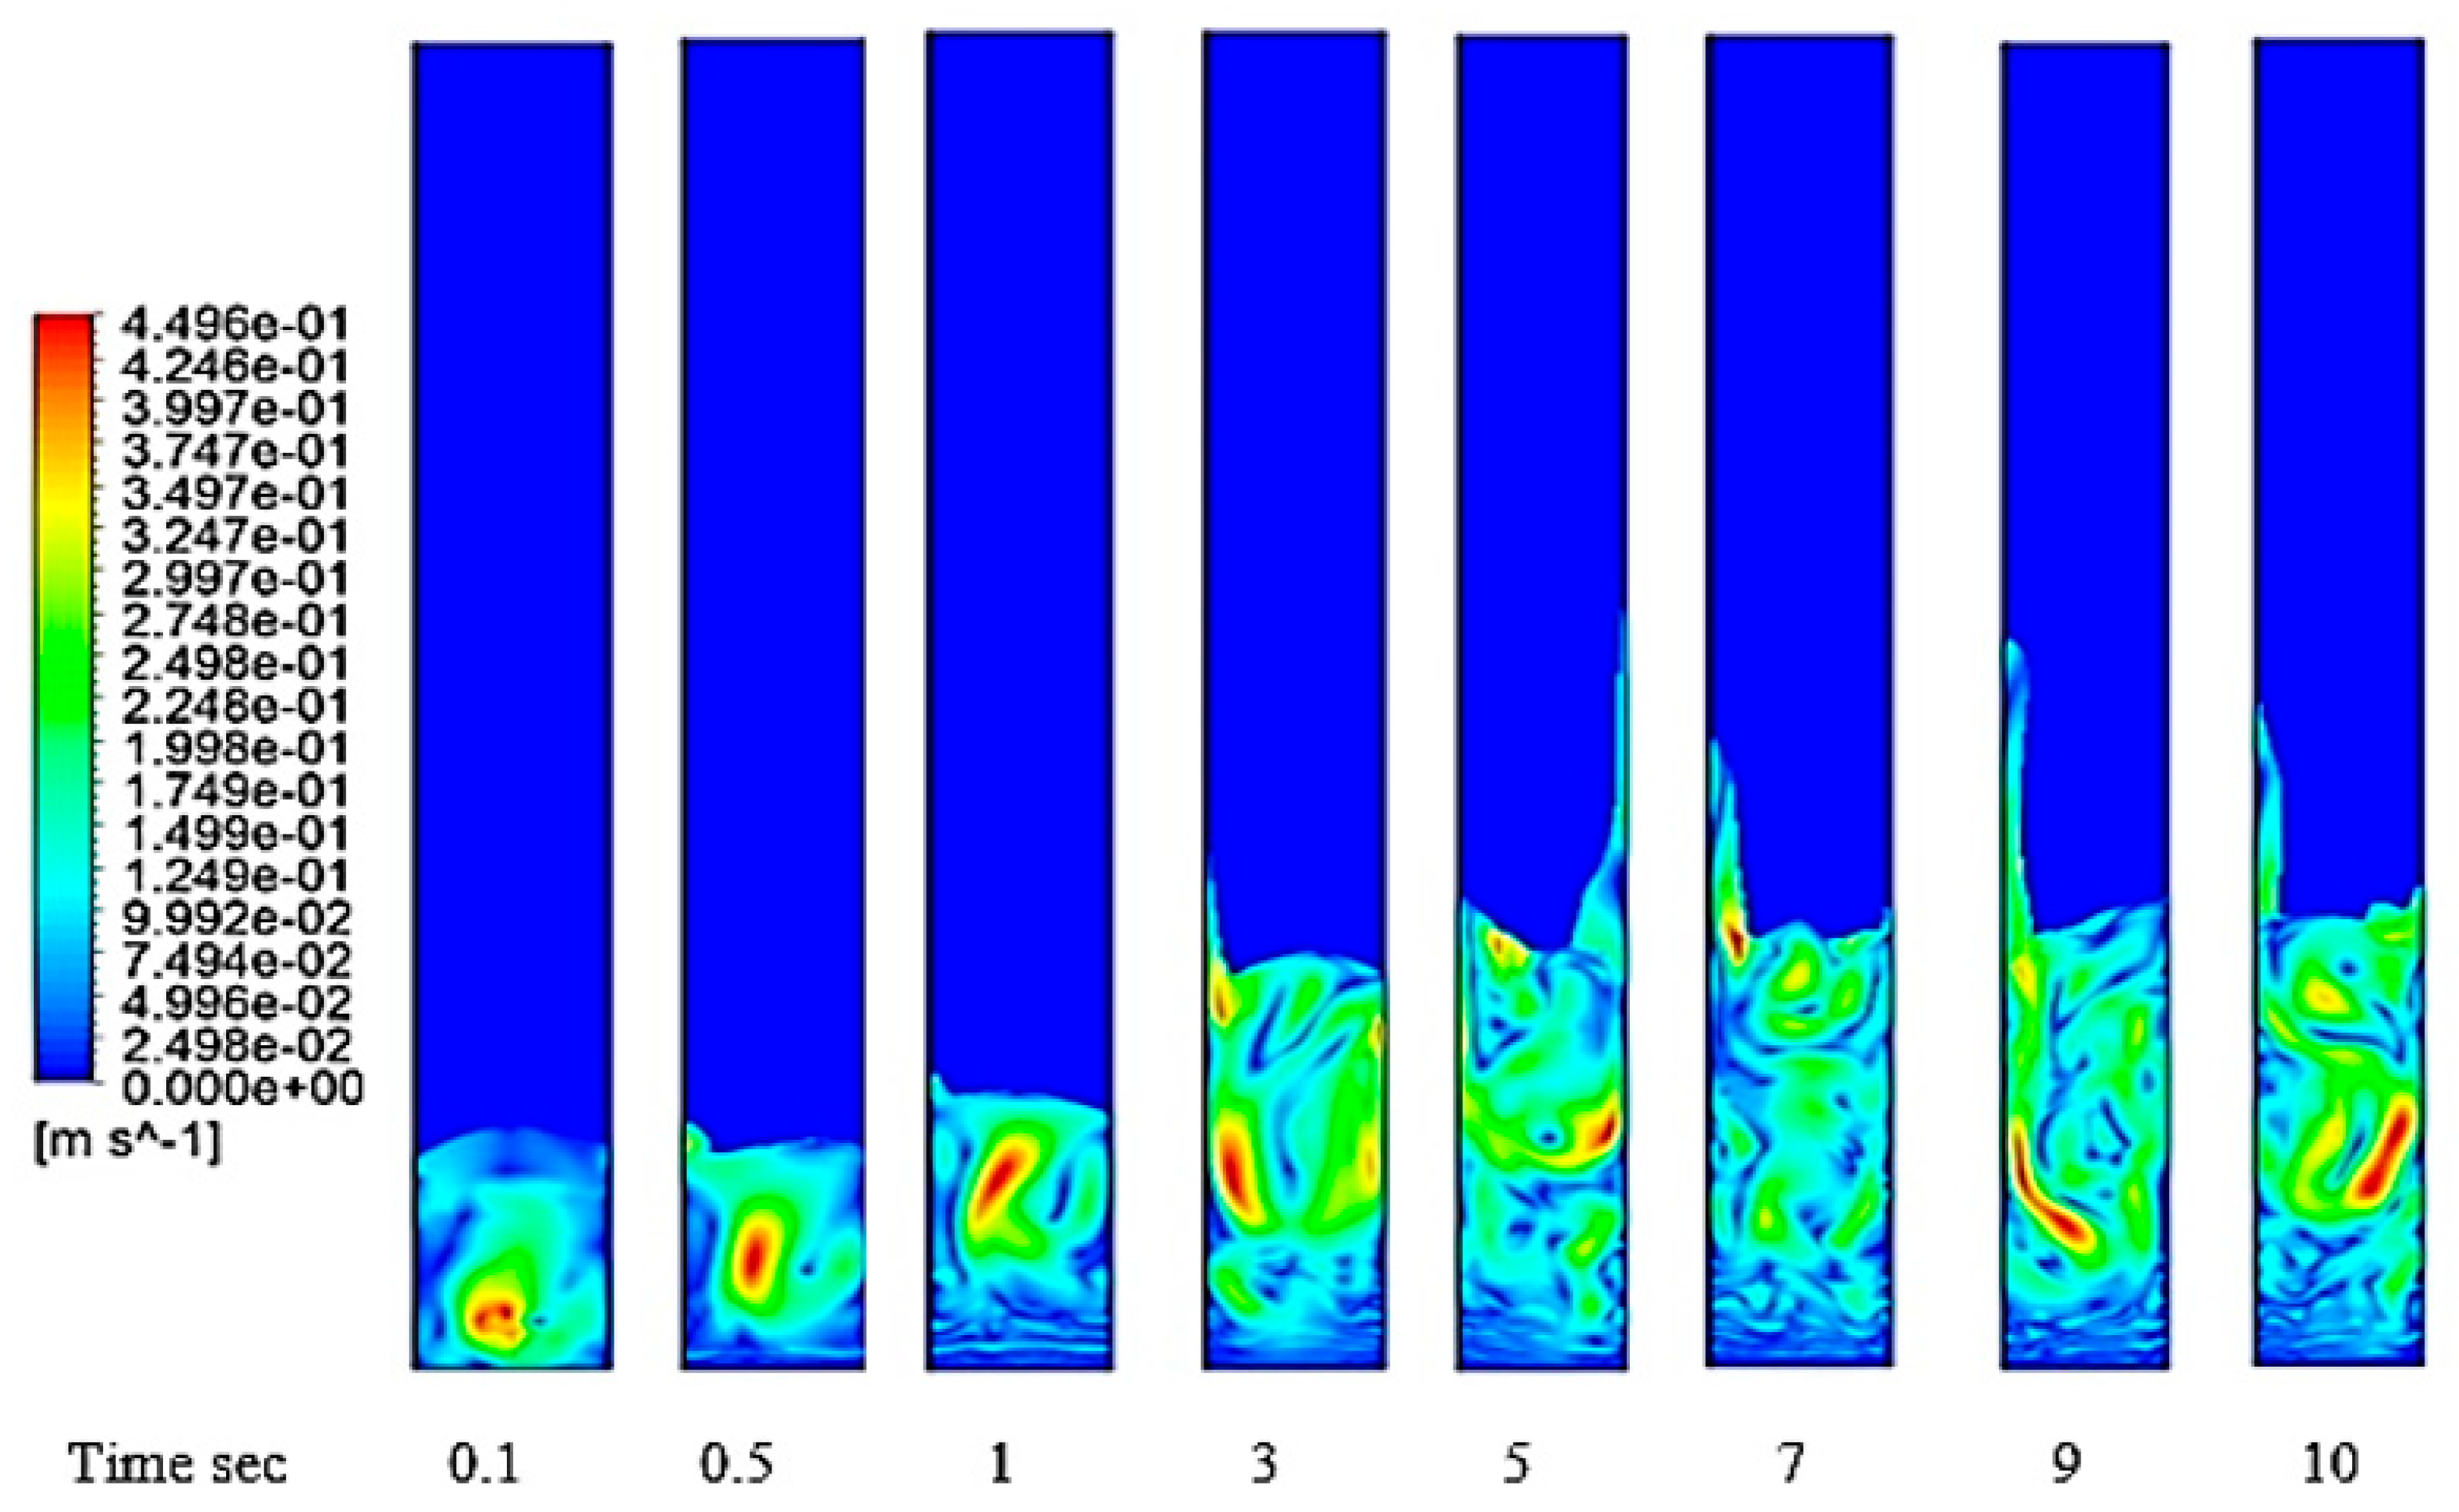
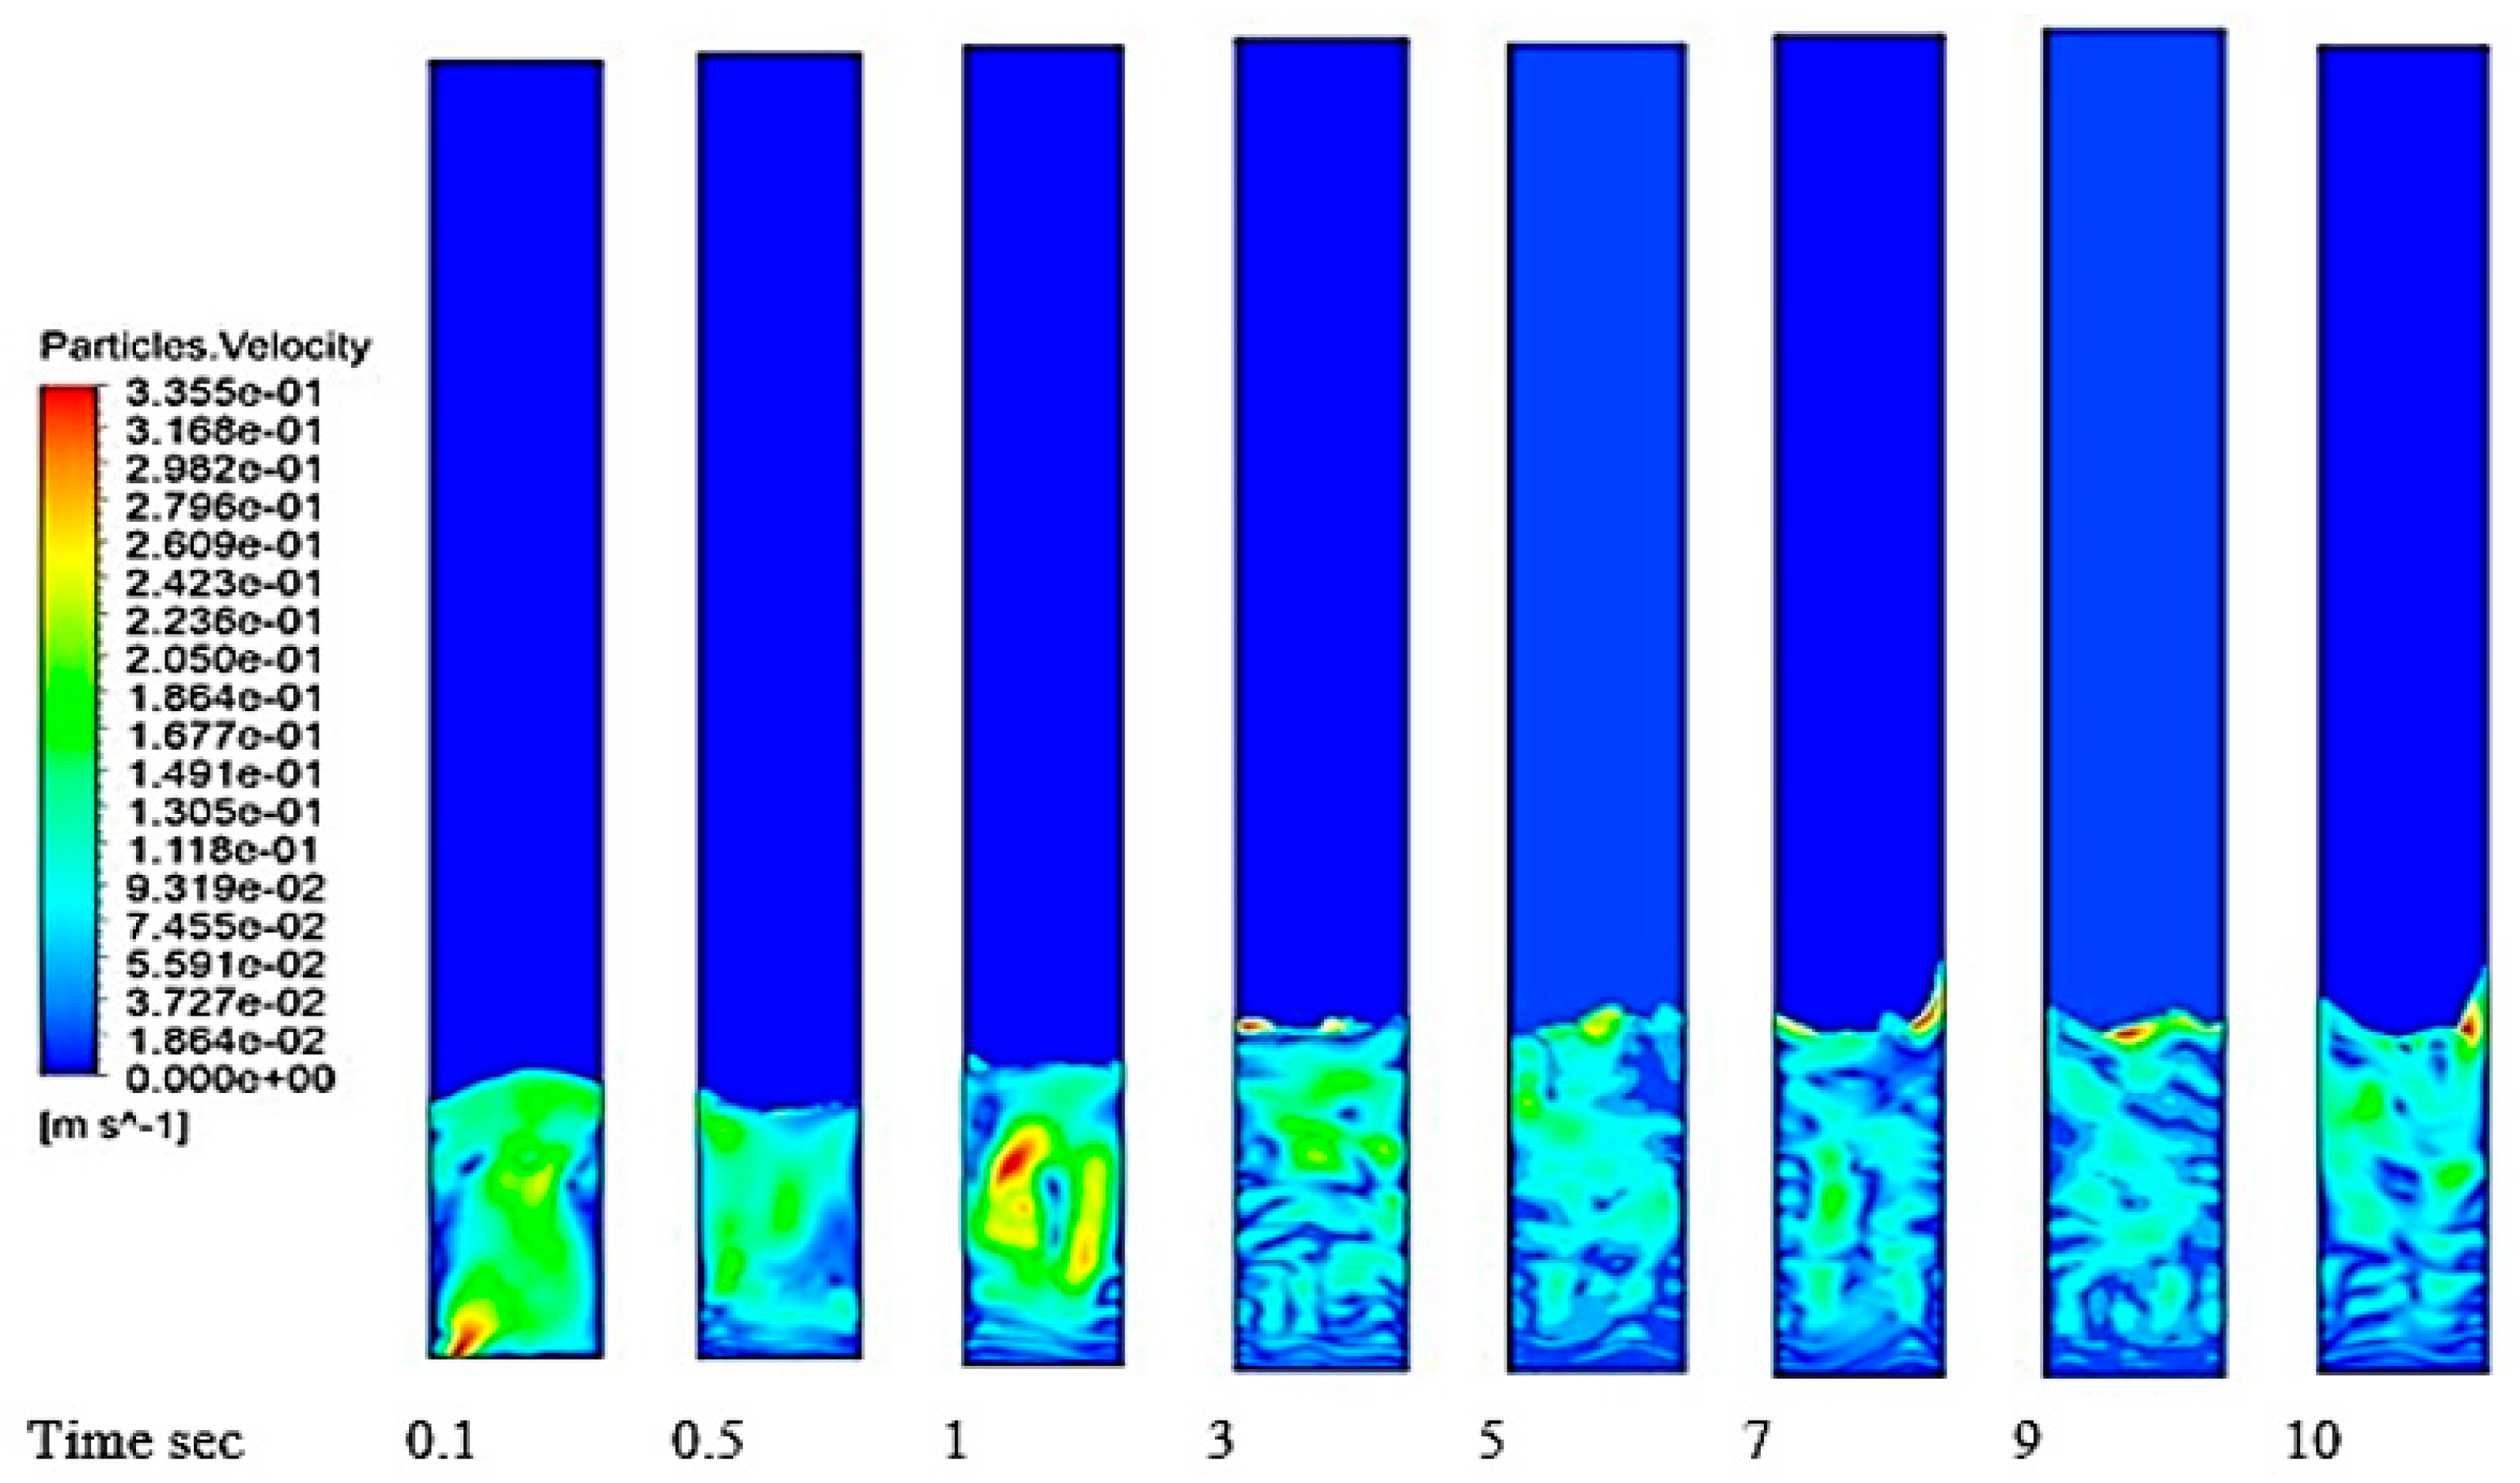
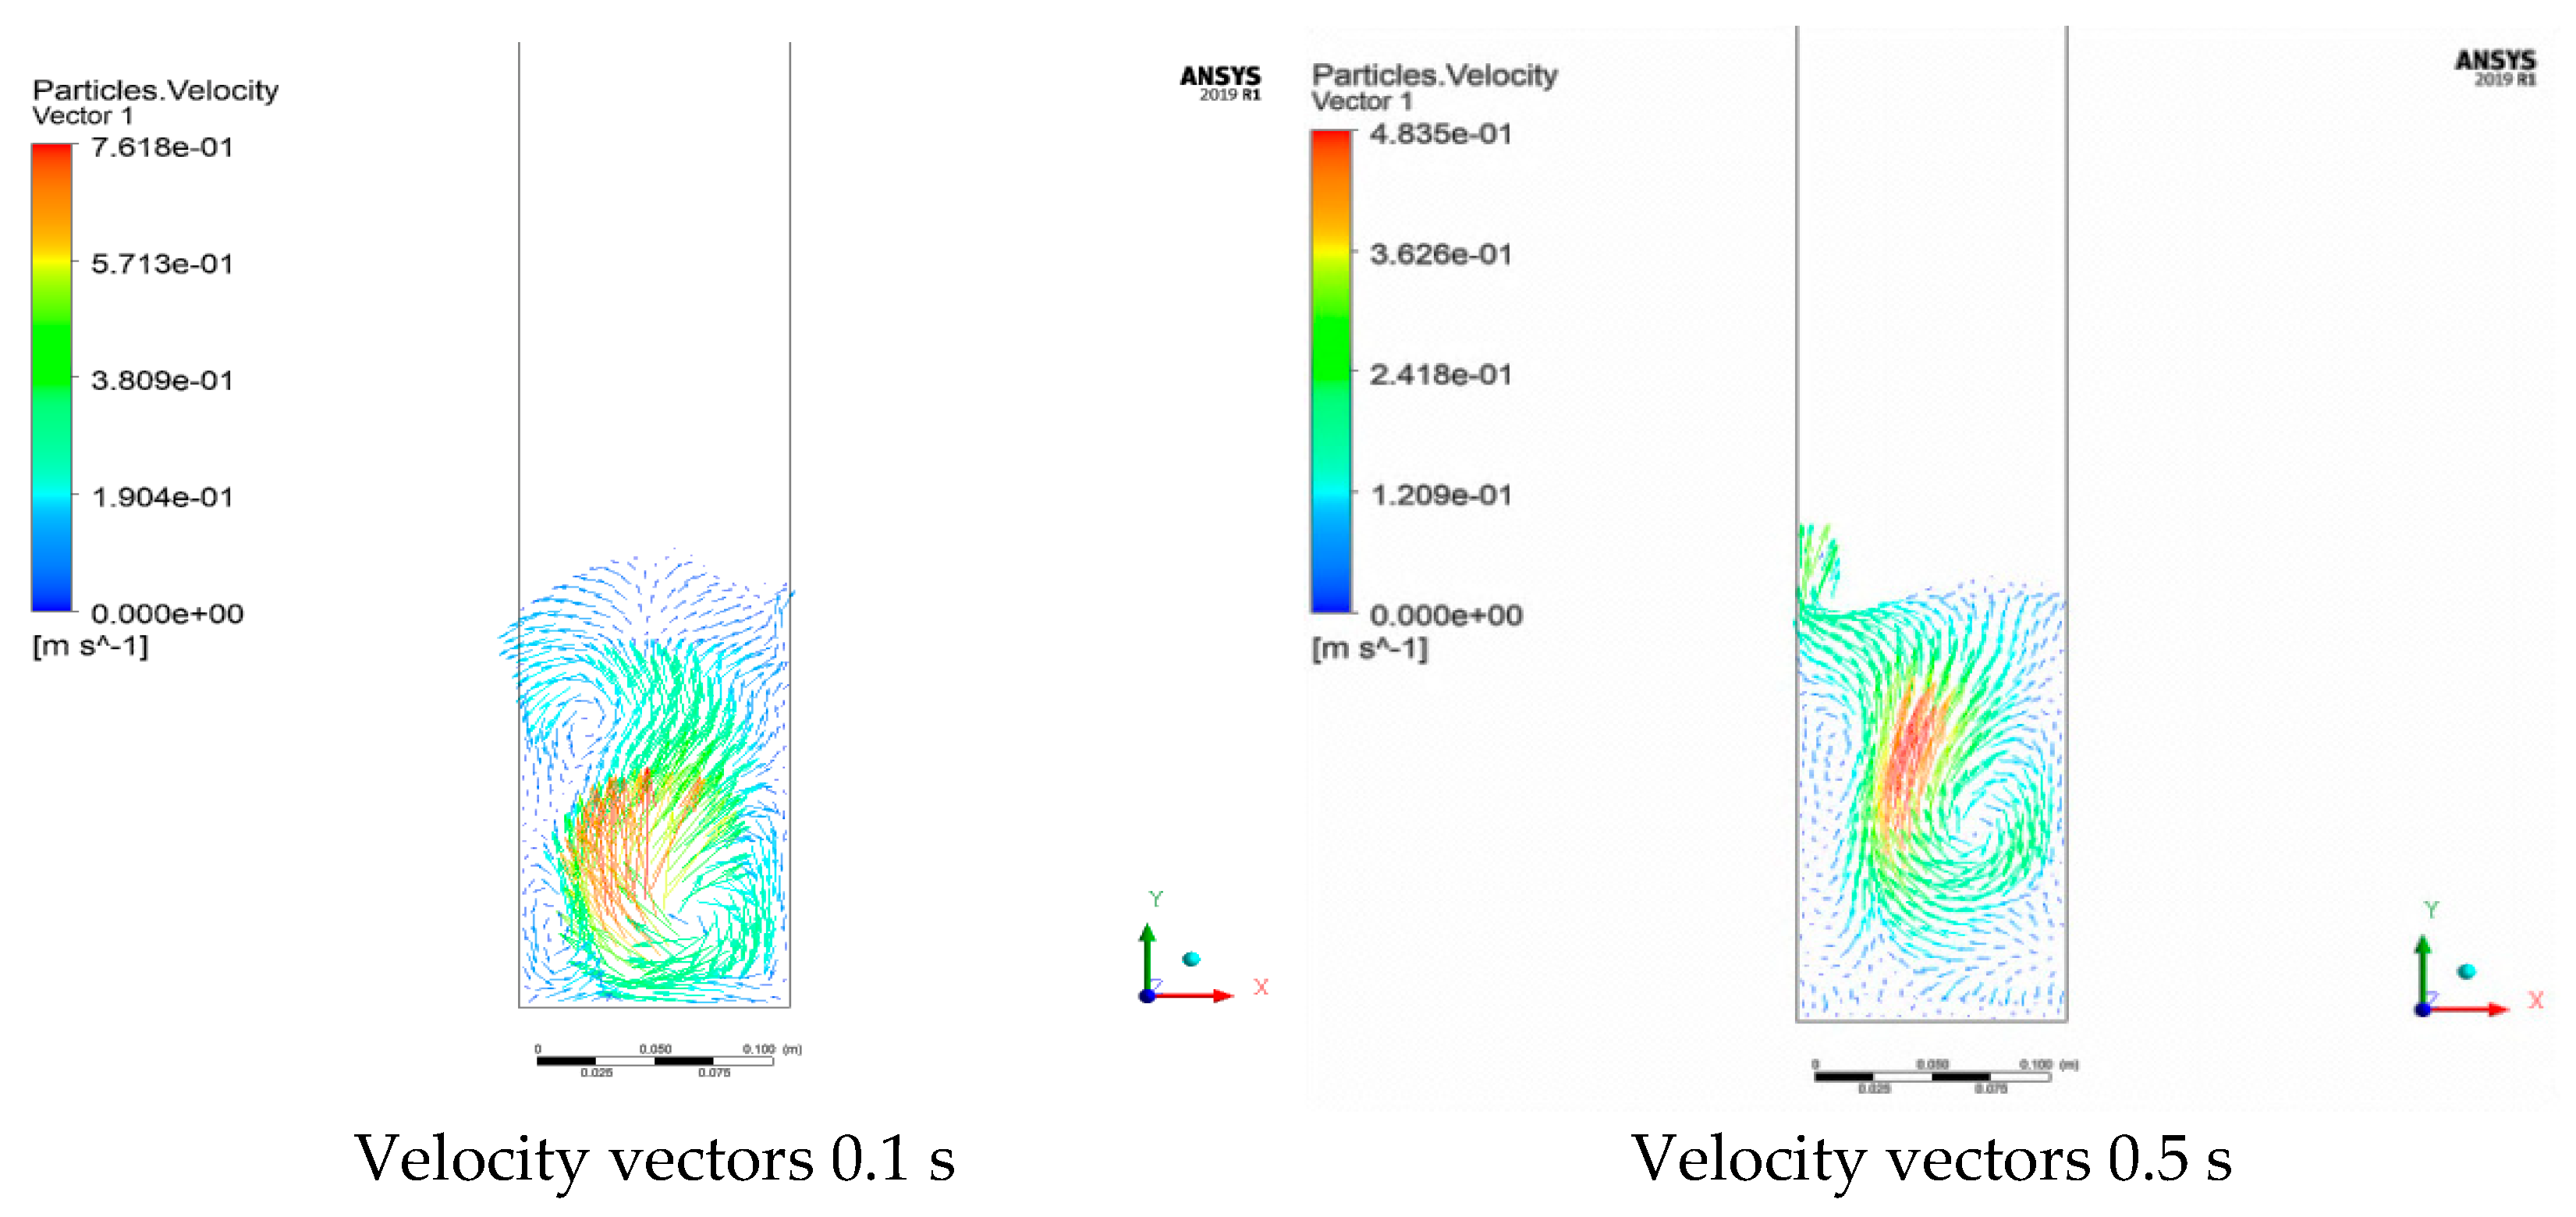
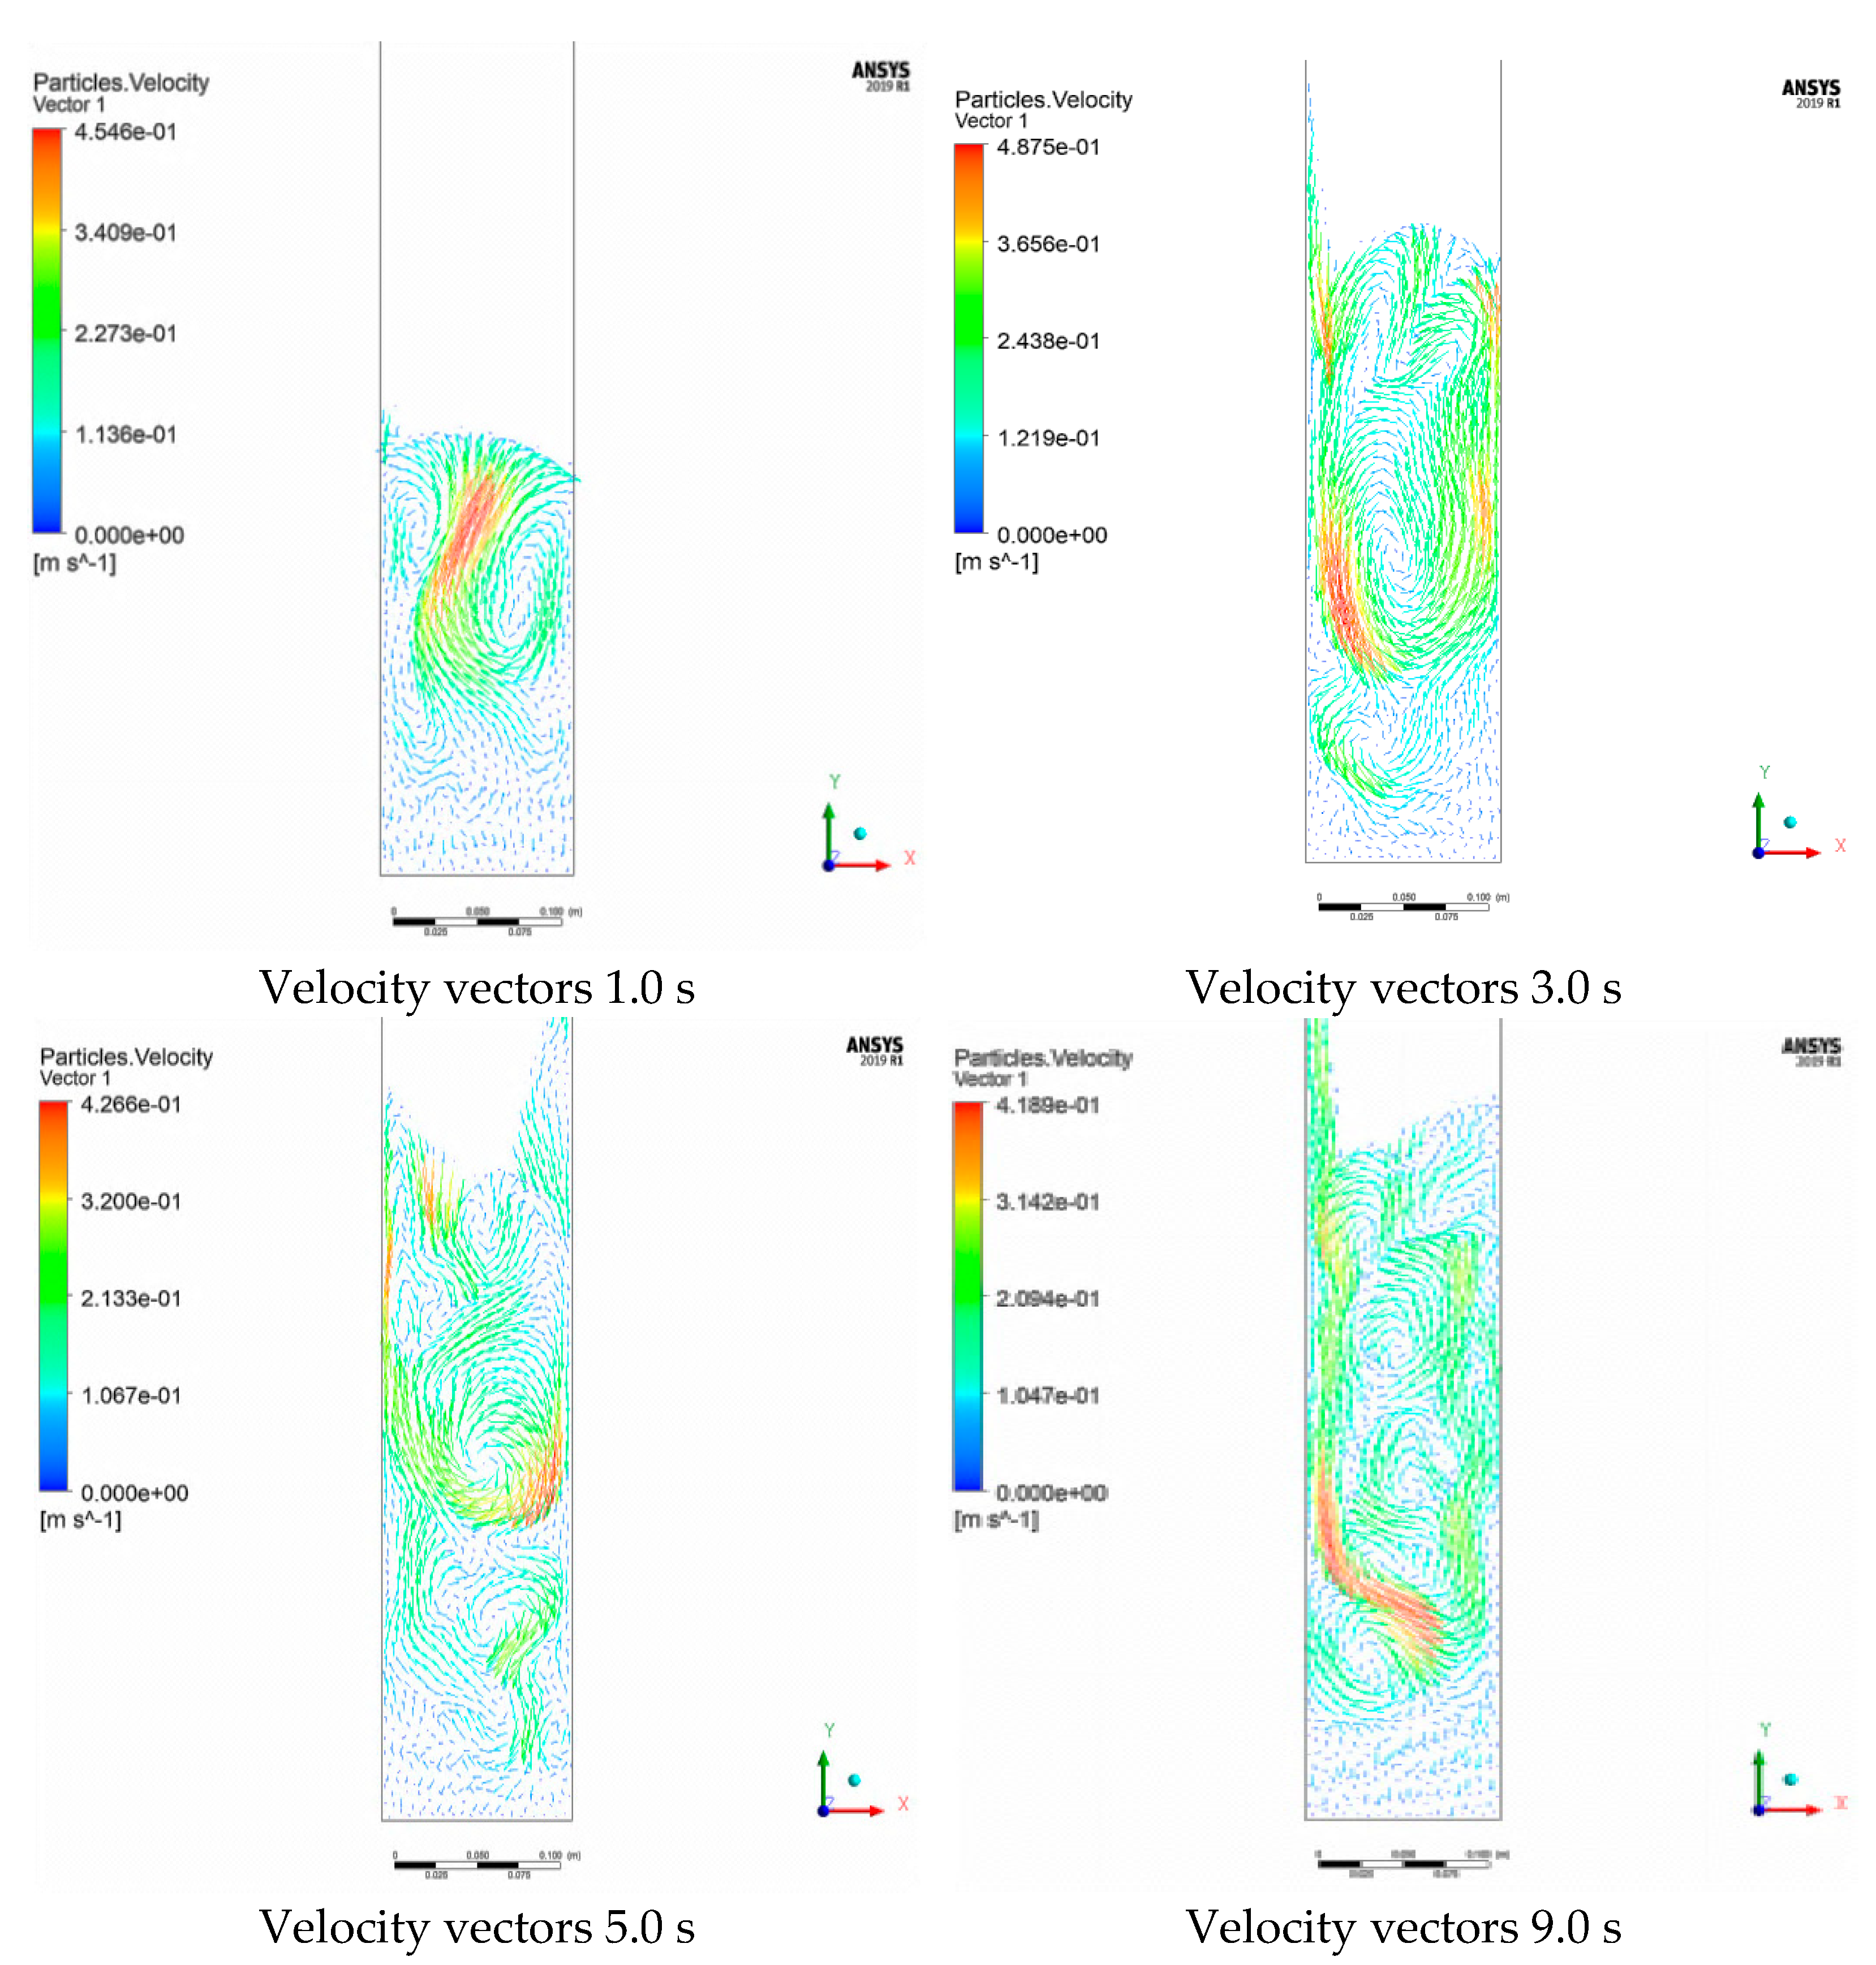
4.4.2. Particle Velocity
5. Conclusions
Author Contributions
Funding
Acknowledgments
Conflicts of Interest
Nomenclature
| Symbols Used | ||
| AC | m2 | Cross-sectional area of the column |
| CD | -- | Drag reduction |
| CFD | -- | Computational fluid dynamics |
| dp | m | Particle diameter |
| De | -- | Density number, (ρf/ρs) |
| g | m/s2 | Gravitational acceleration |
| He | m | Expanded bed height |
| Ms | kg | Mass of solid phase |
| N | -- | Richardson and Zaki exponent |
| ΔP | kpa | Pressure drop throughout the bed |
| t | s | Time |
| uL | m/s | Liquid velocity |
| umf | m/s | Minimum fluidization velocity |
| ut | m/s | Terminal velocity |
| Greek Letters | ||
| βρf | -- | Bed expansion ratio |
| ρL | kg/m3 | Density of liquid |
| ρS | kg/m3 | Density of solid |
| ε | -- | Holdup |
| εL | -- | Liquid holdup |
| εs | -- | Solid holdup |
| μL | Ns/m2 | Liquid viscosity |
| Ø | -- | Sphericity of the solid particle |
| A | -- | Volume fraction in the liquid–nanoparticles suspension |
References
- Ehsani, M.; Movahedirad, S.; Shahhosseini, S. The effect of particle properties on the heat transfer characteristics of a liquid–solid fluidized bed heat exchanger. Int. J. Therm. Sci. 2016, 102, 111–121. [Google Scholar] [CrossRef]
- Jabir Shanshool, L.S.S. Removal of Phenol Pollutants by Modification Molecular Sieves 13X. Eng. Technol. J. 2009, 27, 2853–2862. [Google Scholar]
- Tang, C.; Liu, M.; Li, Y. Experimental investigation of hydrodynamics of liquid–solid mini-fluidized beds. Particuology 2016, 27, 102–109. [Google Scholar] [CrossRef]
- Sin, E.M.L.; Lim, E.W.C. Heat transfer from immersed tubes in a pulsating fluidized bed. Powder Technol. 2018, 327, 500–511. [Google Scholar] [CrossRef]
- Piemjaiswang, R.; Charoenchaipet, J.; Saelau, T.; Piumsomboon, P.; Chalermsinsuwan, B. Effect of design parameters on system mixing for a micro fluidized bed reactor using computational fluid dynamics simulation. Braz. J. Chem. Eng. 2020, 38, 21–31. [Google Scholar] [CrossRef]
- Wang, C.; Zhu, J. Developments in the understanding of gas–solid contact efficiency in the circulating fluidized bed riser reactor: A review. Chin. J. Chem. Eng. 2016, 24, 53–62. [Google Scholar] [CrossRef]
- Esteghamatian, A.; Hammouti, A.; Lance, M.; Wachs, A. Particle resolved simulations of liquid/solid and gas/solid fluidized beds. Phys. Fluids 2017, 29, 033302. [Google Scholar] [CrossRef]
- Mandal, D. Hydrodynamics of particles in liquid–solid packed fluidized bed. Powder Technol. 2015, 276, 18–25. [Google Scholar] [CrossRef]
- Zbib, H.; Ebrahimi, M.; Ein-Mozaffari, F.; Lohi, A. Hydrodynamic Behavior of a 3-D Liquid–Solid Fluidized Bed Operating in the Intermediate Flow Regime—Application of Stability Analysis, Coupled CFD-DEM, and Tomography. Ind. Eng. Chem. Res. 2018, 57, 16944–16957. [Google Scholar] [CrossRef]
- Aghajani, M.; Müller-Steinhagen, H.; Jamialahmadi, M. New design equations for liquid/solid fluidized bed heat exchangers. Int. J. Heat Mass Transf. 2005, 48, 317–329. [Google Scholar] [CrossRef]
- Wang, C.; Li, Z.; Wei, J.; Lan, X.; Ye, M.; Gao, J. Quantitative Measurement of Solids Holdup for Group A and B Particles Using Images and Its Application in Fluidized Bed Reactors. Processes 2022, 10, 610. [Google Scholar] [CrossRef]
- Nijssen, T.; Kramer, O.; de Moel, P.; Rahman, J.; Kroon, J.; Berhanu, P.; Boek, E.; Buist, K.; van der Hoek, J.; Padding, J.; et al. Experimental and numerical insights into heterogeneous liquid-solid behaviour in drinking water softening reactors. Chem. Eng. Sci. X 2021, 11, 100100. [Google Scholar] [CrossRef]
- Peng, J.; Sun, W.; Han, H.; Xie, L. CFD Modeling and Simulation of the Hydrodynamics Characteristics of Coarse Coal Particles in a 3D Liquid-Solid Fluidized Bed. Minerals 2021, 11, 569. [Google Scholar] [CrossRef]
- Singh, R.I.; Brink, A.; Hupa, M. CFD modeling to study fluidized bed combustion and gasification. Appl. Therm. Eng. 2013, 52, 585–614. [Google Scholar] [CrossRef]
- Kaza, S.R.V.N. Effect of the Shape of the Baffles on the Hydrodynamics of a Fluidized Bed. Int. J. Chem. React. Eng. 2008, 6, 1–14. [Google Scholar] [CrossRef]
- Sippola, P.; Kolehmainen, J.; Ozel, A.; Liu, X.; Saarenrinne, P.; Sundaresan, S. Experimental and numerical study of wall layer development in a tribocharged fluidized bed. J. Fluid Mech. 2018, 849, 860–884. [Google Scholar] [CrossRef] [Green Version]
- Cornelissen, J.T.; Taghipour, F.; Escudié, R.; Ellis, N.; Grace, J.R. CFD modelling of a liquid–solid fluidized bed. Chem. Eng. Sci. 2007, 62, 6334–6348. [Google Scholar] [CrossRef]
- Rahaman, S.; Choudhury, M.R.; Ramamurthy, A.S.; Mavinic, D.S.; Ellis, N.; Taghipour, F. CFD modeling of liquid-solid fluidized beds of polydisperse struvite crystals. Int. J. Multiph. Flow 2018, 99, 48–61. [Google Scholar] [CrossRef]
- Xu, Y.; Musser, J.; Li, T.; Gopalan, B.; Panday, R.; Tucker, J.; Breault, G.; Clarke, M.A.; Rogers, W.A. Numerical Simulation and Experimental Study of the Gas–Solid Flow Behavior Inside a Full-Loop Circulating Fluidized Bed: Evaluation of Different Drag Models. Ind. Eng. Chem. Res. 2018, 57, 740–750. [Google Scholar] [CrossRef]
- Sahoo, L.K.; Sarkar, S. Experimental Study of Bubble Behavior in a Two-Dimensional Gas–Solid Tapered Fluidized Bed. Ind. Eng. Chem. Res. 2021, 60, 12740–12751. [Google Scholar] [CrossRef]
- Bello, Y.H.; Ahmed, M.A.; Ookawara, S.; Elwardany, A.E. Numerical and experimental investigation on air distributor design of fluidized bed reactor of sawdust pyrolysis. Energy 2021, 239, 122179. [Google Scholar] [CrossRef]
- Chladek, J.; Jayarathna, C.K.; Moldestad, B.M.; Tokheim, L.-A. Fluidized bed classification of particles of different size and density. Chem. Eng. Sci. 2018, 177, 151–162. [Google Scholar] [CrossRef]
- Di Felice, R. Hydrodynamics of liquid fluidisation. Chem. Eng. Sci. 1995, 50, 1213–1245. [Google Scholar] [CrossRef]
- Singh, P.; Mahanta, P.; Kalita, P. Numerical study on the gas-solid hydrodynamics and heat transfer in a rotating fluidized bed with static geometry dryer. Int. J. Heat Mass Transf. 2020, 153, 119666. [Google Scholar] [CrossRef]
- Wang, L.; Wei, G.; Jiang, J.; Duan, S.; Xu, L.; Yuan, W.; Hou, Q. Experimental and Numerical Investigation of Particle Flow and Mixing Characteristics in an Internally Circulating Fluidized Bed. J. Chem. Eng. Jpn. 2019, 52, 89–98. [Google Scholar] [CrossRef] [Green Version]
- DSouza, G.C. CFD Simulations of Bubble Column Equipped with Bundles of Concentric Tubes. Master’s Thesis, The University of Western Ontario, London, ON, Canada, 2020. [Google Scholar]
- Jasim, M.M.; Mohammed, T.J.; Sabri, L.S. Air-lift Reactor’s Characterization via Computational Fluid Dynamic (CFD): Review. Eng. Technol. J. 2022, 40, 484–497. [Google Scholar] [CrossRef]
- Chung, T.J. Computational Fluid Dynamics. Br. J. Radiol. 2009, 82. [Google Scholar] [CrossRef] [Green Version]
- Bird, R.B.; Stewart, W.E.; Lightfoot, E.N. Transport Phenomena; John Wiley and Sons, Inc.: New York, NY, USA, 2002. [Google Scholar] [CrossRef]
- Limtrakul, S.; Boonsrirat, A.; Vatanatham, T. DEM modeling and simulation of a catalytic gas–solid fluidized bed reactor: A spouted bed as a case study. Chem. Eng. Sci. 2004, 59, 5225–5231. [Google Scholar] [CrossRef]
- Zhu, H.P.; Zhou, Z.Y.; Yang, R.Y.; Yu, A.B. Discrete particle simulation of particulate systems: Theoretical developments. Chem. Eng. Sci. 2007, 62, 3378–3396. [Google Scholar] [CrossRef]
- Couderc, J.P. Incipient Fluidization and Particulate Systems. Fluidization, 2nd ed.; Academic Press: New York, NY, USA, 1985; pp. 1–44. [Google Scholar]
- Lundberg, J.; Halvorsen, B.M. A review of some exsisting drag models describing the interaction between phases in a bubbling fluidized bed. In Proceedings of the 49th Scandinavian Conference on Simulation and Modeling, Oslo, Norway, 7–8 October 2008. [Google Scholar]
- Syamlal, M.; O’Brien, T.J. Computer simulation of bubbles in a fluidized bed. AIChE Symp. Ser. 1989, 85, 22–31. [Google Scholar] [CrossRef]
- Jasim, A.A.; Sultan, A.J.; Al-Dahhan, M.H. Impact of heat exchanging internals configurations on the gas holdup and bubble properties in a bubble column. Int. J. Multiph. Flow 2019, 112, 63–82. [Google Scholar] [CrossRef]
- Li, T.; Grace, J.; Shadle, L.; Guenther, C. On the superficial gas velocity in deep gas–solids fluidized beds. Chem. Eng. Sci. 2011, 66, 5735–5738. [Google Scholar] [CrossRef]
- Pare, A. Hydrodynamics of Three Phase Fluidized Bed Using Low Density Particles; Department of Chemical Engineering National Institute of Technology: Rourkela, India, 2013. [Google Scholar]
- Irani, M.; Boozarjomehry, R.B.; Pishvaie, S.M.R.; Tavasoli, A. Investigating the effects of mass transfer and mixture non-ideality on multiphase flow hydrodynamics using CFD methods. Iran. J. Chem. Chem. Eng. 2010, 29, 51–60. [Google Scholar]
- Sabri, L.S.; Sultan, A.J.; Al-Dahhan, M.H. Investigating the cross-sectional gas holdup distribution in a split internal-loop photobioreactor during microalgae culturing using a sophisticated computed tomography (CT) technique. Chem. Eng. Res. Des. 2019, 149, 13–33. [Google Scholar] [CrossRef]
- Zhang, H.; Sun, Z.; Zhang, M.; Shao, Y.; Zhu, J. Comparison of the flow structures and regime transitions between a cylindrical fluidized bed and a square fluidized bed. Powder Technol. 2020, 376, 507–516. [Google Scholar] [CrossRef]
- Sabri, L.S.; Sultan, A.J.; Majdi, H.S.; Jebur, S.K.; Al-Dahhan, M.H. A Detailed Hydrodynamic Study of the Split-Plate Airlift Reactor by Using Non-Invasive Gamma-Ray Techniques. ChemEngineering 2022, 6, 18. [Google Scholar] [CrossRef]
- Sabri, L.S.; Sultan, A.J.; Al-Dahhan, M.H. Split internal-loop photobioreactor for Scenedesmus sp. microalgae: Culturing and hydrodynamics. Chin. J. Chem. Eng. 2021, 33, 236–248. [Google Scholar] [CrossRef]
- Sabri, L.S.; Ojha, A.; Sultan, A.J.; Al-Dahhan, M.H. Integration of dynamic growth modeling and hydrodynamics in an internal-loop split photobioreactor. J. Chem. Technol. Biotechnol. 2022, 97, 1112–1127. [Google Scholar] [CrossRef]
- Ojah, A.; Sabri, L.S.; Aldahhan, M.H. Local volumetric mass transfer coefficient estimation for Scenedesmus microalgae culture in a cylindrical airlift photobioreactor. J. Chem. Technol. Biotechnol. 2021, 96, 764–774. [Google Scholar] [CrossRef]
- Pjontek, D.; Macchi, A. Hydrodynamic comparison of spherical and cylindrical particles in a gas–liquid–solid fluidized bed at elevated pressure and high gas holdup conditions. Powder Technol. 2014, 253, 657–676. [Google Scholar] [CrossRef]
- Jin, H.; Lim, D.; Lim, H.; Kang, Y.; Jun, K.-W. Heat Transfer in a Liquid-Solid Circulating Fluidized Bed Reactor with Low Surface Tension Media. Chin. J. Chem. Eng. 2013, 21, 844–849. [Google Scholar] [CrossRef]
- Taofeeq, H.; Al-Dahhan, M. Heat transfer and hydrodynamics in a gas-solid fluidized bed with vertical immersed internals. Int. J. Heat Mass Transf. 2018, 122, 229–251. [Google Scholar] [CrossRef]
- Chalermsinsuwan, B.; Samruamphianskun, T.; Piumsomboon, P. Effect of operating parameters inside circulating fluidized bed reactor riser with ring baffles using CFD simulation and experimental design analysis. Chem. Eng. Res. Des. 2014, 92, 2479–2492. [Google Scholar] [CrossRef]
- Yang, S.; Wan, Z.; Wang, S.; Wang, H. Computational fluid study of radial and axial segregation characteristics in a dual fluidized bed reactor system. Energy 2020, 209, 118359. [Google Scholar] [CrossRef]
- Shi, W.; Yang, X.; Sommerfeld, M.; Yang, J.; Cai, X.; Li, G.; Zong, Y. Modelling of mass transfer for gas-liquid two-phase flow in bubble column reactor with a bubble breakage model considering bubble-induced turbulence. Chem. Eng. J. 2019, 371, 470–485. [Google Scholar] [CrossRef]


| Authors | Year | System | Solid Material | Measuring System | Key Findings | |
|---|---|---|---|---|---|---|
| 1 | Jack T. Cornelissen, et al. [17] | 2007 | Liquid–Solid | Glass beads | Liquid–solid fluidization system | A liquid–solid fluidized bed is simulated using a multifluid Eulerian computational fluid dynamics (CFD) model with granular flow extension. |
| 2 | Md. Saifur Rahaman, et al. [18] | 2017 | Liquid–Solid | Polydisperse struvite crystals | A fluidized bed, built of Plexiglas with diameter 100 mm and height 1392 mm | The simulated bed expansion behavior of struvite crystals of various sizes was found to be consistent with experimental results. The six different size groups of struvite investigated in this study were found to be classified according to their sizes at steady state, with limited intermixing between successive layers. |
| 3 | Yupeng Xua, et al. [19] | 2017 | Gas–Solid | polyethylene (HDPE) particles | A small-scale full-loop circulating fluidized bed (CFB) | The effect of different drag laws used in CFD simulations is considered in this work through a detailed and direct comparison with experimental data from a small-scale, full-loop circulating fluidized bed. |
| 4 | Lipak Kumar Sahoo, et al. [20] | 2021 | Gas–Solid | Silica-gel beads | A two-dimensional gas–solid tapered fluidized bed | Using an image analysis method, the hydrodynamic behavior of tapered beds was investigated experimentally. The overlapping of binary images was used to quantify the peripheral unfluidized region. |
| 5 | Yusuf H. Bello, et al. [21] | 2021 | Gas–Solid | Silica sand | In a lab-scale fluidized bed reactor (FBR) | The size and number of air distributor orifices in a lab-scale fluidized bed reactor (FBR) are applied to enhance biomass conversion. |
| Materials | dp (m) | ρS (kg/m3) | Initial Static Bed Height (m) |
|---|---|---|---|
| Properties of bed materials | |||
| Glass beads | 0.003 | 2500 | 0.12 |
| Glass beads | 0.004 | 2500 | 0.121 |
| Glass beads | 0.006 | 2500 | 0.126 |
| Properties of medium fluidizing | |||
| Materials | µL (pa s) | ρS (kg/m3) | Superficial velocity (m/s) |
| Water at 30 °C | 0.000891 | 997.15 | 0.0–0.1 |
Publisher’s Note: MDPI stays neutral with regard to jurisdictional claims in published maps and institutional affiliations. |
© 2022 by the authors. Licensee MDPI, Basel, Switzerland. This article is an open access article distributed under the terms and conditions of the Creative Commons Attribution (CC BY) license (https://creativecommons.org/licenses/by/4.0/).
Share and Cite
Abdulrahman, A.A.; Mahdy, O.S.; Sabri, L.S.; Sultan, A.J.; Al-Naseri, H.; Hasan, Z.W.; Majdi, H.S.; Ali, J.M. Experimental Investigation and Computational Fluid Dynamic Simulation of Hydrodynamics of Liquid–Solid Fluidized Beds. ChemEngineering 2022, 6, 37. https://0-doi-org.brum.beds.ac.uk/10.3390/chemengineering6030037
Abdulrahman AA, Mahdy OS, Sabri LS, Sultan AJ, Al-Naseri H, Hasan ZW, Majdi HS, Ali JM. Experimental Investigation and Computational Fluid Dynamic Simulation of Hydrodynamics of Liquid–Solid Fluidized Beds. ChemEngineering. 2022; 6(3):37. https://0-doi-org.brum.beds.ac.uk/10.3390/chemengineering6030037
Chicago/Turabian StyleAbdulrahman, Amer A., Omar S. Mahdy, Laith S. Sabri, Abbas J. Sultan, Hayder Al-Naseri, Zahraa W. Hasan, Hasan Shakir Majdi, and Jamal M. Ali. 2022. "Experimental Investigation and Computational Fluid Dynamic Simulation of Hydrodynamics of Liquid–Solid Fluidized Beds" ChemEngineering 6, no. 3: 37. https://0-doi-org.brum.beds.ac.uk/10.3390/chemengineering6030037