The Effect of Corrosion on Crude Oil Distillation Plants


Chemical and Chemical Engineering Department, Ovidius University Constanta, Mamaia Blv 224, 900450 Constanta, Romania
*
Author to whom correspondence should be addressed.
ChemEngineering 2022, 6(3), 41; https://0-doi-org.brum.beds.ac.uk/10.3390/chemengineering6030041
Submission received: 20 April 2022
/
Revised: 23 May 2022
/
Accepted: 25 May 2022
/
Published: 27 May 2022
Abstract
:The analysis of the corrosion phenomenon of the installations of the largest refinery in Romania confirmed the existence of its conditions, in the atmospheric distillation plants of crude oil, in the heat exchangers, and in the petrol and diesel hydrofining plants. However, the slightest effect of this phenomenon was found in the dome, the plates, and the exhaust pipes at the top of the distillation column, as well as in the reflux vessel of the atmospheric distillation plant. The main cause of the corrosion phenomenon and the increase in the corrosion areas of the material of the crude oil refining installations is the presence of hydrochloric acid, obtained after incorrect desalination (hydrolysis of calcium and magnesium chloride). To prevent this phenomenon, in laboratory conditions, we tested an antacid inhibitor (alkyl phenol) and a residual product (undistilled polyamine), with the role of supplementing the commercial inhibitor with a cheap product. The effectiveness of these additives was evaluated by introducing specimens made from the material taken from the refining column and from the reflux vessel into a solution of hydrochloric acid of various concentrations (5–15%). This solution was treated with the two corrosion inhibitors, the analysis of their effectiveness being performed at concentrations ranging between 0.05 and 0.2%. In addition, in this article, we deduced the equations of variation of the corrosion rate, depending on the working temperature of the refinery.
1. Introduction
In recent years, the study of corrosion of atmospheric crude oil distillation plants has been discussed more in articles published in journals. This is primarily due to the aging process of petrochemical plants (in the last 10 years, the existing facilities have been modernized due to changes in the quality requirements of the finished products and especially due to the worsening environmental conditions) [1].
Thus, the corrosion of the distillation columns has been the subject of several studies, an important and triggering element of this phenomenon being the modification of the properties of refined fluids (pH, water content, inorganic salt content, etc.) [2,3,4]. Corrosion has also been detected in crude oil distillation plants in Romania, which makes the phenomenon global and affects petrochemical plants [5,6,7].
The crude oil processing plants are subjected to the corrosion process, the phenomenon being the most common in the atmospheric distillation plant [8]. Corrosion was also found in the gasoline and diesel hydrofining plant and in the heat exchangers related to the crude oil processing area [9,10,11,12]. The analysis of the integrity of the distillation column and the reflux vessel from the largest refinery in Romania led to the repair and replacement of the first four plates (related to light products), the column dome, the aerator of the installation, and the product flue pipe, as well as components from the reflux vessel (heating pipe and some portions of the vessel walls) [13,14,15].
The corrosion phenomenon is mainly due to the hydrolysis of calcium and magnesium chloride, present in the crude oil water (following an incomplete desalination).
The temperature at the top of the column is also a factor that can activate the corrosive phenomenon, especially when the demand for gasoline is high and the installation works at a temperature at which the passivation phenomenon occurs [16,17,18,19,20].
Prevention of the corrosive effect is currently performed by injecting anticorrosive additives (to form a protective film inside the distillation column and to neutralize the acid effect of crude oil), monitoring the pH and chlorides in the reflux vessel, and monitoring inorganic chlorides in crude oil and the one treated in desalination [21,22,23,24].
The mechanical integrity of the distillation plant is achieved [25]:
- -
- Preventively, by taking specimens from the column material and determining in the laboratory the rate of corrosion of the metal;
- -
- Actively, by performing non-destructive measurement (in points) of wall thickness, determining the corrosion rate, and entering the repair of the installation (with high economic consequences due to the reduction in the current repair period, sometimes from 5 years to 2 years).
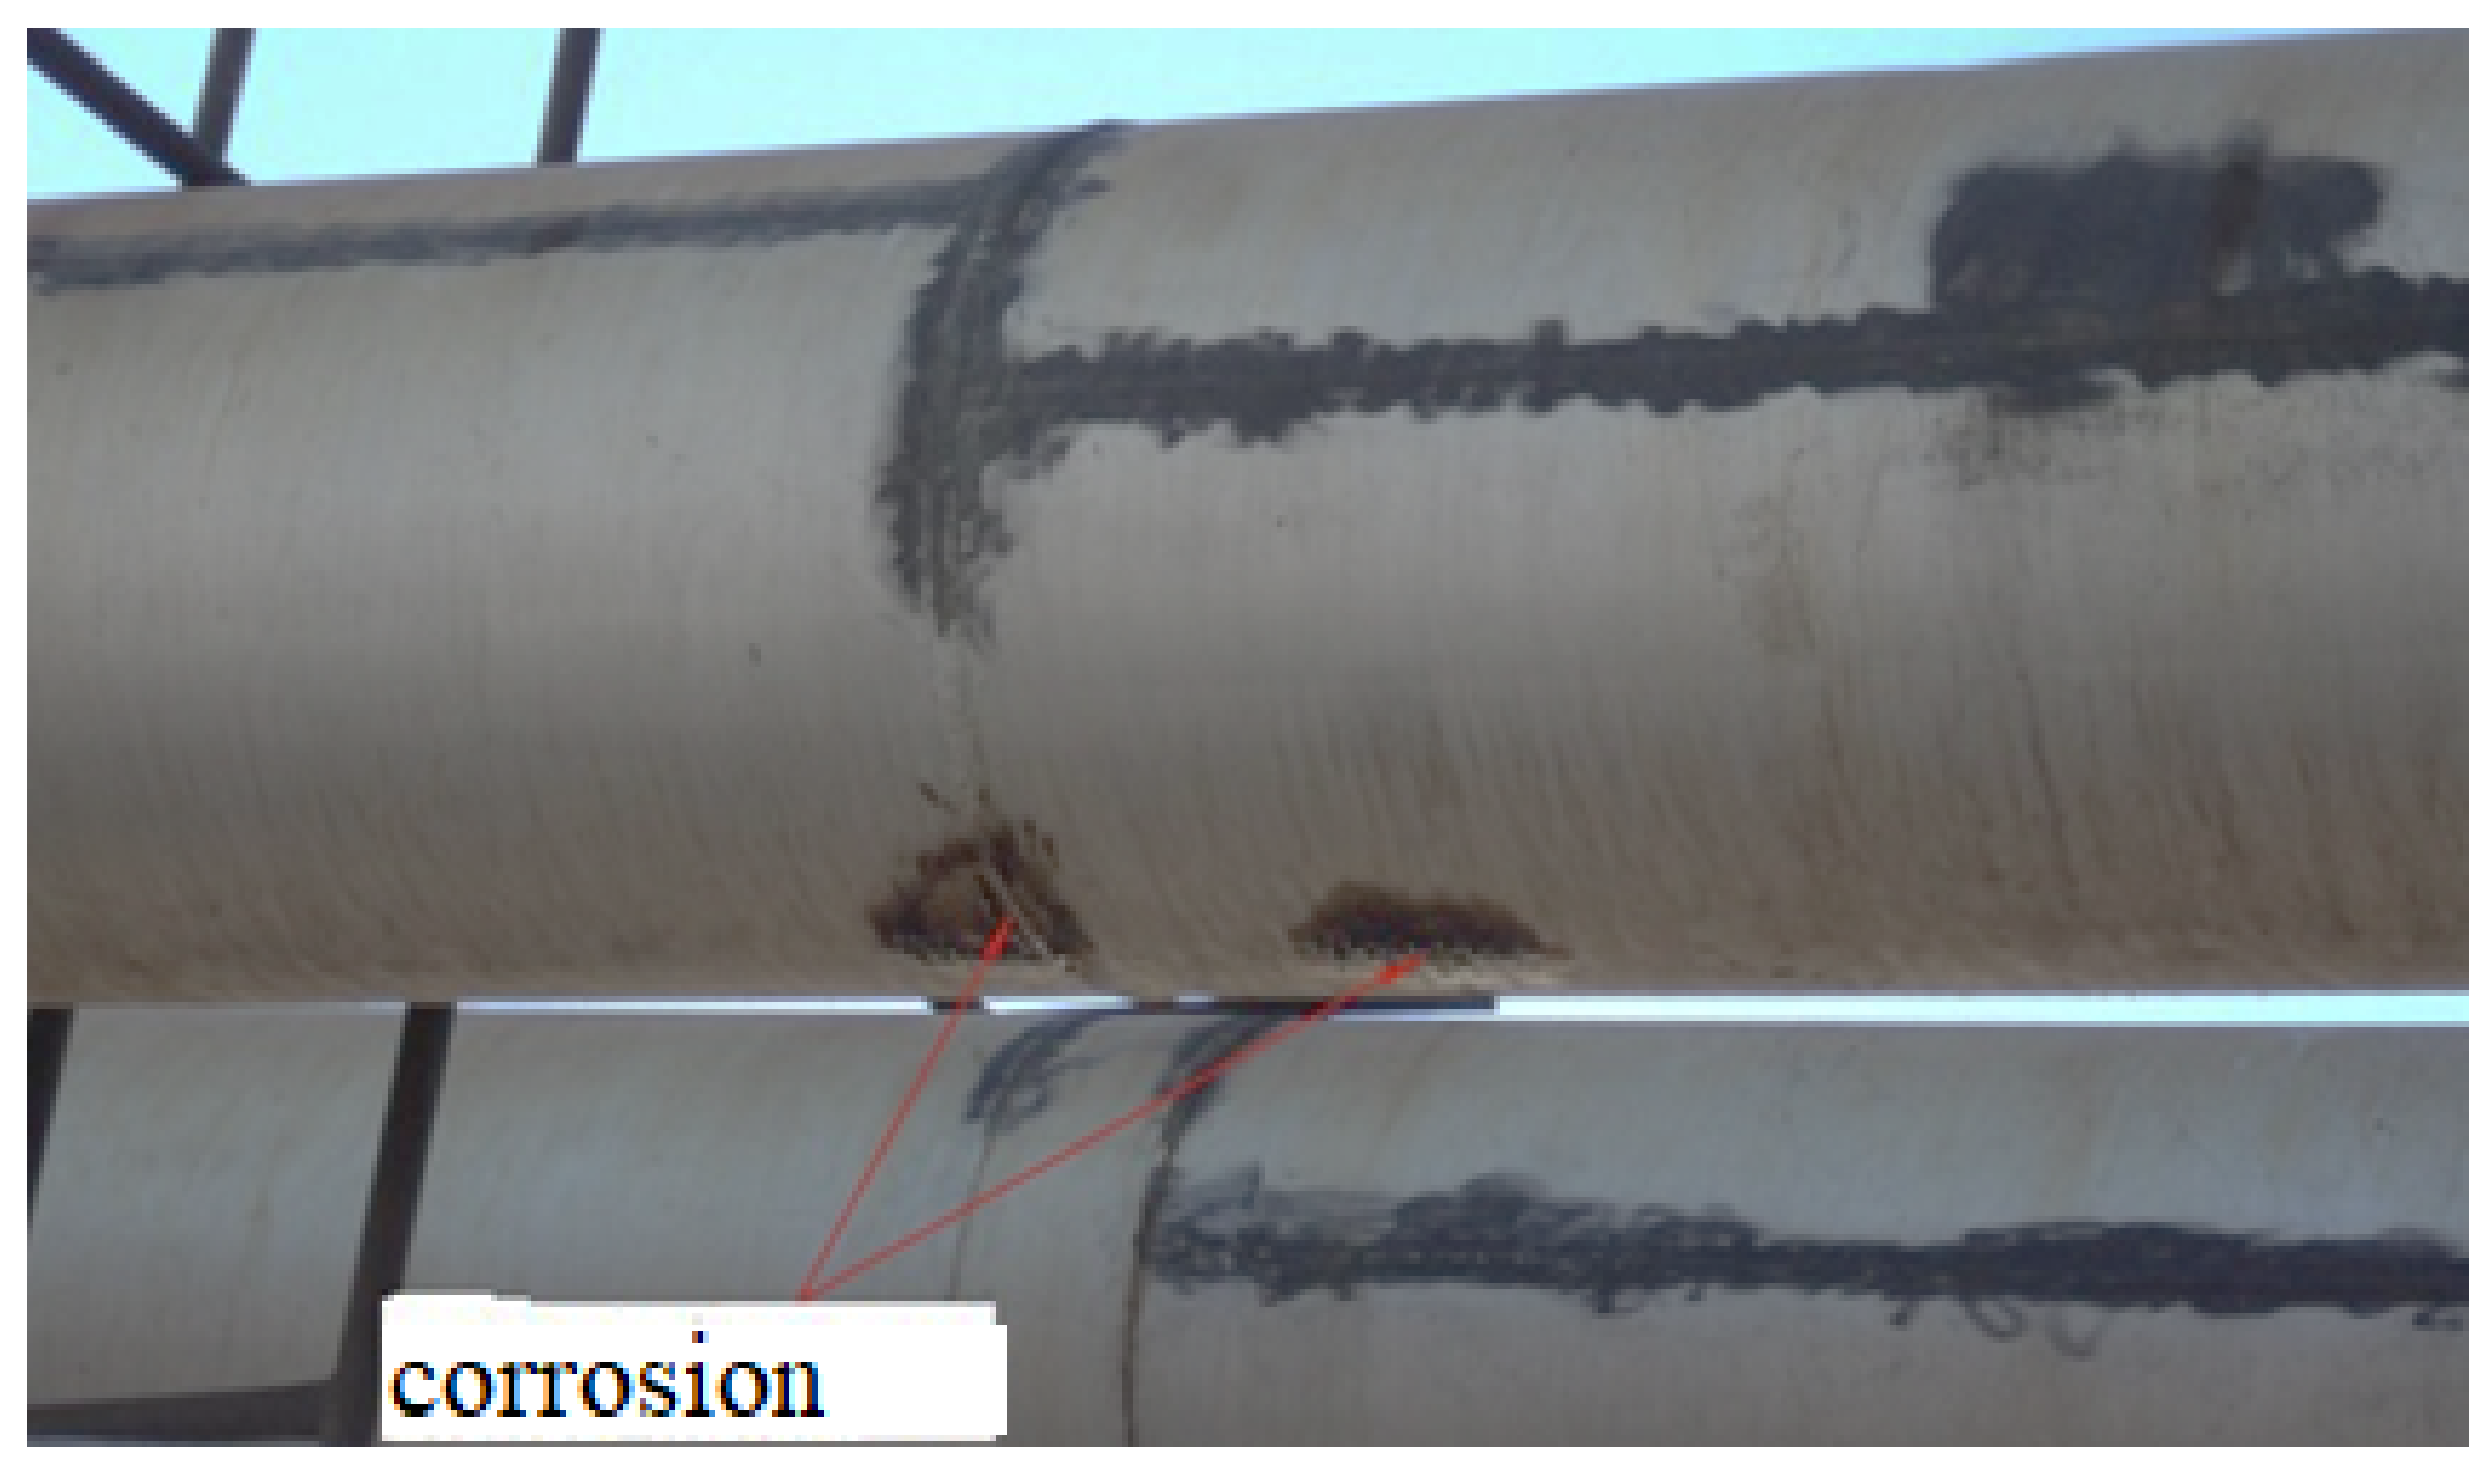
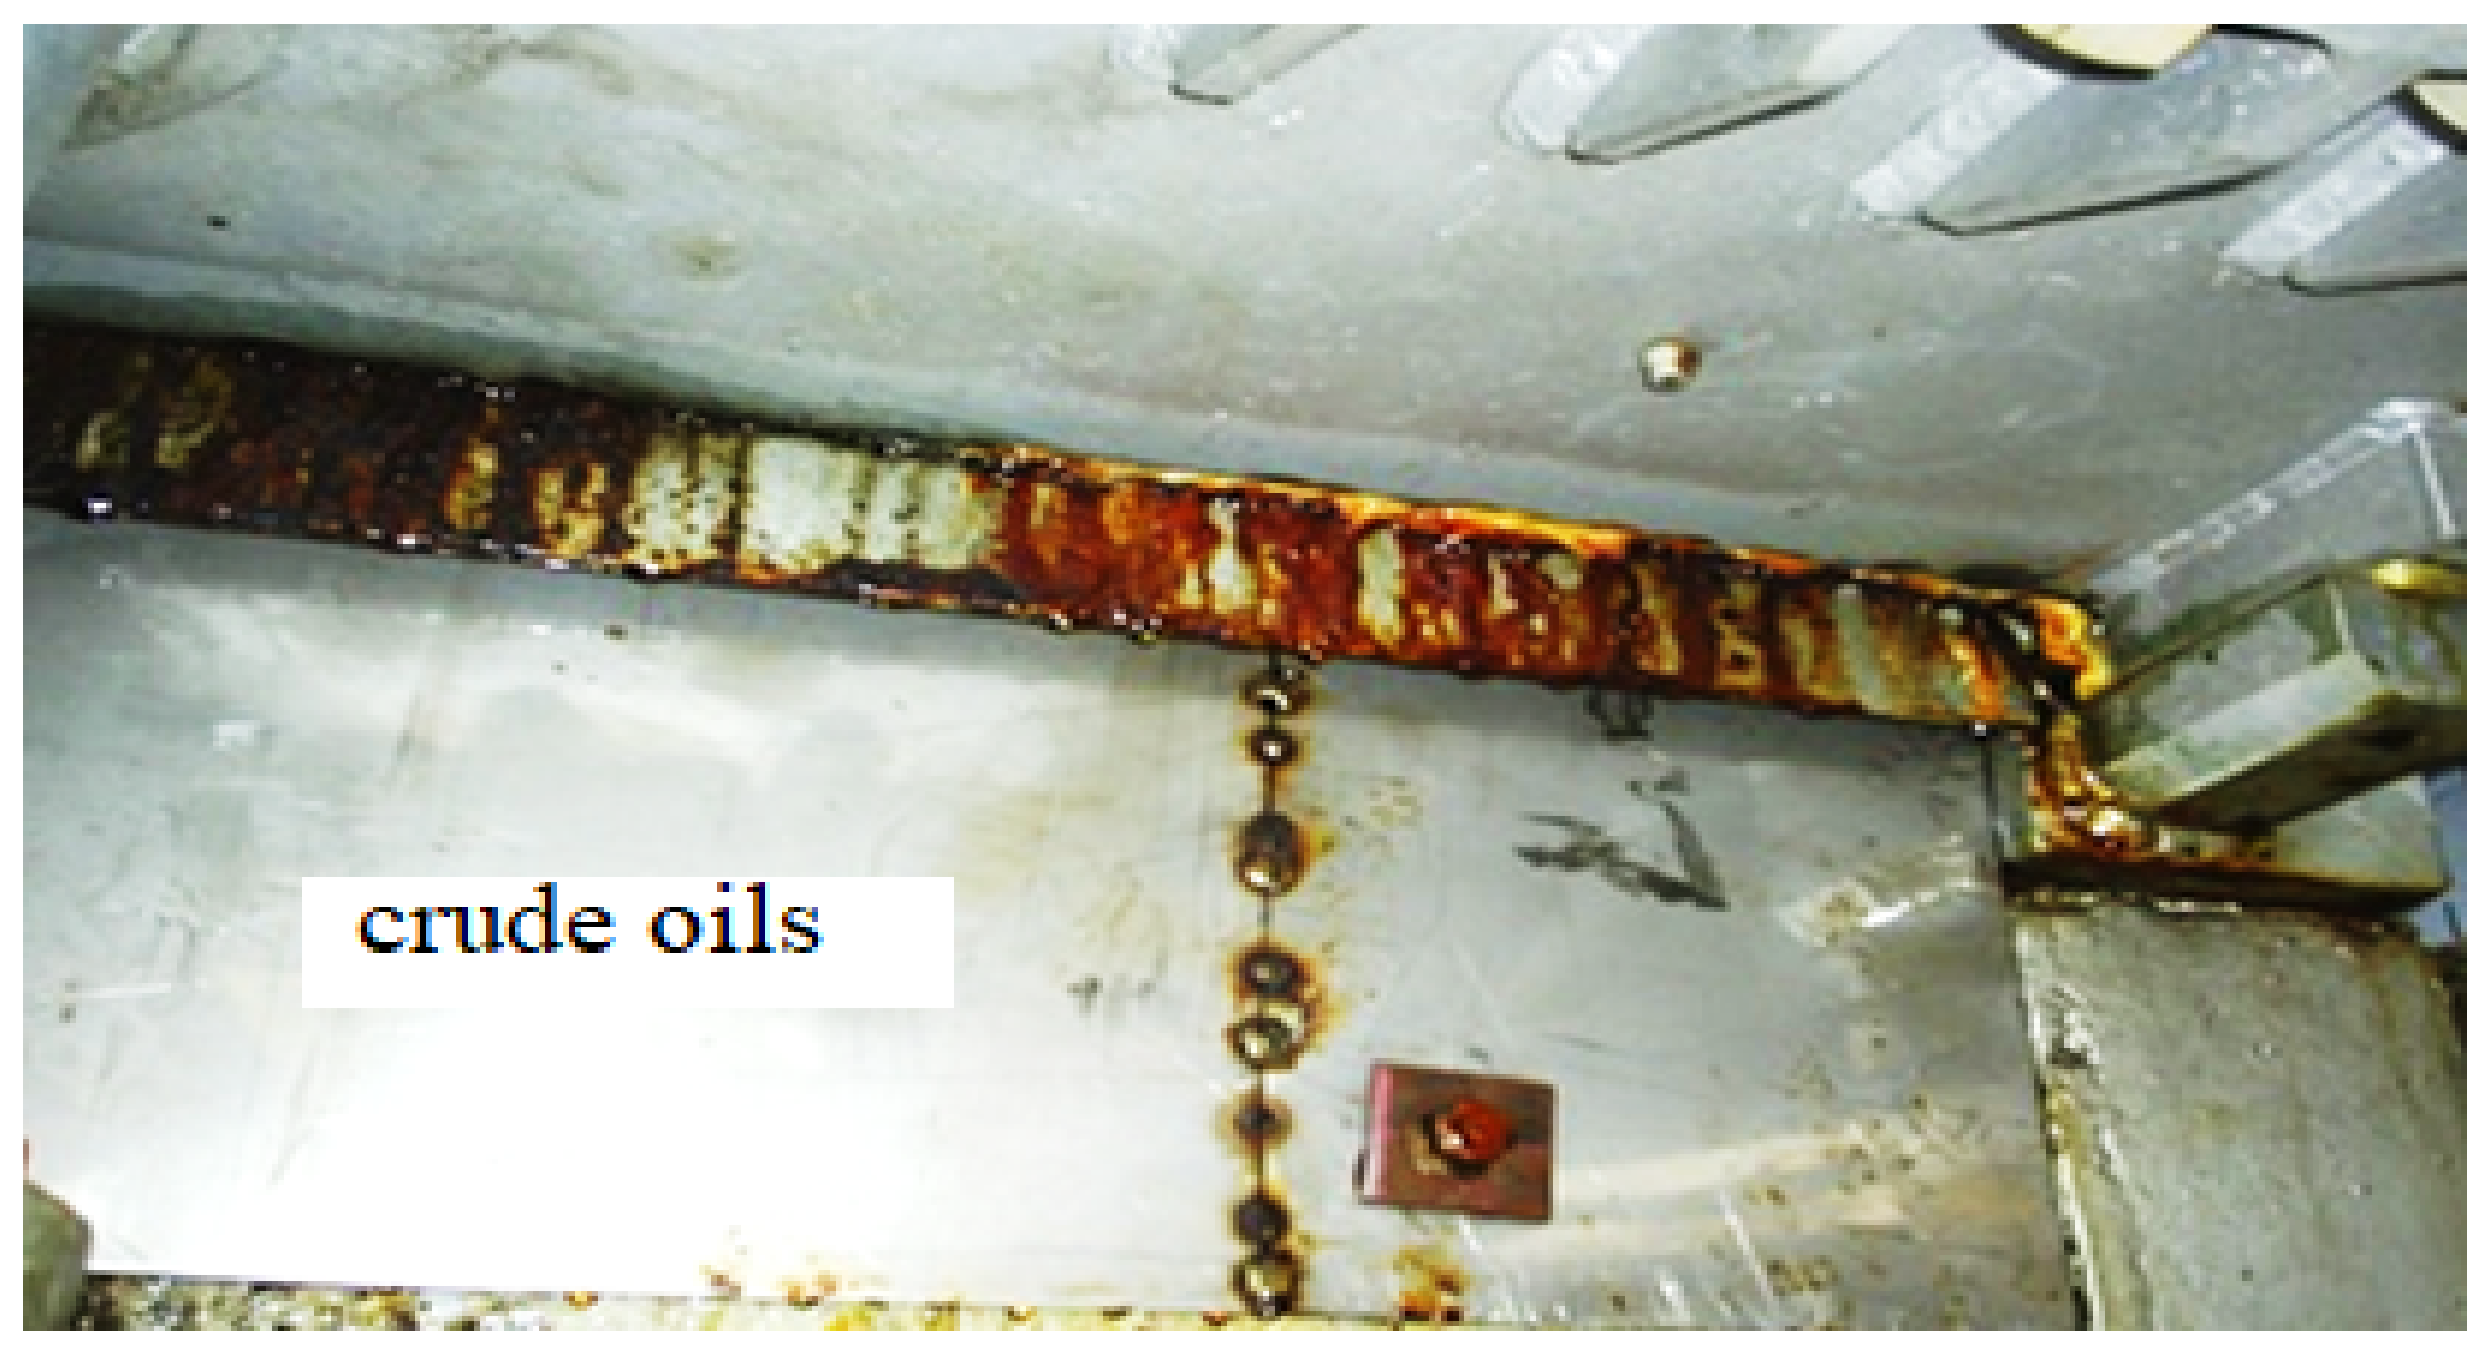
In the distillation column, it was observed that the corrosive phenomenon is due to the presence of HCl and water in the high area of the distillation column and HCl, H2S, and water in the reflux vessel (Figure 1 and Figure 2).
Crude oil contains significant amounts of salts (NaCl, MgCl2, or CaCl2). In principle, NaCl does not hydrolyze under normal operating conditions, this salt being a low contributor to the corrosion process.
It was also found that HCl is not corrosive if the temperature in the distillation is higher than the dew point temperature of the water.
However, there is a danger of the formation of alkaline salts (above the dew point temperature) and the formation of hydrochloric acid.
2. Materials and Methods
In order to determine the corrosion rate and the effectiveness efficiency of two inhibitory solutions, products from the upper plates of the atmospheric distillation column (gasoline separation zone) and from the reflux zone were taken from a refining plant.
The laboratory analysis of these products determined the components S2−, Cl−, Fe3+, and Cu2+ in correlation with the pH of the solution.
Sample metals were also taken from the plates and pipes affected by corrosion, which were cleaned to metallic luster and measured (weight and volume).
The metal samples were placed in the products taken and kept for 20 h at a temperature of 25 °C.
Subsequently, they were measured again, determining the corrosion rate and the corrosive penetration.
At the same time, the metal samples were introduced in a solution of hydrochloric acid of various concentrations (5–15%).
This solution was treated with the two corrosion inhibitors, with a concentration ranging from 0.05 to 0.2%.
The immersion time of the specimens was 20 h at a temperature of 25 °C, 6 h at a temperature of 40 °C, and 2 h at a temperature of 70 °C.
After completion of the test, the final corrosion rate was determined.
The determination of the water content of the products taken from the atmospheric distillation column (the first four plates) and from the reflux vessel was carried out according to the standard ASTM D6304-20-Standard Test Method for Determination of Water in Petroleum Products, Lubricating Oils, and Additives by Coulometric Karl Fischer Titration [26].
The determination of chlorides in samples taken from the atmospheric distillation column was performed by potentiometric titration according to the ASTM 4929 ASTM D4929-19a Standard Test Method for Determination of Organic Chloride Content in Crude Oil [27] and X-ray fluorescence spectrometry.
Sulfur was determined according to the ASTM D1266-18 Standard Test Method for Sulfur in Petroleum Products (Lamp Method) [28].
pH was determined by the potentiometric method according to the ASTM D7946-19 Standard Test Method for Initial pH (i-pH) -Value of Petroleum Products [29].
Fe3+ was determined by the atomic adsorption method according to the ASTM D5863-00a (2016) Standard Test Methods for Determination of Nickel, Vanadium, Iron, and Sodium in Crude Oils and Residual Fuels by Flame Atomic Absorption Spectrometry [30].
Each test was repeated 3 times, determining the measurement error and the statistical deviation of the data obtained. The error was up to 0.1%.
3. Results
Hydrochloric acid (HCl) in combination with NH3 forms NH4Cl in solid form in distillation tower overhead systems [25].
The hydrolysis equations that take place in the atmospheric distillation column are presented in Table 1. In Table 2 and Table 3, we have presented the results obtained from the analysis of the water taken from the top of the distillation column and the reflux vessel.
The corrosion rate was determined by repeated weighing of the tested samples and the penetration index by calculation (Table 4).
Table 5, Table 6 and Table 7 present the values determined after the introduction of the specimens taken from the distillation column and the reflux vessel into hydrochloric acid solution and then into the HCl solution treated with a corrosion inhibitor, such as alkyl phenol and a residual product (undistilled polyamine).
The analysis of the samples collected from the top of the distillation column and from the reflux vessel indicates the presence of ion Fe3 + in the products that have an acidic pH; they confirm the beginning of the corrosion phenomenon.
Sulfur ion S2− was detected in the alkaline zone of the solution.
The presence of Cu in the harvested products indicates the corrosive role of these solutions on the installations containing this material (vaporization furnace) and which were subsequently transported to the trays and the reflux vessel in the distillation plant.
The equations used for the numerical modeling of the corrosion process of the installations were determined according to the analysis temperature, the HCl content of the solution, and the amount of antacid additive used (Table 8, Table 9 and Table 10).
The analysis of the corrosion rate on the collected metal samples indicates the strong destructive-corrosive effect of hydrochloric acid in the high area of the distillation column (high-temperature zone).
In addition, the material OL37 (a normal steel) behaves quite well in corrosion, compared to brass, which at high temperatures develops in contact with oil products a corrosion rate 60% higher.
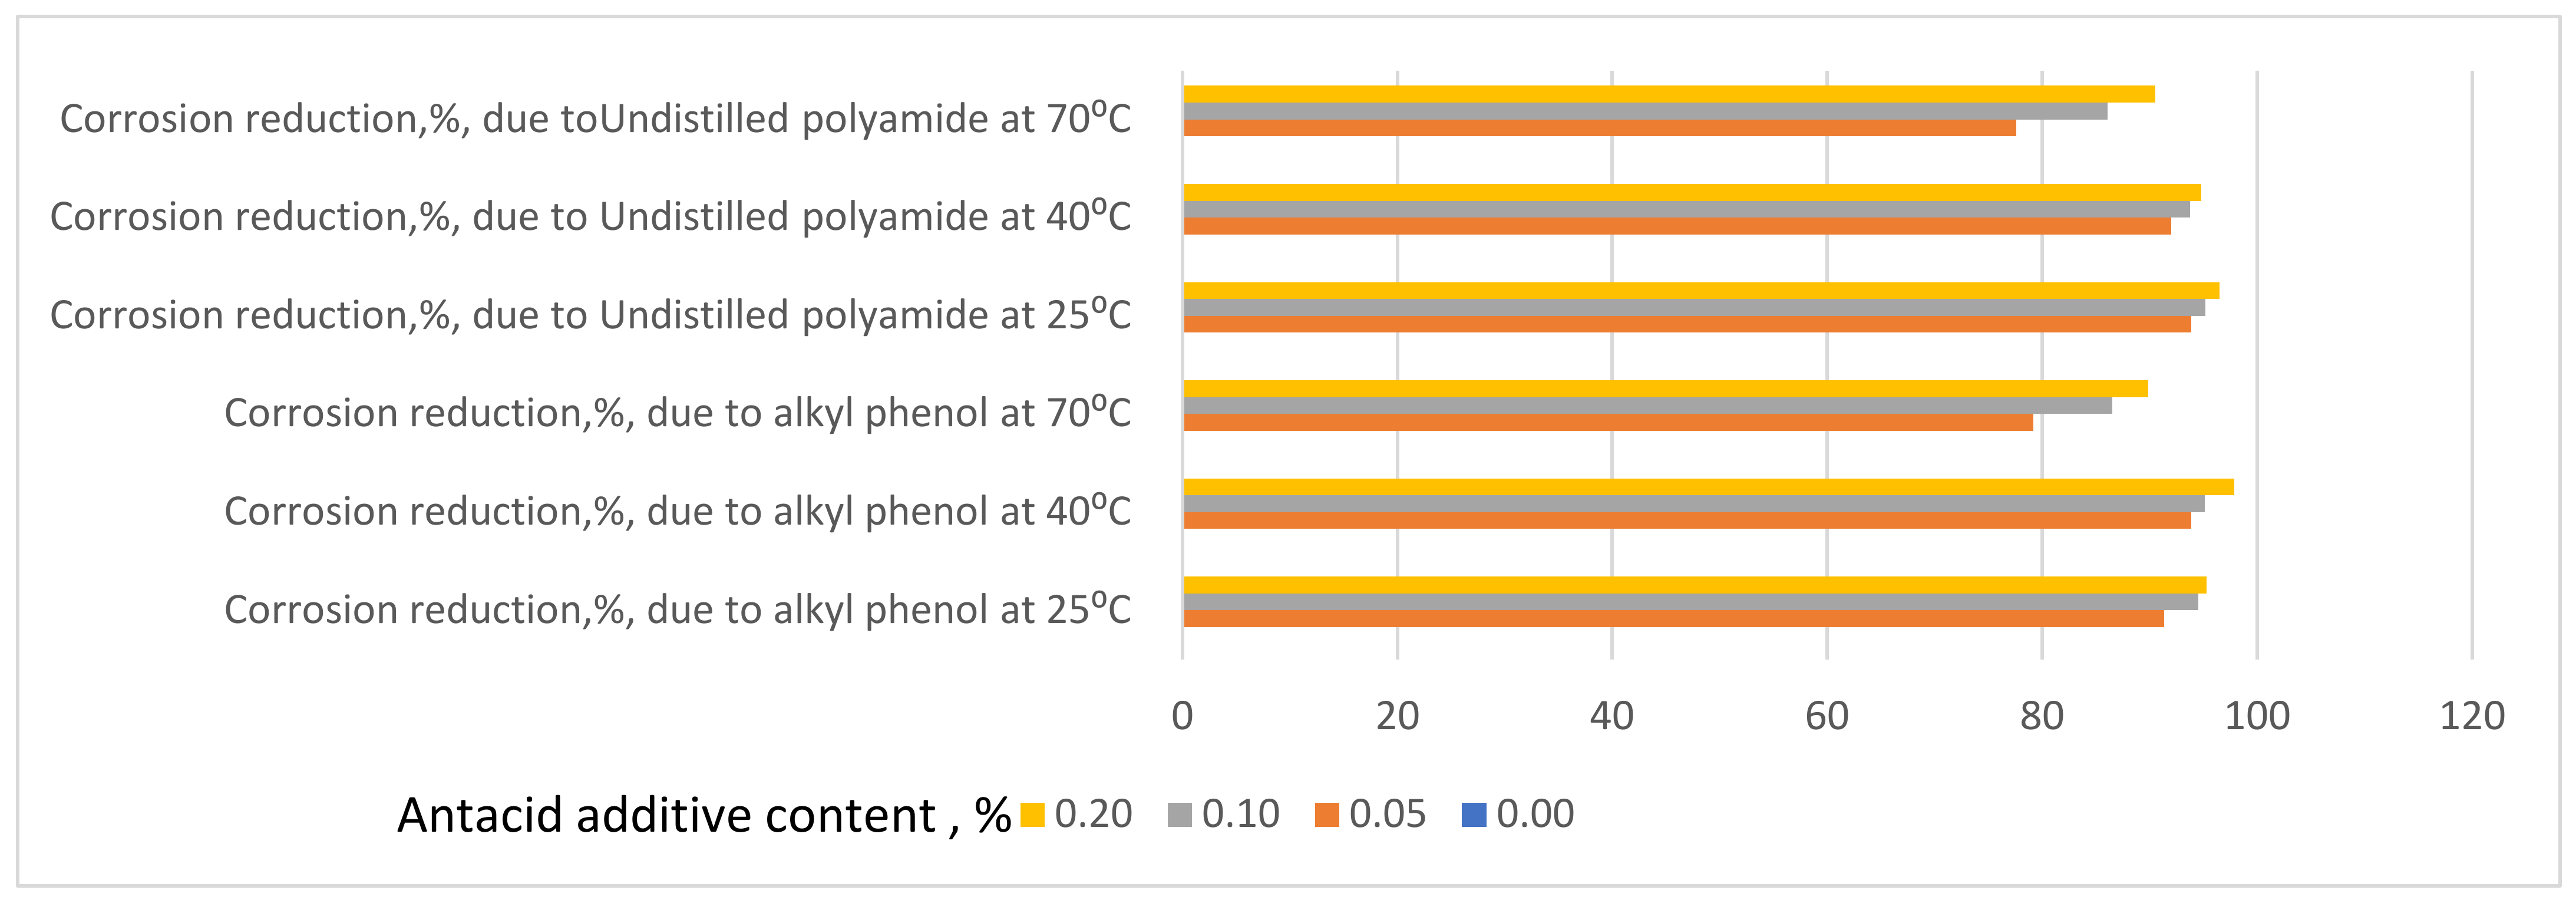
The corrosive effect can be reduced by introducing commercial antacid additives (based on alkyl phenol, having an efficacy of 91–95% at temperatures of 20 °C, 92–97% at temperatures of 40 °C, and 79–97% at temperatures of 70 °C (Figure 3).
This viscous inhibitor forms a protective film over the installations, ensuring the reduction of the corrosive effect of hydrochloric acid.
We also used a chemical waste (undistilled polyamide), which provides increased protection at high temperatures.
Polynomial grade 3 equations best describe the corrosive phenomenon without computational errors, compared to exponential equations, which have errors of up to 21%.
4. Conclusions
The presence of hydrochloric acid in atmospheric distillation plants creates the possibility of triggering the corrosion process of the plants, the use of antacid additives being necessary.
The analysis of the specimens taken from the atmospheric distillation installations indicates their risk of corrosion, the presence of the Fe3+ ion in the products taken from the installation being observed in the analyses performed.
Finally, we recommend the following procedures to combat or reduce corrosion processes:
- Selection of the most resistant metal material for the corrosive environment in certain working conditions;
- Design of machinery or installations with regard to mechanical strength and corrosion resistance;
- Making welds and joints by ensuring compatibility between different metal materials;
- Injection of corrosion inhibitors.
Author Contributions
Conceptualization, A.E.S. and T.C.; methodology, T.C. and O.V.S.; software, T.C.; validation, A.E.S., O.V.S. and T.C.; formal analysis, T.C.; investigation, T.C.; resources, T.C.; data curation, T.C.; writing—original draft preparation, O.V.S.; writing—review and editing, A.E.S.; visualization, A.E.S.; supervision, T.C.; project administration, T.C.; funding acquisition, T.C. All authors have read and agreed to the published version of the manuscript.
Funding
This research received no external funding. This project was part of the doctoral and postdoctoral research program.
Data Availability Statement
The data contained in this study are original and are part of the environmental protection analysis, without affecting companies, local communities, and government authorities. The study is in accordance with the legislation in force, being in accordance with the requirements of the local community and sustainable development policies.
Conflicts of Interest
The authors declare no conflict of interest.
References
- Akinyemi, O.O.A.; Nwaokocha, C.N.; Adesanya, A. Evaluation of corrosion cost of crude oil processing industry. J. Eng. Sci. Technol. 2012, 7, 517–528. [Google Scholar]
- Chambers, B.; Srinivasan, S.; Yap, K.M.; Yunovich, M. Corrosion in Crude Distillation Unit Overhead Operations: A Comprehensive Review. In Proceedings of the CORROSION 2011, Houston, TX, USA, 13–17 March 2011; Paper No. 11360. Available online: https://onepetro.org/NACECORR/proceedings-abstract/CORR11/All-CORR11/NACE-11360/119776 (accessed on 1 January 2022).
- Bhowmik, P.K.; Hossain, M.D.E.; Shamim, J.A. Corrosion and its control in crude oil refining process. In Proceedings of the 6th International Mechanical Engineering Conference & 14th Annual Paper Meet (6IMEC & 14APM), Dhaka, Bangladesh, 28–29 September 2012. [Google Scholar]
- NACE International. Crude Distillation Unit Distillation Tower Overhead System Corrosion; NACE International Publication 34109 (Task Group 342); NACE International: Houston, TX, USA, 2009. [Google Scholar]
- Groysman, A. Corrosion Problems and Solutions in Oil Refining and Petrochemical Industry; Springer: Cham, Switzerland, 2017; pp. 1–14. [Google Scholar]
- Blumer, A.F. Crude Still Overhead System Corrosion. Corrosion 1949, 5, 135–147. [Google Scholar] [CrossRef]
- Chambers, B.; Yap, K.; Srinivasan, S.; Yunovich, M. Corrosion in Crude Distillation Unit Overhead Operations: A Comprehensive Review. In CORROSION Conference; Paper No. 11360.; NACE International: Houston, TX, USA, 2011. [Google Scholar]
- Keera, S.T.; Eissa, E.A.; Taman, A.R. Corrosion of copper metal in distillation process. Anti-Corros. Methods Mater. 1998, 45, 252–255. [Google Scholar] [CrossRef]
- Mostafaei, A.; Peighambari, S.M.; Nasirpouri, F. Failure analysis of monel packing in atmospheric distillation tower under the service in the presence of corrosive gases. Eng. Fail. Anal. 2013, 28, 241–251. [Google Scholar] [CrossRef]
- Popoola, L.T.; Grema, A.S.; Latinwo, G.K.; Gutti, B.; Balogun, A.S. Corrosion problems during oil and gas production and its mitigation. Int. J. Ind. Chem. 2013, 4, 35. [Google Scholar] [CrossRef] [Green Version]
- Wood, M.H.; Arellano, A.V.; Van Wijk, L. Corrosion Related Accidents in Petroleum Refineries; European Commission Joint Research Centre: 2013; Report no. EUR, 26331; Publications Office of the European Union: Luxembourg, 2013. [Google Scholar]
- Eaton, P.; Kaur, H.; Gray, M. Factors Affecting Salt Hydrolysis in Heavy Crude. In Proceedings of the Eurocorr/2009, Nice, France, 6–10 September 2009. Paper No. 8295. [Google Scholar]
- El-Yazgi, A.A.; Hardie, D. Stress corrosion cracking of duplex and super duplex stainless steels in sour environments. Corros. Sci. 1998, 40, 909–930. [Google Scholar] [CrossRef]
- Waheed, M.A.; Oni, A.O. Performance improvement of a crude oil distillation unit. Appl. Therm. Eng. 2015, 75, 315–324. [Google Scholar] [CrossRef]
- Landrum, R.J. Fundamentals of Designing for Corrosion Control; NACE: Houston, TX, USA, 1989; 352p. [Google Scholar]
- Joosten, M.W.; Kost, J.; Hembree, J.; Achour, M. Organic Acid Corrosion in Oil and Gas Production. In Proceedings of the NACE CORROSION 2002 Conference, Denver, CO, USA, 7–11 April 2002; Paper no. 02294. NACE International: Houston, TX, USA, 2002; Volume 13, p. 7. [Google Scholar]
- Andersen, T.R.; Halvorsen, A.M.K.; Valle, A.; Kojen, G.P.; Dugstad, A. The Influence of Condensation Rate and Acetic Acid Concentration on TOL-Corrosion in Multiphase Pipelines. In Proceedings of the NACE CORROSION 2007 Conference, Nashville, TN, USA, 11–15 March 2007; Paper no. 07312. NACE International: Houston, TX, USA, 2007. [Google Scholar]
- George, K.; Nešić, S.; Waard, C. Electrochemical Investigation and Modeling of CO2 Corrosion of Mild Steel in the Presence of Acetic Acid. In Proceedings of the CORROSION 2004, New Orleans, LA, USA, 28 March–1 April 2004; Paper no. 04379. NACE International: Houston, TX, USA, 2004. [Google Scholar]
- Groysman, A. Corrosion for Everybody; Springer: Dordrecht, The Netherlands, 2010; 368p. [Google Scholar]
- Groysman, A. Corrosion in Systems for Transportation and Storage of Petroleum Products and Biofuels; Springer: Dordrecht, The Netherlands, 2014; 297p. [Google Scholar]
- Braden, V.; Petersen, P.; Malpiedi, M.; Bowerbank, L.; Gorman, J. Crude Unit Overhead Corrosion Control. In Proceedings of the CORROSION Conference, San Diego, CA, USA, 22–27 March 1998; Paper No. 98585. NACE International: Houston, TX, USA, 1998. [Google Scholar]
- Fan, D.; Fort, W.; Shargay, C.; Turner, J.; Messer, B. Design Considerations to Minimize Ammonium Chloride Corrosion in Hydrotreatment Reactions. In Proceedings of the CORROSION 2001, Houston, TX, USA, 11–16 March 2001; p. 01543. [Google Scholar]
- Kapusta, S.; Ooms, A.; Buijis, J.; Fan, D.; Fort, W., 3rd. Systematic Approach to Controlling Fouling and Corrosion in Crude Unit Overheads and Hydrotreater Reactor Effluents; Corrosion/01; Paper No. 01535; NACE International: Houston, TX, USA, 2001. [Google Scholar]
- Lordo, S.; Eisenhawer, A. Sensitivity analysis for modeling overhead chloride salt deposition and corrosion issues. J. Phys. Conf. Ser. 2006, 1378, 022089. [Google Scholar]
- Saab, M.; Dias, O.C.; Faqeer, F.M. Damage Mechanisms and Corrosion Control in a Crude Unit Overhead Line; Corrosion/05; Paper No. 05566; NACE International: Houston, TX, USA, 2005. [Google Scholar]
- ASTM D6304-20; Standard Test Method for Determination of Water in Petroleum Products, Lubricating Oils, and Additives by Coulometric Karl Fischer Titration. ASTM International: West Conshohocken, PA, USA, 2020. Available online: https://webstore.ansi.org/Standards/ASTM/ASTMD630420 (accessed on 1 January 2022).
- ASTM D4929-19a; Standard Test Method for Determination of Organic Chloride Content in Crude Oil. ASTM International: West Conshohocken, PA, USA, 2019. Available online: https://www.astm.org/SUBSCRIPTION/REDLINE_PAGES/D1266.htm (accessed on 1 January 2022).
- ASTM D1266-18; Standard Test Method for Sulfur in Petroleum Products (Lamp Method). ASTM International: West Conshohocken, PA, USA, 2018. Available online: https://webstore.ansi.org/Standards/ASTM/ASTMD492919a (accessed on 1 January 2022).
- ASTM D7946-19; Standard Test Method for Initial pH (i-pH)-Value of Petroleum Products. ASTM International: West Conshohocken, PA, USA, 2019. Available online: https://www.en-standard.eu/d7946-19-standard-test-method-for-initial-ph-i-ph-value-of-petroleum-products/ (accessed on 1 January 2022).
- ASTM D5863-00a; Standard Test Methods for Determination of Nickel, Vanadium, Iron, and Sodium in Crude Oils and Residual Fuels by Flame Atomic Absorption Spectrometry. ASTM International: West Conshohocken, PA, USA, 2016. Available online: https://webstore.ansi.org/Standards/ASTM/ASTMD586300a2016 (accessed on 1 January 2022).
Figure 1.
Pores in the pipes at the top of the distillation column (photo by Timur Chis).

Figure 2.
Corrosion in the reflux vessel (photo by Timur Chis).

Figure 3.
Effect of an additive on corrosion reduction.


Table 1.
Hydrolysis reactions in the atmospheric distillation column of crude oil.
| Reaction | Approximate Starting Temperature °C (°F) | Approximate Degree of Hydrolysis at 340 °C (650 °F) |
|---|---|---|
| NaCl+ H2O→NaOH+ HCl | ≥500 (≥930) | 2% |
| CaCl2+ H2O→Ca(OH)2+2HCl | 210 (410) | 10% |
| MgCl2+2H2O→Mg(OH)2+2HCl | 120 (248) | 90% |
Table 2.
The results obtained from the analysis of the products at the top of the distillation column.
Table 2.
The results obtained from the analysis of the products at the top of the distillation column.
| pH | Fe3+, ppm | Cu2+, ppm | S2−, ppm | Cl−, g/1000 mL |
|---|---|---|---|---|
| 4,3 | 3.3 | 0 | 0 | 0.0366 |
| 4.5 | 8.2 | 0 | 0 | 0.0567 |
| 5.1 | 30.5 | 0.015 | 0 | 0.0494 |
| 6.4 | 0 | trace | 0 | 0.0298 |
| 7.3 | 0 | 0.0014 | 92.0 | 0.0308 |
| 8.4 | 0 | 0 | 47.5 | 0.0535 |
| 9.2 | 0 | 0 | 0 | 0.0714 |
Table 3.
Results obtained from the analysis of the product samples taken from the reflux vessel of the distillation column.
Table 3.
Results obtained from the analysis of the product samples taken from the reflux vessel of the distillation column.
| pH | Fe3+, ppm | Cu2+, ppm | S2−, ppm | Cl−, g/1000 mL |
|---|---|---|---|---|
| 4.3 | 5.3 | 0 | 0 | 0.0855 |
| 4.5 | 7.4 | 0 | 0 | 0.1473 |
| 5.1 | 34.3 | 0 | 0 | 0.1435 |
| 6.4 | 0 | 0 | 0 | 0.0822 |
| 7.3 | 0 | 0.0025 | 80.95 | 0.0354 |
| 8.4 | 0 | 0 | 12.88 | 0.1199 |
| 9.2 | 0 | 0 | 0 | 0.2148 |
Table 4.
Corrosion rate determined on samples collected from the top and bottom of the distillation column.
Table 4.
Corrosion rate determined on samples collected from the top and bottom of the distillation column.
| Material Column | Collection Area | Corrosion Rates, g/m2 h | Penetration Corrosion Rates, mm/an |
|---|---|---|---|
| OL37 steel | Reflux vessel | 0.18890 | 0.2022 |
| OL37 steel | Reflux vessel pipe | 0.18455 | 0.1934 |
| OL37 steel | Gasoline plate | 0.24908 | 0.2564 |
| OL37 steel | Vapor exhaust pipe | 0.26598 | 0.2804 |
| Brass | Reflux vessel | 0.12994 | 0.1474 |
| Brass | Reflux vessel pipe | 0.15043 | 0.1494 |
| Brass | Gasoline plate | 0.58467 | 0.5939 |
| Brass | Vapor exhaust pipe | 0.43057 | 0.4536 |
Table 5.
Corrosion rate determined on samples collected from the material of the distillation column (OL37), introduced in a bath with HCl in proportion of 5%.
Table 5.
Corrosion rate determined on samples collected from the material of the distillation column (OL37), introduced in a bath with HCl in proportion of 5%.
| Test Temperatures, °C | Antacid Additive Content (% Alkyl Phenol, % Undistilled Polyamide) | Corrosion Rates, g/m2 h, Alkyl Phenol Additive | Corrosion Efficacy Reduces, %, Alkyl Phenol Additive | Corrosion Rates, g/m2 h, Undistilled Polyamide Additive | Corrosion Efficacy Reduces, %, Undistilled Polyamide Additive |
|---|---|---|---|---|---|
| 25 | 0.00 | 0.3000 | - | 0.3000 | - |
| 25 | 0.05 | 0.0182 | 93.93 | 0.0193 | 93.57 |
| 25 | 0.10 | 0.0133 | 95.57 | 0.0154 | 94.87 |
| 25 | 0.20 | 0.0080 | 97.33 | 0.0120 | 96.00 |
| 40 | 0.00 | 1.7000 | - | 1.7000 | - |
| 40 | 0.05 | 0.1900 | 88.82 | 0.1600 | 90.59 |
| 40 | 0.10 | 0.1500 | 91.18 | 0.1400 | 91.76 |
| 40 | 0.20 | 0.1100 | 93.53 | 0.0900 | 94.71 |
| 70 | 0.00 | 16.000 | - | 16.000 | - |
| 70 | 0.05 | 1.4500 | 90.94 | 1.3300 | 91.69 |
| 70 | 0.10 | 0.9900 | 93.81 | 0.9400 | 94.13 |
| 70 | 0.20 | 0.8500 | 94.69 | 0.7300 | 95.44 |
Table 6.
Corrosion rate determined on samples collected from the material of the distillation column (OL37), introduced in a bath with HCl in proportion of 10%.
Table 6.
Corrosion rate determined on samples collected from the material of the distillation column (OL37), introduced in a bath with HCl in proportion of 10%.
| Test Temperatures, °C | Antacid Additive Content (% Alkyl Phenol, % Undistilled Polyamide) | Corrosion Rates, g/m2 h, Alkyl Phenol Additive | Corrosion Efficacy Reduces, %, Alkyl Phenol Additive | Corrosion Rates, g/m2 h, Undistilled Polyamide Additive | Corrosion Efficacy Reduces, %, Undistilled Polyamide Additive |
|---|---|---|---|---|---|
| 25 | 0.00 | 0.7000 | - | 0.700 | - |
| 25 | 0.05 | 0.0510 | 92.71 | 0.061 | 91.29 |
| 25 | 0.10 | 0.0418 | 94.03 | 0.053 | 92.43 |
| 25 | 0.20 | 0.0215 | 96.93 | 0.042 | 94.00 |
| 40 | 0.00 | 2.9800 | - | 2.980 | - |
| 40 | 0.05 | 0.1510 | 94.93 | 0.320 | 89.26 |
| 40 | 0.10 | 0.1672 | 94.39 | 0.210 | 92.95 |
| 40 | 0.20 | 0.1530 | 94.87 | 0.156 | 94.77 |
| 70 | 0.00 | 36.000 | - | 36.00 | - |
| 70 | 0.05 | 5.9300 | 83.53 | 6.400 | 82.22 |
| 70 | 0.10 | 3.9310 | 89.08 | 2.700 | 92.50 |
| 70 | 0.20 | 2.9450 | 91.82 | 2.530 | 92.97 |
Table 7.
Corrosion rate determined on samples collected from the material of the distillation column (OL37), introduced in a bath with HCl in proportion of 15%.
Table 7.
Corrosion rate determined on samples collected from the material of the distillation column (OL37), introduced in a bath with HCl in proportion of 15%.
| Test Temperatures, °C | Antacid Additive Content (% Alkyl Phenol, % Undistilled Polyamide) | Corrosion Rates, g/m2 h, Alkyl Phenol Additive | Corrosion Efficacy Reduces, %, Alkyl Phenol Additive | Corrosion Rates, g/m2 h, Undistilled Polyamide Additive | Corrosion Efficacy Reduces, %, Undistilled Polyamide Additive |
|---|---|---|---|---|---|
| 25 | 0.00 | 1.500 | - | 1.500 | - |
| 25 | 0.05 | 0.130 | 91.33 | 0.092 | 93.87 |
| 25 | 0.10 | 0.082 | 94.53 | 0.072 | 95.20 |
| 25 | 0.20 | 0.071 | 95.27 | 0.053 | 96.47 |
| 40 | 0.00 | 10.22 | - | 10.22 | - |
| 40 | 0.05 | 0.630 | 93.84 | 0.820 | 91.98 |
| 40 | 0.10 | 0.501 | 95.10 | 0.640 | 93.74 |
| 40 | 0.20 | 0.220 | 97.85 | 0.530 | 94.81 |
| 70 | 0.00 | 68.20 | - | 68.20 | - |
| 70 | 0.05 | 14.20 | 79.18 | 15.30 | 77.57 |
| 70 | 0.10 | 9.20 | 86.51 | 9.500 | 86.07 |
| 70 | 0.20 | 6.90 | 89.88 | 6.450 | 90.54 |
Table 8.
Corrosion rate equations (y) as a function of temperature, HCl content of the solution (5%), and the amount of antacid additive used (x,%).
Table 8.
Corrosion rate equations (y) as a function of temperature, HCl content of the solution (5%), and the amount of antacid additive used (x,%).
| Test Temperature, °C | Equation Type | Corrosion Rate Regression Equation (y) Depending on the Amount of Additive Used (x,% Alkyl Phenol) | R2 | Corrosion Rate Regression Equation (y) Depending on the Amount of Additive Used (% Undistilled Polyamide) | R2 |
|---|---|---|---|---|---|
| 25 | Exponential | y = 0.1083e−15.62x | 0.8548 | y = 0.1052e−13.55x | 0.8163 |
| 25 | Linear | y = −1.1825x + 0.1883 | 0.4953 | y = −1.1626x + 0.1884 | 0.4871 |
| 25 | Polynomial (grad 2) | y = 17.825x2 − 4.8749x + 0.2775 | 0.8995 | y = 17.815x2 − 4.8527x + 0.2775 | 0.8978 |
| 25 | Polynomial (grad 3) | y = −275.4x3 + 96.69x2 − 9.782x + 0.3 | 1 | y = −275.33x3 + 96.66x2 − 9.7587x + 0.3 | 1 |
| 40 | Exponential | y = 0.7529e−11.71x | 0.7996 | y = 0.7216e−12.49x | 0.809 |
| 40 | Linear | y = −6.4743x + 1.104 | 0.508 | y = −6.5314x + 1.094 | 0.5041 |
| 40 | Polynomial (grad 2) | y = 95.364x2 − 26.228x + 1.5808 | 0.9038 | y = 96.273x2 − 26.474x + 1.5754 | 0.8974 |
| 40 | Polynomial (grad 3) | y = −1456.7x3 + 512.5x2 − 52.183x + 1.7 | 1 | y = −1523.3x3 + 532.5x2 − 53.617x + 1.7 | 1 |
| 70 | Exponential | y = 6.3134e−12.57x | 0.8086 | y = 6.2226e−13.23x | 0.8201 |
| 70 | Linear | y = −61.549x + 10.208 | 0.4969 | y = −61.989x + 10.174 | 0.4976 |
| 70 | Polynomial (grad 2) | y = 932.09x2 − 254.62x + 14.868 | 0.9062 | y = 934.64x2 − 255.59x + 14.847 | 0.9038 |
| 70 | Polynomial (grad 3) | y = −13830x3 + 4892.5x2 − 501.05x + 16 | 1 | y = −14,090x3 + 4969.5x2 − 506.65x + 16 | 1 |
Table 9.
Corrosion rate equations (y) as a function of temperature, HCl content of the solution (10%), and the amount of antacid additive used (x,%).
Table 9.
Corrosion rate equations (y) as a function of temperature, HCl content of the solution (10%), and the amount of antacid additive used (x,%).
| Test Temperature, °C | Equation Type | Corrosion Rate Regression Equation (y) Depending on the Amount of Additive Used (x,% Alkyl Phenol) | R2 | Corrosion Rate Regression Equation (y) Depending on the Amount of Additive Used (% Undistilled Polyamide) | R2 |
|---|---|---|---|---|---|
| 25 | Exponential | 0.2804e−15.03x | 0.8508 | 0.2763e−11.76x | 0.7857 |
| 25 | Linear | y = −2.753x + 0.4445 | 0.5039 | y = −2.6583x + 0.4466 | 0.4906 |
| 25 | Polynomial (grad 2) | y = 40.628x2 − 11.169x + 0.6476 | 0.898 | y = 40.382x2 − 11.023x + 0.6485 | 0.8972 |
| 25 | Polynomial (grad 3) | y = −640.43x3 + 224.02x2 − 22.58x + 0.7 | 1 | y = −629.33x3 + 220.6x2 − 22.237x + 0.7 | 1 |
| 40 | Exponential | 0.9201e−11.8x | 0.7661 | y = 1.2954e−12.86x | 0.826 |
| 40 | Linear | y = −11.296x + 1.8512 | 0.467 | y = −11.546x + 1.9268 | 0.5124 |
| 40 | Polynomial (grad 2) | y = 178.94x2 − 48.363x + 2.7459 | 0.888 | y = 169.82x2 − 46.723x + 2.7759 | 0.9105 |
| 40 | Polynomial (grad 3) | y = −2860.7x3 + 998.15x2 − 99.336x + 2.98 | 1 | y = −2494.7x3 + 884.2x2 − 91.173x + 2.98 | 1 |
| 70 | Exponential | 18.539e−11.05x | 0.8144 | 18.277e−12.18x | 0.8502 |
| 70 | Linear | y = −136.77x + 24.169 | 0.5386 | y = −140.42x + 24.194 | 0.5505 |
| 70 | Polynomial (grad 2) | y = 1923.2x2 − 535.16x + 33.785 | 0.9211 | y = 1976.8x2 − 549.9x + 34.078 | 0.9424 |
| 70 | Polynomial (grad 3) | y = −27,067x3 + 9674.2x2 − 1017.4x + 36 | 1 | y = −23,490x3 + 8703.5x2 − 968.45x + 36 | 1 |
Table 10.
Corrosion rate equations (y) as a function of temperature, HCl content of the solution (15%), and the amount of antacid additive used (x,%).
Table 10.
Corrosion rate equations (y) as a function of temperature, HCl content of the solution (15%), and the amount of antacid additive used (x,%).
| Test Temperature, °C | Equation Type | Corrosion Rate Regression Equation (y) Depending on the Amount of Additive Used (x,% Alkyl Phenol) | R2 | Corrosion Rate Regression Equation (y) Depending on the Amount of Additive Used (% Undistilled Polyamide) | R2 |
|---|---|---|---|---|---|
| 25 | Exponential | y = 0.5804e−13.16x | 0.8203 | y = 0.5221e−14.14x | 0.8273 |
| 25 | Linear | y = −5.8109x + 0.9542 | 0.4978 | y = −5.844x + 0.9406 | 0.4885 |
| 25 | Polynomial (grad 2) | y = 87.991x2 − 24.038x + 1.3942 | 0.9077 | y = 89.282x2 − 24.338x + 1.387 | 0.898 |
| 25 | Polynomial (grad 3) | y = −1293.7x3 + 458.45x2 − 47.088x + 1.5 | 1 | y = −1381x3 + 484.75x2 − 48.945x + 1.5 | 1 |
| 40 | Exponential | y = 3.9527e−16.69x | 0.8723 | y = 3.8688e−12.48x | 0.8003 |
| 40 | Linear | y = −40.542x + 6.4402 | 0.5017 | y = −39.194x + 6.482 | 0.4903 |
| 40 | Polynomial (grad 2) | y = 601.02x2 − 165.04x + 9.4453 | 0.8977 | y = 598.09x2 − 163.08x + 9.4725 | 0.9003 |
| 40 | Polynomial (grad 3) | y = −9468.7x3 + 3312.5x2 − 333.75x + 10.22 | 1 | y = −9136.7x3 + 3214.5x2 − 325.88x + 10.22 | 1 |
| 70 | Exponential | y = 38.563e−10.24x | 0.8184 | y = 40.53e−10.69x | 0.8436 |
| 70 | Linear | y = −256.4x + 47.06 | 0.5618 | y = −260.43x + 47.65 | 0.583 |
| 70 | Polynomial (grad 2) | y = 3468.2x2 − 974.81x + 64.401 | 0.9311 | y = 3385.9x2 − 961.8x + 64.58 | 0.937 |
| 70 | Polynomial (grad 3) | y = −46,433x3 + 16,765x2 − 1802.2x + 68.2 | 1 | y = −44,250x3 + 16,057x2 − 1750.2x + 68.2 | 1 |
Publisher’s Note: MDPI stays neutral with regard to jurisdictional claims in published maps and institutional affiliations. |
© 2022 by the authors. Licensee MDPI, Basel, Switzerland. This article is an open access article distributed under the terms and conditions of the Creative Commons Attribution (CC BY) license (https://creativecommons.org/licenses/by/4.0/).
Share and Cite
MDPI and ACS Style
Chis, T.; Sterpu, A.E.; Săpunaru, O.V. The Effect of Corrosion on Crude Oil Distillation Plants. ChemEngineering 2022, 6, 41. https://0-doi-org.brum.beds.ac.uk/10.3390/chemengineering6030041
AMA Style
Chis T, Sterpu AE, Săpunaru OV. The Effect of Corrosion on Crude Oil Distillation Plants. ChemEngineering. 2022; 6(3):41. https://0-doi-org.brum.beds.ac.uk/10.3390/chemengineering6030041
Chicago/Turabian StyleChis, Timur, Ancaelena Eliza Sterpu, and Olga Valerica Săpunaru. 2022. "The Effect of Corrosion on Crude Oil Distillation Plants" ChemEngineering 6, no. 3: 41. https://0-doi-org.brum.beds.ac.uk/10.3390/chemengineering6030041