Author Contributions
Conceptualization, T.B. and V.V.; methodology, T.B. and V.V.; validation, T.B., L.B. and I.K.; formal analysis, A.T. (Abdessamad Tiouiouine), M.M., J.O., and S.Y.; investigation, T.B.; resources, A.T. (Amine Talih), H.E.K., H.R., and H.A. data curation, T.B. and V.V.; writing—original draft preparation, T.B. and L.B.; writing—review and editing, L.B. and T.B.; supervision, I.K., N.K. and A.S. All authors have read and agreed to the published version of the manuscript.
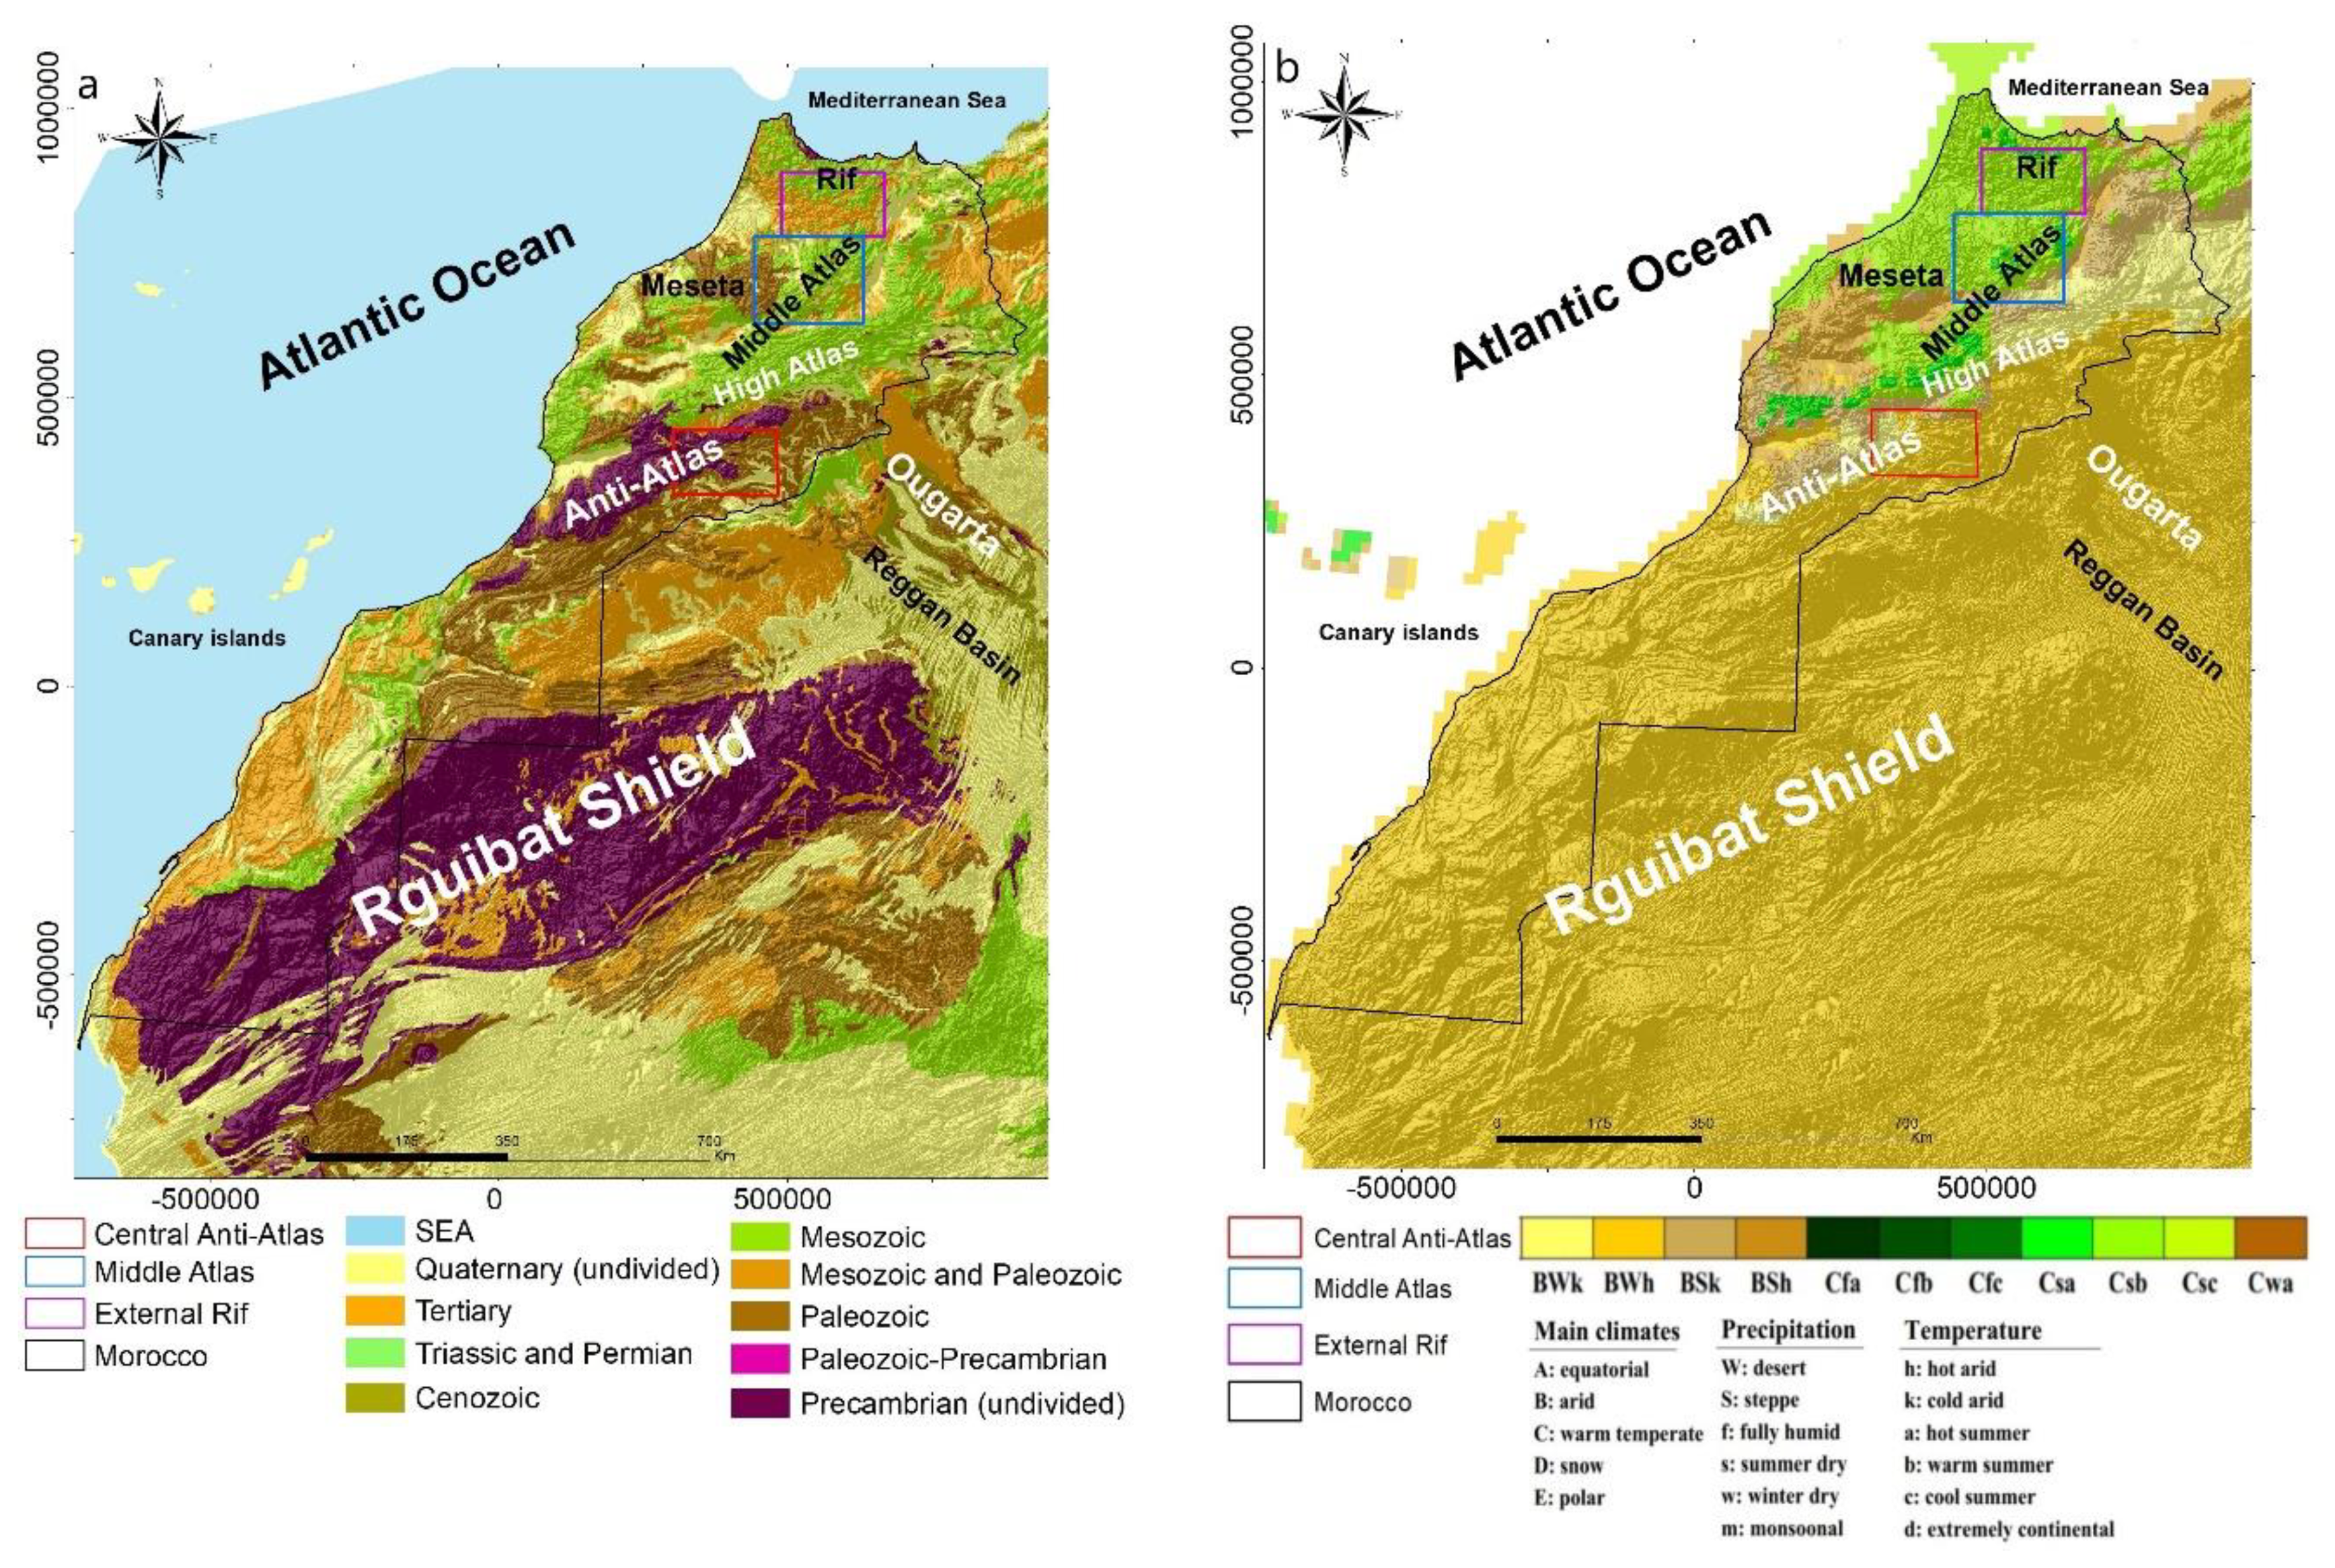
Figure 1.
Location of the three study areas on (
a) the geological context of Morocco provided by the United States Geological Survey (USGS) and modified from Kottek et al. [
15], and (
b) the köppen-geiger climate classification map of Morocco [
16], superimposed on the global hill-shading image, Lambert conformal conic coordinates in m.
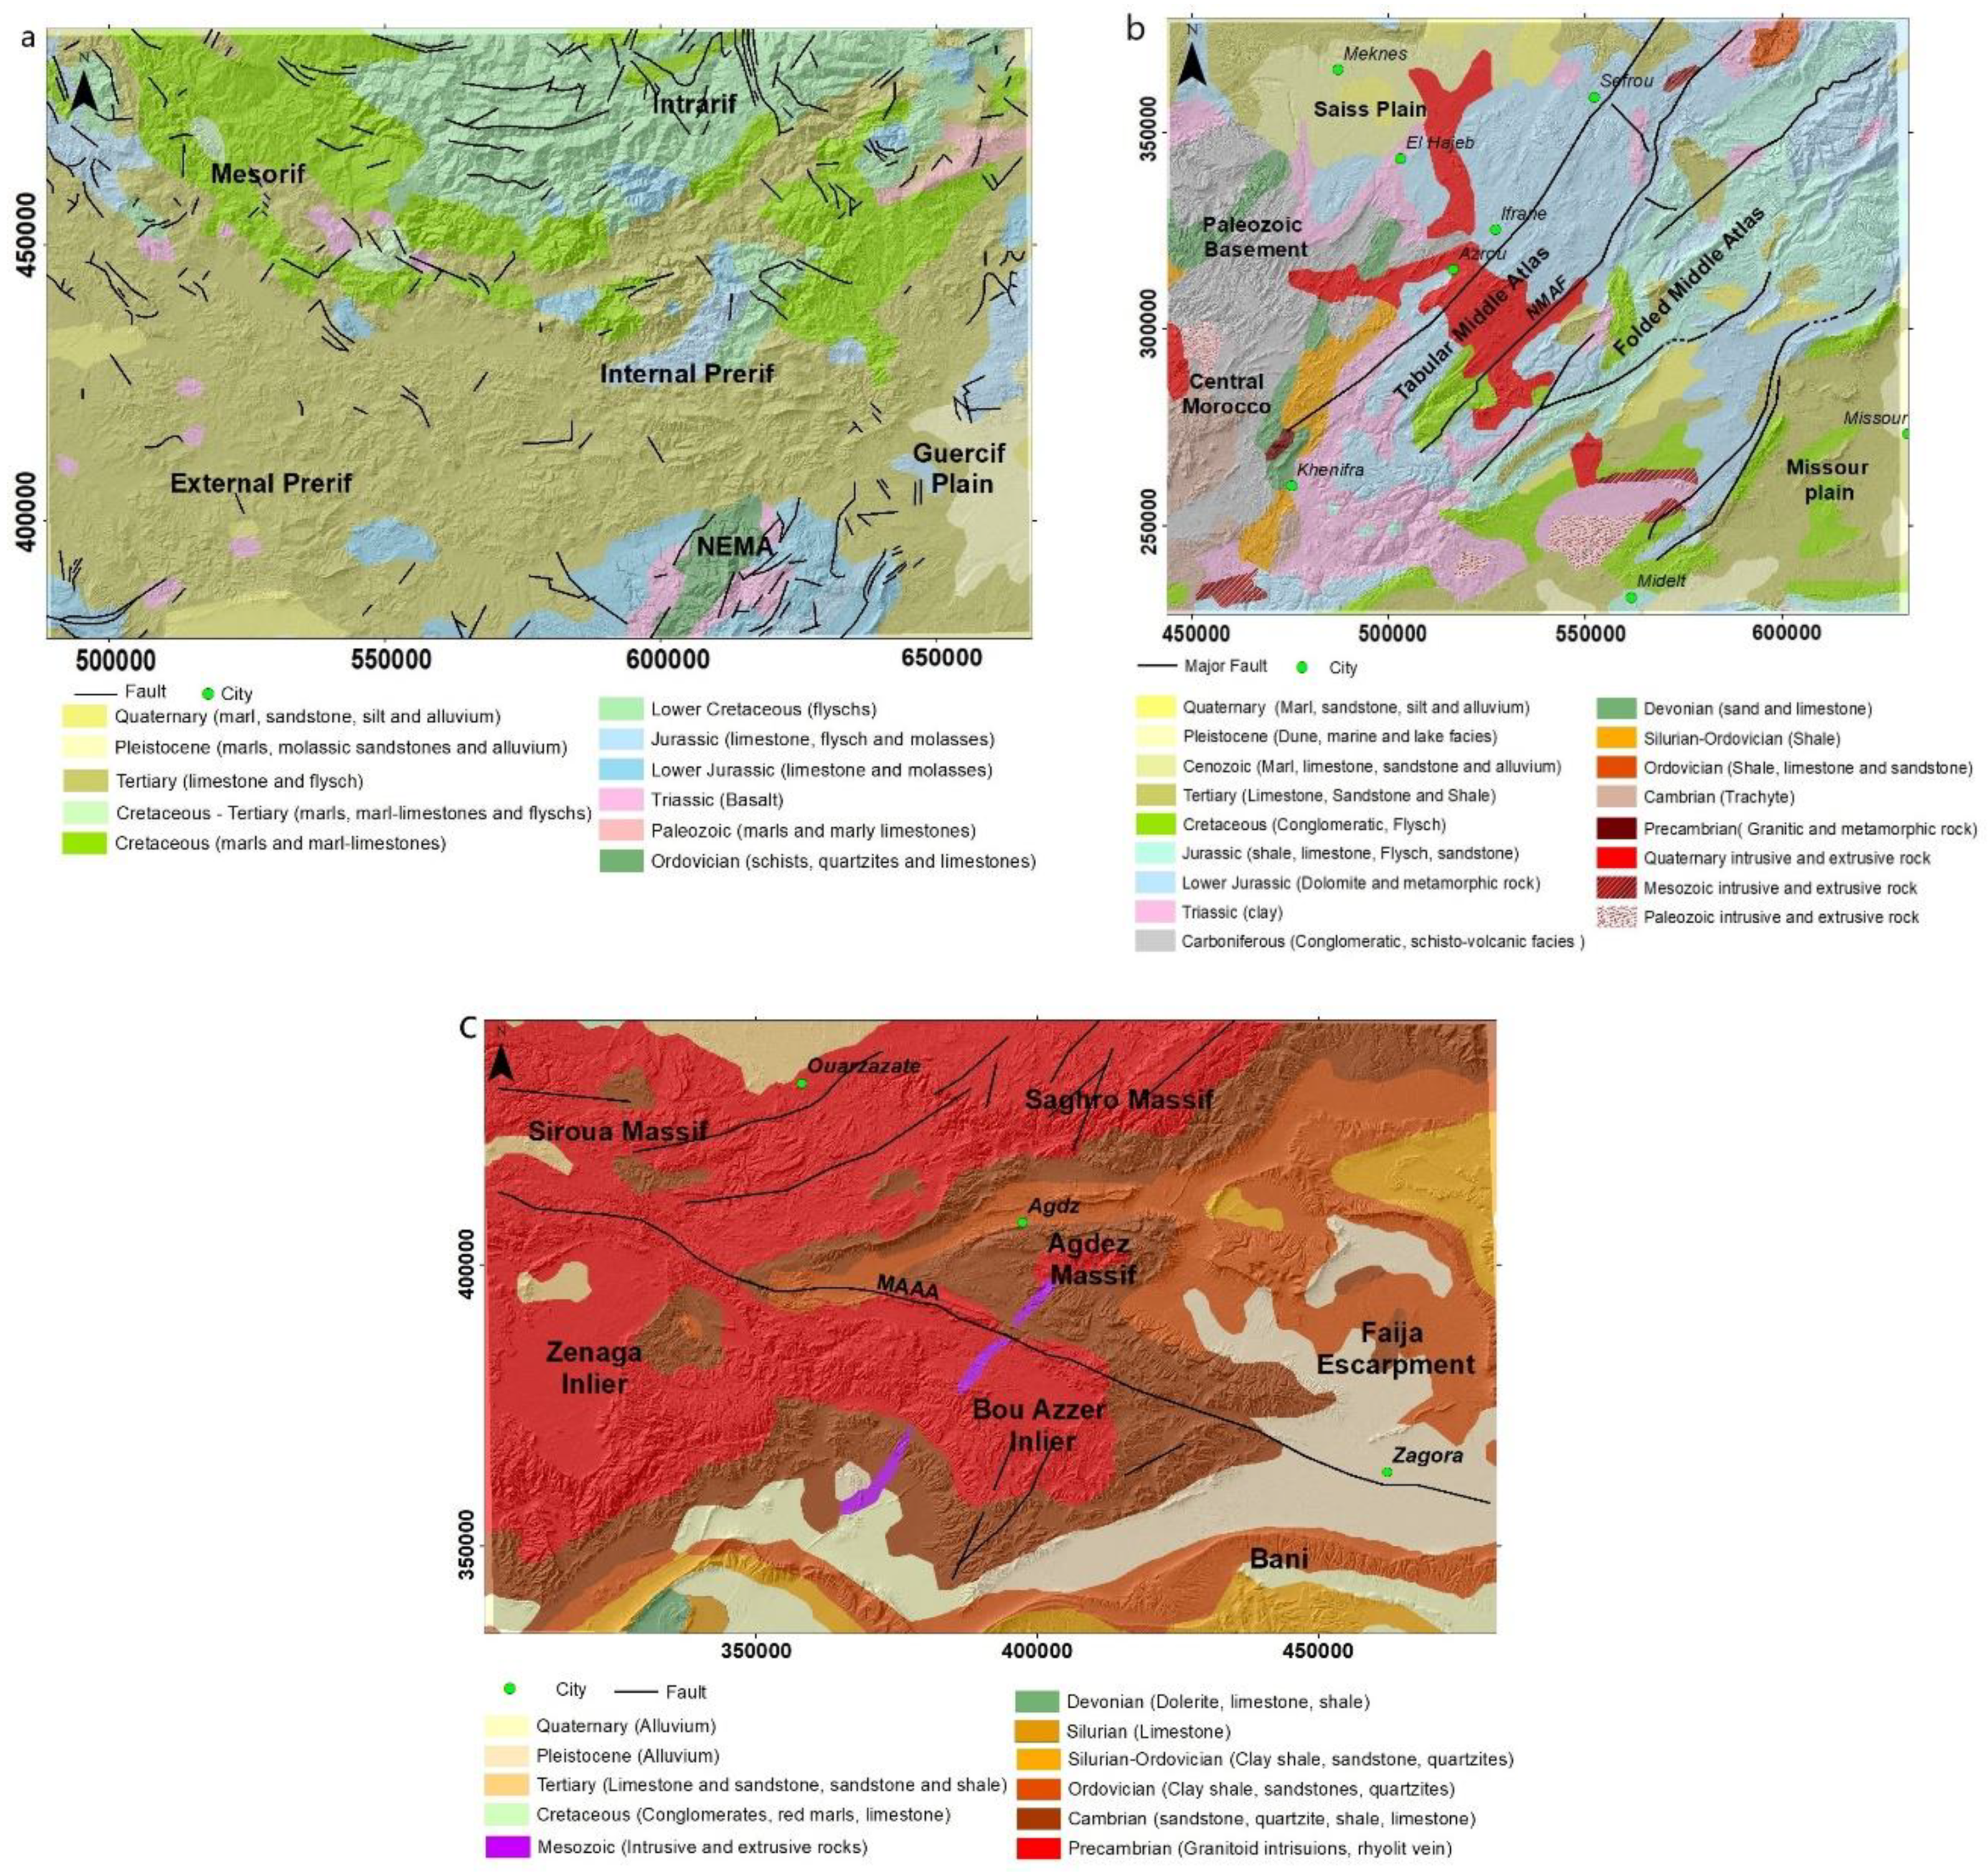
Figure 2.
Geological map of (
a) External Rif, (
b) Middle Atlas, and (
c) Central Anti-Atlas (USGS modified from [
16], Lambert conformal conic coordinates in m.
Figure 2.
Geological map of (
a) External Rif, (
b) Middle Atlas, and (
c) Central Anti-Atlas (USGS modified from [
16], Lambert conformal conic coordinates in m.
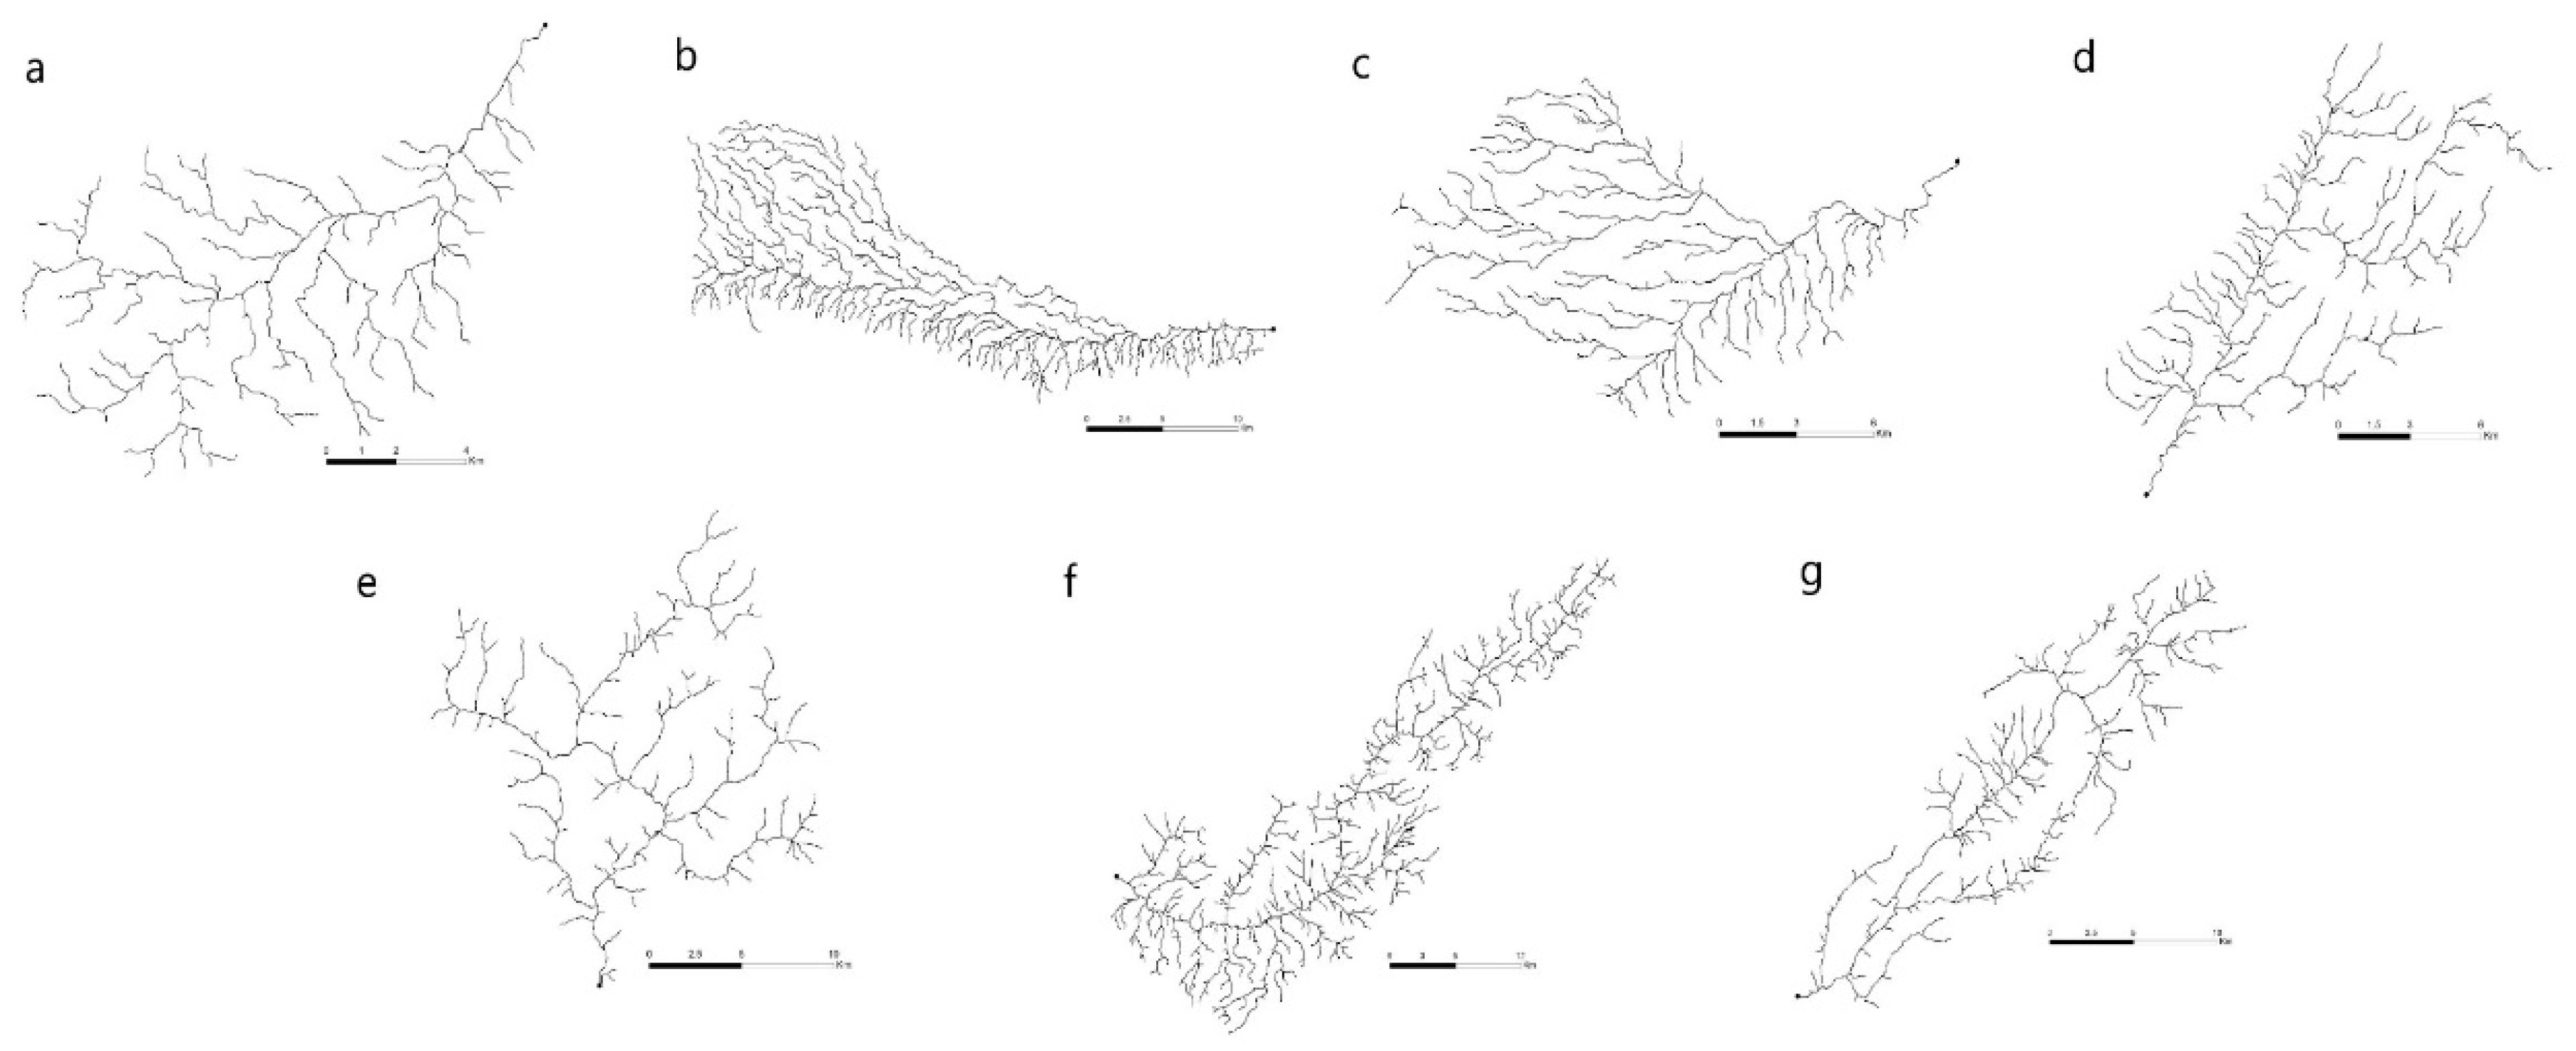
Figure 3.
Example of identified drainage network patterns: (a) dendritic, (b) pinnate, (c) parallel, (d) trellis, (e) rectangular, (f) herringbone, (g) barbed.
Figure 3.
Example of identified drainage network patterns: (a) dendritic, (b) pinnate, (c) parallel, (d) trellis, (e) rectangular, (f) herringbone, (g) barbed.
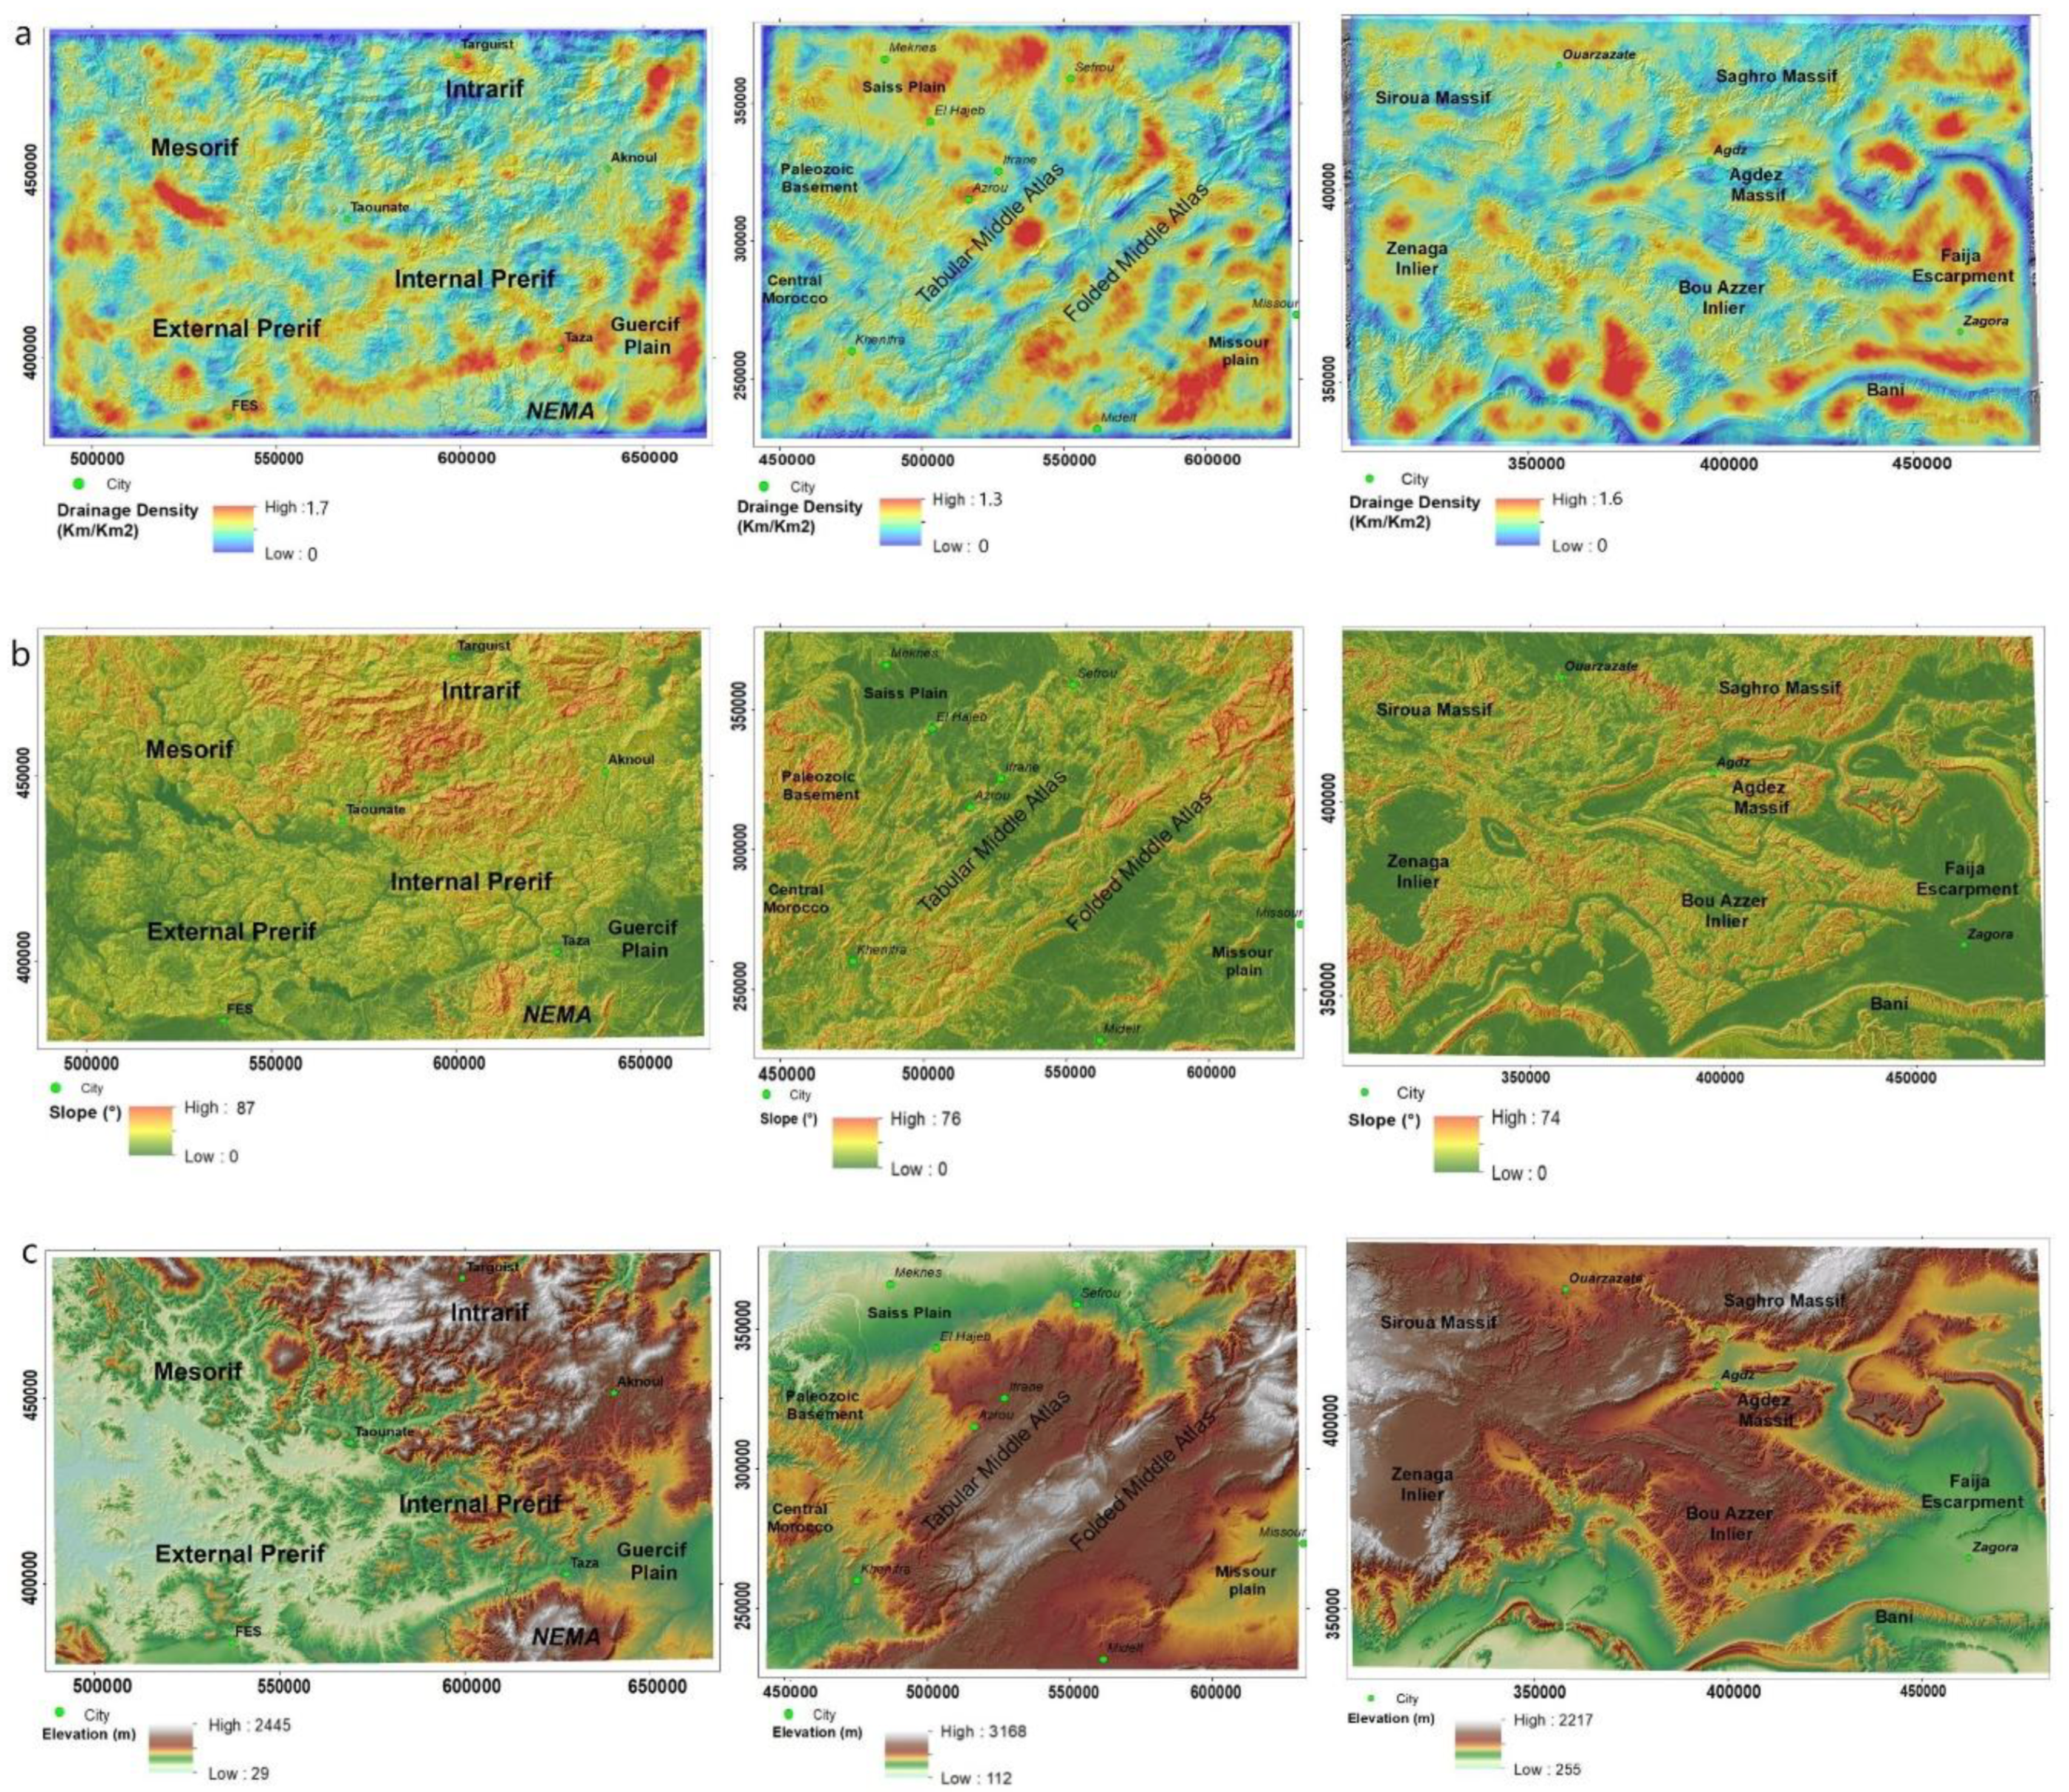
Figure 4.
Spatial distribution of (a) drainage density, (b) slope, and (c) elevation, for, from left to right, the External Rif, the Middle Atlas, and Central Anti-Atlas.
Figure 4.
Spatial distribution of (a) drainage density, (b) slope, and (c) elevation, for, from left to right, the External Rif, the Middle Atlas, and Central Anti-Atlas.
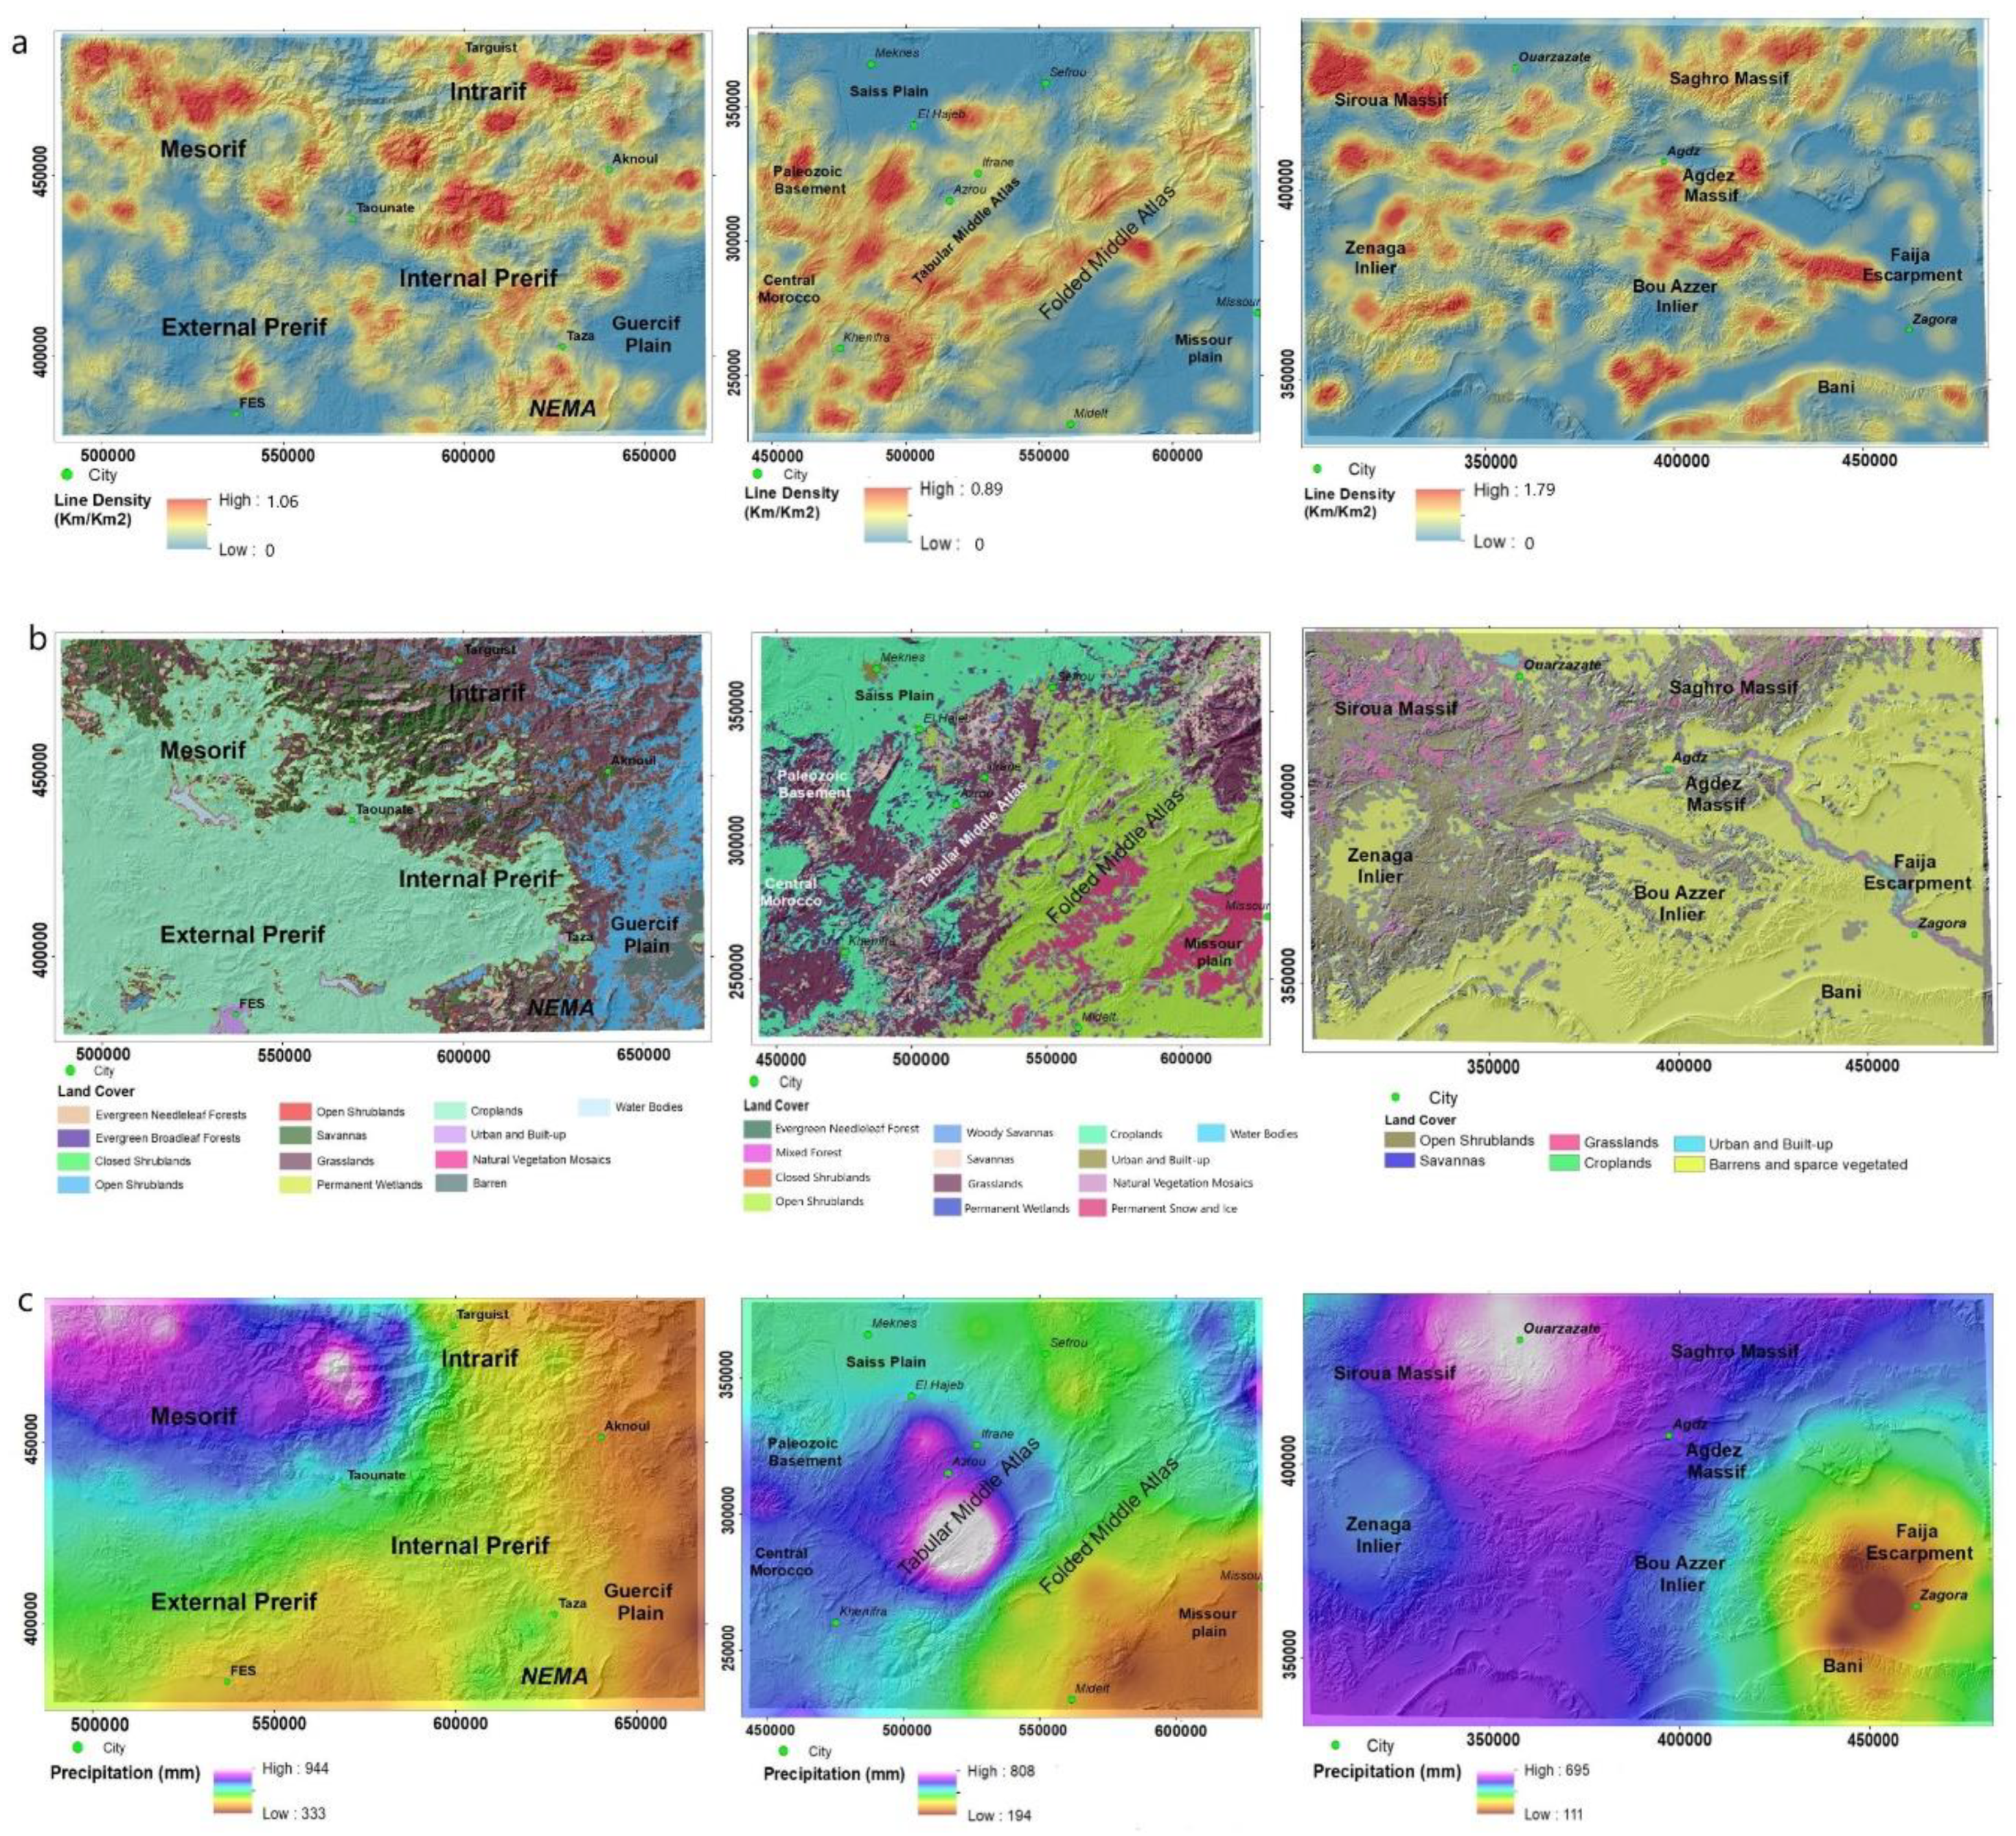
Figure 5.
Spatial distribution of (a) lineament density, (b) land cover, and (c) precipitation, from left to right for the External Rif, the Middle Atlas and Central Anti-Atlas.
Figure 5.
Spatial distribution of (a) lineament density, (b) land cover, and (c) precipitation, from left to right for the External Rif, the Middle Atlas and Central Anti-Atlas.
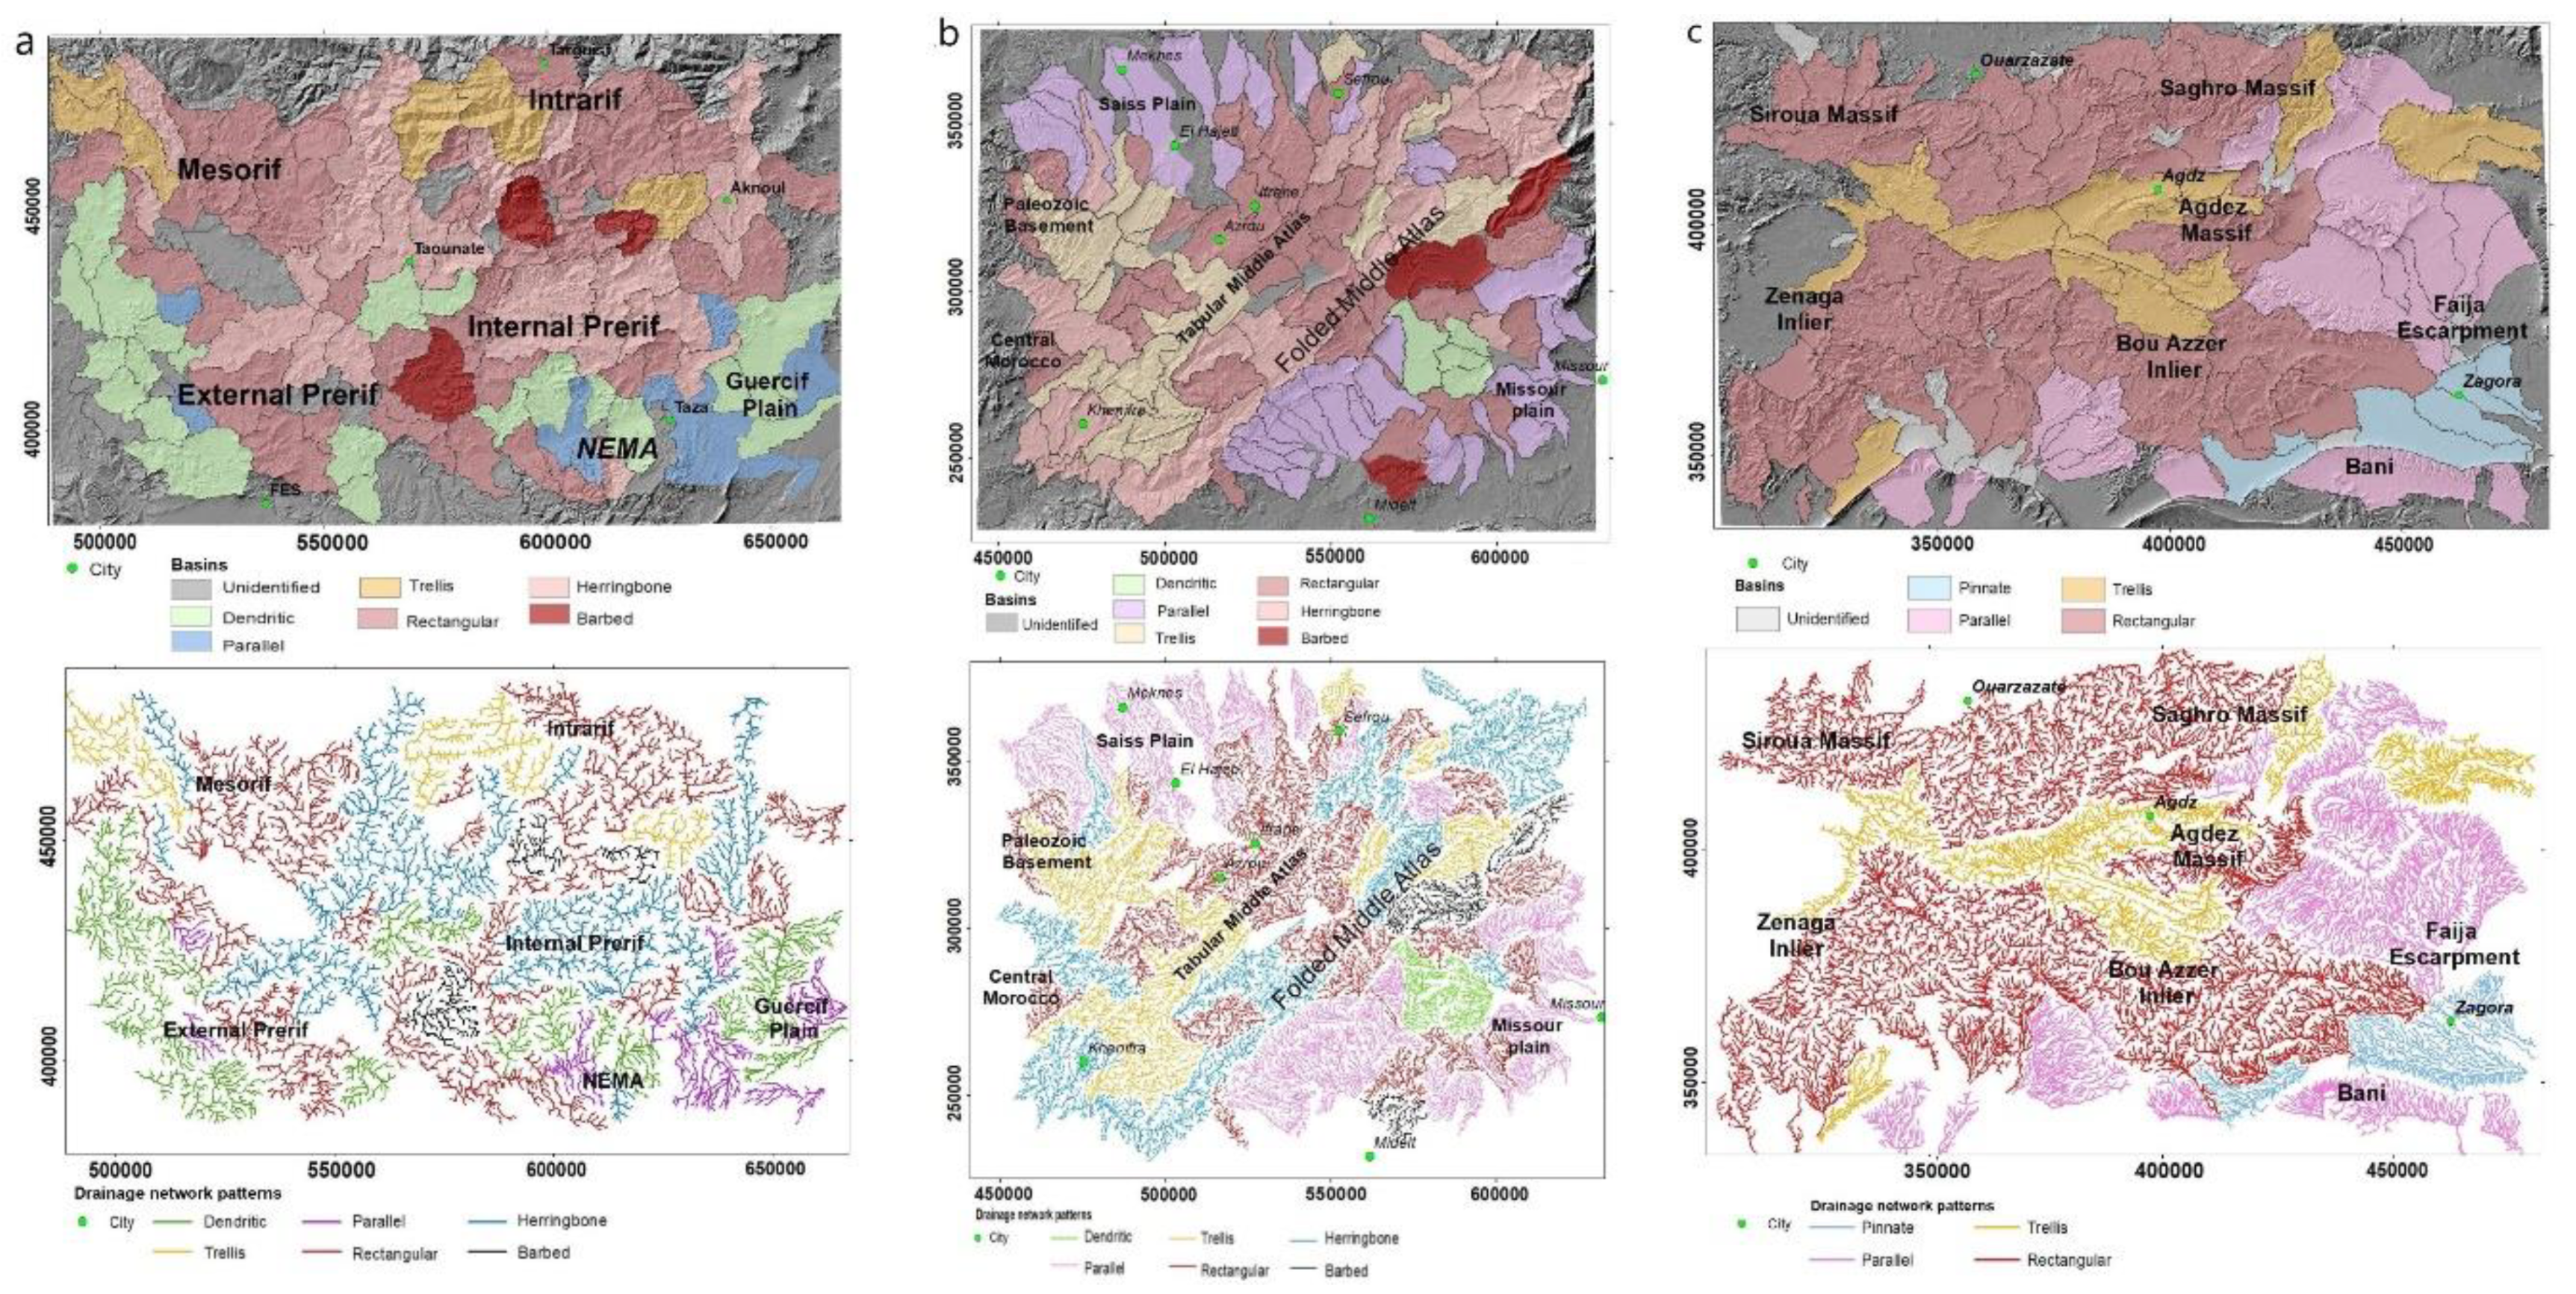
Figure 6.
Spatial distribution of the different drainage network patterns in (a) The external Rif, (b) the Middle Atlas, and (c) the Central Anti-Atlas.
Figure 6.
Spatial distribution of the different drainage network patterns in (a) The external Rif, (b) the Middle Atlas, and (c) the Central Anti-Atlas.
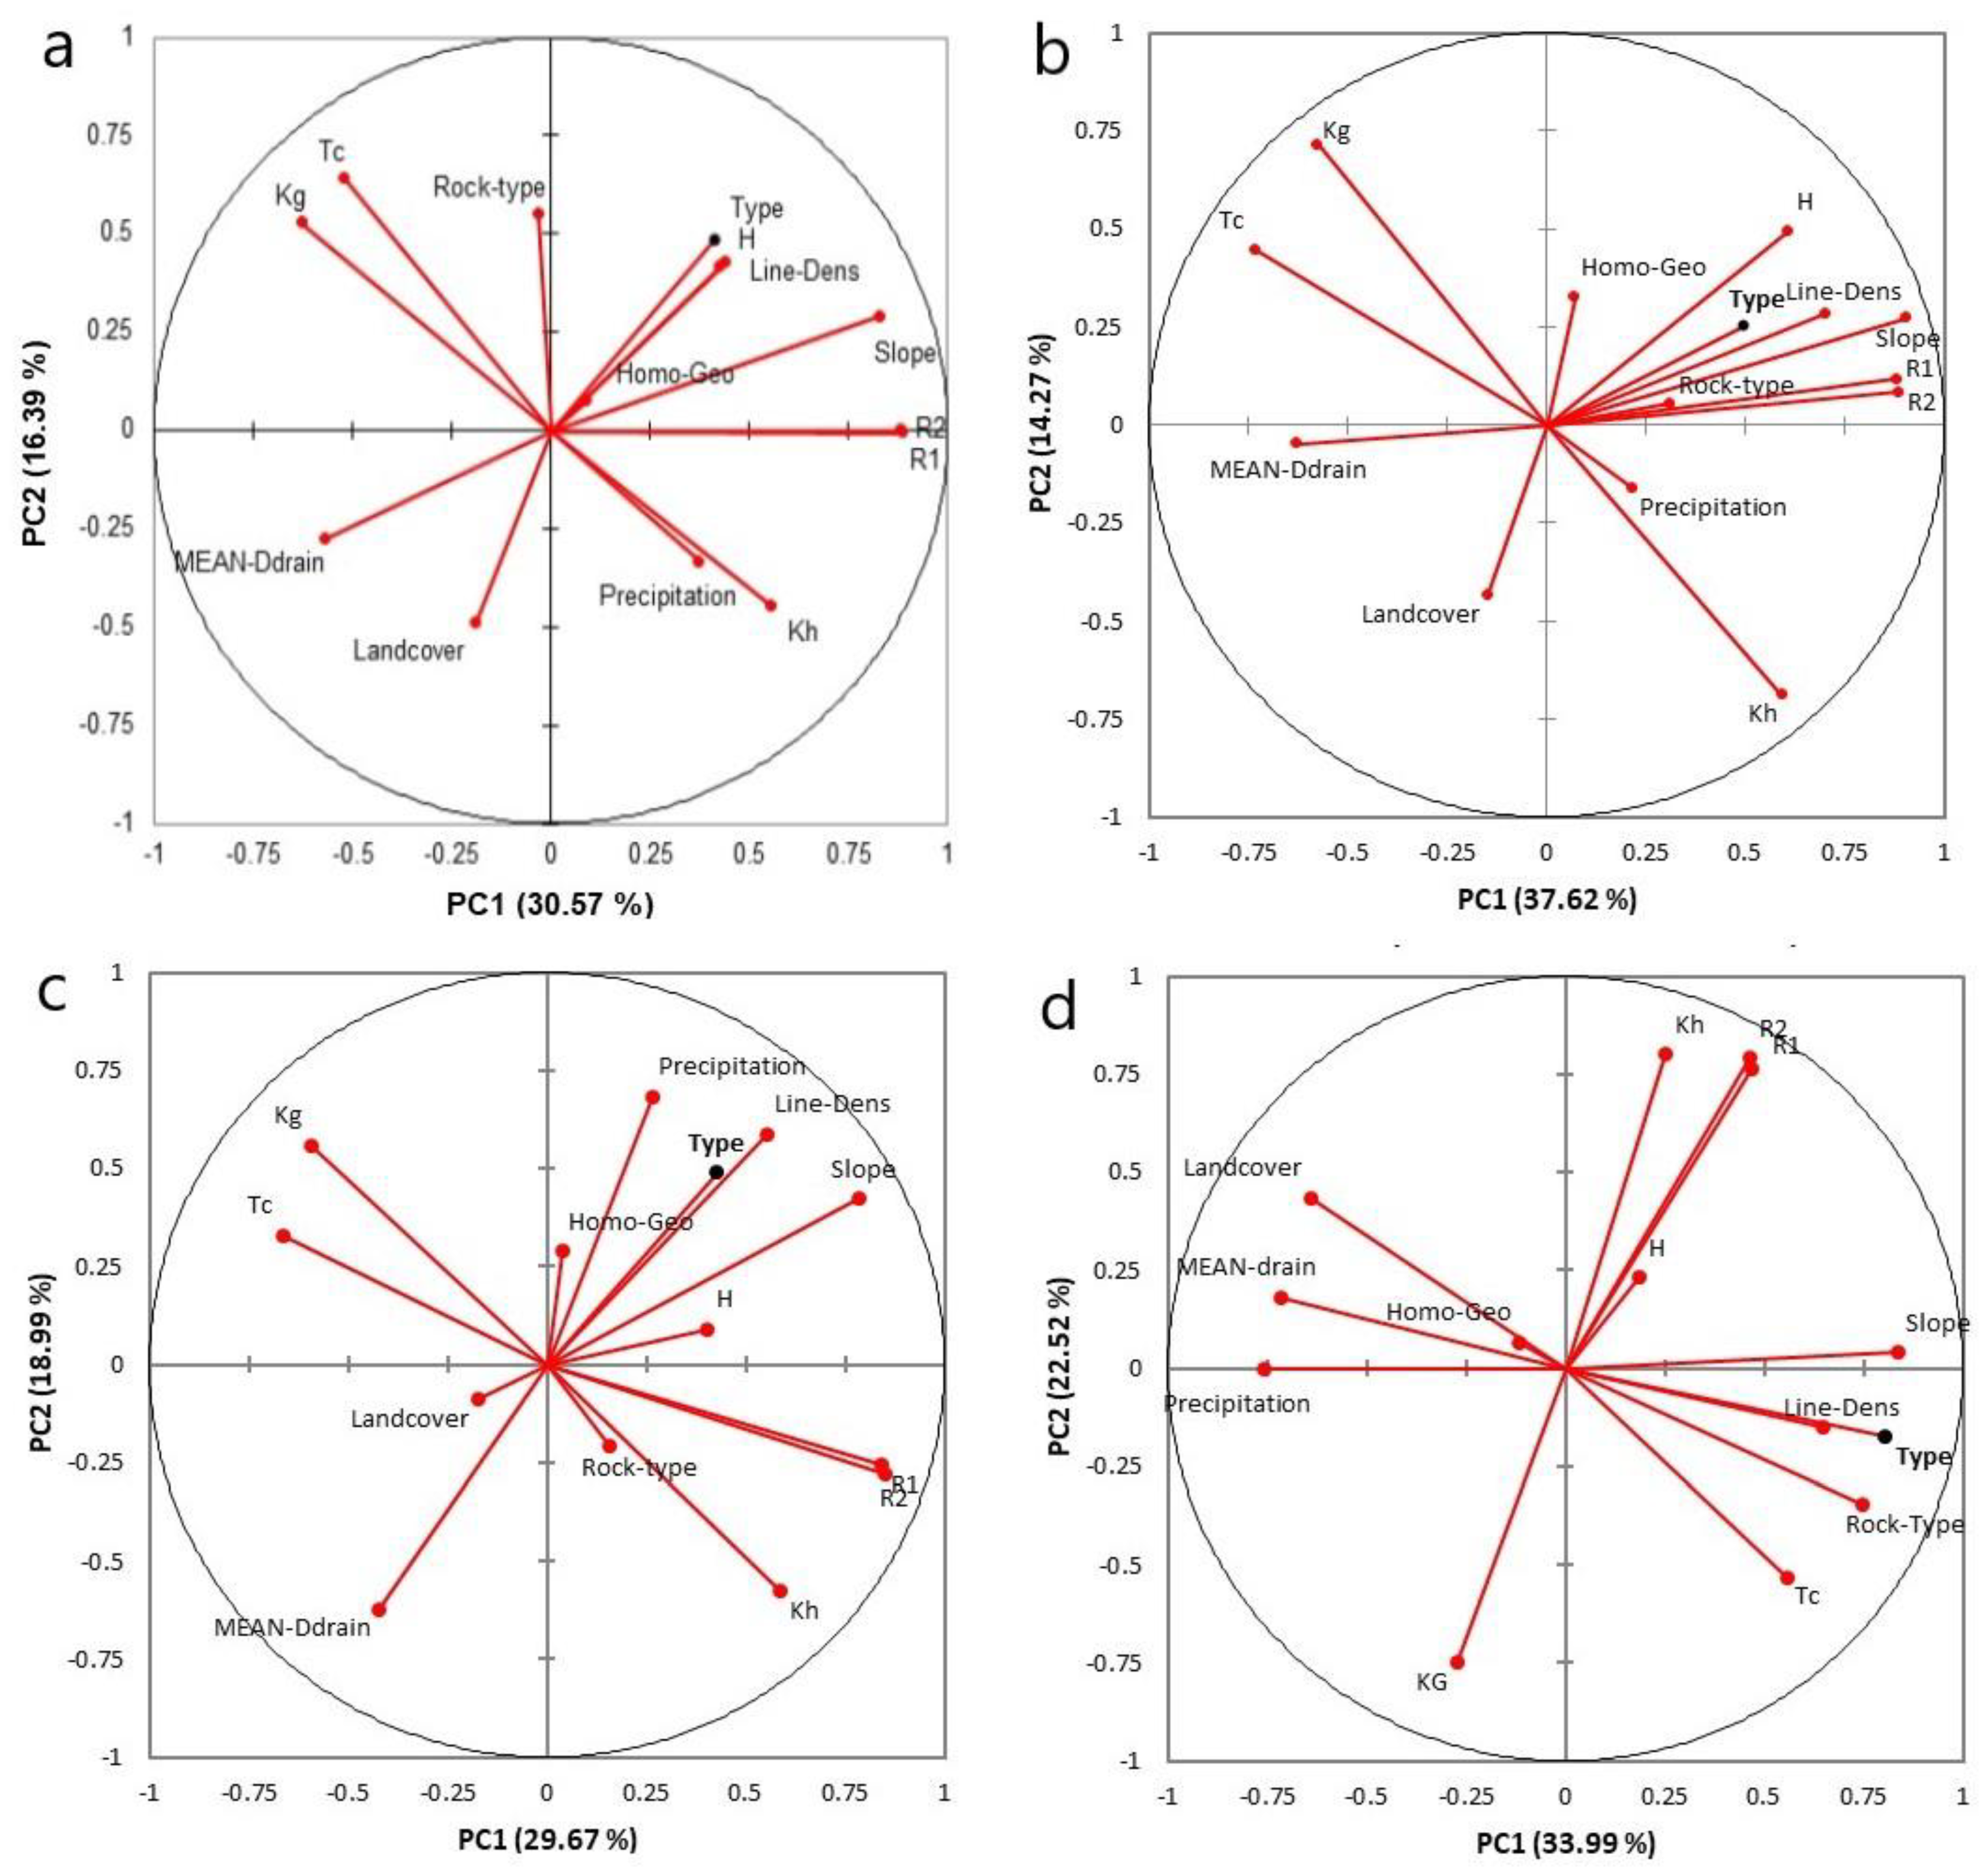
Figure 7.
Distribution of the parameters on the first factorial plan (PC1–PC2), for (a) the total database, (b) the External Rif, (c) the Middle Atlas, and (d) the Central Anti-Atlas.
Figure 7.
Distribution of the parameters on the first factorial plan (PC1–PC2), for (a) the total database, (b) the External Rif, (c) the Middle Atlas, and (d) the Central Anti-Atlas.
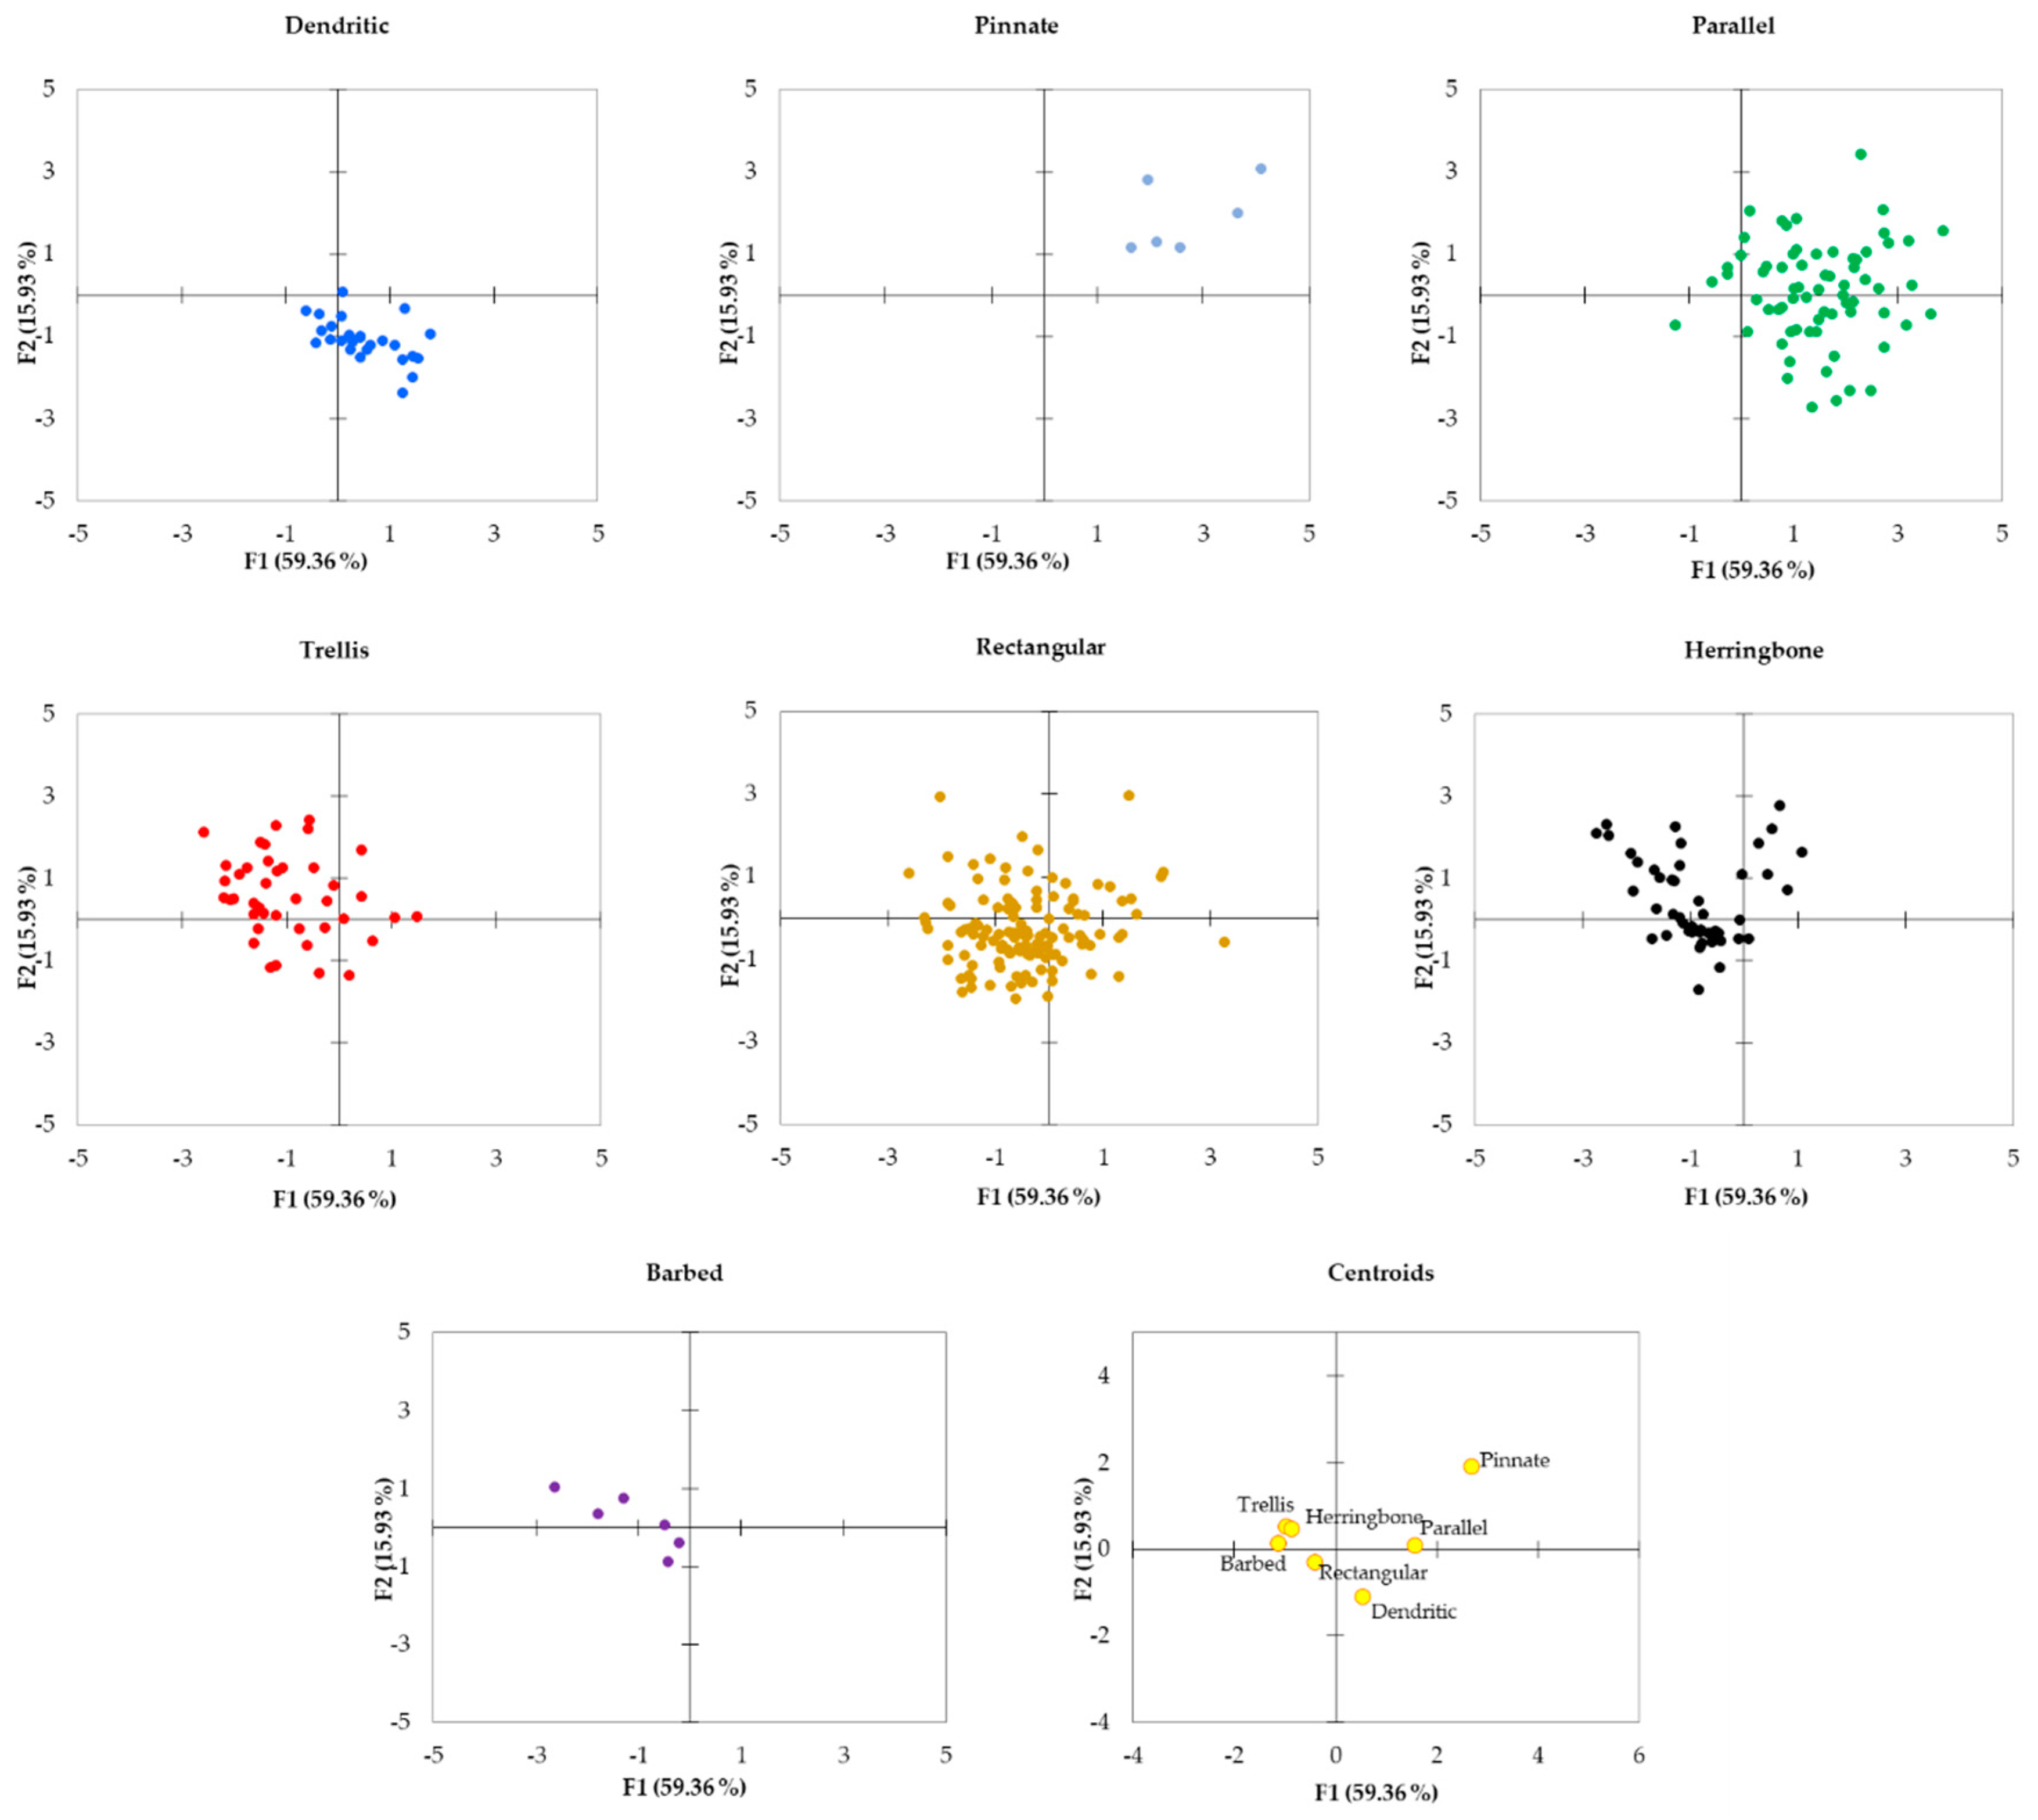
Figure 8.
Distribution of the observations and centroids of each type of drainage network pattern in F1–F2 score plots (0 = Dendritic, 1 = Pinnate, 2 = Parallel, 3 = Trellis, 4 = Rectangular, 5 = Herringbone, 6 = Barbed).
Figure 8.
Distribution of the observations and centroids of each type of drainage network pattern in F1–F2 score plots (0 = Dendritic, 1 = Pinnate, 2 = Parallel, 3 = Trellis, 4 = Rectangular, 5 = Herringbone, 6 = Barbed).
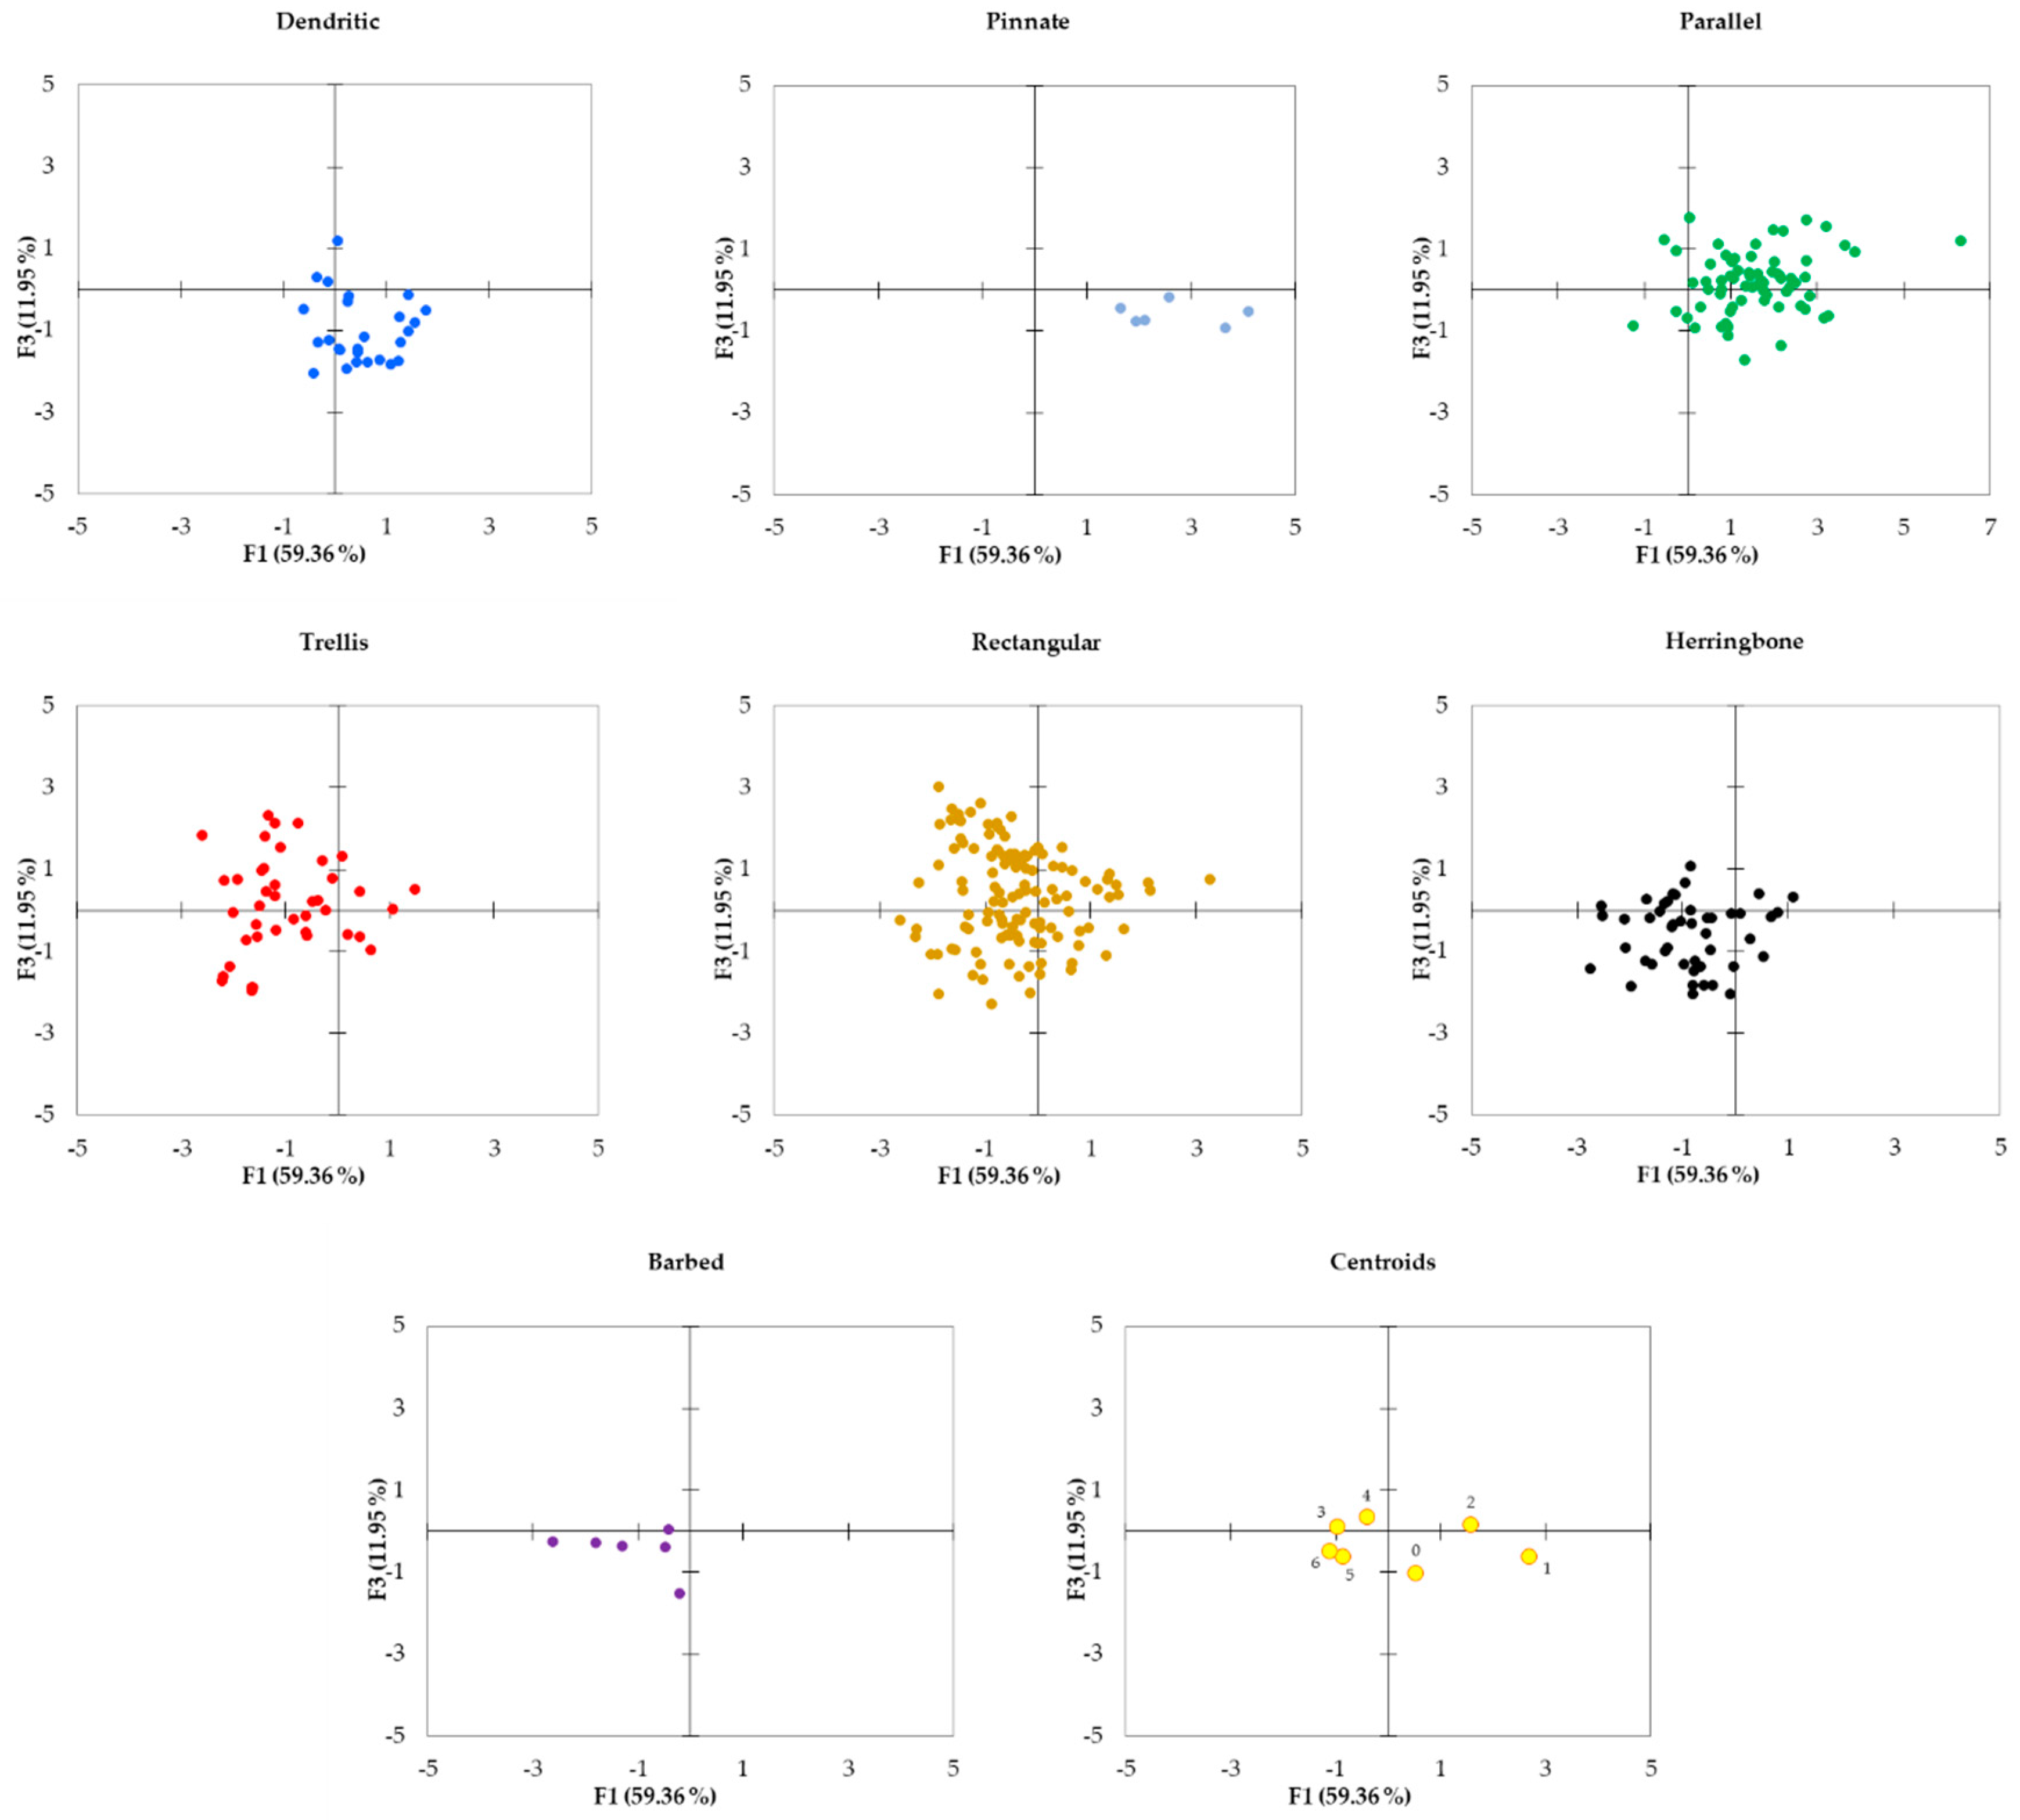
Figure 9.
Distribution of the observations and centroids of each type of drainage network pattern in F1–F3 score plots (0 = Dendritic, 1 = Pinnate, 2 = Parallel, 3 = Trellis, 4 = Rectangular, 5 = Herringbone, 6 = Barbed).
Figure 9.
Distribution of the observations and centroids of each type of drainage network pattern in F1–F3 score plots (0 = Dendritic, 1 = Pinnate, 2 = Parallel, 3 = Trellis, 4 = Rectangular, 5 = Herringbone, 6 = Barbed).
Figure 10.
Distribution of the observations and centroids of each type of drainage network pattern in F1–F2 and F1–F3 score plots of the External Rif (a,b), Middle Atlas (c,d), and the Central Anti-Atlas (e,f). (0 = Dendritic, 1 = Pinnate, 2 = Parallel, 3 = Trellis, 4 = Rectangular, 5 = Herringbone, 6 = Barbed).
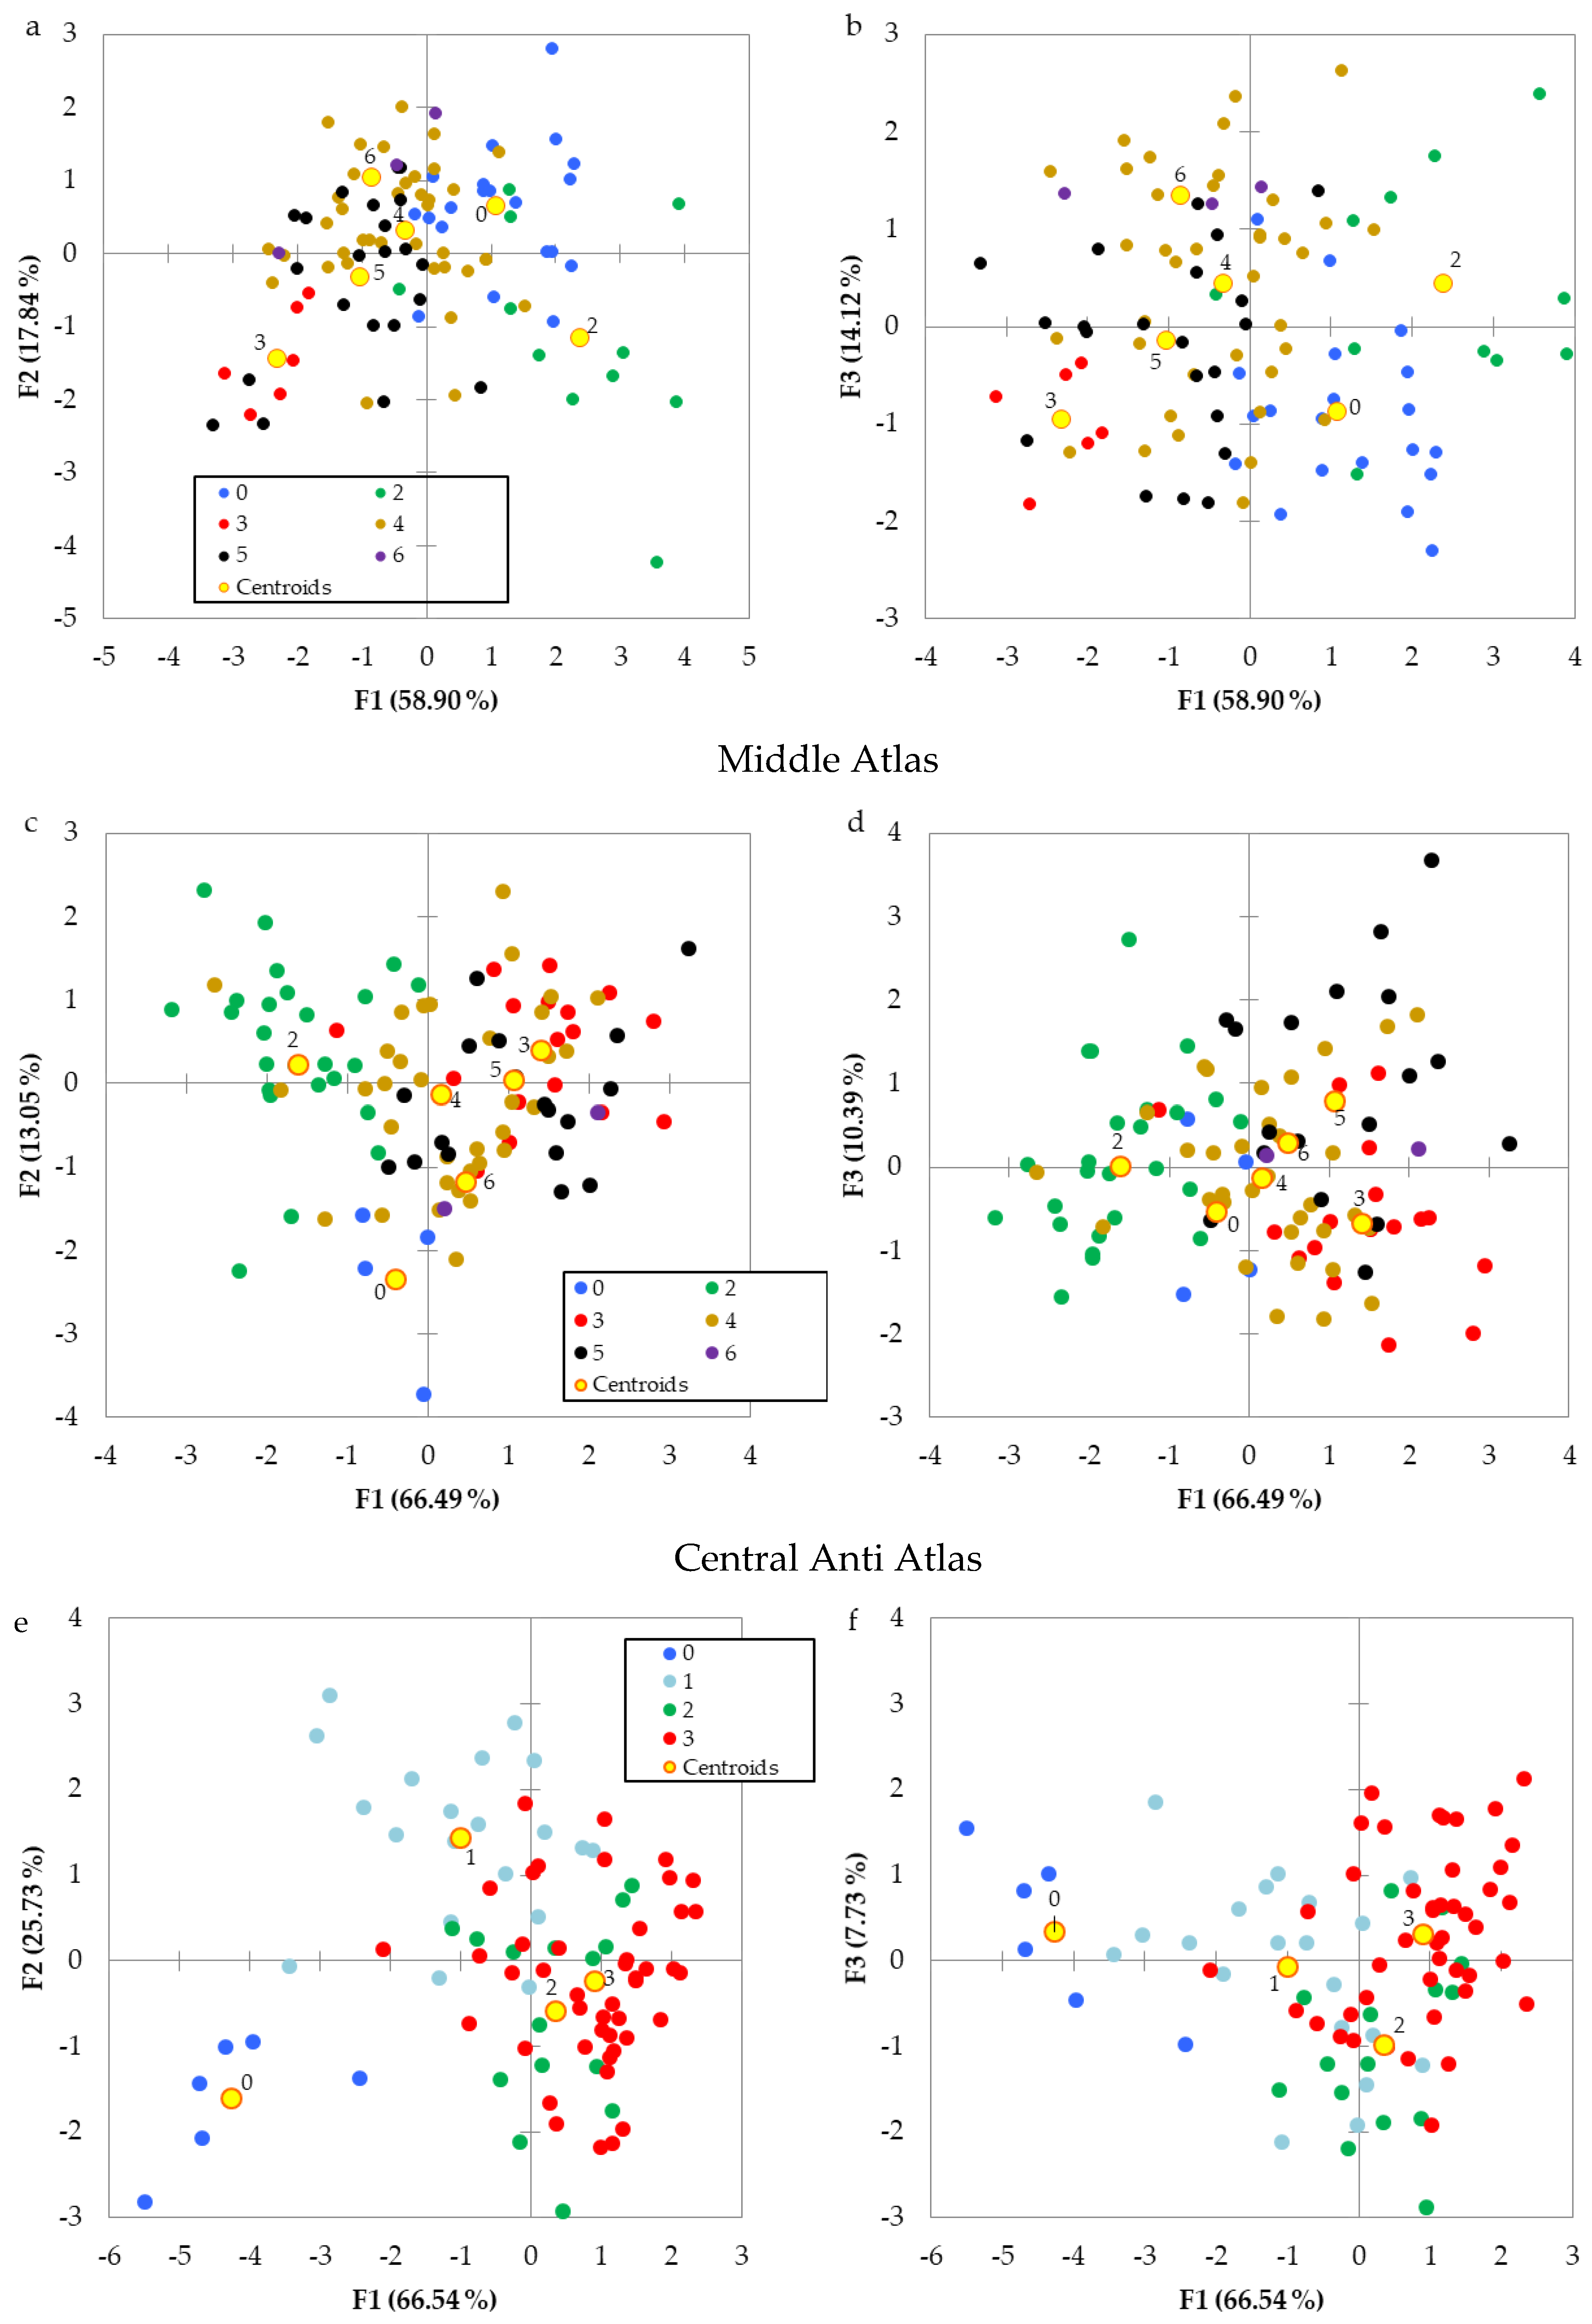
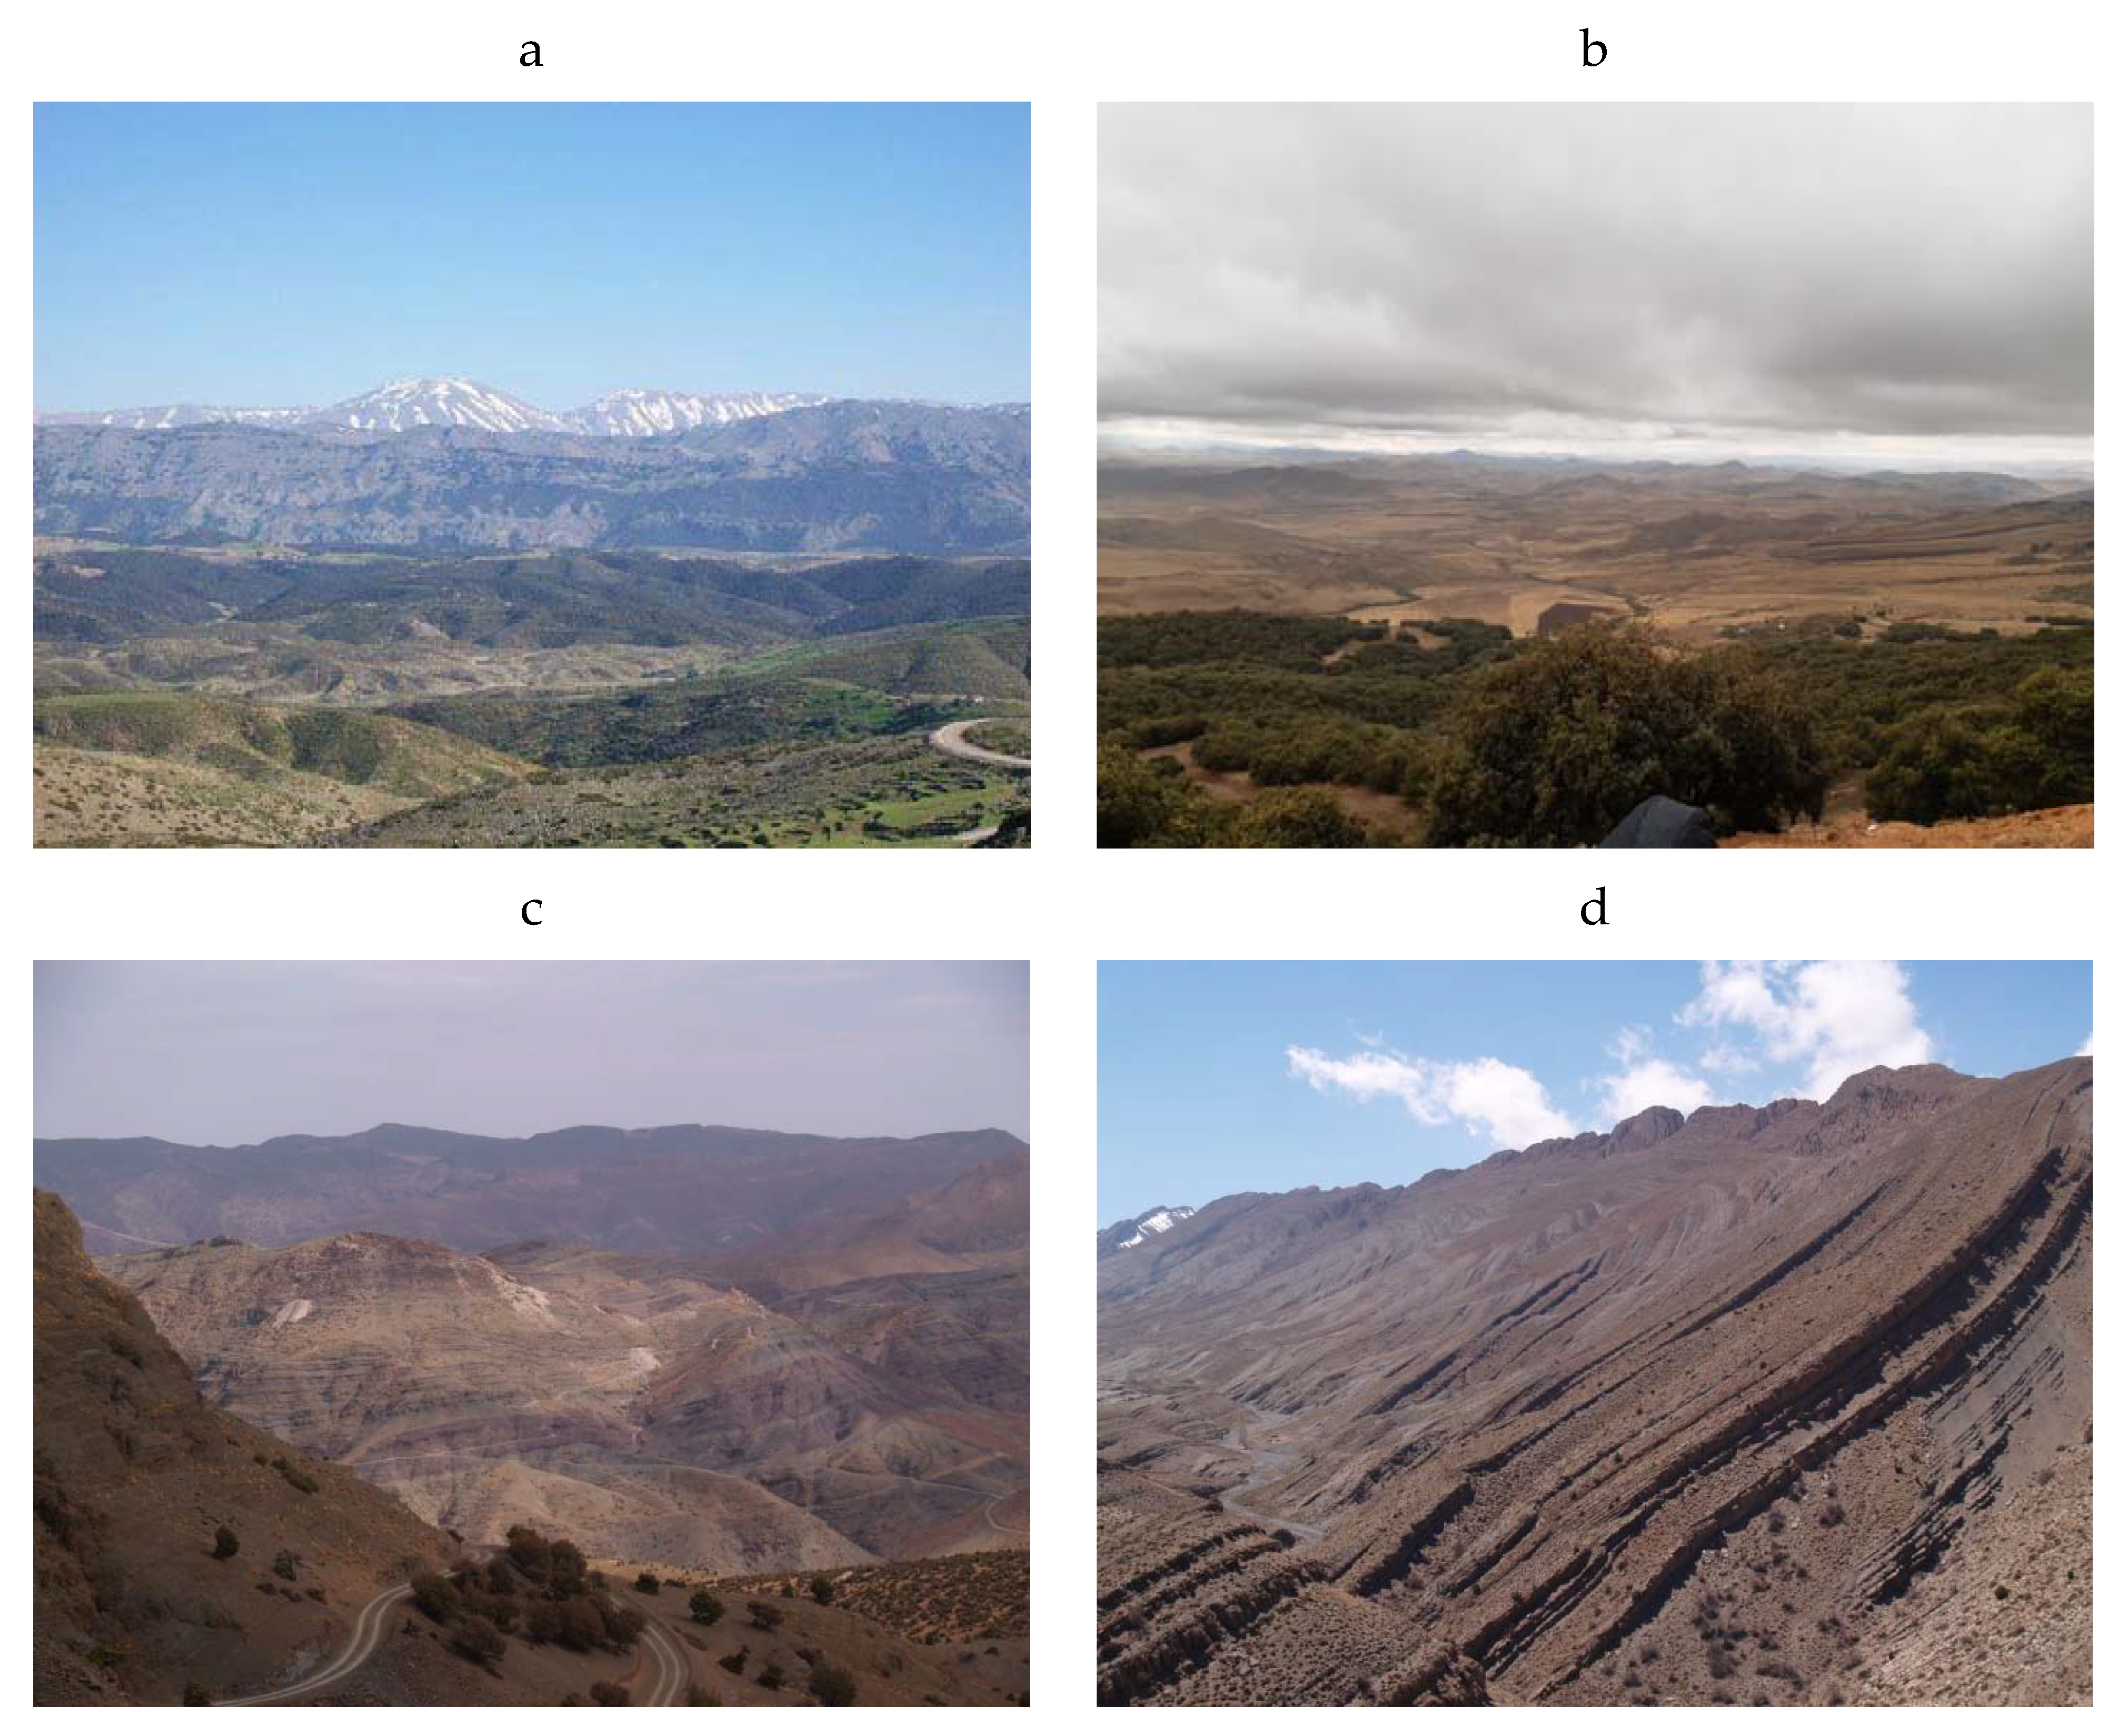
Figure 11.
Observation of (a) the western side of the Folded Middle Atlas reliefs, in Northeast Middle Atlas, and (b) the relief of the Tabular Middle Atlas, (c) The Precambrian formation of the Lit-de-vin series and (d) Cambro-Odovician limits of the Bou Azzer inlier in the Central Anti-Atlas region.
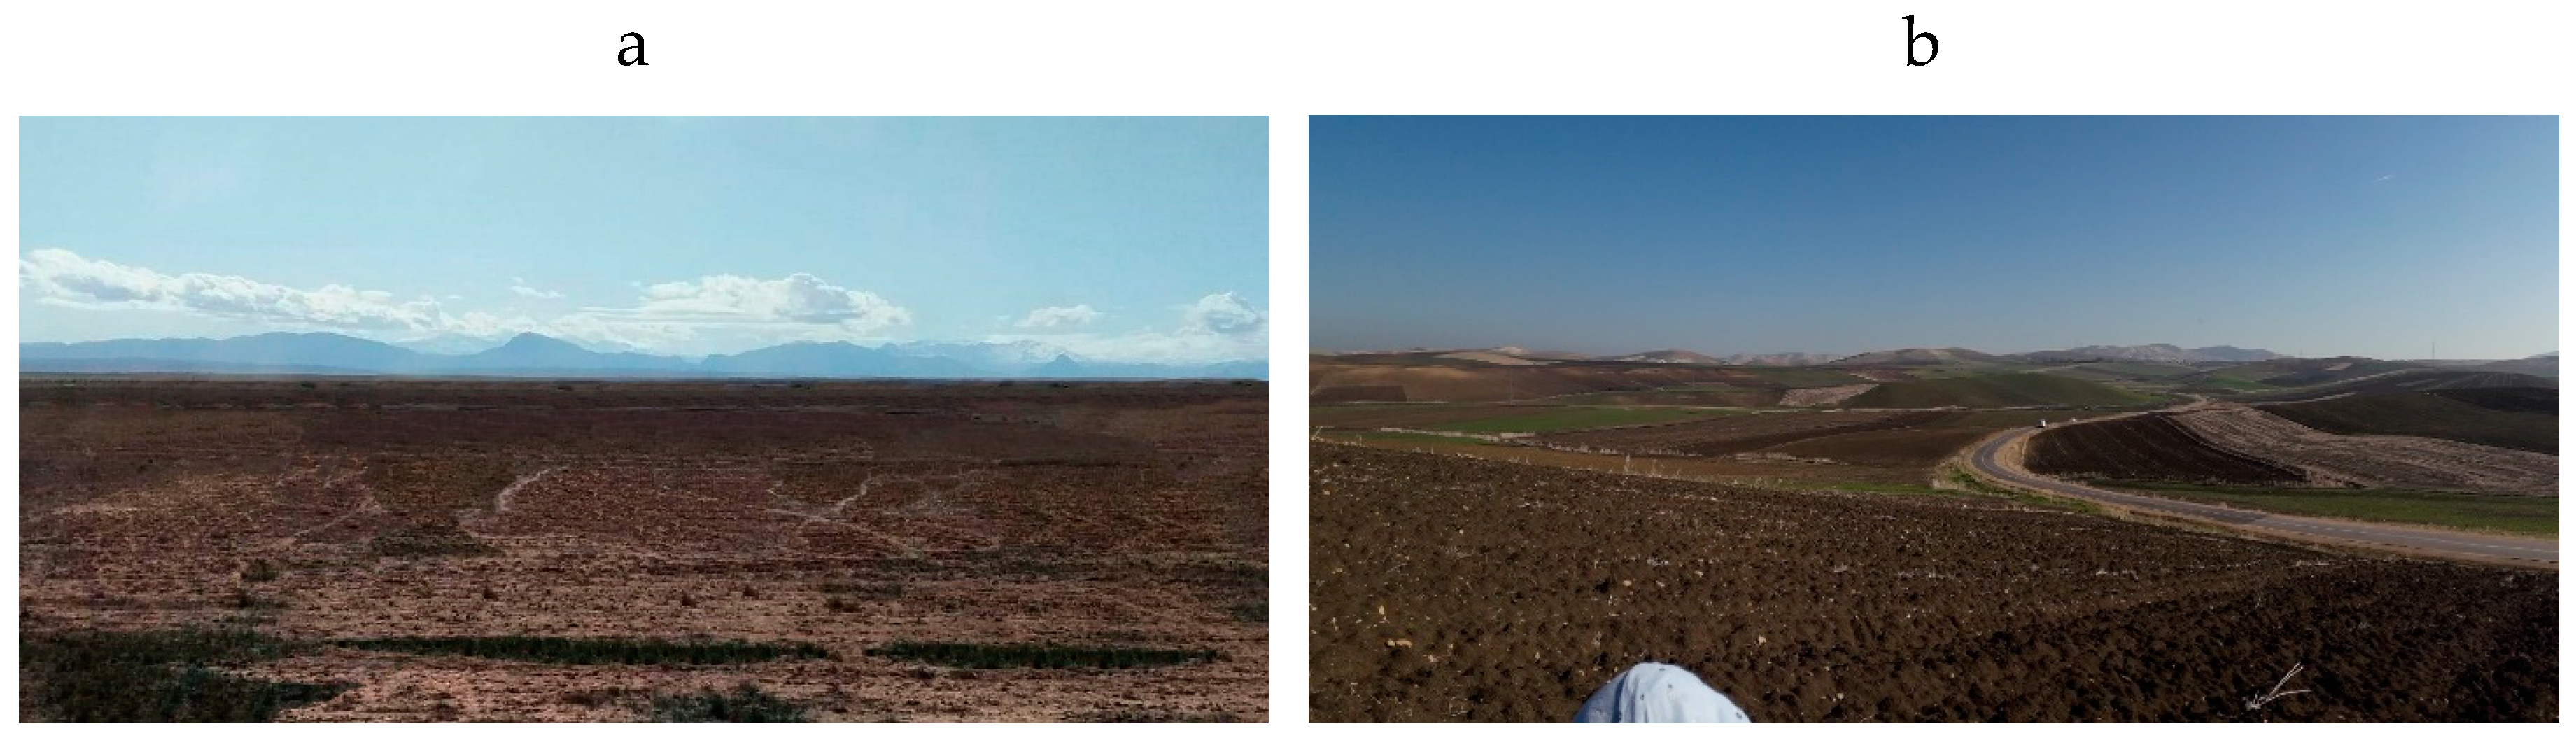
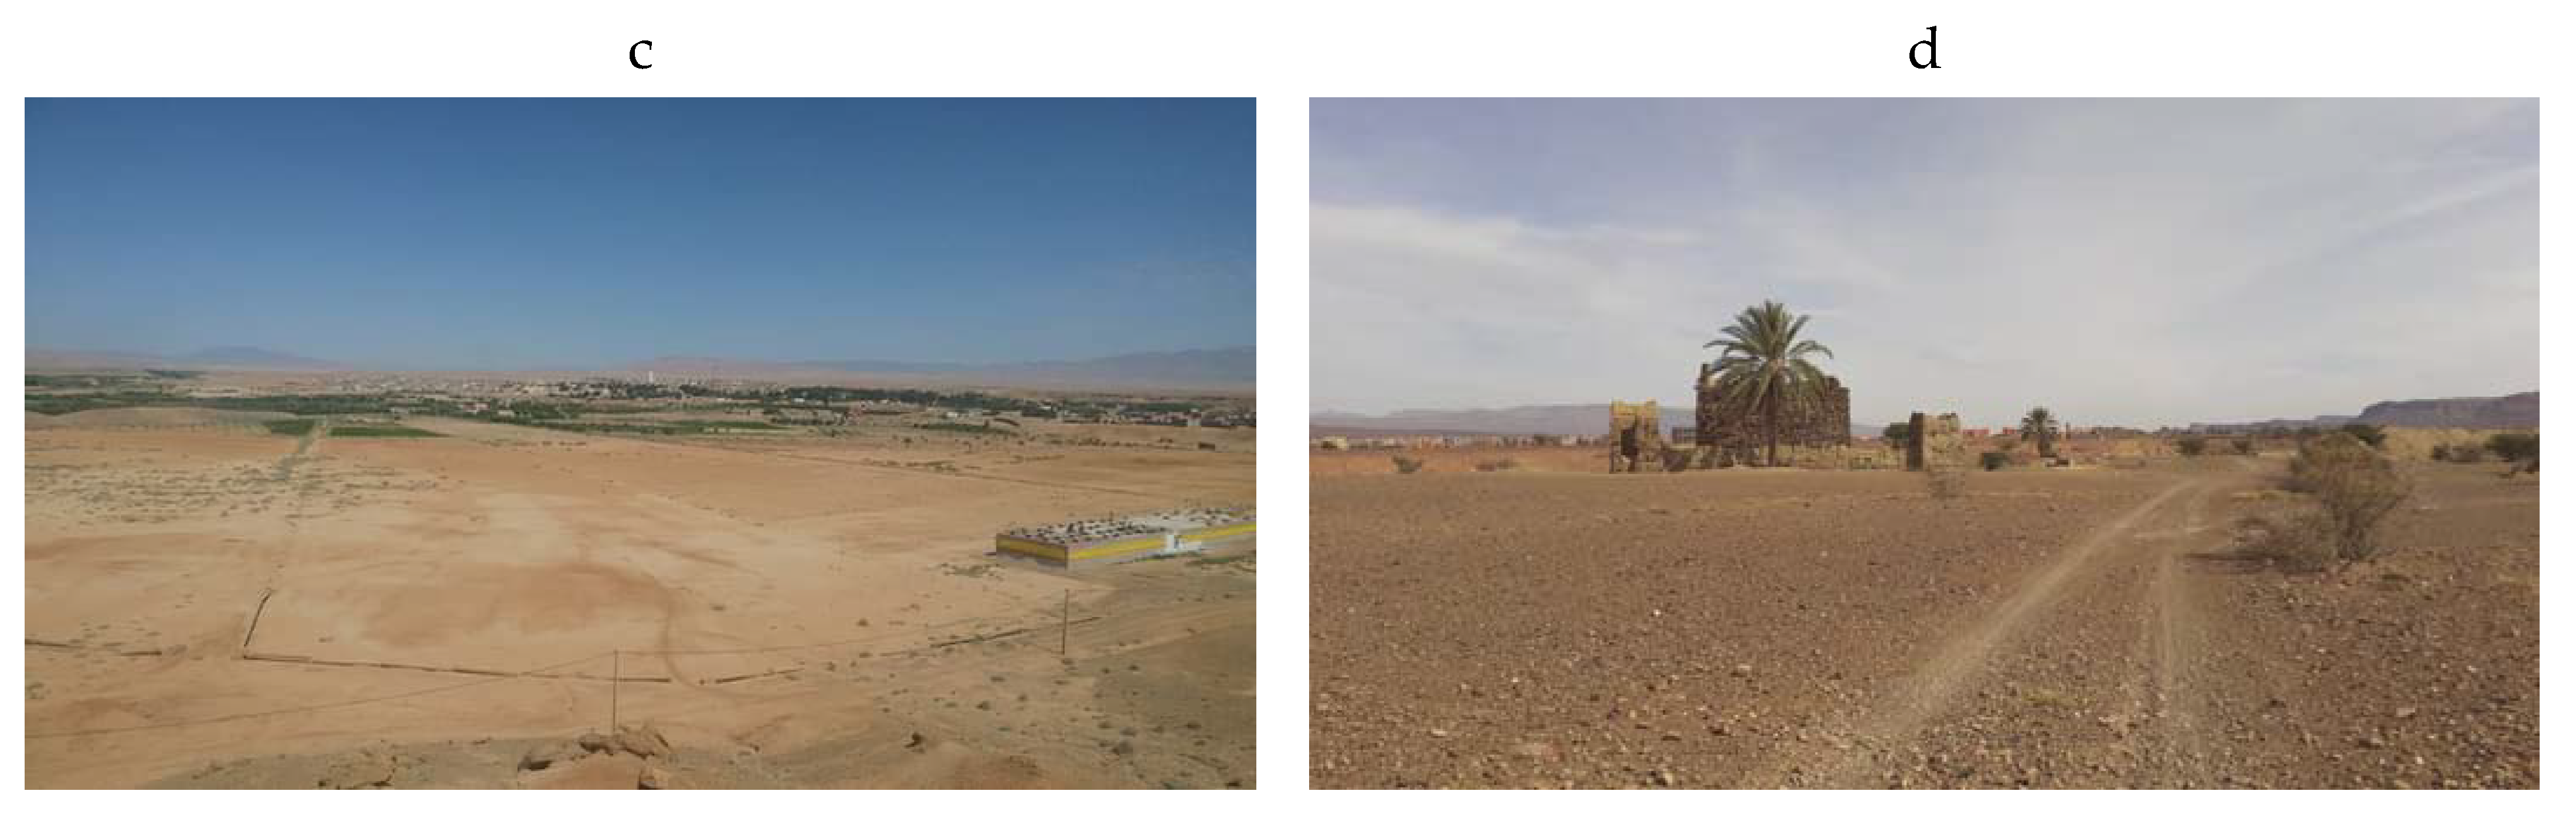
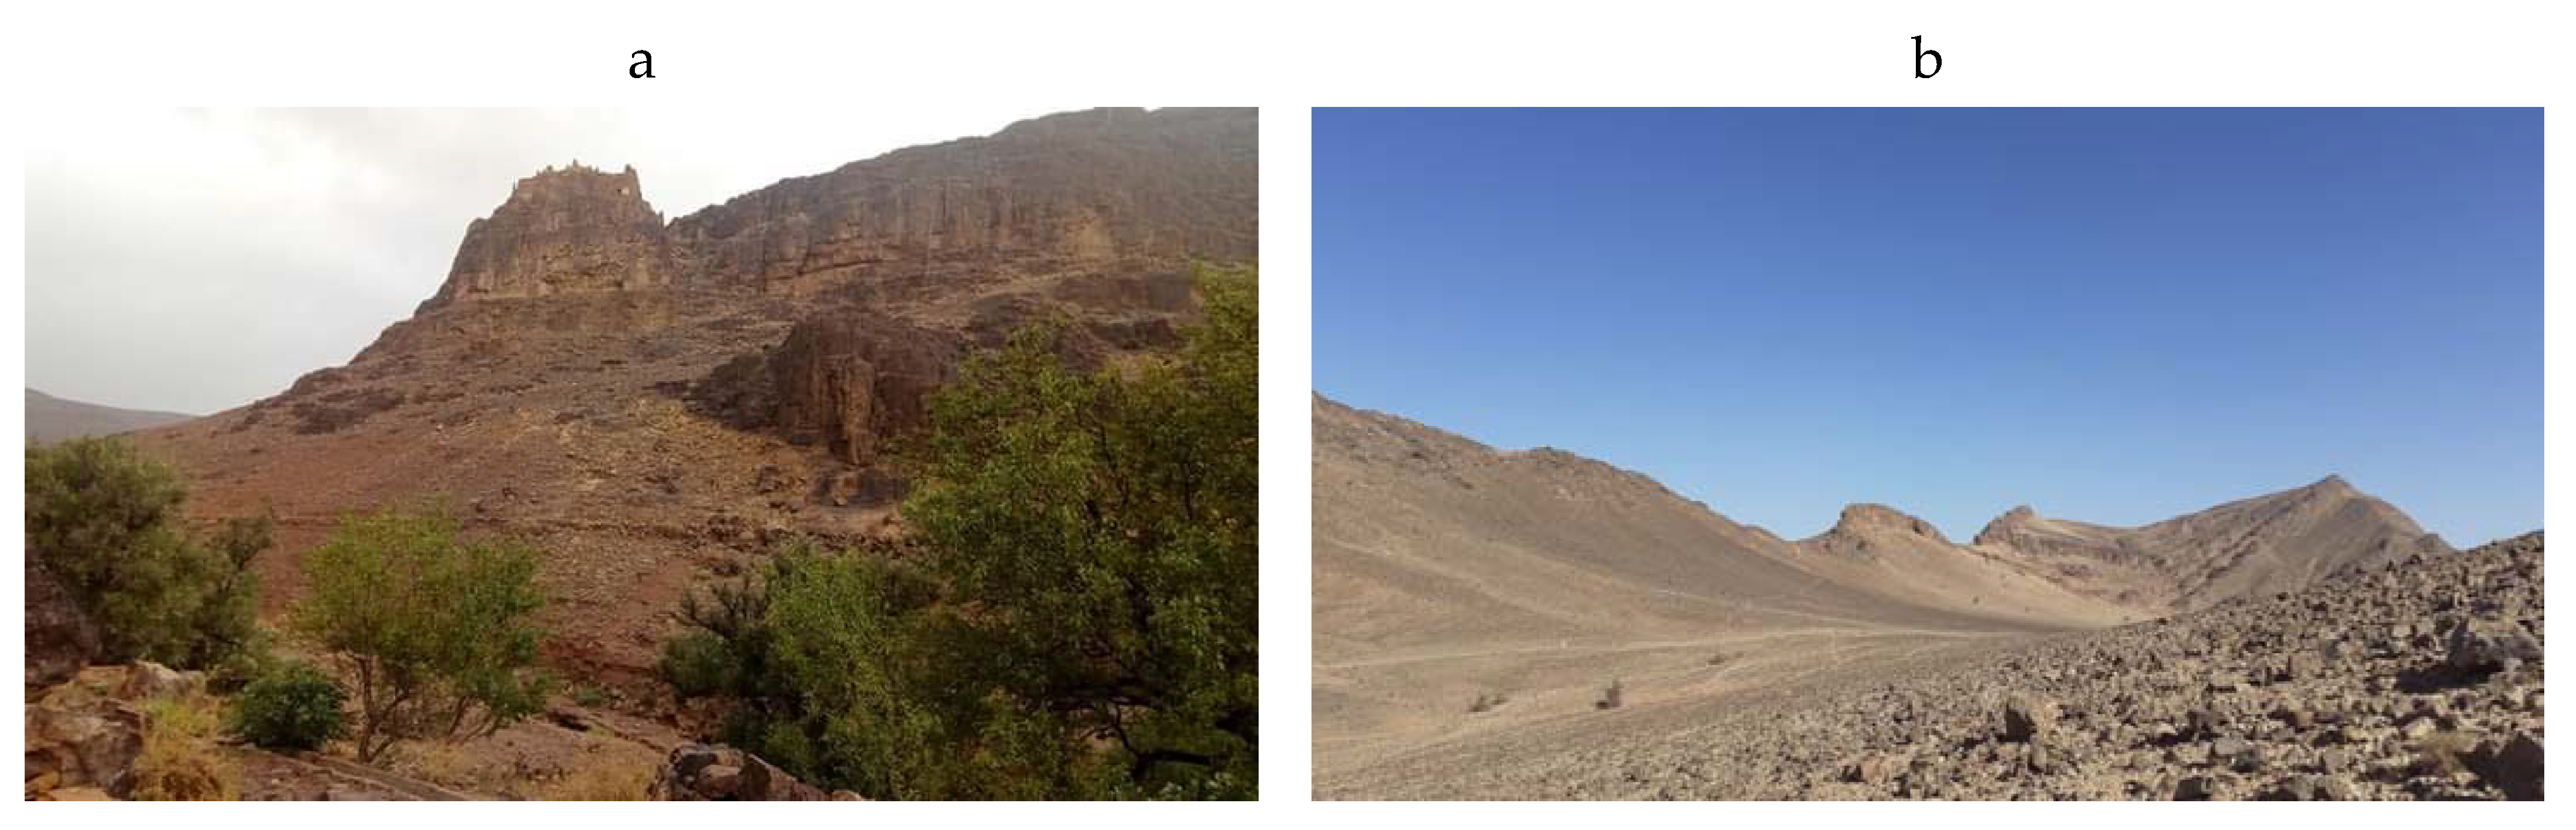
Figure 12.
Observation of (a) the Guercif plain with the eastern relief of the folded Middle Atlas in the background, (b) Pre-rifaine zone in the western part of the External Prerif, (c) Missour Plain in the southwestern part of the Middle Atlas, and (d) Alluvial plain in the Zagora region Southeast of the Central Anti-Atlas.
Figure 13.
Observation of (a) Aguelmim Iznaghn area north-west of the Central Anti-Atlas sector and (b) Tafetchna area east of the Central Anti-Atlas sector.
Figure 13.
Observation of (a) Aguelmim Iznaghn area north-west of the Central Anti-Atlas sector and (b) Tafetchna area east of the Central Anti-Atlas sector.
Table 1.
Distribution of drainage network patterns in the three studied sectors.
Table 1.
Distribution of drainage network patterns in the three studied sectors.
| | External Rif | Middle Atlas | Central Anti-Atlas |
|---|
| Dendritic | 22 | 4 | - |
| Pinnate | - | - | 6 |
| Parallel | 13 | 36 | 20 |
| Trellis | 6 | 20 | 15 |
| Rectangular | 42 | 37 | 45 |
| Herringbone | 23 | 23 | - |
| Barbed | 3 | 3 | - |
| Unidentified | 17 | 13 | 19 |
| Total | 126 | 136 | 105 |
Table 2.
Eigenvalues and percentage of explained variance by the first and second principal components for the total database and the three sectors.
Table 2.
Eigenvalues and percentage of explained variance by the first and second principal components for the total database and the three sectors.
| | Total Database | External Rif | Middle Atlas | Central Anti-Atlas |
|---|
| | PC1 | PC2 | PC1 | PC2 | PC1 | PC2 | PC1 | PC2 |
|---|
| Eigenvalue | 4.3 | 2.3 | 5.3 | 2 | 4.2 | 2.7 | 4.8 | 3.2 |
| Variance (%) | 30.6 | 16.4 | 37.6 | 14.3 | 29.7 | 19 | 34 | 22.5 |
| Cum. % | 30.6 | 47 | 37.6 | 51.9 | 29.7 | 48.7 | 34 | 56.5 |
Table 3.
Confusion matrix of the discriminant analysis for the total database.
Table 3.
Confusion matrix of the discriminant analysis for the total database.
| from\to | 0 | 1 | 2 | 3 | 4 | 5 | 6 | Total | % Correct |
|---|
| 0 | 20 | 0 | 2 | 0 | 1 | 3 | 0 | 26 | 76.9% |
| 1 | 0 | 6 | 0 | 0 | 0 | 0 | 0 | 6 | 100.0% |
| 2 | 2 | 0 | 58 | 0 | 6 | 3 | 0 | 69 | 84.1% |
| 3 | 0 | 0 | 7 | 8 | 11 | 15 | 0 | 41 | 19.5% |
| 4 | 2 | 0 | 22 | 0 | 67 | 33 | 0 | 124 | 54.0% |
| 5 | 1 | 0 | 3 | 0 | 4 | 38 | 0 | 46 | 82.6% |
| 6 | 0 | 0 | 0 | 0 | 0 | 0 | 6 | 6 | 100.0% |
| Total | 25 | 6 | 92 | 8 | 89 | 92 | 6 | 318 | 63.8% |
Table 4.
Discriminant functions for the total database.
Table 4.
Discriminant functions for the total database.
| | F1 | F2 | F3 | F4 | F5 | F6 |
|---|
| Discrimination (%) | 59.40 | 15.93 | 11.95 | 8.95 | 2.53 | 1.24 |
| Cumulative % | 59.40 | 75.33 | 87.28 | 96.23 | 98.76 | 100.0 |
Table 5.
Correlations between variables and discriminant functions of the total database (higher values are in bold).
Table 5.
Correlations between variables and discriminant functions of the total database (higher values are in bold).
| | F1 | F2 | F3 |
|---|
| Slope | −0.71 | 0.05 | −0.01 |
| H | −0.10 | 0.17 | 0.20 |
| R1 | −0.24 | −0.05 | 0.07 |
| R2 | −0.23 | −0.02 | 0.12 |
| Kg | 0.19 | 0.42 | 0.18 |
| Kh | −0.12 | −0.27 | 0.01 |
| Rock-type | −0.21 | −0.22 | 0.46 |
| Homo-Geo | −0.06 | −0.01 | −0.34 |
| Line-Dens | −0.71 | 0.20 | 0.44 |
| MEAN-Ddrain | 0.88 | 0.18 | 0.20 |
| Landcover | 0.30 | 0.30 | 0.03 |
| Tc | 0.01 | −0.18 | 0.55 |
| Precipitation | −0.21 | 0.010 | −0.66 |
Table 6.
Confusion matrix of the discriminant analysis for each sector. (Dendritic = 0, pinnate = 1, parallel = 2, trellis = 3, rectangular = 4, herringbone = 5 and barbed = 6).
Table 6.
Confusion matrix of the discriminant analysis for each sector. (Dendritic = 0, pinnate = 1, parallel = 2, trellis = 3, rectangular = 4, herringbone = 5 and barbed = 6).
| | From/to | 0 | 1 | 2 | 3 | 4 | 5 | 6 | Total | % Correct |
|---|
| External Rif | 0 | 20 | _ | 0 | 0 | 2 | 0 | 0 | 22 | 90.9% |
| 2 | 0 | _ | 13 | 0 | 0 | 0 | 0 | 13 | 100% |
| 3 | 0 | _ | 0 | 6 | 0 | 0 | 0 | 6 | 100% |
| 4 | 4 | _ | 0 | 0 | 35 | 3 | 0 | 42 | 83.3% |
| 5 | 1 | _ | 0 | 0 | 2 | 20 | 0 | 23 | 86.9% |
| 6 | 0 | _ | 0 | 0 | 0 | 0 | 3 | 3 | 100% |
| Total | 25 | _ | 13 | 6 | 39 | 23 | 3 | 109 | 89% |
| Middle Atlas | 0 | 4 | _ | 0 | 0 | 0 | 0 | 0 | 4 | 100% |
| 2 | 0 | _ | 32 | 1 | 3 | 0 | 0 | 36 | 88.9% |
| 3 | 0 | _ | 0 | 19 | 1 | 0 | 0 | 20 | 95% |
| 4 | 0 | _ | 3 | 6 | 26 | 2 | 0 | 37 | 70.3% |
| 5 | 0 | _ | 0 | 1 | 3 | 19 | 0 | 23 | 82.6% |
| 6 | 0 | _ | 0 | 0 | 0 | 0 | 3 | 3 | 100% |
| Total | 4 | _ | 35 | 27 | 33 | 21 | 3 | 123 | 83.7% |
| CAA | 1 | _ | 6 | 0 | 0 | 0 | _ | _ | 6 | 100% |
| 2 | _ | 0 | 20 | 0 | 0 | _ | _ | 20 | 100% |
| 3 | _ | 0 | 3 | 12 | 0 | _ | _ | 15 | 80% |
| 4 | _ | 0 | 9 | 1 | 35 | _ | _ | 45 | 77.8% |
| Total | | 6 | 32 | 13 | 35 | _ | _ | 86 | 84.9% |
Table 7.
Discriminant functions and their percentage of classifications for each sector.
Table 7.
Discriminant functions and their percentage of classifications for each sector.
| | | F1 | F2 | F3 | F4 | F5 |
|---|
| External Rif | Discrimination (%) | 58.90 | 17.84 | 14.12 | 5.64 | 3.50 |
| Cum. % | 58.90 | 76.74 | 90.86 | 96.50 | 100 |
| Middle Atlas | Discrimination (%) | 66.49 | 13.05 | 10.39 | 5.83 | 4.24 |
| Cumulative % | 66.49 | 79.54 | 89.93 | 95.76 | 100 |
| Central Anti Atlas | Discrimination (%) | 66.54 | 25.73 | 7.73 | _ | _ |
| Cumulative % | 66.54 | 92.27 | 100 | _ | _ |
Table 8.
Correlations between variables and discriminant functions of the three study areas (higher values are in bold).
Table 8.
Correlations between variables and discriminant functions of the three study areas (higher values are in bold).
| Parameters | External Rif | Middle Atlas | Central Anti-Atlas |
|---|
| | F1 | F2 | F3 | F1 | F2 | F3 | F1 | F2 | F3 |
|---|
| Slope | −0.73 | −0.15 | 0.34 | 0.72 | 0.13 | 0.32 | 0.78 | −0.05 | 0.10 |
| H | −0.17 | −0.39 | 0.34 | 0.08 | 0.1 | 0.38 | 0.22 | 0.64 | 0.15 |
| R1 | −0.21 | −0.1 | 0.49 | 0.19 | 0.16 | 0.28 | 0.36 | 0.46 | −0.04 |
| R2 | −0.21 | −0.07 | 0.49 | 0.18 | 0.15 | 0.29 | 0.35 | 0.45 | −0.04 |
| Kg | 0.19 | −0.58 | −0.07 | −0.04 | 0.08 | 0.02 | −0.25 | −0.21 | 0.19 |
| Kh | −0.1 | 0.54 | 0.17 | 0.03 | −0.12 | 0.17 | 0.22 | 0.23 | −0.18 |
| Rock-type | −0.01 | 0.05 | 0.05 | −0.06 | −0.3 | −0.1 | 0.78 | −0.22 | 0.38 |
| Homo-Geo | −0.07 | −0.07 | −0.39 | 0.13 | 0.10 | −0.09 | 0.02 | 0.36 | −0.01 |
| Line-Dens | −0.58 | −0.02 | 0.66 | 0.88 | 0.09 | −0.23 | 0.65 | −0.16 | −0.09 |
| Mean-Ddrain | 0.88 | −0.13 | −0.05 | −0.80 | 0.35 | 0.07 | −0.67 | 0.42 | 0.31 |
| Landcover | −0.06 | 0.53 | −0.16 | −0.11 | 0.58 | −0.08 | −0.51 | 0.35 | −0.44 |
| Tc | 0.35 | −0.16 | −0.31 | −0.22 | −0.37 | −0.02 | 0.55 | −0.15 | 0.32 |
| Precipitation | −0.46 | −0.1 | −0.25 | 0.75 | 0.35 | −0.12 | −0.8 | 0.1 | 0.10 |


 ,
, 


