Article

Developing a Multicriteria Decision Analysis Framework to Evaluate Reclaimed Wastewater Use for Agricultural Irrigation: The Case Study of Maryland

Department of Environmental Science & Technology, University of Maryland, College Park, MD 20742, USA
*
Author to whom correspondence should be addressed.
Submission received: 15 December 2020 / Revised: 31 December 2020 / Accepted: 3 January 2021 / Published: 6 January 2021

Abstract

:
Groundwater is the main source of irrigation and residential use in the Eastern Shore Maryland, which is experiencing challenges regarding overuse, saltwater intrusion, and diminishing productivity. The Chesapeake Bay is also facing the problem of water pollution due to pollutant loading from agricultural fields and wastewater treatment plants (WWTPs). Using recycled water for irrigation has the potential to alleviate the pressure on groundwater and reduce pollutant loading. The objective of this study was to develop a decision tool to explore the use of recycled water for agricultural irrigation in Maryland using Multicriteria Decision Analysis (MCDA) integrated with Geographical Information Systems (GIS). Four main evaluation criteria were included in the GIS-MCDA framework: agricultural land cover, climate, groundwater vulnerability, and characteristics of the WWTPs as sources of recycled water. Groundwater vulnerability zones were developed using the groundwater well density, water extraction data, and the aquifer information. Then, the most suitable areas for irrigation using recycled water were identified. About 13.5% and 32.9% of agricultural land was, respectively, found to be “highly” and “moderately” suitable for irrigation with recycled water when WWTPs were categorized based on their treatment process information. The results provide a useful decision tool to promote the use of recycled water for agricultural irrigation.

1. Introduction

Increasing population and continuous development has resulted in increased demands for freshwater in the Mid-Atlantic region. Like other coastal regions in the Mid-Atlantic, groundwater is the primary source of drinking water as well as irrigation, commercial, and industrial uses, and for some of the power plants. Groundwater from the confined aquifer is mainly used for domestic purposes including drinking water and public water supply [1]. Groundwater also provides baseflow to streams, rivers, and wetlands and maintains a healthy and sustainable aquatic habitat and ecosystem.
Recently, the Mid-Atlantic region is experiencing uncertain and nonuniform rainfall events with a slightly warmer climate during the growing season [2]. Due to more intermittent rainfall and increased evaporation with warmer temperatures, recurrent short-term droughts are more likely to occur during the summer. Climate models project an increase in temperature during the growing season [3] coupled with reductions in soil moisture for this region, which will likely increase the water demand for crop and landscape irrigation. In addition, farmers have started to practice supplemental irrigation to their rainfed farms to maintain higher crop production and increase their farm’s profitability. Therefore, it is predicted that groundwater demand for agricultural irrigation will continue to grow. These changes will require adaptation by Maryland’s agricultural industry, including changes in crop varieties and increased irrigation.
Current pumping records indicate that in response to extensive development intermittent drought conditions will occur, and to increase crop productivity, irrigation withdrawals have increased in the region especially in coastal areas. These higher groundwater withdrawals contribute to the decline in water levels in many of the confined aquifers. Long-term observation records from many monitoring wells in the region show the declining trend of groundwater levels, especially the confined aquifers of the coastal plain [1]. In addition, Maryland’s groundwater system is vulnerable to sea-level rise, especially in the coastal plain. Considering all these issues, regional water resource managers face various challenges to meet local water demands due to increasing rates of groundwater withdrawals, lack of productive aquifers and saltwater intrusion.
Studies have shown that agricultural irrigation with reclaimed wastewater has multiple advantages such as providing high reliability due to constant yields [4,5], reducing pressure on freshwater [5,6], improving nutrient management and recovery [7,8], etc. In both developed and developing countries, the most established water reuse practice is the application of treated municipal wastewater for irrigation [6,9]. Each day billions of gallons of wastewater are generated across the Chesapeake Bay region [10]. To safely and effectively treat this large amount of wastewater and to reduce the excess amount of nutrients discharged into the bay, hundreds of treatment facilities in this region are being upgraded with advanced wastewater treatment technologies. As a major state in the Chesapeake Bay region, Maryland is also seeking a sustainable solution to reduce nutrient loading to the Bay. As a result, Maryland’s Restoration Fund has provided more than $1.25 billion to upgrade its 67 WWTPs which are expected to reduce 10 million pounds of nitrogen and 1 million pounds of phosphorus per year [11].
Currently, the rate of water reuse in Maryland is very limited. In Maryland, there are 32 spray irrigation sites of treated wastewater onto land surfaces as one of the alternatives for wastewater disposal. However, the full potential use of Maryland’s reclaimed wastewater has not been explored yet considering the water demand–supply zones, spatial distribution of existing crop patterns and treatment facilities, and water reuse regulations. To overcome these water quantity and quality issues, coupling reclaimed and/or graywater to blue (surface and groundwater) and green water (soil moisture and evapotranspiration) framework has the potential to significantly improve the water management for the agricultural area [12,13]. At the same time, understanding how freshwater sources have been affected by natural (drought condition) and human stresses (increasing water demand) is key to sustainable management of groundwater sources in Maryland. This situation is also leading to the need for a comprehensive assessment of non-traditional water sources availability for irrigation in Maryland.
The main focus of this study was first to outline the critical groundwater zones in Maryland and then to identify the most suitable agricultural areas (hotspots) for reclaimed wastewater use for irrigation. To do so, the main objectives of this study were to (1) develop a method to create groundwater vulnerability maps for the study area, (2) identify the influential decision criteria for irrigation with reclaimed wastewater, and (3) develop an integrated geospatial Multicriteria Decision Analysis (MCDA) framework to identify the agricultural areas that are best suited for recycled water use. The results from this study provide useful information to decision-makers and stakeholders and help them with the development and expansion of reclaimed wastewater use in agriculture.

2. Materials and Methods
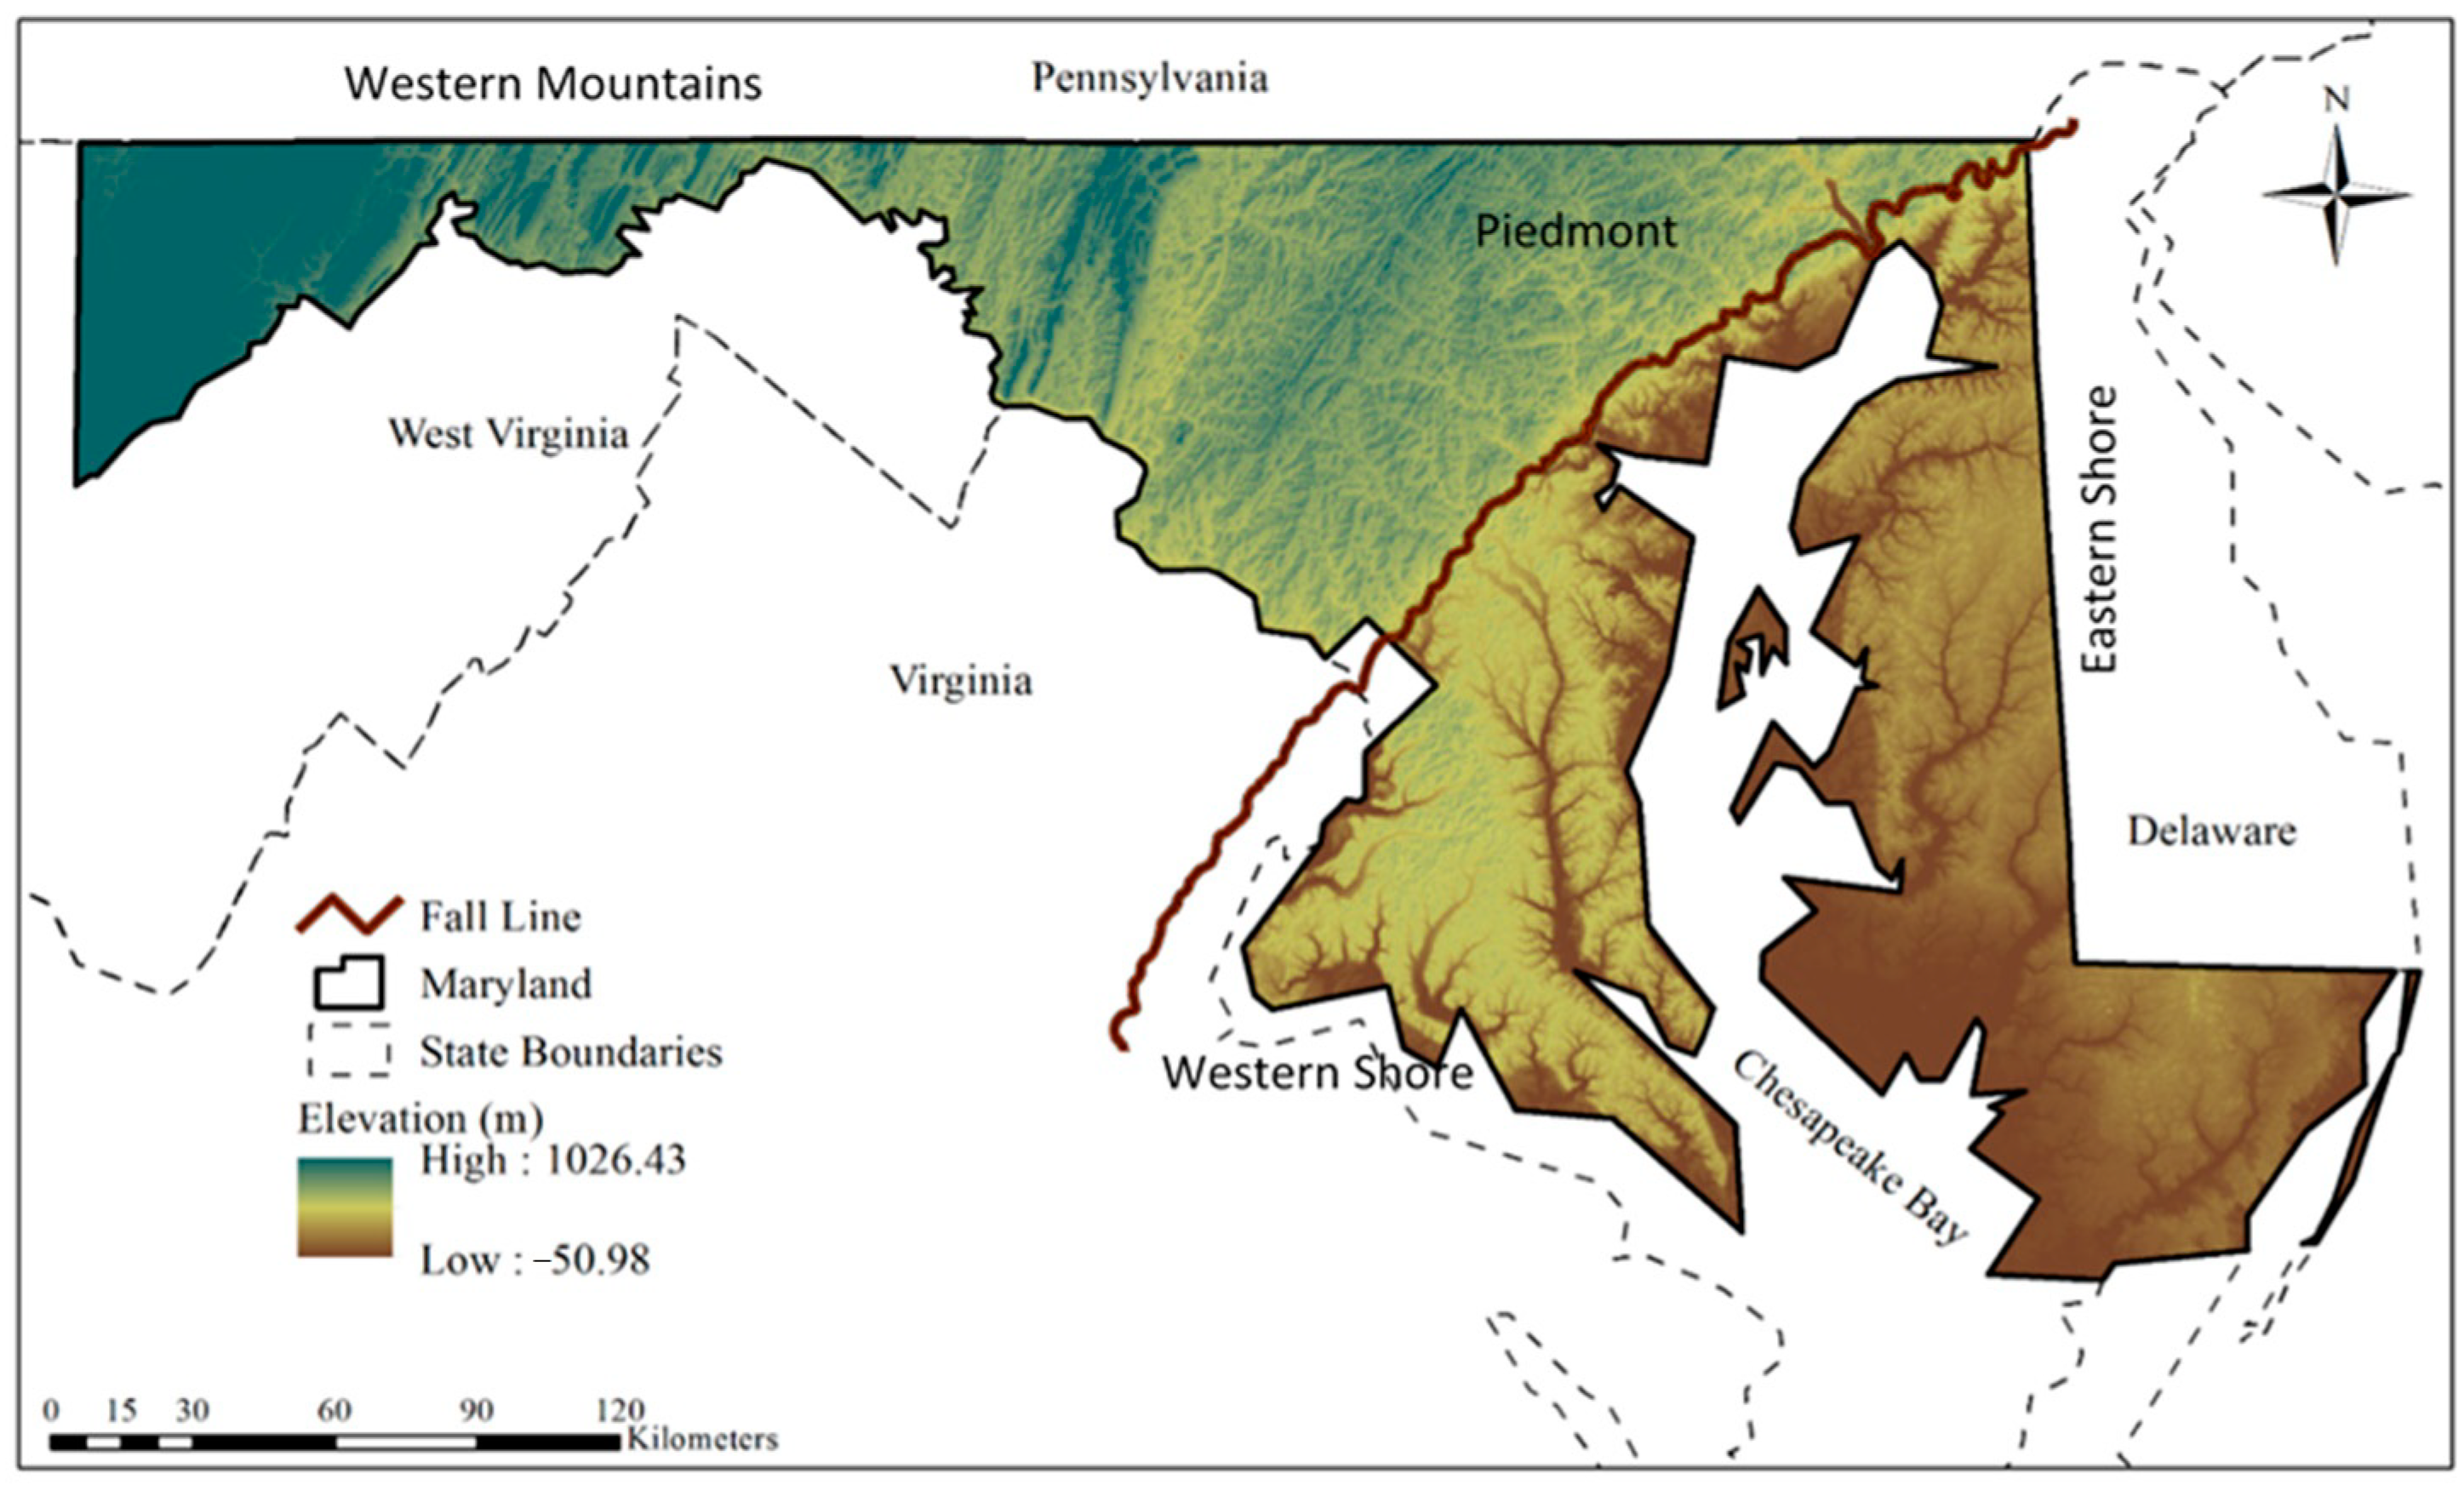
2.1. Study Area

Maryland can be divided into three regions: western mountainous, Piedmont, and coastal plain (Western and Eastern Shore) (Figure 1). Groundwater in Maryland’s coastal plain is derived from rain and snow that falls within the outcrop area of the aquifers (the area where the aquifers reach the surface). These outcrop areas are normally under unconfined conditions and are the principal recharge zones for the aquifers. Water from rain and snowmelt infiltrates through the soil until it reaches the water table. The saturated zone forms the surficial aquifer which flows slowly towards areas of discharge (streams, rivers, and ponds) while the remaining fraction of water infiltrates to the deep confined aquifer systems. To the west of the Fall Line, most aquifers in Piedmont are unconfined aquifers (also called water table aquifers) with no overlying impermeable layer to protect groundwater from surface-based sources of contamination.
In the Eastern Shore, where some aquifers are unconfined (Columbia or Surficial aquifers), the majority of water withdrawal is used for seasonal irrigation (agriculture) [1,14]. Most of the shallow unconfined groundwater is discharged to streams or the Bay or lost through evapotranspiration. Only a very small fraction of the water reaches the deeper aquifers, and as a result, the high withdrawal rates would have negative effects on recharge [1].

2.2. Data Collection and Processing

For the GIS-MCDA process, spatial data are needed, which have spatial extent for the criteria evaluation, the spatial dimension of the decision problem, and which can set in the geographical data models. Therefore, all the required data were collected or processed in spatial nature. The six major data types used in this study were Crop Data Layer (CDL) for land use and land cover (LULC), wastewater treatment facilities as source of recycled water, aquifer and groundwater well permit information for groundwater prioritization map, and watersheds prioritization map for climate criteria. Only publicly owned treatment works (POTW) that treats the domestic sewages were considered as the primary source to obtain treated recycled water for irrigation in this study. Due to difficulty of finding effluent information and permit requirements, non-POTW facilities were not included in this research.
In this study, all the permit information regarding groundwater withdrawal for irrigation uses were obtained from the Maryland Department of Environment (MDE). Well density and average and maximum withdrawal information (permitted) per tax map were integrated to generate the groundwater withdrawal heat maps. A digital map produced by the USGS showing the thickness of the surficial aquifer of Maryland was utilized in the analysis [15]. Aquifer maps containing the outcrop and subcrop regions beneath the Surficial (Eastern Shore) and Surficial Upland (Western Shore) aquifers were obtained from the Maryland Geological Survey (MGS). Here, outcrop areas contain groundwater in unconfined conditions and occur where an aquifer is exposed at land surface or beneath a water body [16]. Subcrop areas occur where a confined aquifer is situated under a blanket of surficial sediments. A complete list of datasets that were used in this study is provided in Table 1.

2.3. MCDA Framework

MCDA is a valuable decision analysis tool, being used to explicitly evaluate a large set of alternatives and conflicting criteria in the decision-making process. It provides a systematic approach to structure the decision problems, evaluating the benefit/cost information and the decision-maker or stakeholder views to rank the alternatives [17,18,19,20]. As identification of the agricultural hotspots for water reuse is a spatial decision problem, it needs geospatially based decision analysis involving multiple criteria and subcriteria. To consider the spatial decision alternatives and evaluation criteria, an integrated framework of the MCDA process with Geographic Information System (GIS-MCDA) has been used in this study. The GIS-MCDA method is an emerging approach for the assessment of suitable agricultural land, which has been applied in many studies to achieve the optimal decision-making from multiple spatially variable criteria [19,21,22,23,24,25]. Paul et al. [19] developed a GIS-MCDA framework in a prior study. In the current study, same framework was used with some modifications. The following subsections describe the decision criteria and subcriteria that were selected for this study in more details.

2.4. Criteria Selection

Based on the existing literature, data availability, and expert opinions, five main influential criteria as factors and one as a constraint were selected for the assessment of the suitable agricultural land for reclaimed wastewater irrigation. The four selected criteria are (1) agricultural land cover (crop type), (2) reclaimed wastewater sources, (3) water policy: groundwater vulnerability zone, and (4) climate impact: watershed prioritization.

2.4.1. Reclaimed Wastewater Sources

Among the collected POTW-WWTPs, seven discharge methods were selected considering their reuse potential for irrigation, including spray irrigation, reuse for irrigation, land application, overland flow, outfall to surface waters, discharge to groundwater, and discharge to another facility (Figure 2). These discharge methods were selected based on the Clean Watersheds Needs Survey (CWNS) database. While most of the existing spray irrigation sites are close to the WWTPs, there are some spray sites that are 2 to 4 miles (3.2–6.4 km) away from the facilities. Based on this existing practice, four distance classes of 0–5, 5–10, 10–15, and >15 km were considered. In the next step, selected WWTPs were classified into four categories based on their discharge capacity (Figure 2). Of note is the design capacity of the WWTPs was considered in this study.
To promote the reuse of reclaimed wastewater, the Maryland Department of Environment (MDE) amended a water reuse guideline in 2009 to include the irrigation with highly treated Classes I and II effluent quality. In 2010, a new amendment allowed Class IV water reuse in irrigation for food crops (with no contact with the edible portion of the crop). Based on this, all selected WWTPs were classified into two groups based on their treatment process including advanced and secondary treatment processes (Figure 2).

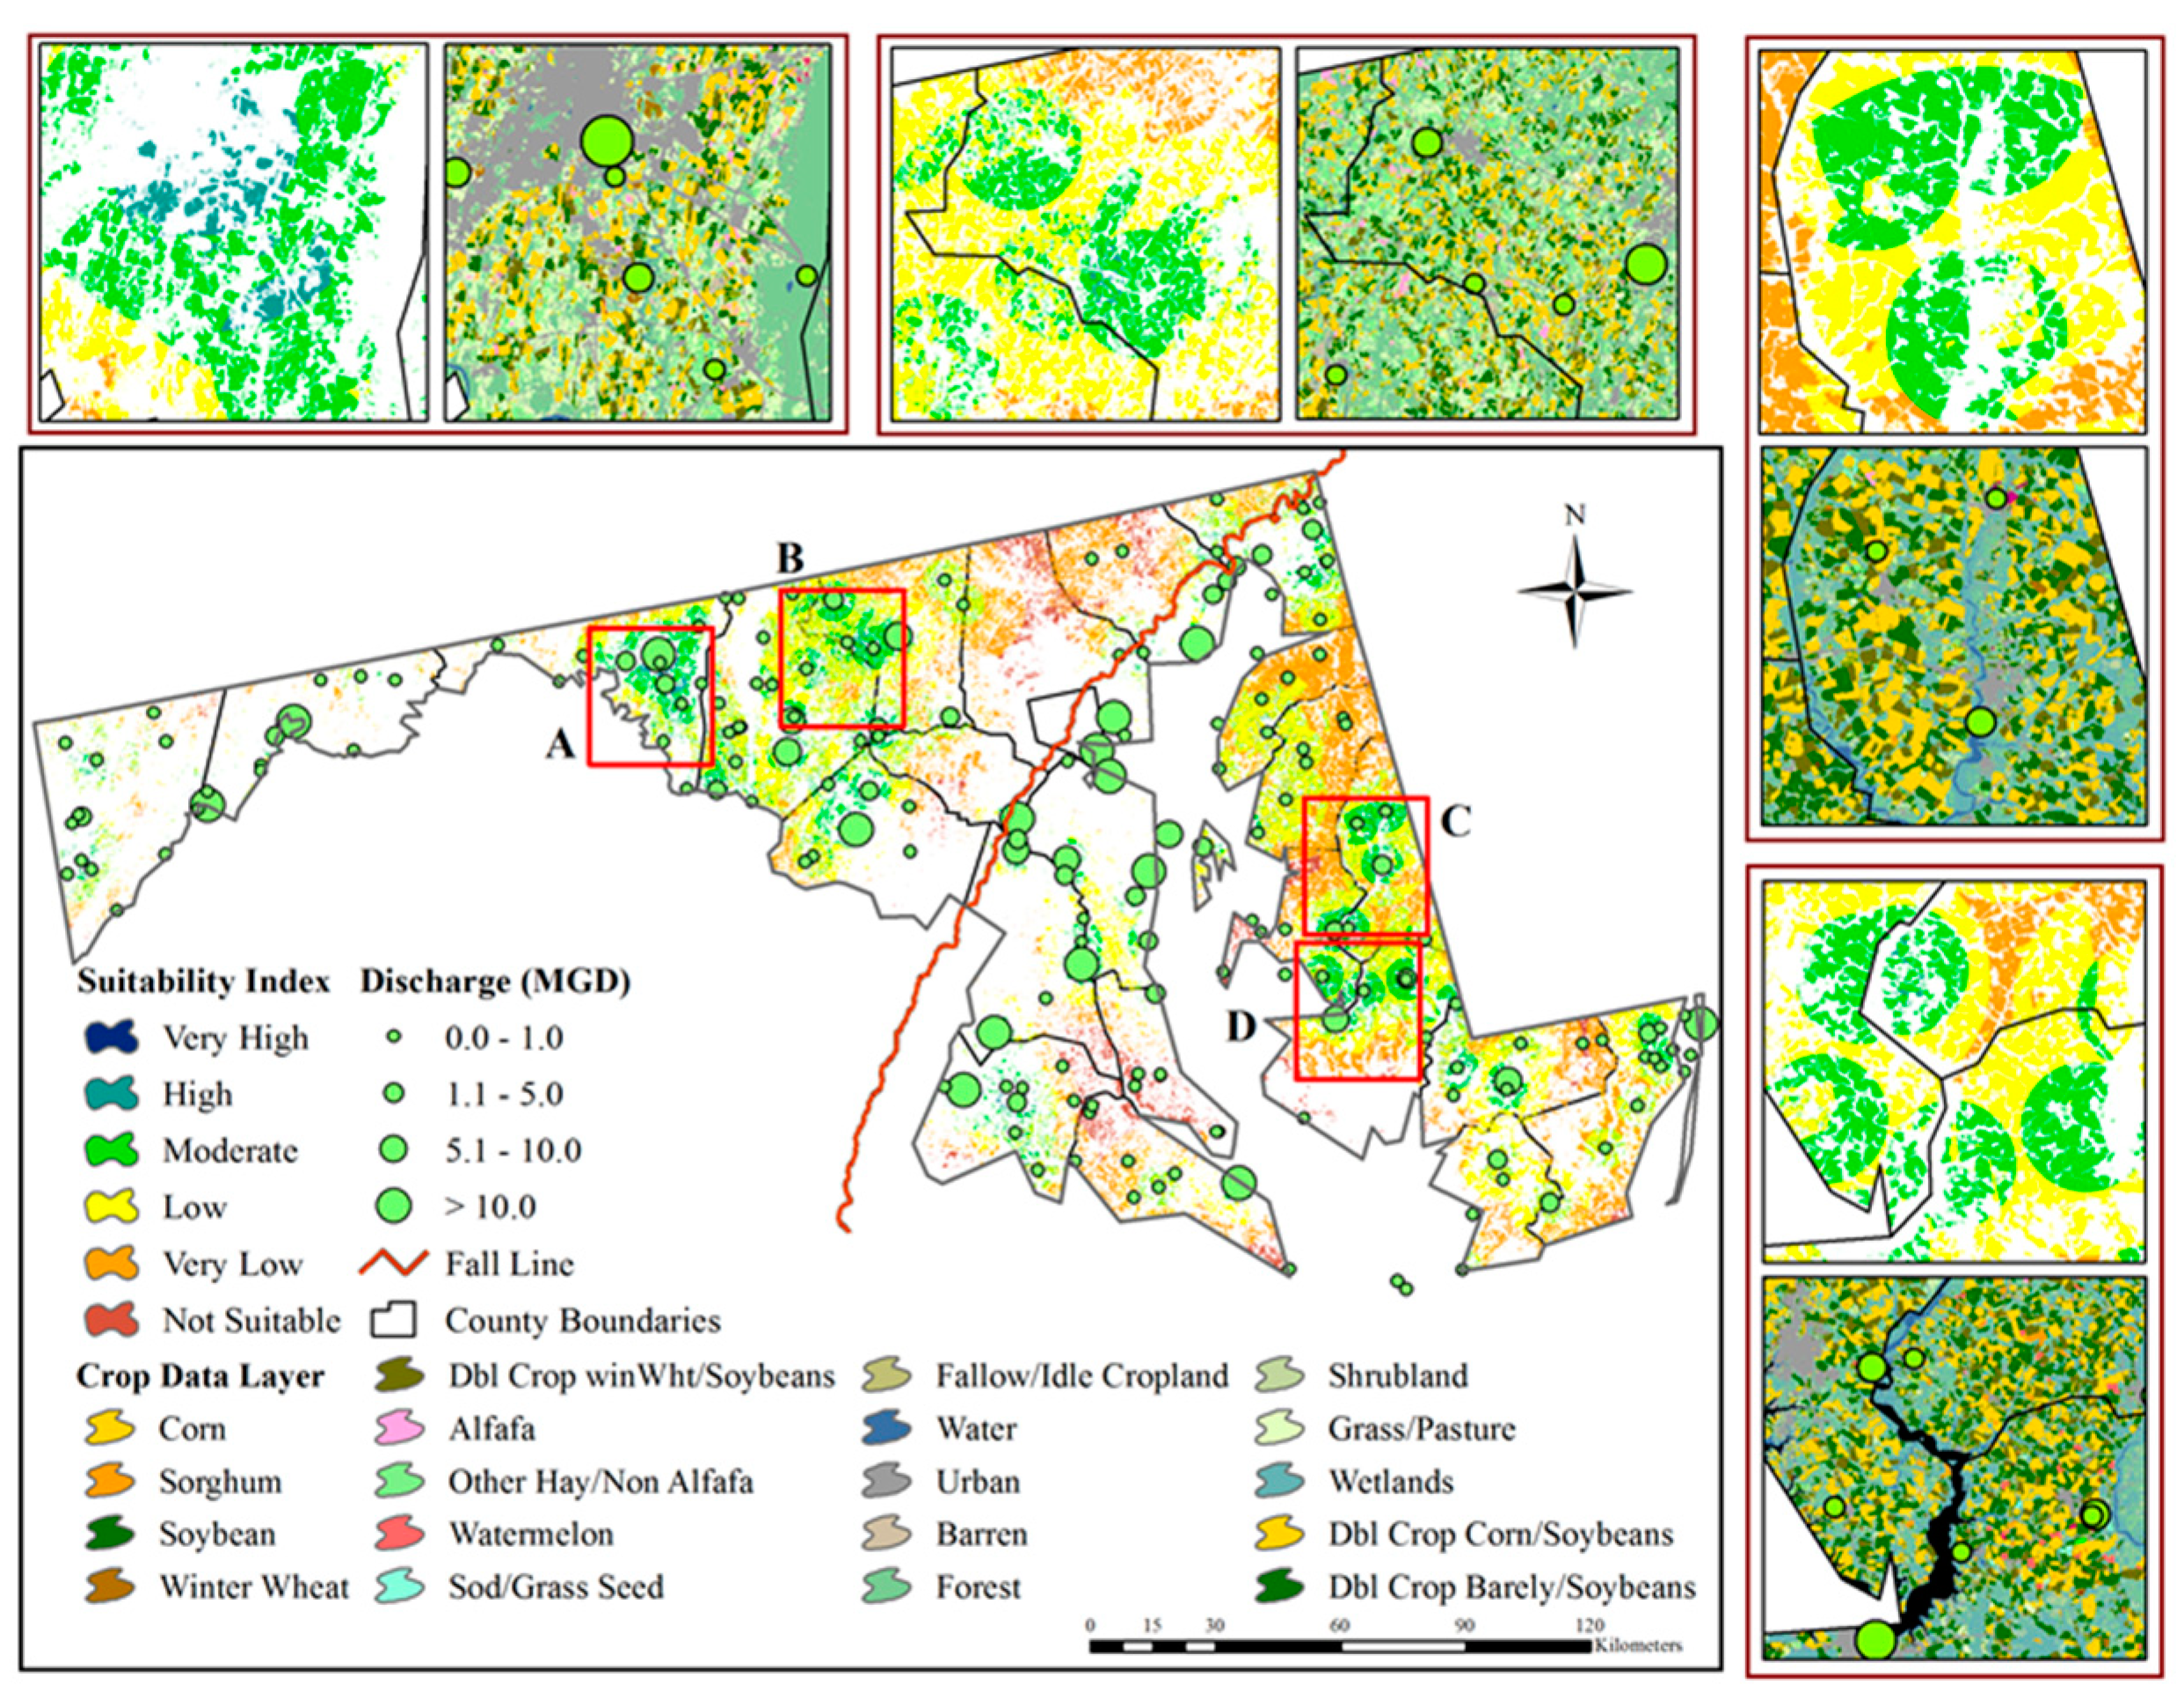
2.4.2. Agricultural Land Cover

According to MDE guidelines, reclaimed wastewater is not permitted for irrigation of fruits and vegetables that are eaten raw and are not commercially processed. Based on the 2010 revised amendments, Class IV water is allowed to be used for food crop irrigation, especially when there is no contact with the edible portion of the crop [26]. Therefore, two groups of crops were selected for recycled water use: Food Crops, including grains, legumes, oils, and orchard, and Non-food Crops including pasture for foraging livestock, sod farms, and commercial crops (Christmas tree).

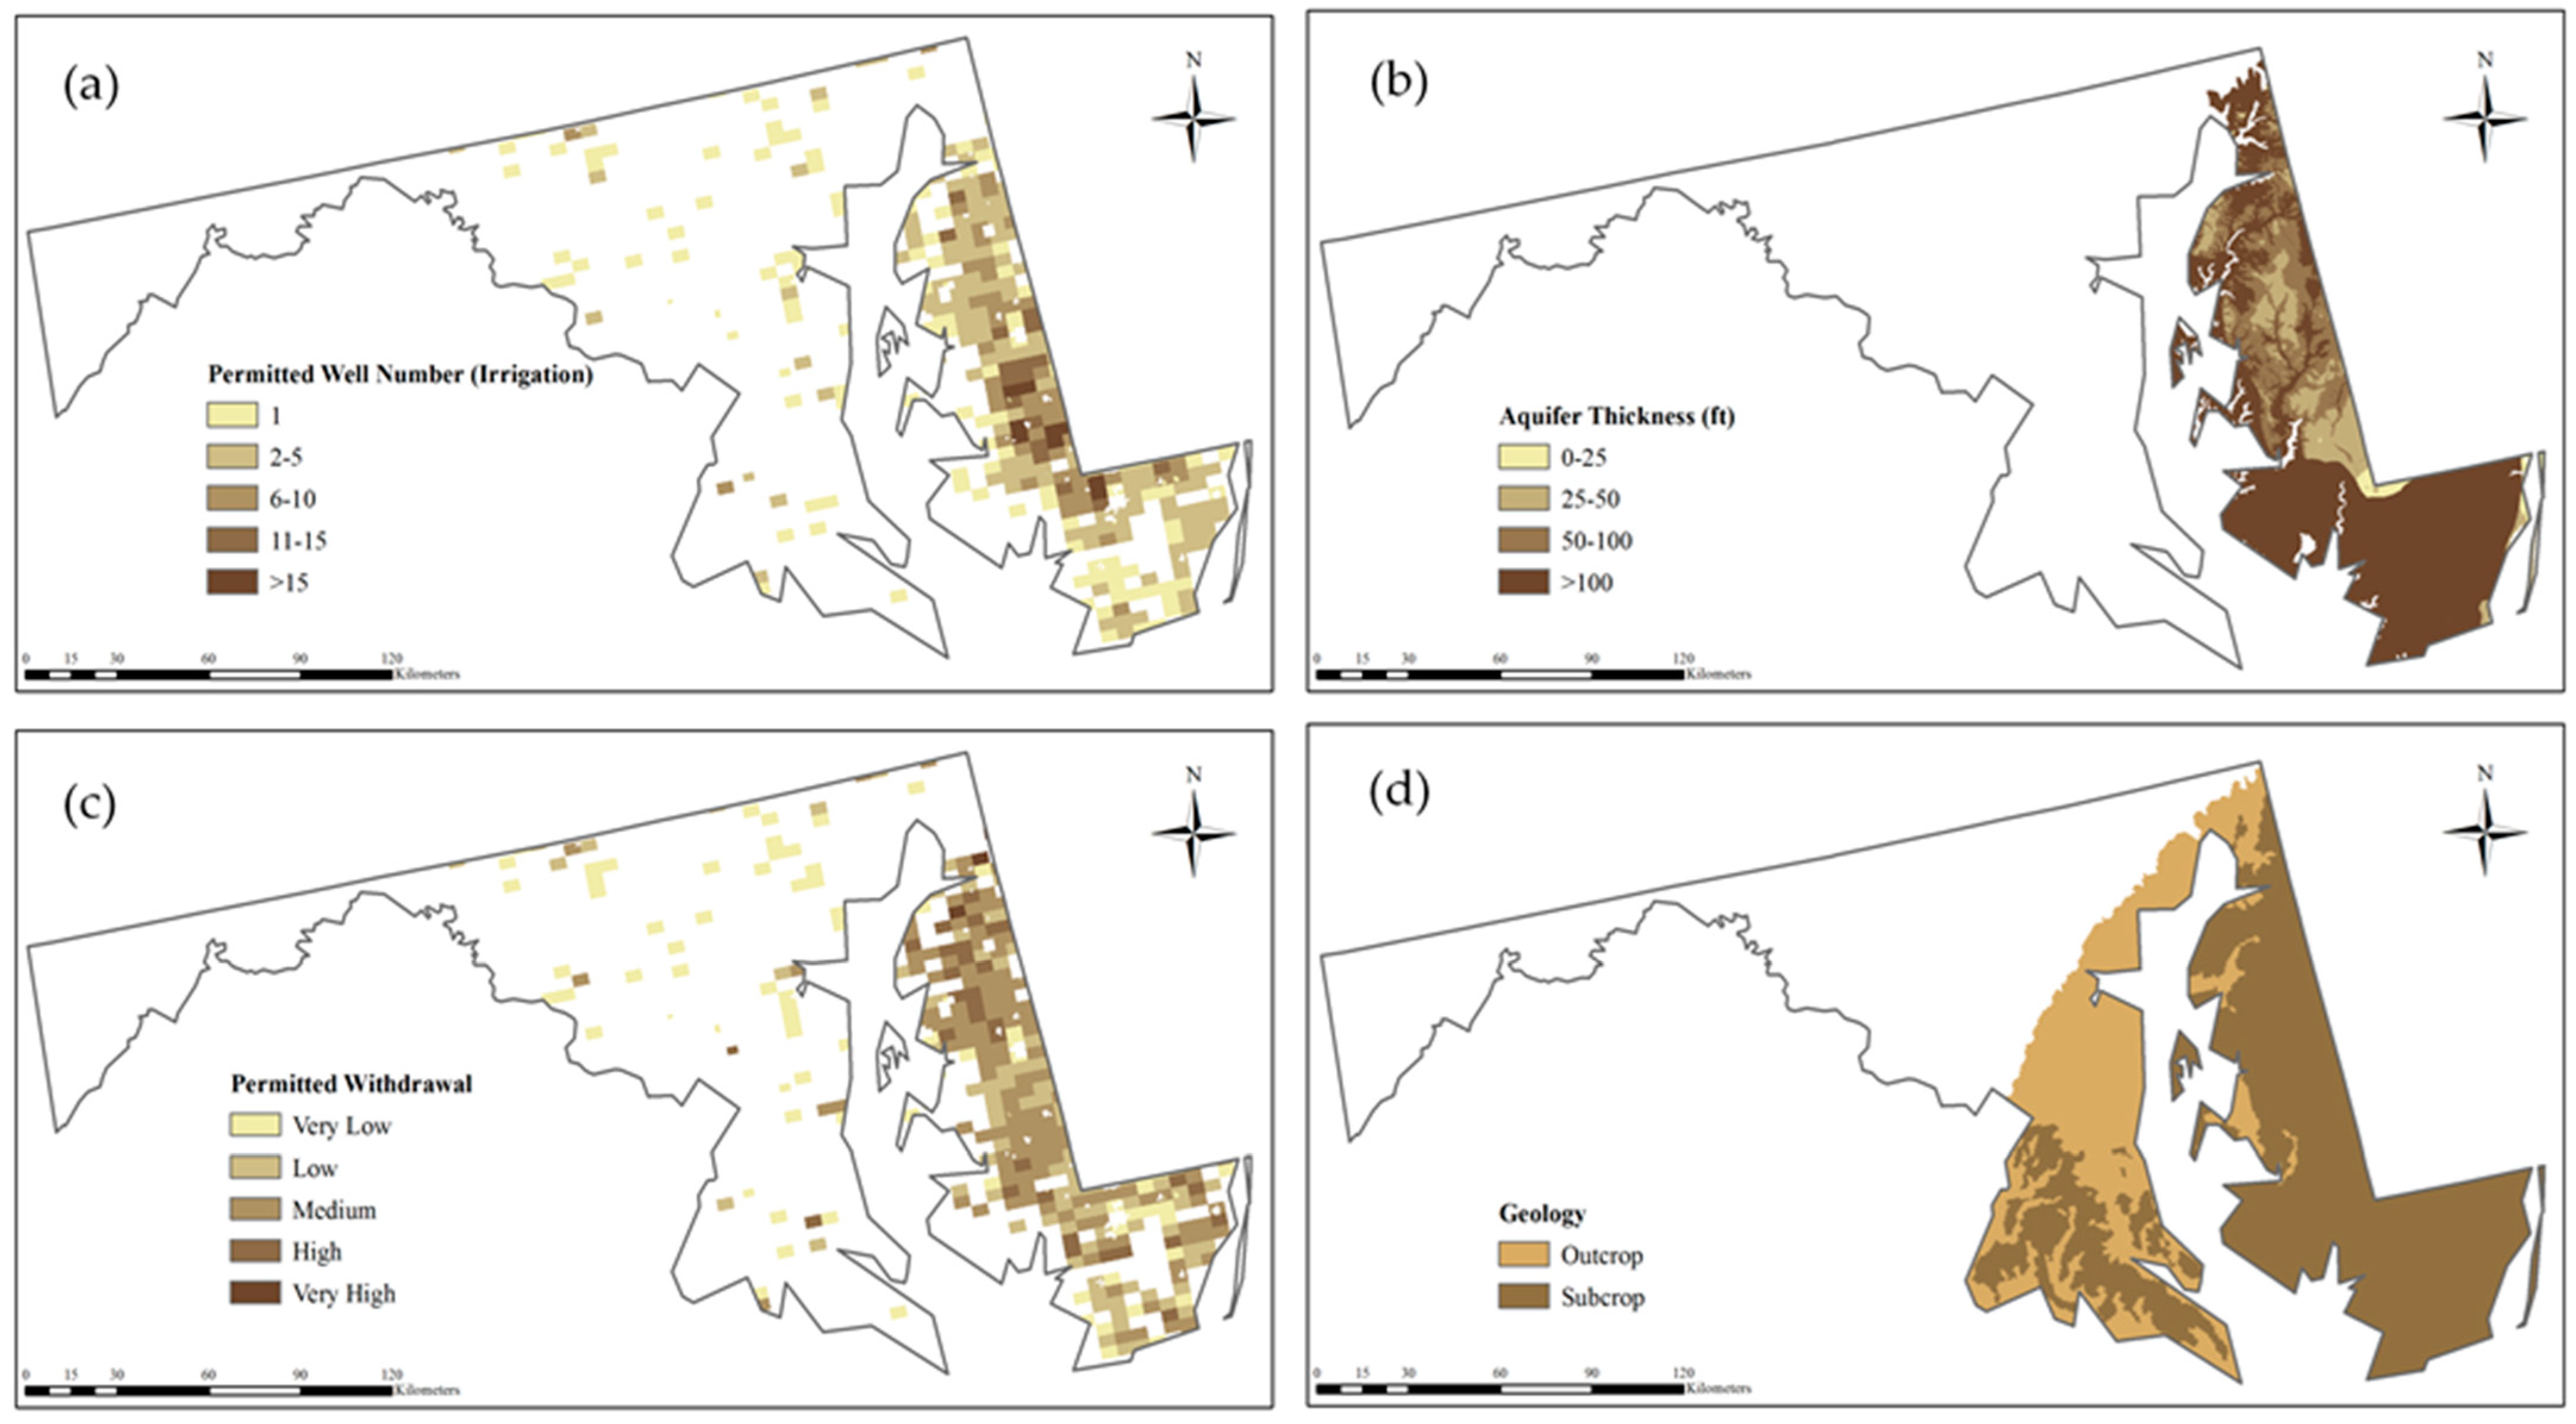
2.4.3. Water Policy: Groundwater Vulnerability Zone

For effective water resources planning, it is necessary to analyze the cumulative impact of thousands of wells pumping from Maryland’s aquifers. MDE controls the surface and groundwater uses in Maryland to conserve, manage, and protect the State’s water resources. MDE processes the water appropriation permit applications for surface and groundwater withdrawals. According to Maryland Code 2005, under Environment Section 5-502 (b) (2), users need to obtain permit approval for withdrawing an annual daily average of 10,000 gallons per day (GPD, 0.0004 m3/s) or more.
Groundwater vulnerability zones were generated and assessed for the study area. The assumption was that the areas where groundwater is under pressure have higher priority for water reuse. Spatial distribution of the permitted groundwater withdrawal indicated that most of the groundwater wells are situated on the agricultural land with higher withdrawal amounts allocated in the coastal plain regions. Maryland’s coastal plain is also facing saltwater intrusion in some regions due to lowered aquifer heads and climate change induced sea level rise. To integrate these issues, the spatial distributions of groundwater well density, water extraction, and aquifer information were combined to generate a groundwater vulnerability map for the study area. Groundwater vulnerability zones have been identified by integrating these factors and classifying them into six categories of very high, high, medium, low, and very low in terms of their vulnerability level. Detailed groundwater vulnerability framework and reclassified maps are shown in Appendix A Figure A1, Figure A2 and Figure A3 as appendices to this manuscript. Groundwater vulnerability zones have been identified by integrating these factors and classifying them into six categories of very high, high, medium, low, very low, and normal in terms of their vulnerability level.

2.4.4. Climate: Watershed Prioritization

According to climate projection models, under the higher emissions scenario, summer droughts and heat stresses are expected to increase in the Mid-Atlantic region, which will likely increase the water demand for crop and landscape irrigation [2]. In addition, a higher population and economic development are expected in this region, which will increase the water demand in the future [2]. Luck et al. [26] developed the worldwide Aqueduct Water Stress projections data including the potential changes of water supply and demand, water stress, and seasonal variability at the HUC4 watershed level. Here, indicators of water supply, water demand (withdrawal and consumptive use), water stress (ratio of water withdrawal to supply), and intra-annual (seasonal) variability were considered for 2040 and under RCP8.5 climate scenarios [27]. Based on these long-term projections of future water availability, Maryland’s watersheds were categorized into five vulnerability classes of extremely high, high, medium-high, low-medium, and low.

2.5. Weighting of Criteria and Subcriteria

The Analytical Hierarchy Process (AHP) [28] was used to weigh and rank the criteria and subcriteria. Note that AHP uses the pairwise comparisons between two criteria based on their relative importance. The ranking process developed previously by the research team was used in this research [18]. Briefly, the ranking process was done in four steps:
  • Formulating Hierarchy: At the beginning, a hierarchy structure was developed where all the criteria and subcriteria were organized according to their importance. In this study, a decision hierarchy structure is articulated into four levels as shown in the flowchart in Figure 3.
  • Assigning Priorities: In the next step a comparison matrix is established (a n by n matrix, where n is the number of criteria) considering the relative importance of each criterion and comparing them one-by-one based on pairwise comparison. All the criteria were weighed on a scale from 1 to 9 (Table 2).
  • Weighting Criteria: The pairwise comparison matrix is normalized from where the final priorities were obtained. In the normalized matrix, the values of each cell were divided by the total column values from the pairwise comparison matrix. Thus, each entry of the normalized matrix can be computed as
    A j k =   a j k i = 1 n a j k
    where ajk is the element of row j column k of the matrix and Ajk is normalized value of this element. From this normalized matrix, the final AHP outputs are (i) a relative priority of each criterion presented in percentages and (ii) a relative rank of each criterion.
  • Consistency Check: The consistency of the pairwise matrix was checked using the consistency ratio CR [28]. The CR can be computed as
    C R =   C I R I
    where CI is the consistency index and RI is the random index.

2.6. GIS Model Setup

The process of a suitability assessment and identifying hotspots for reclaimed wastewater use involves two main steps. In the first step, the MCDA method was applied using the AHP technique to evaluate the influential geospatial decision criteria and subcriteria. In the second step, a GIS-MCDA model was developed using the weights and ranking of the criteria resulted from the previous step. In the GIS-MCDA method, a spatial decision is defined as a single raster of a specified size or a combination of multiple rasters. The normalized weights attributed to each criterion were used to derive new raster datasets. In order to derive AHP values, the new raster files were incorporated into the following equation implemented in map algebra:
Suitability Map = WRWS*RWS + WAL*AL + WGVZ*GVZ + WWP*WP
where WRWS, WAL, WGVZ, and WWP are the weight of Recycled Water Source (RWS), Agricultural Land (AL), Groundwater Vulnerability Zone (GVZ), and Watershed Prioritization (WP), respectively.
After the data collection, data were analyzed and evaluated using the geostatistical tools in GIS to obtain the MCDA criteria maps. Each selected subcriterion was represented by a thematic layer that was assigned with the values according to Table 3. Next, each main criterion or thematic layer was converted into a raster format. All of the raster data then processed using a weighted overlay tool to identify the most suitable areas for irrigation with reclaimed wastewater (hotspots). In the end, all of the generated suitability maps were represented at six suitability levels including “very high”, “high”, “moderate”, “low”, “very low”, and “not suitable”.

3. Results and Discussion

3.1. Criteria Evaluation

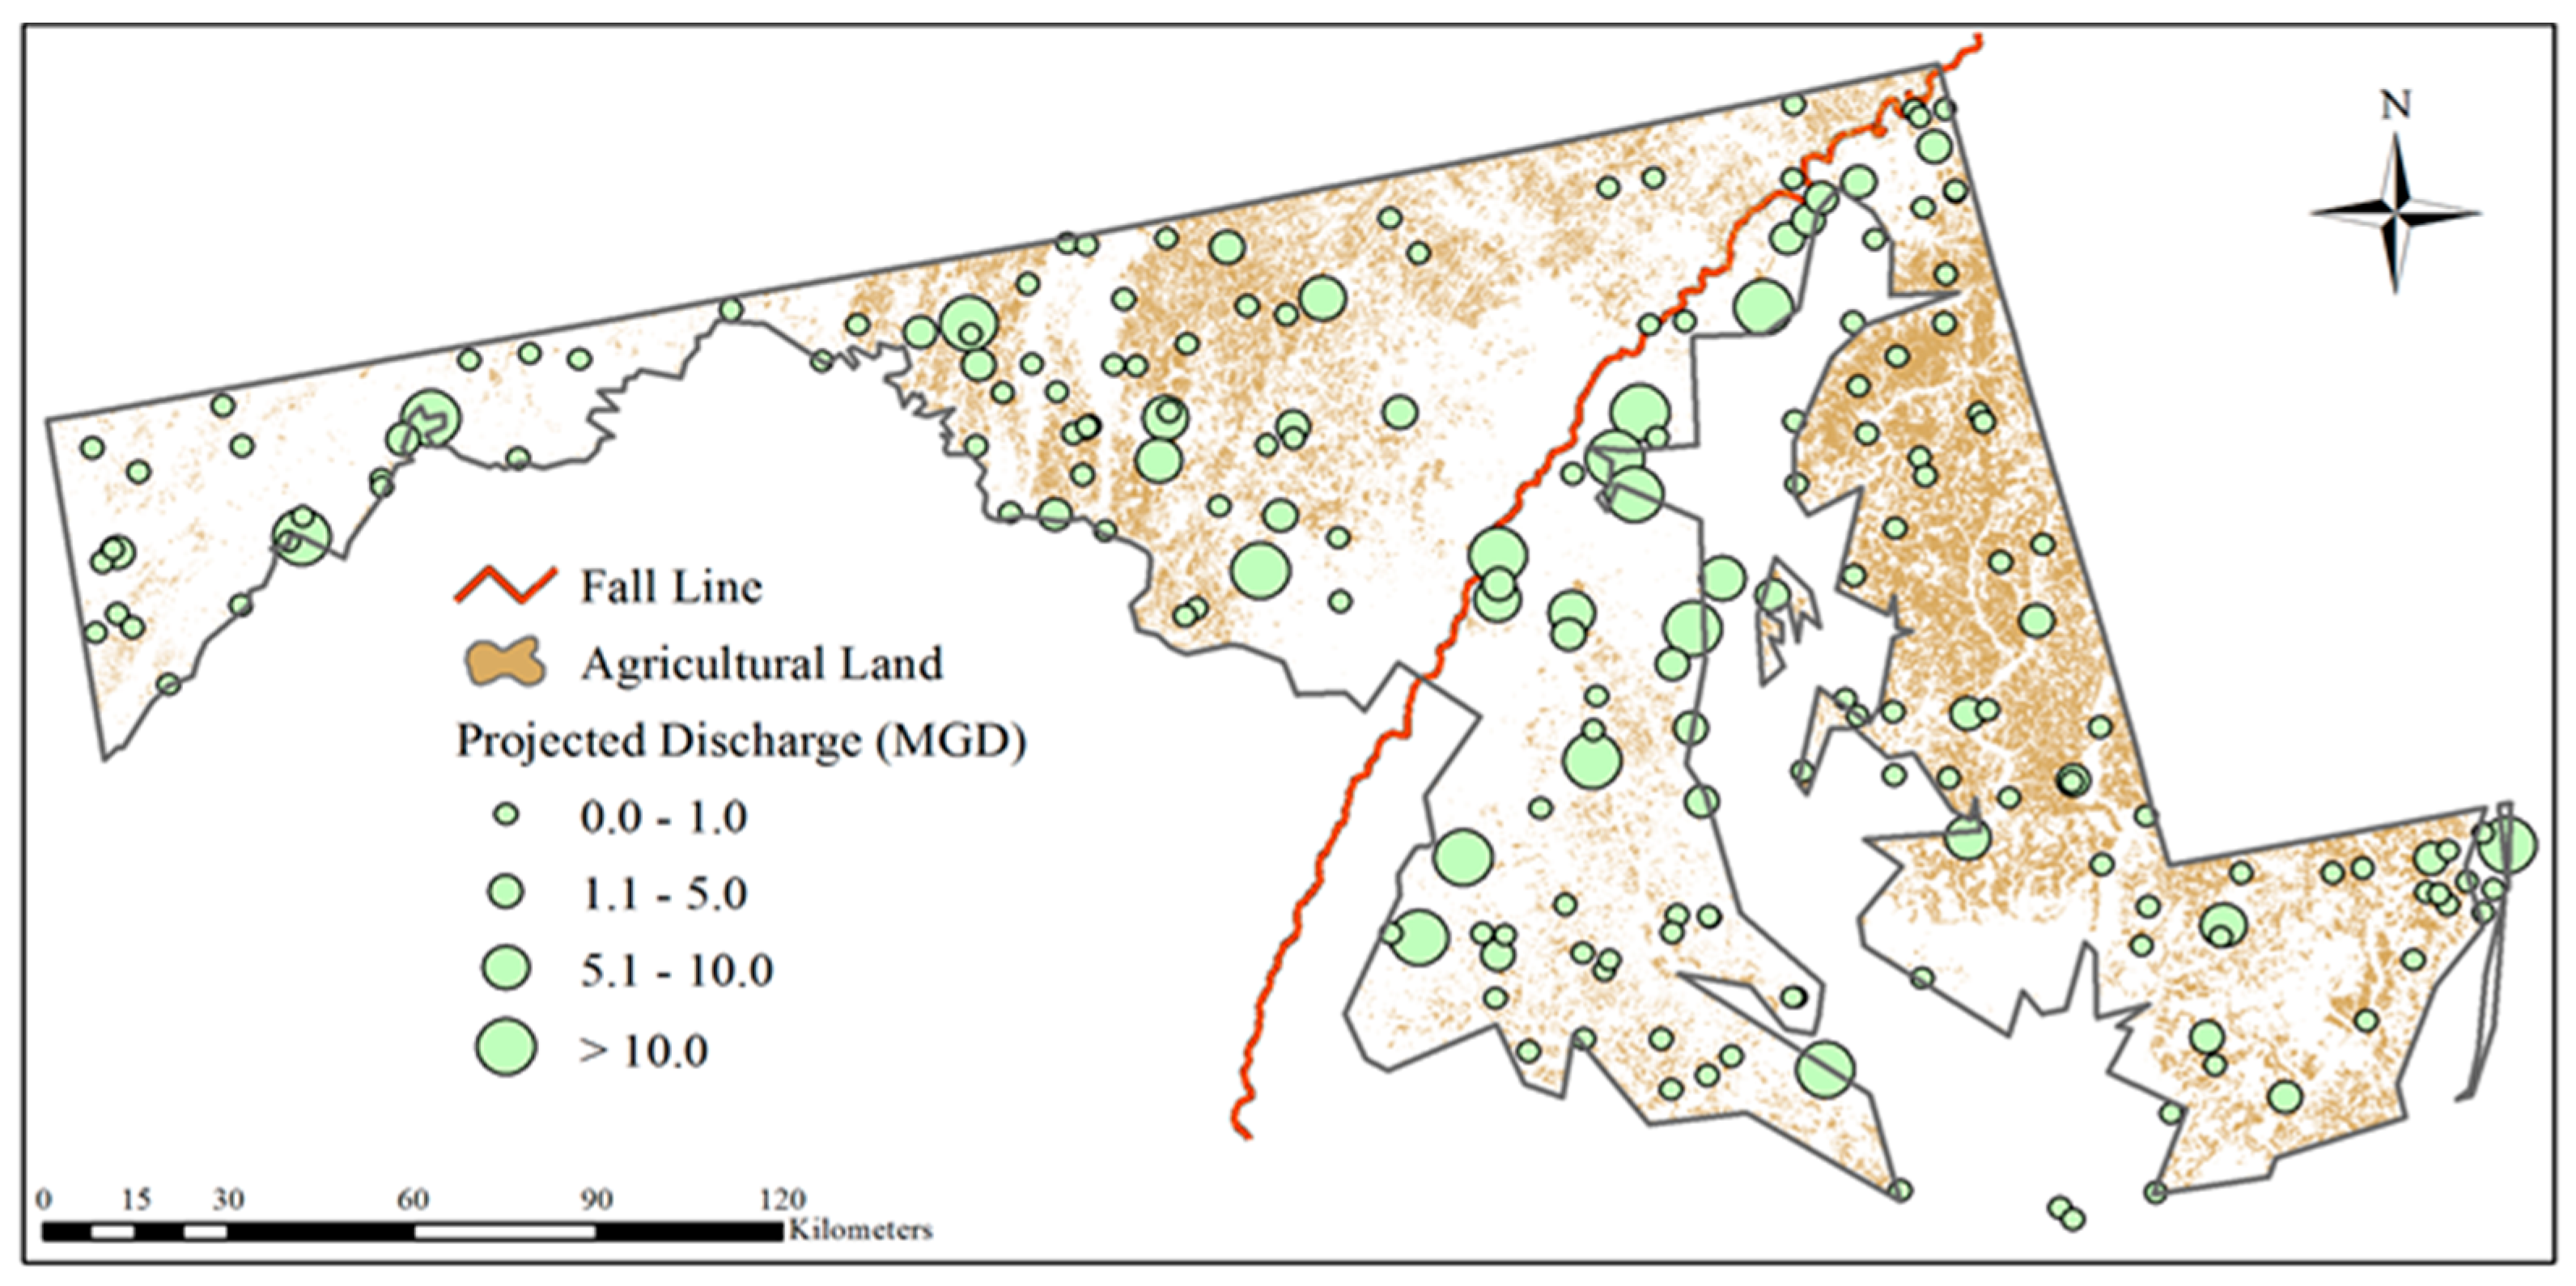
3.1.1. Reclaimed Wastewater Sources

Based on CWNS 2012 and MDE databases, a total of 279 WWTPs were included in the study area (Figure 4). According to the Clean Water Act, the projected flow was recorded for 195 out of 279 WWTPs. The database also completed with projected treated effluent information. Projected treatment discharge information was documented for 140 facilities where 101 facilities have the advanced treatment and 39 have secondary treatment processes. Note that all of large facilities (>10 MGD or 0.04 m3/s) are situated near the fall line where the urban areas are clustered and agricultural lands are minimal (Figure 4). Figure 5a shows the reclassified Euclidean distance map of the reclaimed wastewater sources considering all acceptable discharge methods. The proximity of the wastewater treatment plants to the agricultural land is the most important criteria to maintain the cost-effectiveness of water reuse in agriculture. In this study, three proximity maps were produced for three cases including:
Case 1:
All WWTPs with acceptable discharge methods (considering applicability and availability for irrigation use).
Case 2:
WWTPs categorized with capacity (considering treated effluent volume).
Case 3:
WWTPs including the treatment processes (considering appropriateness for irrigation of different types of crops).

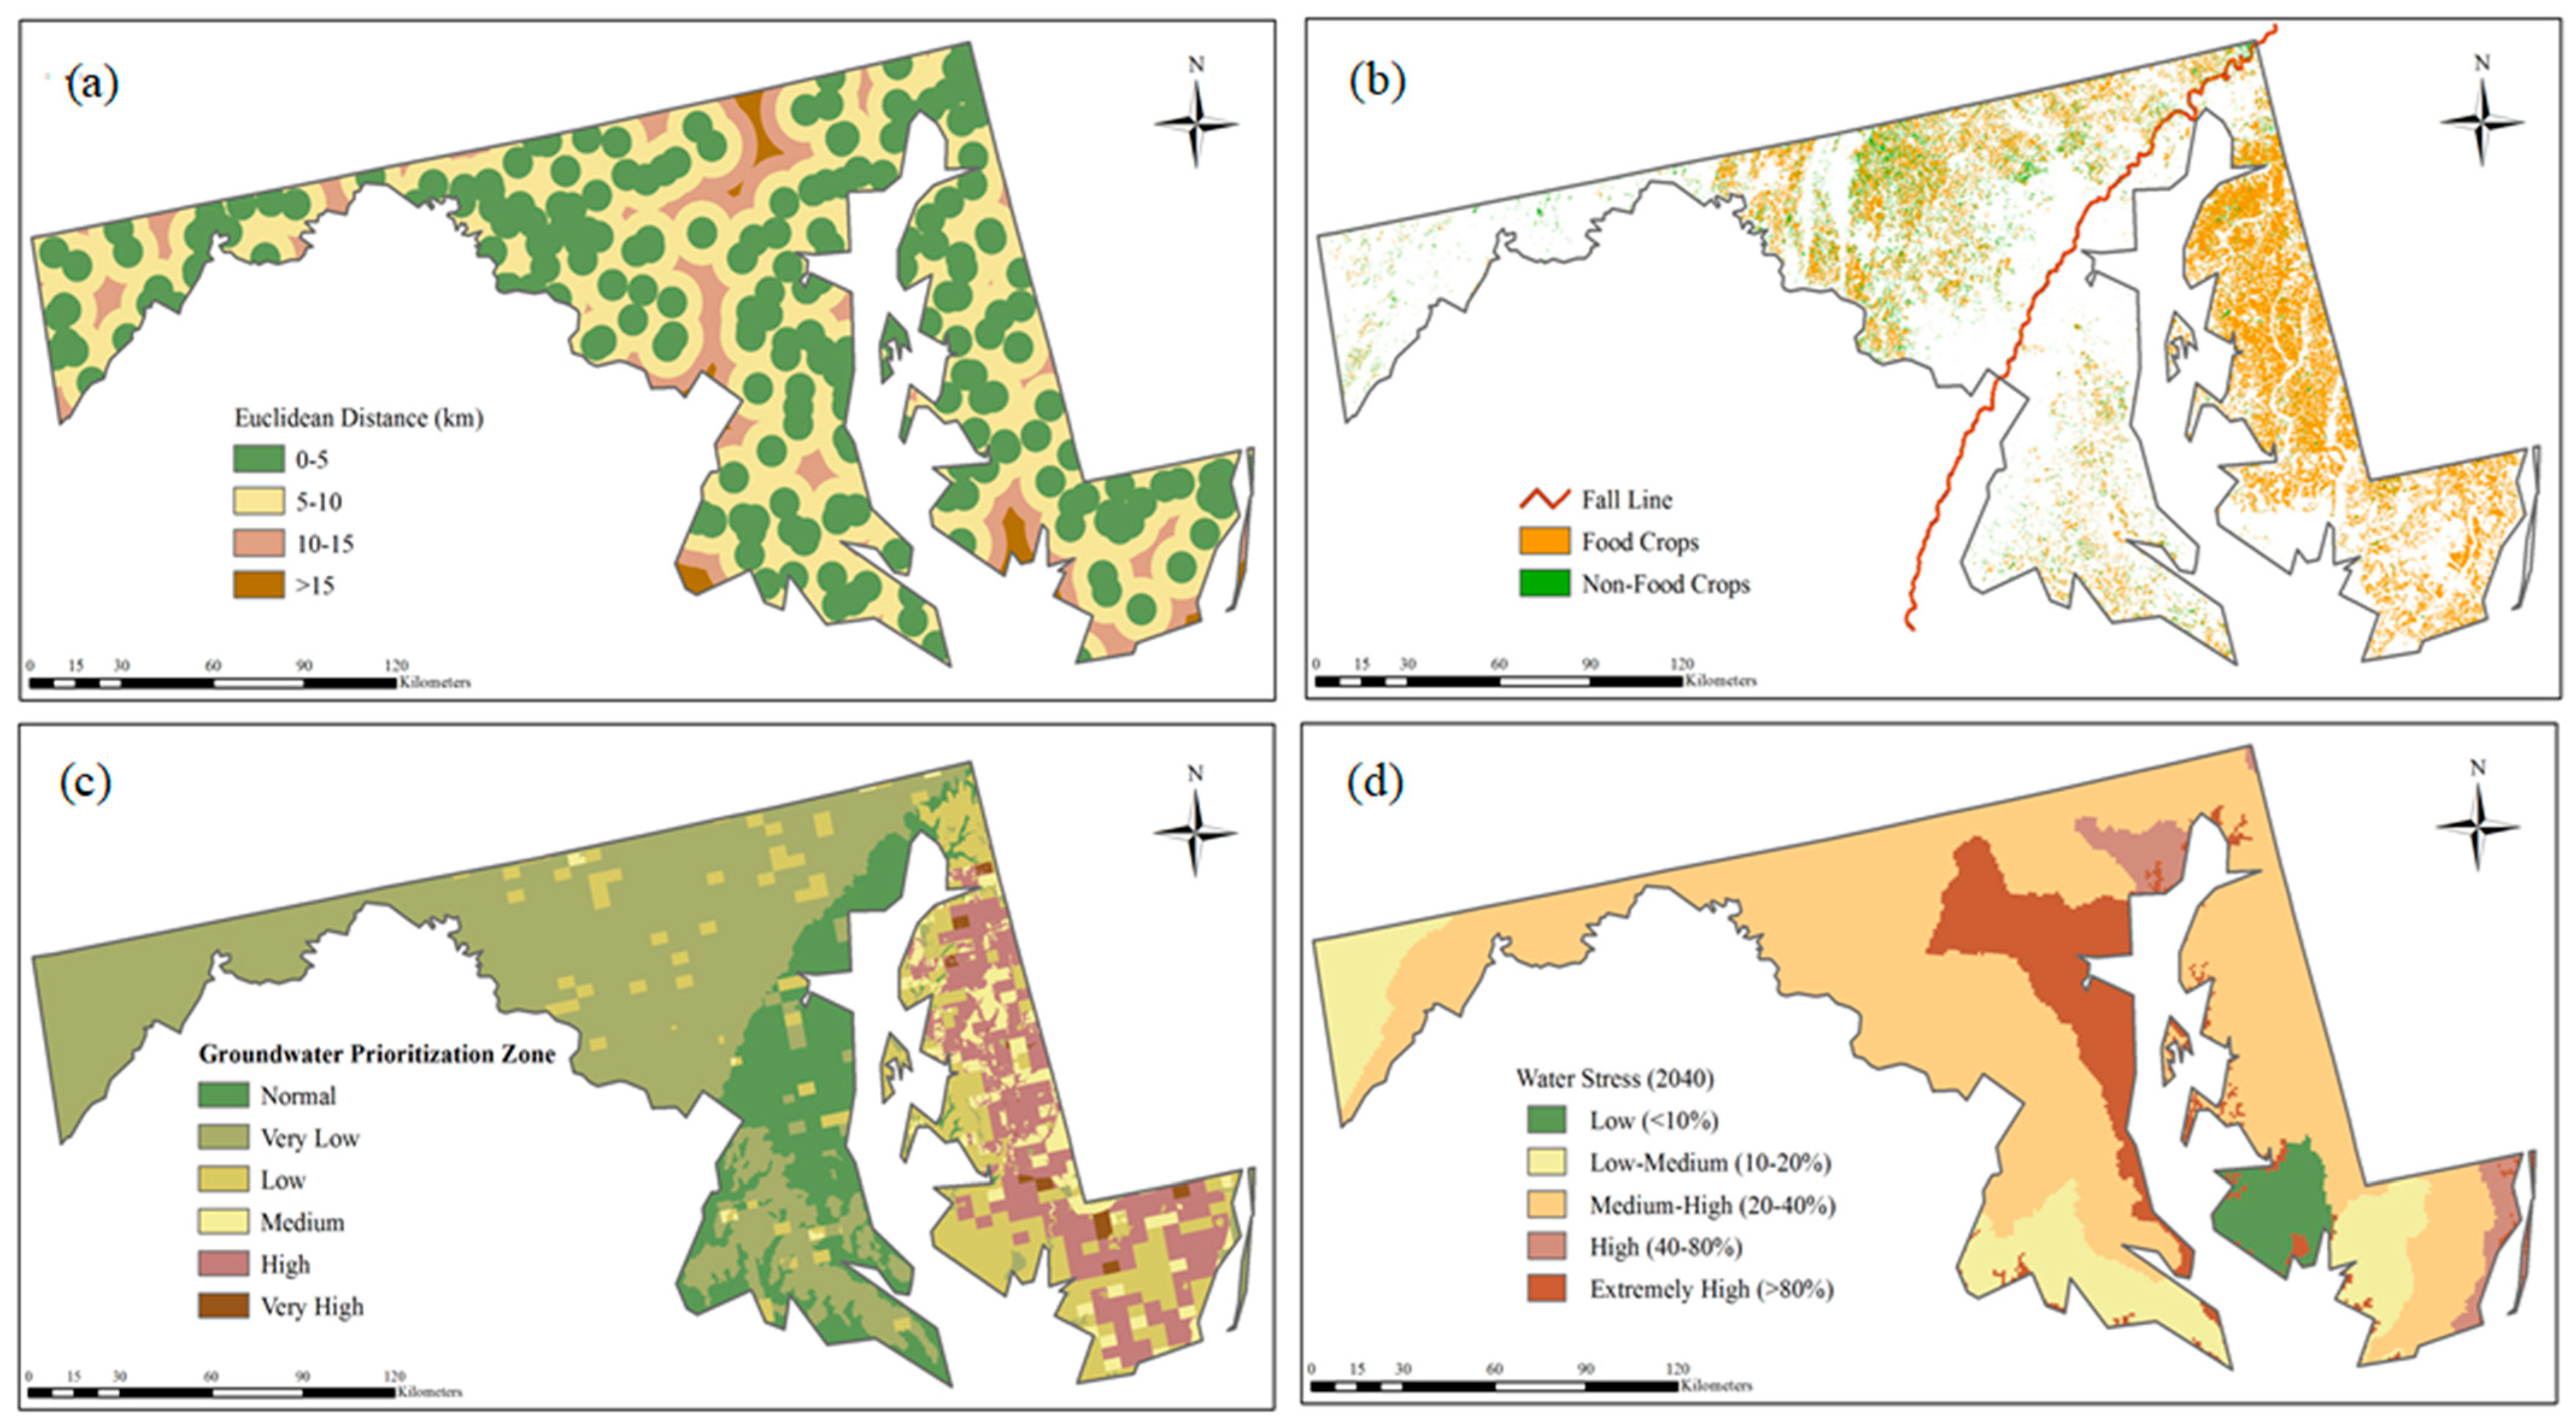
3.1.2. Agricultural Land

The agricultural lands were reclassified into two classes of food crops and non-food crops. The highest priority was assigned to non-food crops such as fodder, oil, and commercial crops (sod farms, nursery, Christmas trees, etc.). Based on the Maryland water reuse guideline, another class was selected for all suitable food crops such as grains, legumes & orchards which irrigation water does not have direct contact with the edible portion of the crop. From the reclassified maps (Figure 5b), it is found that most of the agricultural land is clustered in two regions of piedmont and Eastern Shore. Most food crop farms (corn and soybean) are clustered in the Eastern Shore, and non-food crops like forage crops (alfalfa and hay/non-alfalfa) are clustered in the Piedmont region. In addition, orchards (apple and peaches) and commercial farms (Christmas tree) are scattered in the Piedmont region, which has high potential for reclaimed wastewater use.

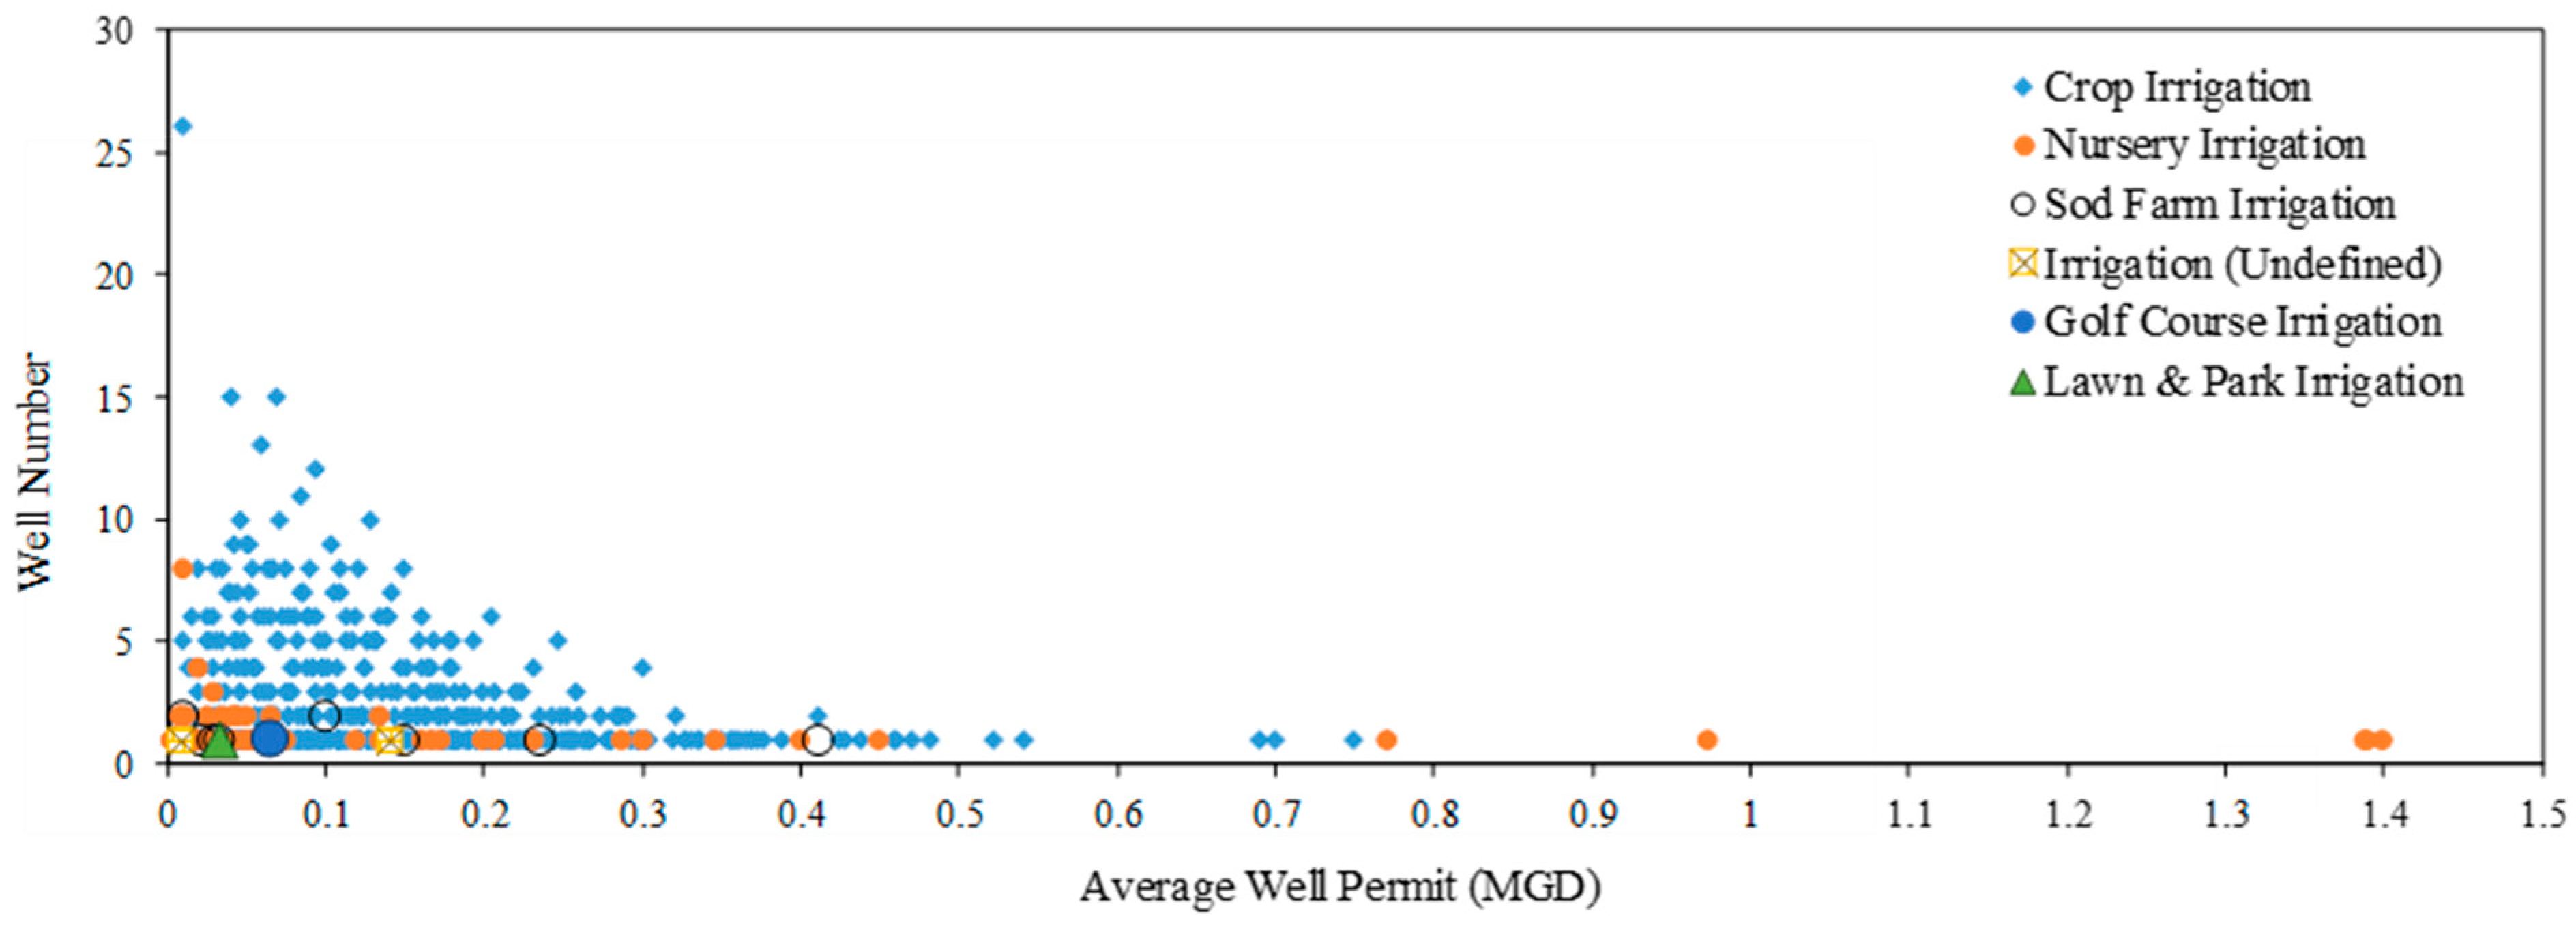
3.1.3. Groundwater Vulnerability Zone

Total of 1354 (out of 1471) permitted wells are extracting water from groundwater aquifers for irrigations, such as crop irrigation, nursery/sod farming irrigation, and golf course or park irrigation. Most of the wells are used for crop irrigation, from which the average permitted discharge is <0.5 MGD (500,000 GPD or 0.02 m3/s) (Appendix A Figure A2). They are mainly clustered in the Eastern Shore due to higher agricultural activity in that region (Appendix A Figure A3).
Most of the water in shallow unconfined groundwater is discharged to streams or the Bay or lost through evapotranspiration, and a very small fraction of it reaches the deeper aquifers. Shallow groundwater zones in the outcrop or subcrop areas have quick recharge properties, which also act as potential conduits for contamination (Appendix A Figure A3d). Therefore, these zones are considered unsuitable for drinking water use and more preferable for agricultural irrigation. Due to their better quality, deeper confined aquifers should be reserved for drinking water supply. In addition, pumping from deeper aquifers results in higher energy costs and will increase the operating cost of irrigation practices. The Western Shore of Chesapeake Bay primarily utilizes the geologically deeper confined aquifers; therefore, this region was also given higher priority for recycled water use for irrigation.
The spatial distribution of the permitted groundwater withdrawals indicated that most of the groundwater wells are situated on the agricultural land and higher withdrawal amounts are allocated in the coastal plain. Maryland’s coastal region is also facing saltwater intrusion problems due to lower aquifer depth and climate change. In addition, if the saturated thickness of a surficial coastal plain aquifer is less than approximately 25–30 feet (7.62–9.14 m) and is underlain by a confining unit, it becomes challenging for a farmer to withdraw sufficient water from shallow on-site wells. As a result, the generated groundwater prioritization map shows that low-lying flat plains of the Eastern Shore are found more to be favorable for recycled water use, whereas the upland plain of the western part is given less priority for recycled water use. The highest priority zones cover an area of 814.5 km2 and were mainly outlined in the Eastern Shore. The low (17,247 km2) and very low priority (55,976 km2) areas were mapped to the western part of Maryland due to the insignificant well numbers and location of outcrop and subcrop areas (Figure 5c).

3.1.4. Watershed Prioritization

Maryland’s watersheds were classified based on their water stress severity and local climate conditions using the method described before (Section 2.4.4). Maryland’s watersheds were categorized into Very High, High, Medium, Low, and Very low water stress conditions according to water stress severity. For instance, the Patapsco River Basin is expected to experience “very high” water stress by 2040, while Gunpowder-Patapsco is expected to face “high” water stress (Figure 5d). Watersheds were assigned different scores according to their water stress ranks, in which watersheds with the higher levels of water stress received the highest priority for reclaimed wastewater use for agricultural irrigation.

3.2. Criteria Ranking and AHP Assessment

The weights of each criterion and subcriterion were assigned based on the rationale described in before (Section 3.1). In this study, three matrices were designed for three cases including (1) all WWTPs with acceptable discharge methods (Case 1, Table 4), (2) WWTPs categorized with flow volume (Case 2, Table 5), and (3) WWTPs considering the treatment processes (Case 3, Table 6), respectively.
Agricultural lands close to WWTPs or downstream of treatment plants have easier access to reclaimed wastewater compared to areas that are further from the treatment plants or are located upstream. Therefore, the location of WWTPs and their proximity to the point of use are very important factors in the decision process. The proximity to WWTPs received a weighting of 55.6%, as the most important influence factor on agricultural land suitability for reclaimed wastewater use. In terms of normalized weights, agricultural land cover (25.9%) ranked second, being followed by GW basin prioritization (17.2%) and watershed prioritization (4.9%). Similarly, the highest weights (33.4%) were found for the larger facilities (>10 MGD) in Case-2 and the advanced treatment facilities (51.3%) in Case-3. The final CR values for all three matrices were checked and found to be 8.8%, 9.2%, and 5.3% for Cases 1–3, respectively.

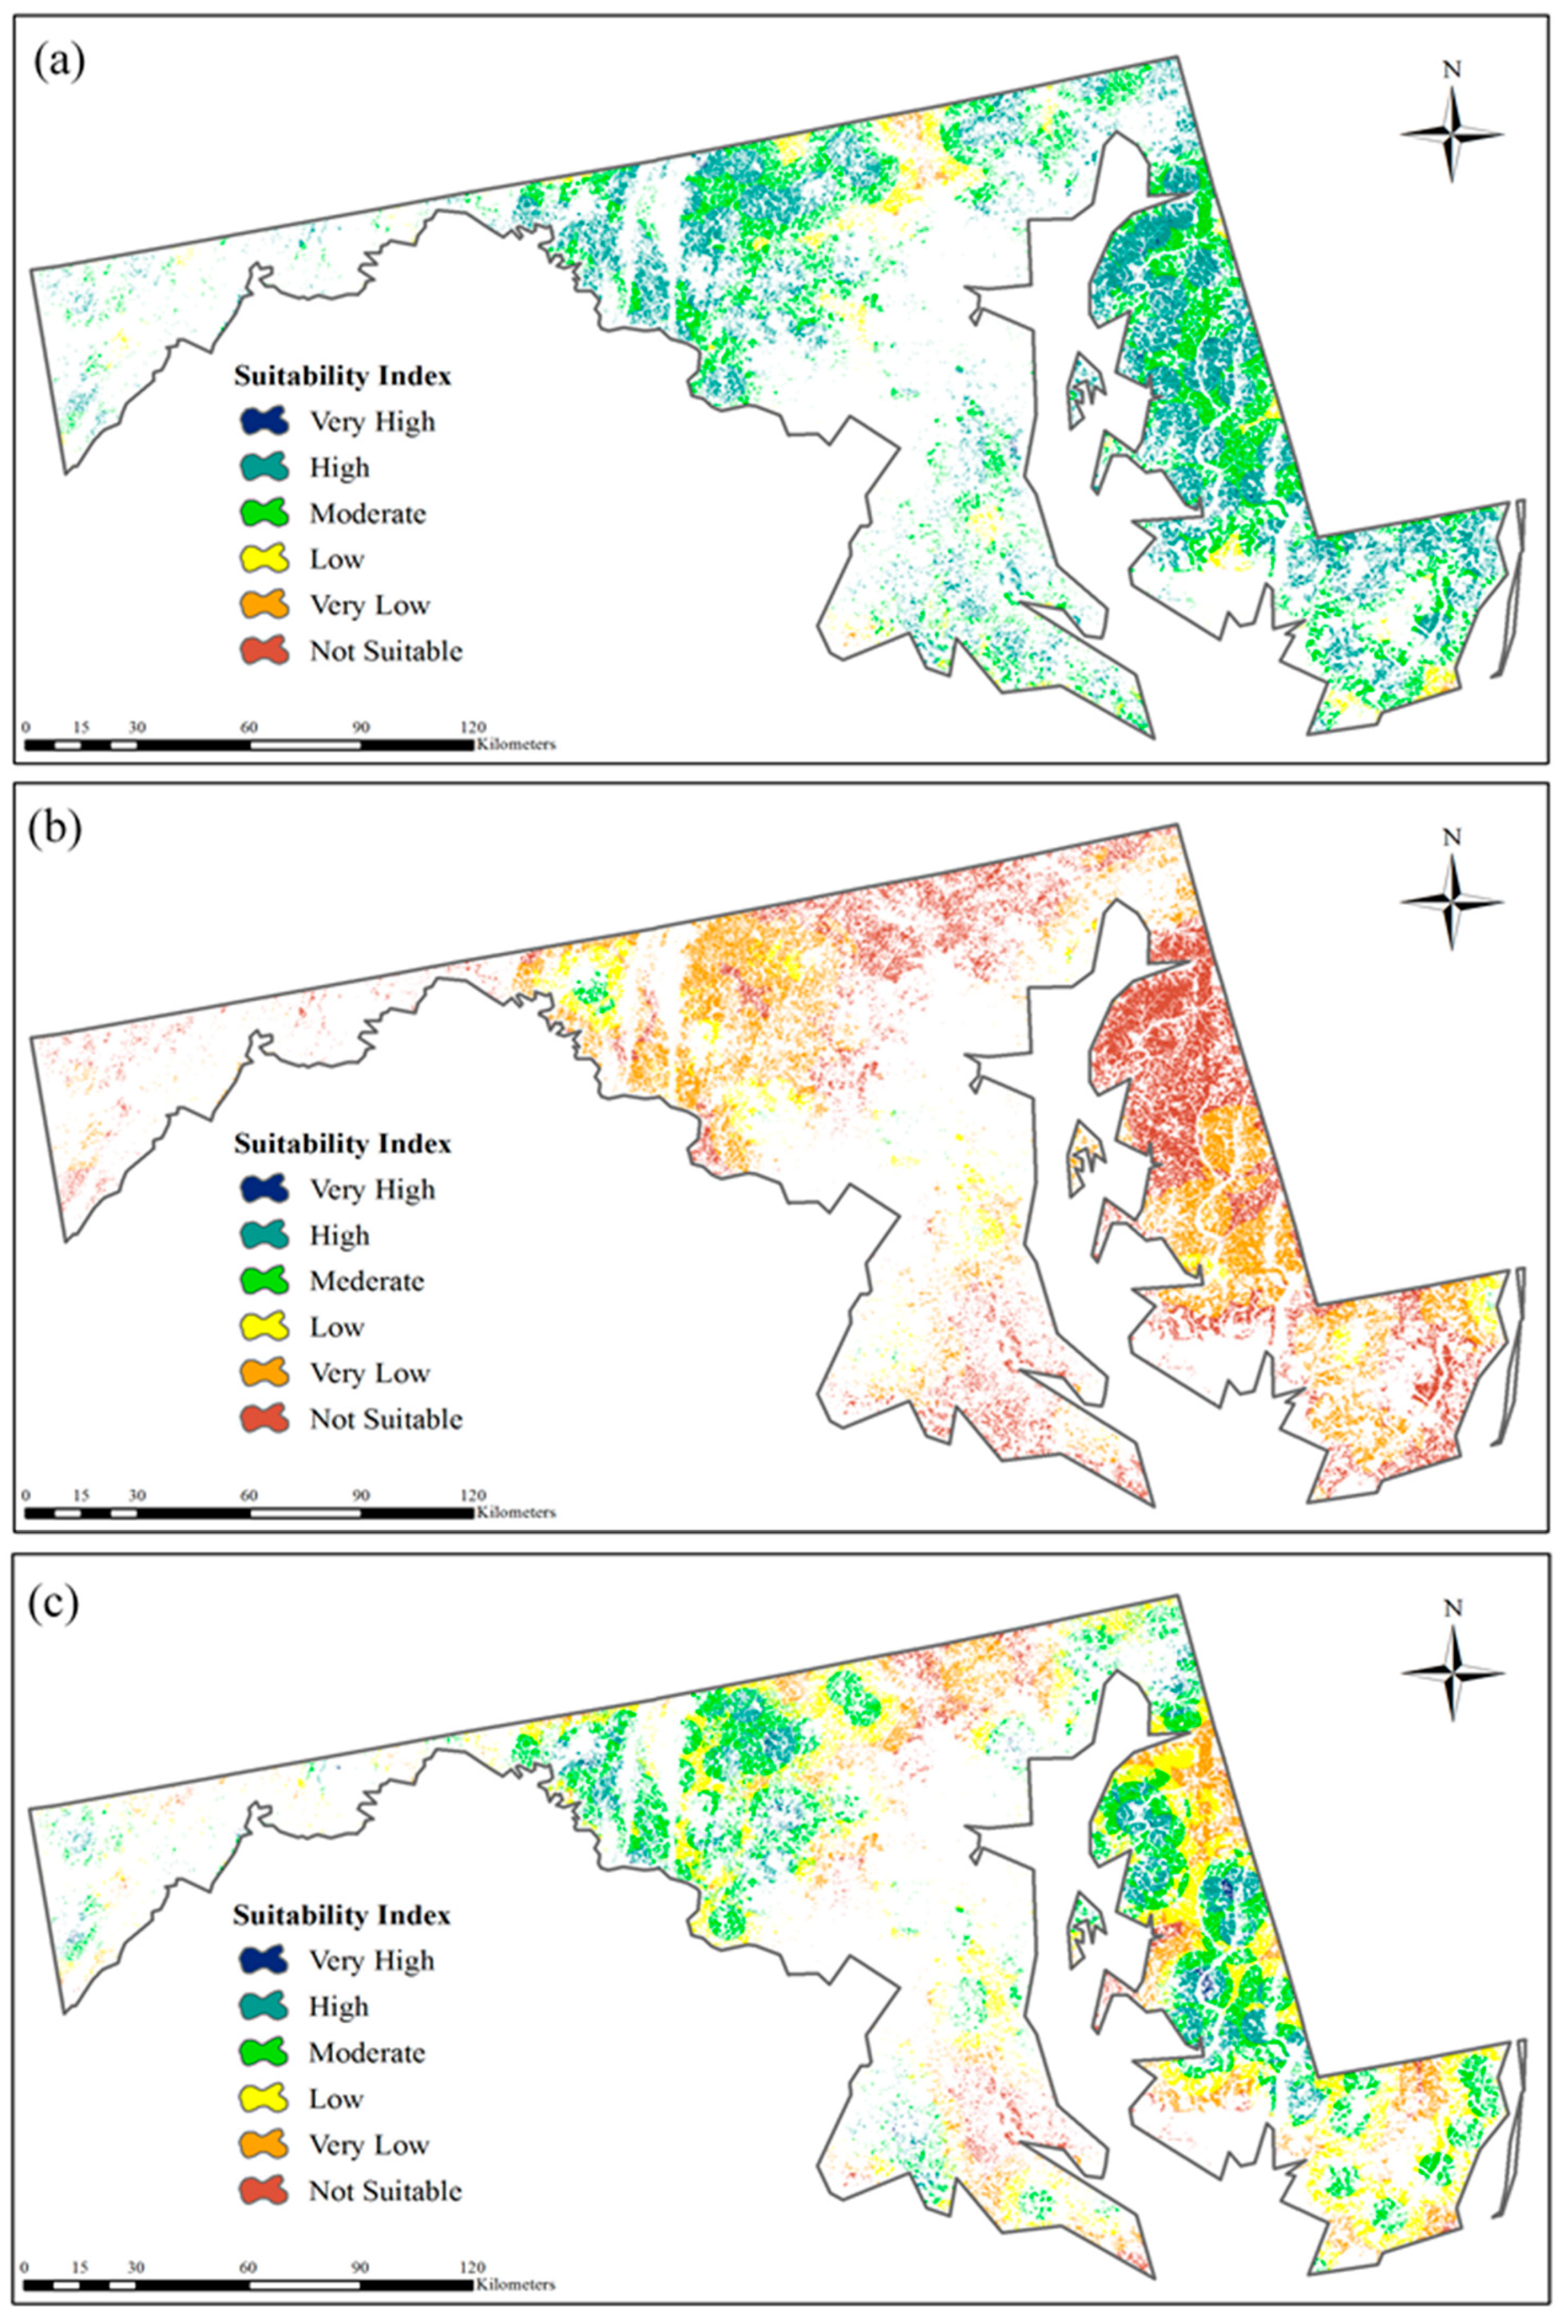
3.3. Suitability Maps

3.3.1. Case 1: Considering Selected Discharging Methods

Case 1 was constituted to assess the accessibility of each WWTP from the nearest agricultural land. Therefore, the generated suitability maps show the most suitable agricultural areas that are in close proximity to the WWTPs (less than 5 km). The suitability maps indicate that irrigation with reclaimed wastewater is influenced mainly by the proximity to the WWTP facilities (Figure 6a), and then the other criteria such as agricultural land cover. The resulted suitable areas were categorized into six classes including very high, high, moderate, low, very low, and not suitable classes (Figure 6). Based on the final weights (Table 4), the very high suitable class constitutes only 1.2% (66.17 km2) of the total agricultural area, and the high, moderate, and low suitable classes constitute 48.8% (2711.14 km2), 42.6% (2354.73 km2), and 6.6% (364.05 km2), respectively. The “very high” suitable areas are clustered at the Eastern Shore and northwest of the Piedmont region where most of the agricultural lands are located (Figure 4 and Figure 6a). Although most of the WWTPs are in the northeast Piedmont region, most of the grain crops (i.e., corn, soybean, etc.) are clustered at the Eastern Shore. Thus, “very high” and “high” suitability found mostly on the Eastern Shore and near the Atlantic Ocean, where more agricultural lands are located within close proximity to wastewater treatment facilities. As there is no significant agricultural activity near large urban areas with large WWTP facilities (Figure 4), urban agriculture could be another potential use for reclaimed wastewater. Urban agriculture was out of the scope of this research but could be an option to put the reclaimed wastewater from large facilities into beneficial use, and to reduce the cost of transferring treated wastewater.

3.3.2. Case 2: Considering Potential Discharge Capacity

Case 2 was established to evaluate the suitability in terms of discharge capacity, where agricultural areas close to the large WWTPs were given higher priorities. Most of the large WWTPs are located near the fall line (Figure 4), where most of the urban areas are located and agricultural lands are minimal. Agricultural areas within close proximity to large WWTPs are limited, and therefore “very high” suitable agricultural land was not found (Figure 6b). As a result, only 0.15 km2 of the agricultural land comprises as “high” suitable, and 30.72 km2 as a “moderate” category. Most of the WWTPs with low capacity (<1 MGD) is located on the Eastern Shore, which resulted in the highest (2268.38 km2, 41%) agricultural lands as “very low” suitable category. Approximate 50.9% of the total agricultural land found as non-suitable for recycled water use. In Maryland, most of the permitted wells are using less than 0.5 MGD water to irrigate (Appendix A Figure A2). In that case, adjusted flow classes with a lower range could produce a more comprehensive suitability map in this GIS-MCDA framework. For example, the reclaimed wastewater from medium and small facilities might not be sufficient for large agricultural lands but could be used as supplemental irrigation water for smaller farms.

3.3.3. Case 3: Considering Appropriate Treatment Process

In the next phase, the last suitability map was generated based on Case 3, which includes the treatment process of WWTPs (Figure 6c). According to Maryland’s water reuse guideline, recycled water from WWTPs with an advanced treatment process is given priority for all non-food crops and selected food-crops; the edible portion of which does not have direct contact with irrigated water. As a result, projected effluent information (treatment process) was collected from the CWNS factsheet and included for the suitability analysis. Results show that agricultural areas with “very high” suitability comprise 34.97 km2 (0.63%), “high” areas comprise 749.23 km2 (13.5%), and “moderate” areas comprise 1818.16 km2 (32.9%) of the total agricultural areas. As Maryland has a guideline for water reuse that only recommends the irrigation of food crops where there is no contact with the edible portion of the crop, vegetables and fruits were not included here for the suitability analysis. If the regulation is revised in the future and includes all types of food crops, then under this decision framework the “very high” suitable area will increase to 35 km2, “high” to 751.5 km2, and “moderate” to 1828.17 km2 of the total agricultural land.

3.3.4. Final Composite Map

In the final phase, the composite model was generated to evaluate the suitability of treated water for agricultural irrigation considering availability, capacity, and appropriateness of the treatment process from municipal WWTPs. Thus, the composite suitability map was generated by compiling the results from Cases 2 and 3. Several hotspots were identified with “high” to “very low” suitability index, mostly in western Maryland, western Piedmont, and Eastern Shore (Figure 7). The AHP model categorized 0.5% (26.4 km2) and 14.44% (798.8 km2) of agricultural land in the study area as high and moderate, respectively. The areas with low and very low suitability classes are 45.99% and 34.1% of the total agricultural area, respectively. Overall, high and moderate suitability classes were clustered in the western region (box A), central Piedmont (box B), and the Eastern Shore of Maryland (boxes C and D). There are some patches of high and moderate areas in the central part of the western shore where large facilities are located. Another cluster of moderate to low suitability areas is formed along the Atlantic Ocean of the Eastern Shore.

4. Future Implications

The selection of decision criteria (different flow category or proximity limit) and suitability indicators (different users) and/or assigning different weights to them could result in different outcomes from the model. For instance, by modifying the regulations (i.e., permitting vegetable irrigation), more agricultural land would become suitable for water reuse application. The red patches of watermelon farms shown in box D of Figure 7 were not included in this study. However, these farms are in close proximity of nearby WWTP. Therefore, another suitability map was generated where farms of edible crops were included (not shown here). From this regenerated map, we found that the “high” suitable area might increase by 0.01 km2 (3.21 acres), “moderate” by 2.05 km2 (506.57 acres), and “low” by 14.23 km2 (3516.31 acres) if that category of crops was included.
In this study, only POTW-WWTPs that treats the domestic sewages were considered as the primary source to obtain reclaimed wastewater for irrigation. Other non-POTW facilities could be additional sources of reclaimed wastewater for irrigation that often treat wastewater from industries, such as manufacturing, food processing, and beverage production activities. Nevertheless, the developed GIS-MCDA framework in this study could be used to regenerate the potential agricultural land mapping including the non-POTW and/or other treatment facilities.
In addition, in other studies it has been found that wastewater reuse is impacted by water pricing, distribution cost, and management policies [29,30]. For instance, the users have found it more attractive if reclaimed water rates are subsidized especially for agricultural users [30]. Consequently, it is expected that if the local governments or state agencies implement an incentive program or provide subsidy to reduce the cost of reclaimed water transfer, there would be more suitable areas for irrigation that are located further from the treatment facilities. Therefore, it is important to consider the pricing policies to promote the wastewater reuse for agricultural use.

5. Conclusions

Increasing population, continuing development, and uncertain rainfall patterns in the Mid-Atlantic region have resulted in higher pressure on high-quality groundwater sources. As a result of overuse, groundwater in some parts of the region is facing problem and diminishing its productivity. The main focus of this study was to identify the critical groundwater zones and suitable agricultural areas to use reclaimed wastewater for irrigation. A decision-making framework was developed in this study to evaluate the suitable agricultural land for recycled water use considering wastewater treatment facilities characteristics (treated effluent volume, quality, and discharge method). The main objective of this study was to demonstrate the application of the GIS-MCDA-based land suitability evaluation method to solve this spatial problem. Several decision criteria were considered to assess the suitable agricultural land for irrigation with recycled water including location of WWTPs, agricultural land cover (crop type), groundwater vulnerability zone, and climatic conditions. The groundwater vulnerability map was generated for the first time in the study area, and then was incorporated into the GIS-MCDA framework. The groundwater prioritization map showed that the low-lying flat plains of the Eastern Shore are more favorable for recycled water use, whereas the upland plain of the western part was showing less priority for recycled water use. Based on the outputs of the GIS-MCDA framework, about 0.15 km2 and 30.72 km2 of agricultural land were found as highly and moderately suitable, respectively, for water reuse when WWTPs were categorized based on their capacity. When treatment appropriateness was considered, 34.97 km2 and 749.23 km2 of agricultural land found as “very highly” and “highly” suitable, respectively. The developed decision framework and workflow used in this study will offer a regional or statewide decision tool for the decision-makers to promote the recycled water use for agricultural irrigation. Of note is depending on management goals and strategies, additional decision criteria and subcriteria can be easily incorporated into the decision framework. Furthermore, in case of future modifications of the regulations and guidelines or any other changes in the study area, the ranking and weighting of decision criteria can be adjusted accordingly. This study is the first of its kind in Maryland to determine where large-scale recycled water use for agricultural irrigation is recommended. It also has the capacity to be implemented in other regions (e.g., in Mid-Atlantic), where similar conditions and agricultural activities exist.

Author Contributions

Conceptualization, M.N.-A. and M.P.; methodology, M.N.-A. and M.P.; data collection and analysis, M.P.; model development, M.N.-A. and M.P.; data visualization, M.P.; writing—original draft, M.P.; writing—review and editing, M.N.-A., M.P., A.S., and H.M.; supervision, M.N.-A.; project administration, M.N.-A.; funding acquisition, M.N.-A. and A.S.; All authors have read and agreed to the published version of the manuscript.

Funding

This work was supported by the United States Department of Agriculture—National Institute of Food and Agriculture, Grant number 2016-68007-25064, which established CONSERVE: A Center of Excellence at the Nexus of Sustainable Water Reuse, Food and Health.

Acknowledgments

The authors would like to thank the scientists at Maryland Geological Survey, especially Andrew Staley for his contributions in providing data and reviewing the paper.

Conflicts of Interest

The authors declare no conflict of interest.

Appendix A

Figure A1. Developed decision hierarchy to identify the groundwater vulnerability zone.
Hydrology 08 00004 g0a1
Figure A2. Number of wells that are categorized based on the permitted average withdrawal.
Hydrology 08 00004 g0a2
Figure A3. Reclassified maps that are generated to identify the groundwater vulnerability zones. (a) Permitted well density per tax map; (b) Spatial distribution of aquifer thickness; (c) Permitted water withdrawal rate per tax map; and (d) Spatial distribution of outcrop and subcrop areas.
Hydrology 08 00004 g0a3

References

  1. Masterson, J.P.; Pope, J.P.; Fienen, M.N.; Monti, J., Jr.; Nardi, M.R.; Finkelstein, J.S. Assessment of Groundwater Availability in the Northern Atlantic Coastal Plain Aquifer System from Long Island, New York, to North Carolina; US Geological Survey: Reston, VA, USA, 2016; pp. 2330–7102.
  2. Boesch, D.F. Comprehensive Assessment of Climate Change Impacts in Maryland; Report to the Maryland Commission on Climate Change; IAN Press: Cambridge, MD, USA, 2008. [Google Scholar]
  3. Paul, M.; Dangol, S.; Kholodovsky, V.; Sapkota, A.R.; Negahban-Azar, M.; Lansing, S. Modeling the Impacts of Climate Change on Crop Yield and Irrigation in the Monocacy River Watershed, USA. Climate 2020, 8, 139. [Google Scholar] [CrossRef]
  4. Chen, Z.; Ngo, H.H.; Guo, W. A critical review on sustainability assessment of recycled water schemes. Sci. Total Environ. 2012, 426, 13–31. [Google Scholar] [CrossRef] [PubMed]
  5. Rahman, M.M.; Hagare, D.; Maheshwari, B. Use of Recycled Water for Irrigation of Open Spaces: Benefits and Risks. In Balanced Urban Development: Options and Strategies for Liveable Cities; Springer: Berlin/Heidelberg, Germany, 2016; pp. 261–288. [Google Scholar]
  6. Jaramillo, M.; Restrepo, I. Wastewater Reuse in Agriculture: A Review about Its Limitations and Benefits. Sustainability 2017, 9, 1734. [Google Scholar] [CrossRef] [Green Version]
  7. Hanjra, M.A.; Drechsel, P.; Wichelns, D.; Qadir, M. Transforming urban wastewater into an economic asset: Opportunities and challenges. In Wastewater; Springer: Berlin/Heidelberg, Germany, 2015; pp. 271–278. [Google Scholar]
  8. Miller-Robbie, L.; Ramaswami, A.; Amerasinghe, P. Wastewater treatment and reuse in urban agriculture: Exploring the food, energy, water, and health nexus in Hyderabad, India. Environ. Res. Lett. 2017, 12, 075005. [Google Scholar] [CrossRef]
  9. Angelakis, A.N.; Asano, T.; Bahri, A.; Jimenez, B.E.; Tchobanoglous, G. Water Reuse: From Ancient to Modern Times and the Future. Front. Environ. Sci. 2018, 6, 26. [Google Scholar] [CrossRef] [Green Version]
  10. CBF. Climate Change and the Chesapeake Bay: Challenges, Impacts, and the Multiple Benefits of Agricultural Conservation Work (Reports); Chesapeake Bay Foundation: Annapolis, MD, USA, 2007; Available online: https://umaryland.on.worldcat.org/search?queryString=no%3A+192021227#/oclc/192021227 (accessed on 30 October 2019).
  11. EPA. Chesapeake Bay Progress: Wastewater Pollution Reduction Leads the Way; U.S. Environmental Protection Agency: Washington, DC, USA, 2016. Available online: https://www.epa.gov/sites/production/files/2016-06/documents/wastewater_progress_report_06142016.pdf (accessed on 30 October 2019).
  12. Rees, P.L. Advancing Agricultural Water Security and Resilience under Nonstationarity and Uncertainty: Evolving Roles of Blue, Green, and Grey Water. J. Contemp. Water Res. Educ. 2018, 165, 1–3. [Google Scholar] [CrossRef]
  13. Falkenmark, M.; Rockstrom, J.; Rockström, J. Balancing Water for Humans and Nature: The New Approach in Ecohydrology; Earthscan: London, UK, 2004. [Google Scholar]
  14. Maryland’s Plan to Adapt to Saltwater Intrusion and Salinization Prepared by the Maryland Department of Planning December 2019. Available online: https://planning.maryland.gov/Documents/OurWork/envr-planning/2019-1212-Marylands-plan-to-adapt-to-saltwater-intrusion-and-salinization.pdf (accessed on 28 February 2019).
  15. Denver, J.; Nardi, M. Thickness of the Surficial Aquifer, Delmarva Peninsula, Maryland and Delaware: US Geological Survey Data Release; US Geological Survey: Reston, VA, USA, 2016.
  16. Andreasen, D.C.; Staley, A.W.; Achmad, G. Maryland Coastal Plain Aquifer Information System: Hydrogeologic Framework, Maryland Geological Survey Open-File Report 12-02-20. 2013; p. 121. Available online: http://www.mgs.md.gov/reports/OFR_12-02-20.pdf (accessed on 14 December 2020).
  17. Kabir, G. Multiple Criteria Inventory Classification under Fuzzy Environment. Int. J. Fuzzy Syst. Appl. 2012, 2, 76–92. [Google Scholar] [CrossRef] [Green Version]
  18. Kabir, G.; Sadiq, R.; Tesfamariam, S. A review of multi-criteria decision-making methods for infrastructure management. Struct. Infrastruct. Eng. 2014, 10, 1176–1210. [Google Scholar] [CrossRef]
  19. Paul, M.; Negahban-Azar, M.; Shirmohammadi, A.; Montas, H. Assessment of agricultural land suitability for irrigation with reclaimed water using geospatial multi-criteria decision analysis. Agric. Water Manag. 2020, 231, 105987. [Google Scholar] [CrossRef]
  20. Sadiq, R.; Tesfamariam, S. Environmental decision-making under uncertainty using intuitionistic fuzzy analytic hierarchy pro-cess (IF-AHP). Stoch. Environ. Res. Risk Assess. 2009, 23, 75–91. [Google Scholar] [CrossRef]
  21. Aldababseh, A.; Temimi, M.; Maghelal, P.; BranchiD, O.; Wulfmeyer, V. Multi-Criteria Evaluation of Irrigated Agriculture Suitability to Achieve Food Security in an Arid Environment. Sustainability 2018, 10, 803. [Google Scholar] [CrossRef] [Green Version]
  22. Assefa, T.; Jha, M.; Reyes, M.; Srinivasan, R.; Worqlul, A.W. Assessment of suitable areas for home gardens for irrigation poten-tial, water availability, and water-lifting technologies. Water 2018, 10, 495. [Google Scholar] [CrossRef] [Green Version]
  23. Ayalew, G. Land Suitability Evaluation for surface and sprinkler irrigation Using Geographical Information System (GIS) in Guang Watershed, Highlands of Ethiopia. J. Environ. Earth Sci. 2014, 4, 140–149. [Google Scholar]
  24. Rikalovic, A.; Cosic, I.; Lazarevic, D. GIS Based Multi-criteria Analysis for Industrial Site Selection. Procedia Eng. 2014, 69, 1054–1063. [Google Scholar] [CrossRef] [Green Version]
  25. Yalew, S.; Van Griensven, A.; Van Der Zaag, P. AgriSuit: A web-based GIS-MCDA framework for agricultural land suitability assessment. Comput. Electron. Agric. 2016, 128, 1–8. [Google Scholar] [CrossRef]
  26. EPA. 2012 Guidelines for Water Reuse; U.S. Environmental Protection Agency: Washington, DC, USA, 2012.
  27. Luck, M.; Landis, M.; Gassert, F. Aqueduct Water Stress Projections: Decadal Projections of Water Supply and Demand Using CMIP5 GCMs; World Resources Institute: Washington, DC, USA, 2015. [Google Scholar]
  28. Saaty, T.L. Modeling unstructured decision problems—The theory of analytical hierarchies. Math. Comput. Simul. 1978, 20, 147–158. [Google Scholar] [CrossRef]
  29. Jodar-Abellan, A.; López-Ortiz, M.I.; Melgarejo, J. Wastewater Treatment and Water Reuse in Spain. Current Situation and Perspectives. Water 2019, 11, 1551. [Google Scholar] [CrossRef] [Green Version]
  30. Molina-Giménez, A. Legal Analysis and Case Study on the Choice between Setting Environmental Flows by Using Re-claimed Water in Non-Permanent Rivers and the Sustainable Management of Groundwater in Southeast Spain. Water 2020, 12, 2171. [Google Scholar] [CrossRef]
Figure 1. Map of the study area, showing the main three regions and Fall Line within the state of Maryland.
Hydrology 08 00004 g001
Figure 2. Three-stage classification process for wastewater treatment plants adapted from Paul et al. [19].
Hydrology 08 00004 g002
Figure 3. Developed decision hierarchy for the evaluation of suitable agricultural land for irrigation with recycled water.
Hydrology 08 00004 g003
Figure 4. Location of all selected wastewater treatment plants (WWTPs) within Maryland.
Hydrology 08 00004 g004
Figure 5. Reclassified maps of the influential criteria: (a) distance of WWTPs, (b) agricultural land, (c) groundwater vulnerability, and (d) climate.
Hydrology 08 00004 g005
Figure 6. Suitability Map for three cases: (a) Case 1: considering selected discharging methods, (b) Case 2: considering potential discharge capacity, and (c) Case 3: considering appropriate treatment process.
Hydrology 08 00004 g006
Figure 7. The composite suitability map showing the hotspot of the suitable agricultural lands ranging from “high” to “very low” index for recycled water irrigation. Four clustered suitability zones are showing with existing crops pattern in the boxes.
Hydrology 08 00004 g007
Table 1. List of datasets used in this study.
CriteriaData TypeData Source
Wastewater Treatment Plants (WWTPs)Location and discharge information of the facilitieshttps://www.epa.gov/cwns
Projected flow and treatment information of the facilitieshttps://www.epa.gov/npdes
https://mde.maryland.gov/Pages/index.aspx
Land CoverLocation, acreage, and types of cropshttps://nassgeodata.gmu.edu/CropScape/
GroundwaterPermitted well informationhttps://mde.maryland.gov/Pages/index.aspx
Geological information of aquiferhttp://www.mgs.md.gov/groundwater/index.html
Surficial aquifer thickness maphttps://www.usgs.gov/media/images/thickness-surficial-aquifer-sediments-delmarva-peninsula-md
ClimateAqueduct water stress projections datahttps://www.wri.org/aqueduct
Table 2. Saaty’s [28] nine-point pairwise scale and definition to assign a weight to the criteria.
Intensity of ImportanceDefinition
1Equal Importance
3Weak Importance
5Strong Importance
7Very Strong Importance
9Extremely Importance
2, 4, 6, and 8Intermediate Values Between Adjacent Scale Values
Table 3. The list of main criteria and subcriteria threshold used in the GIS-MCDA model.
Criteria- Thematic LayerSub Criteria—Feature ClassRank
Agricultural Land Non-food Crops—Commercial, Fiber, Fodder & Oil Crops9
Food Crops—Grains, Legumes & Orchard7
Distance from WWTP (km)0–59
5–107
10–155
>153
Groundwater Basin PrioritizationVery High9
High8
Medium7
Low6
Very Low5
Normal3
Watershed PrioritizationsVery High9
High8
Medium7
Low6
Very Low5
Table 4. Pairwise matrix for the decision criteria for Case 1: considering selected discharging methods. Consistency Ration (CR) was calculated based on the Equation (1).
Proximity to WWTPsAgricultural Land CoverGW Basin PrioritizationWatershed PrioritizationWeightsRankCR
Proximity to WWTPs 1.003.005.007.0055.6%18.8%
Agricultural
Land Cover
0.331.003.005.0025.9%2
GW Basin
Prioritization
0.200.251.005.0013.6%3
Watershed
Prioritization
0.140.200.201.004.9%4
Table 5. Pairwise matrix for the decision criteria for Case 2: considering potential discharge capacity. Consistency Ration (CR) was calculated based on the Equation (1).
Proximity to WWTPsAgricultural Land CoverGW Basin PrioritizationWatershed PrioritizationWeightsRankCR
Advanced TreatmentSecondary Treatment
Advanced Treatment1.003.005.007.009.0051.3%15.3%
Secondary Treatment0.331.003.005.007.0026.2%2
Agricultural Land Cover0.200.331.003.005.0012.9%3
GW Basin Prioritization 0.140.200.331.003.006.3%4
Watershed Prioritization0.110.140.200.331.003.3%5
Table 6. Pairwise matrix for the decision criteria for Case 3: considering the appropriate treatment process. Consistency Ration (CR) was calculated based on the Equation (1).
Proximity to WWTPsAgricultural Land CoverWatershed PrioritizationGW Basin PrioritizationWeightsRankCR
Flow > 155 ≤ Flow ≤ 151 ≤ Flow ≤ 5Flow < 1
Flow > 151.002.003.004.005.007.008.0033.4%19.2%
5 ≤ Flow < 150.501.002.003.005.007.008.0024.3%2
1 ≤ Flow < 50.330.501.002.005.007.008.0018.1%3
Flow < 10.250.330.501.003.005.007.0011.6%4
Agricultural Land Cover0.200.200.200.331.005.005.007.0%5
GW Basin Prioritization 0.140.140.140.200.201.005.003.6%6
Watershed Prioritization0.120.120.120.140.200.201.002.0%7
Publisher’s Note: MDPI stays neutral with regard to jurisdictional claims in published maps and institutional affiliations.

